1 Changes In Income A rise in income - with no change in price - leads to a new quantity demanded...
12
1 Changes In Income • A rise in income - with no change in price - leads to a new quantity demanded for each good – Normal good • quantity demanded increases – Inferior good • quantity demanded decreases – Depends on the individual’s preferences
-
Upload
jasper-carson -
Category
Documents
-
view
218 -
download
1
Transcript of 1 Changes In Income A rise in income - with no change in price - leads to a new quantity demanded...

1
Changes In Income
• A rise in income - with no change in price - leads to a new quantity demanded for each good– Normal good
• quantity demanded increases
– Inferior good• quantity demanded decreases
– Depends on the individual’s preferences
2
Changes In Income
• Initial Income= $150; • New Income = $300 per month• Pconcert=$30; Pmovie=$10
• Figure 5 Effects of an Increase in Income

3
Changes In Income
1. When Max's income rises to $300, his budget line shifts outward.
H'
H''
H
30
27
15
12
9
6
3
1 2 3 4 5 6 7 8 9 10 Number of Concerts per Month
Number of Movies per
Month
2. If his preferences are as given in the table, he'll choose point H
3.But different marginal utility numbers could lead him to H' or H''
AB
C
DE
F
• Figure 5 Effects of an Increase in Income

4
Changes In Price
• Rotates the budget line rightward• The consumer will select the
combination of movies and concerts– On his budget line
– Makes him as well off as possible
– Marginal utility per dollar spent on both goods is the same

5
Changes In Price
• Income = $150 per month• Initial: Pconcert=$30; Pmovie=$10; • Change: Pconcert=$10; Pmovie=$10
• Figure 6 Deriving the Demand Curve

6
Deriving the Demand Curve
JD
D
JK
2. If the price falls to $10, Max's budget line rotates rightward, and he chooses point J.
3. And if the price drops to $5, he chooses point K.Price per
Concert$30
105
3 7 10 Number of Concerts per Month
15
6
3 5 15 300
108
7 10
Number of Movies per
Month K
4. The demand curve shows the quantity Max chooses at each price.
1. When the price of concerts is $30, point D is best for Max.
• Figure 6 Deriving the Demand Curve
7
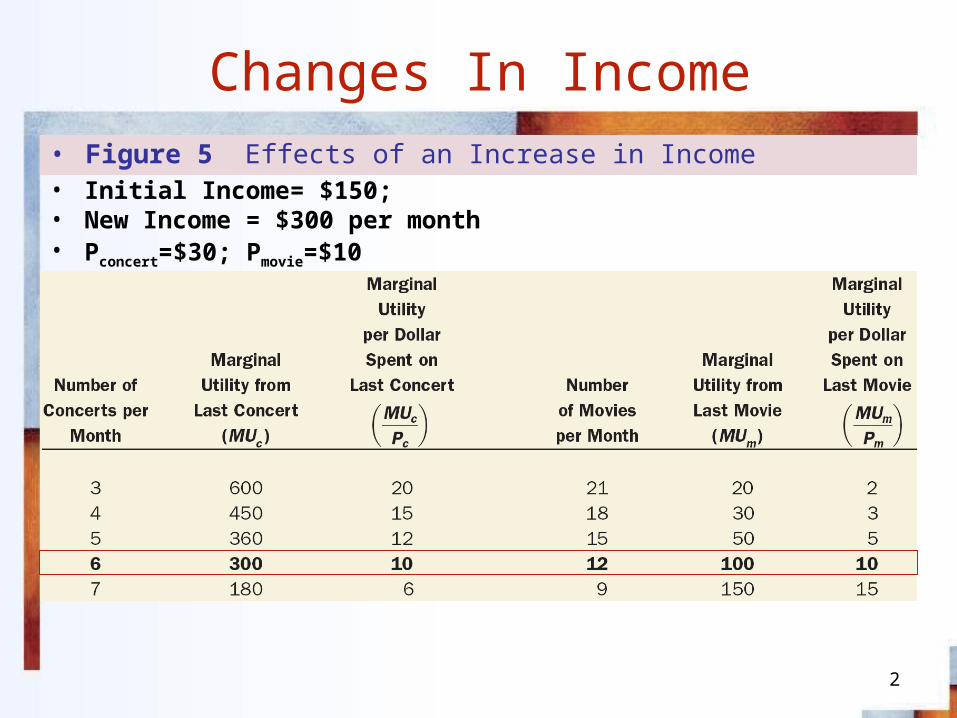
The Substitution Effect
• As the price of a good falls, the consumer substitutes that good in place of other goods whose prices have not changed.– Change in the relative price
– Price decreases - increase quantity demanded
– Price increases - decrease quantity demanded

8
The Income Effect
• As the price decreases - increase purchasing power– Normal goods - increase quantity
demanded
– Inferior goods - decrease quantity demanded
• Price increases - decrease purchasing power

9
Combining Substitution and Income Effect
• Normal Goods– Substitution and income effects work
together
– Must always obey the law of demand
• Inferior Goods– Substitution and income effects work
against each other
– The substitution effect dominates
– Virtually always obey law of demand

10
Income and Substitution Effects
Price Decrease:
P
Purchasing Power
QD
QD
QD
if normalif inferior
Substitution EffectUltimate Effect(Almost Always)
QD
Price Increase:
P QD
QD
QD
if normal
if inferior
Substitution Effect
QDPurchasing
Power
• Figure 7 Income and Substitution Effects

11
Consumers in Markets
Number of Bottles per Week
C
4 12
JerryPrice
$4
0
3
2
1
C'
GeorgePrice
0 6 12
$4
3
2
1
C''
ElainePrice
0 10 20
$4
3
2
1
+ + =
• Figure 8 From Individual to Market Demand

12
Deriving the Market Demand Curve
A
C
B
D
E
Market Demand Curve- obtained by adding up the total quantity demanded by all market participants at different prices
Price
$4
3
2
1
3 10 27 44
Number of Bottles per Week
• Figure 8 From Individual to Market Demand