1 Ch1 Introduction F2014
7
Stat 305, Fall 2014 Name Chapter 1: Introduction to Engineering Statistics What is statistics? • “Statistics is the scientific application of mathematical principles to the collection, analysis, and presentation of data . . . at the foundation of all of statistics is data.” • “Engineers and scientists are constantly exposed to data that they are expected to make sense of and statistics is a tool that, if used properly, allows us to gain knowledge about how physical systems work.” • Statistics vs. Mathematics: – In mathematics there is usually a set equation and solution for problems. – Statistics involves much more uncertainty. Although we still base our work on equations, when dealing with small sets of data we are never 100% certain of the “answer”. • Engineering statistics is the study of how best to . . . • What is “Data”? – Collection of facts – e.g. measurements, traits, outcomes – Start by collecting data (Ch. 2) Basic Terminology Observational Study: • Investigators role is • A process or phenomenon is watched and data are recorded, but there is no interven- tion on the part of the person conducting the study • Examples: – survey studies, economic studies, many social science studies, sports statistics – A researcher keeps track of how many cars drive on a certain stretch of road over a one-hr period to study why so many accidents occur there 1
description
Engineering Statistics chapter 1
Transcript of 1 Ch1 Introduction F2014

Stat 305, Fall 2014 Name
Chapter 1: Introduction to Engineering Statistics
What is statistics?
• “Statistics is the scientific application of mathematical principles to the collection,analysis, and presentation of data . . . at the foundation of all of statistics is data.”
• “Engineers and scientists are constantly exposed to data that they are expected tomake sense of and statistics is a tool that, if used properly, allows us to gain knowledgeabout how physical systems work.”
• Statistics vs. Mathematics:
– In mathematics there is usually a set equation and solution for problems.
– Statistics involves much more uncertainty. Although we still base our work onequations, when dealing with small sets of data we are never 100% certain of the“answer”.
• Engineering statistics is the study of how best to . . .
• What is “Data”?
– Collection of facts
– e.g. measurements, traits, outcomes
– Start by collecting data (Ch. 2)
Basic Terminology
Observational Study:
• Investigators role is
• A process or phenomenon is watched and data are recorded, but there is no interven-tion on the part of the person conducting the study
• Examples:
– survey studies, economic studies, many social science studies, sports statistics
– A researcher keeps track of how many cars drive on a certain stretch of road overa one-hr period to study why so many accidents occur there
1

Experimental Study (a.k.a. an experiment):
• Investigators role is
• Process variables are manipulated by the investigator, and the study environment isregulated
• Examples:
– Chemistry and physics experiments
– A researcher tests the fracture strength of bricks by subjecting them to differenttemperatures and measuring the fracture point
• Experimental studies are more common with engineering data
• Easier and safer to infer causality from an experiment
• In experimental studies researcher can control other variables that may affect theoutcome, but are not of interest (often called Lurking variables)
Example: A researcher realizes that occasionally he gets bad results in an electroplatingoperator. He knows that there are certain factors (temperature, voltage, current, raw ma-terial lot, etc.) that vary in the experiment that could be affecting the results and wants toknow if he can determine what combination of these factors, if any, causes the problem.
Approach 1: Wait for a bad result and then try to see what combinations of factors wereinvolved and look for patterns.
Approach 2: Systematically vary patterns of combinations of factors and see what happens.
Population
• The entire group of objects about which one wishes to gather information in a statis-tical study.
• e.g.
Sample
• Group of objects of which one actually gathers data.
• e.g.
Example: Of interest is the overall satisfaction of ISU students with the bus system. Itmay be costly or impossible to survey all 33,241 students at ISU, so instead, a group of 100students is randomly chosen to participate in the study.
2

Sample Size
• Number of object, people, etc. in the sample.
• In a perfect world we would always have access to the entire population of data, thatis almost never the case.
• Census: a study using the entire population
• There is always uncertainty involved in statistics. We make “guesses” about the entirepopulation based on only a sample.
• The larger the sample, the better the guess (Usually due to constraints such as money,time, etc. we cannot have as large a sample as we would like).
Enumerative Study
• A study (experiment) for which there is a particular, well-defined, finite group ofobjects under study.
• Data are collected on some or all of these objects, and conclusions are intended toapply only to these objects.
• e.g. Gas mileage of all 2015 Ford Taurus automobiles; Strength of 200 2” x 4” boardsto be used to build a specific house.
Analytical Study
• A study (experiment) in which a process or phenomenon is investigated at one point inspace and time with the hope that the data collected will be representative of systembehavior at other places and times under similar conditions.
• There is rarely, if ever, a particular well-defined group of objects to which conclusionsare thought to be limited.
• Most engineering studies are of this type.
• e.g. Gas mileage of all Ford “mid-size” vehicles; Smoothness of all 2” x 4” boards cutby the primary supplier of Lowes’.
Categorical Data
• Non-numerial characteristics associated with items in a sample.
• Must be aggregated and counted to produce numerical values.
• e.g. Eye color (blue, brown, green, etc); Engine status (working, not working &fixable, not working & not fixable)
• Can’t “average” eye color.
Quantitative Data (numerical)
• Numerical characteristics associated with items in a sample.
• Typically counts of occurrences of a phenomenon of interest or measurements of somephysical property.
3

• Can be further broken down into discrete (countable) and continuous (uncountable)
– Discrete can be enumerated into a set {. . . ,-1, 0, 1,. . . }– Continuous must be labeled as an interval (-1, 1); [-1,1); [-1,1]
Examples:
1. # of heads in 10 flips of a coin.
2. Distance a car travels until needing service
3. Diameter of a bolt machined by employee A
4. Total number of bolts machined by employee A that did not meet tolerance specifi-cations
Univariate Data
• Arise when only a single characteristic of each sample is observed.
• e.g. measure height of students in stat 305.
Multivariate Data
• Arise when observations are made on more than one characteristic of each sampleditem.
• e.g. measure height, weight and observe eye color of students in stat 305.
• When 2 characteristics are measured we call it Bivariate Data.
• e.g. measure height and weight of students in stat 305.
Paired
• Bivariate data where both variables are attempting to quantify the “same thing”
• e.g. Before and After studies: Metal specimen hardness before and after treating;Pharmaceutical study on a new drug (pain level with/without drug)
• Measurements of the same quantity made with different instruments/systems
• Measure the weight of students in stat 305 using 2 different scales
4

Types of Data Structures
Statistical engineering studies are often conducted to compare process performance at dif-ferent sets of conditions (new vs. standard). Several samples are involved to include severalcombinations of conditions. For organizational purposes, standard notions of structure havebeen adopted. (Complete factorial study, Fractional factorial study, Hierarchical studies)
Vocab:
• Factor: process variables
• Level: settings of each variable; levels of the factor
• Brick Example:
– Factors: Temperature, Humidity
– Levels: Temperature - high, low; Humidity - high, low
Complete Factorial Study
• All combinations of all levels of all factors of interest are represented in a data set.
• Example: In an experiment to investigate the compressive strength properties ofcement-soil mixtures, two different aging periods were used in combination with twodifferent aging temps and two different soils.
• If A has “a” levels, B has “b” levels, etc., then we talk about a full a x b (etc) factorial
• Example: A with 2 levels, B with 3 levels; 2x3 = 6 combinations
5
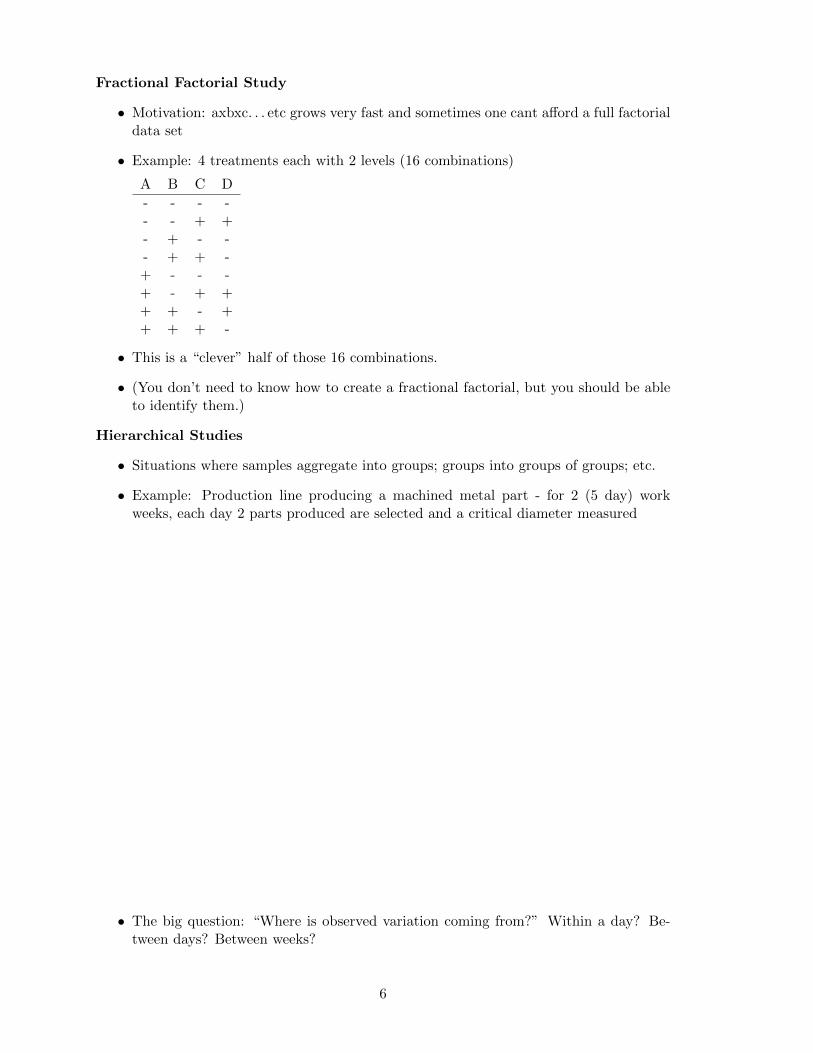
Fractional Factorial Study
• Motivation: axbxc. . . etc grows very fast and sometimes one cant afford a full factorialdata set
• Example: 4 treatments each with 2 levels (16 combinations)
A B C D
- - - -- - + +- + - -- + + -+ - - -+ - + ++ + - ++ + + -
• This is a “clever” half of those 16 combinations.
• (You don’t need to know how to create a fractional factorial, but you should be ableto identify them.)
Hierarchical Studies
• Situations where samples aggregate into groups; groups into groups of groups; etc.
• Example: Production line producing a machined metal part - for 2 (5 day) workweeks, each day 2 parts produced are selected and a critical diameter measured
• The big question: “Where is observed variation coming from?” Within a day? Be-tween days? Between weeks?
6

Measurement
Validity: Faithfully representing the aspect of interest; i.e. usefully or appropriately rep-resents the feature of an object or system.Precision: Small variation in repeat measurements.Accuracy (unbiasedness): Producing the “true value” “on average”
These three issues must be addressed in this order.
1. Validity must be addressed based on the set up on the study. The objects being testedshould be representative of the population that results will be applied to.
2. Calibration: an activity aimed at improving measurement accuracy. If I have a stan-dard item and my system measures 2 units high on it, I might calibrate by subtracting2 units from whatever the instrument reads.
3. Averages: a device used to improve precision of a measurement system; hoping topartially cancel errors of measurement.
7