1 CERT Presentation –May 31-05 v7 The Evolution of Natural G as and Power Markets May 31 st 2005...
18
1 CERT Presentation –May 31-05 v7 The Evolution of Natural Gas and Power Markets May 31 st 2005 CERT –The Energy Roundtable
-
Upload
gervase-allan-whitehead -
Category
Documents
-
view
215 -
download
1
Transcript of 1 CERT Presentation –May 31-05 v7 The Evolution of Natural G as and Power Markets May 31 st 2005...

1CERT Presentation –May 31-05 v7
The Evolution of Natural Gas and Power Markets
May 31st 2005
CERT –The Energy Roundtable

2CERT Presentation –May 31-05 v7
Disclaimer
Forward-looking Statements
Certain statements in this presentation constitute forward-looking statements and are not historical facts but are based on certain assumptions and reflect current expectations regarding future results or events. Those statements are subject to risks and uncertainties that could cause actual results or events to differ materially.

3CERT Presentation –May 31-05 v7
Introduction to NGX
• Provides electronic trading and clearing services to North American energy market participants
• Owned by the TSX group since March 2004
• Headquartered in Calgary, Alberta, Canada with about 30 employees
• Began trading and clearing operations in Feb. 1994 by lisitng AECO gas contracts
• Listed Alberta based power swaps in 2003
• Over 125 trading customers based in Canada and the U.S.
• Trading volumes now exceed 700,000 TJ (663 Bcf or 195 TWh) per month with an underlying value of $C 4.5 billion
Introduction

4CERT Presentation –May 31-05 v7
Introduction to TSX Group
• TSX Group is a cornerstone of the Canadian financial system and is at the centre of Canada’s equity capital market
• TSX Group owns and operates Canada’s two national stock exchanges, the Toronto Stock Exchange, serving the senior equity market, and TSX Venture Exchange, serving the public venture equity market
• From its preeminent domestic base, TSX Group’s reach continues to extend internationally, through TSX Markets and TSX Datalinx which provide the trading and data to the global financial community who access Canada’s equity capital market
Introduction

5CERT Presentation –May 31-05 v7
History of TSX Group
• 1861 – Forerunner to Toronto Stock Exchange launched
• 1977 – TSE Launches the world’s first Computer Assisted Trading System (CATS)
• 1996 - Became the first exchange in North America to introduce decimal trading
• 1997 – Became the largest stock exchange in North America to close it’s trading floor and choose a floorless electronic trading environment
• 1999 – Through realignment, became the sole exchange for trading senior equities in Canada
• 2000 – Demutalized into a “for-profit” exchange
• 2001 – Acquired Canadian Venture Exchange
• 2004 – Acquired NGX
Introduction

6CERT Presentation –May 31-05 v7
Canada’s oil and gas industry in North America
- Canada is the world’s third largest natural gas producer
- Canada is the world’s 9th largest crude oil producer
Industry Overview- 500,000 jobs- C$35 billion capital investment- C$20 billion in payments to federal
and provincial governments.- #1 private sector investor in
Canada
2004CanadianNatural
Gas
Canadian Petroleum
Ranking of importers to U.S. #1 #1
Share of U.S. consumption 15% 10%
Share of U.S. imports 85% 16%
Canada is the largest supplier of energy to the United States
Overview
Source: CAPP

7CERT Presentation –May 31-05 v7
Gas Markets

8CERT Presentation –May 31-05 v7
US & Canadian Natural Gas Demand
1995 2000 2005 2010 2015 2020 2025
Year
0
5
10
15
20
25
30
35
Tri
llio
n C
ub
ic F
eet
Other
US Residential/Commercial
US CogenerationUS Industrial
US Power
Canada
Gas MarketsDemand growth is based on Demand growth is based on increased gas-fired generationincreased gas-fired generation

9CERT Presentation –May 31-05 v7
WCSB: 16.7
ROCKIES: 4.4
ANADARKO: 7.6
CALIFORNIA: 0.8
SAN JUAN: 4.0
PERMIAN: 4.0
GULF (OFFSHORE): 13.8
GULF (ONSHORE): 14.8
APPALACHIANS: 1.5
MIDWEST: 0.8
Scotian Shelf: 0.5
Total Production = 72.4 Bcf / d
MEXICO: 3.5
Major North American Major North American producing supply basinsproducing supply basins
Gas Markets
Source: NEB

10CERT Presentation –May 31-05 v7
North American Natural Gas Demand by Sector, 2002
Residential/Commercial
Industrial
Power
Other
Billion Cubic Feet/Year
1000
500
0
Pacific
Mountain
West SouthCentral
Mexico(2001 Data)
West NorthCentral
East SouthCentral
South Atlantic
Mid-Atlantic
New England
Maritimes
Quebec
Ontario
Manitoba
Saskatchewan
Alberta
BritishColumbia
Alaska
Gas MarketsGas is primarily used for space Gas is primarily used for space heating in most regionsheating in most regions

11CERT Presentation –May 31-05 v7
NORTHWEST PIPELINES
NOVA TRANSCANADA
ALLIANCE PIPELINE
TRANSCANADA PIPELINE
NORTHERN BORDER
NGPL
NORTHERN NATURAL
TRANSCO
COLUMBIA GULF TRANSMISSION
TENNESSEE GAS PIPELINE
GREAT LAKES
EL PASO
PG&E GTN
TRANSWESTERN
Major North American gas pipelines Major North American gas pipelines move gas to the marketsmove gas to the markets
Gas Markets

12CERT Presentation –May 31-05 v7
US & Canadian Gas Supply Forecast
1995 2000 2005 2010 2015 2020 2025
Year
0
5
10
15
20
25
30
35
Tri
llio
n C
ub
ic F
eet
LNG
Alaska
McKenzie DeltaNon-Arctic Canada
Rockies
Gulf of Mexico DeepwaterGulf of Mexico Shelf
Other Lower 48°
Gas MarketsLNG is forecast to make-up LNG is forecast to make-up more of the supplymore of the supply
13CERT Presentation –May 31-05 v7
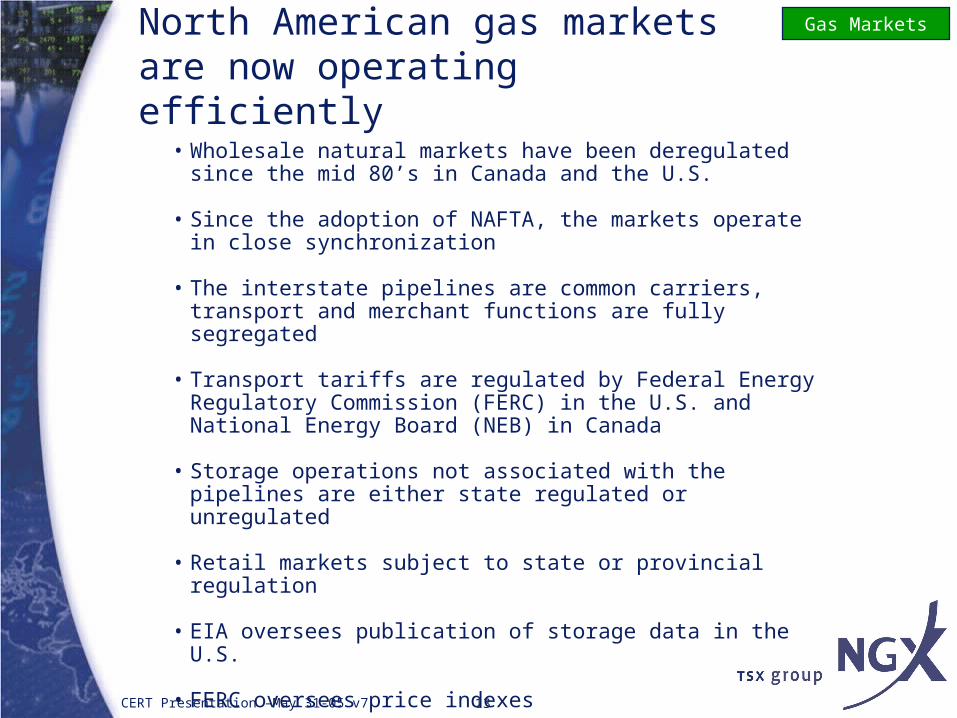
North American gas markets are now operating efficiently
• Wholesale natural markets have been deregulated since the mid 80’s in Canada and the U.S.
• Since the adoption of NAFTA, the markets operate in close synchronization
• The interstate pipelines are common carriers, transport and merchant functions are fully segregated
• Transport tariffs are regulated by Federal Energy Regulatory Commission (FERC) in the U.S. and National Energy Board (NEB) in Canada
• Storage operations not associated with the pipelines are either state regulated or unregulated
• Retail markets subject to state or provincial regulation
• EIA oversees publication of storage data in the U.S.
• FERC oversees price indexes
Gas Markets

14CERT Presentation –May 31-05 v7
Evolution of North American energy exchanges
• Mid to late 80s - Deregulation of wholesale gas markets &implementation of FERC Order 436
• 1990 – NYMEX lists natural gas futures contracts, delivery at Henry Hub
• 1994 – NGX lists AECO physical spot and forward contracts
• 1999 – Enron online launches and then ceases to exist in 2001
• 1999 - ICE launches member owned exchange
• 2000 – NYMEX five power contracts, no liquidity
• 2001 - ICE acquires IPE in London• 2002 - NYMEX provides OTC clearing
services • 2003 - NYMEX re-launches PJM power
futures
Energy Markets
Gas market participants have access to liquid markets with
a wide variety of hedging instruments

15CERT Presentation –May 31-05 v7
Power MarketsFERC is encouraging the development of RTO’s and ISO’s

16CERT Presentation –May 31-05 v7
Impact of growing gas demand
– Gas-fired power plants have reduced the summer demand valley, some shoulder seasonality exists
– Gas is a premium fuel from an environmental perspective
– Overhanging gas surplus is blown down, gas is now a “just in time” commodity
– Gas prices are at a premium hence gas-fired power plants represent high cost supply and used for peaking only in many areas
– Continued decline of conventional supplies will drive frontier, non-conventional and LNG development
– LNG growth in market share could drive convergence with global markets
Energy Markets

17CERT Presentation –May 31-05 v7
Energy Markets
Source: FERC

18CERT Presentation –May 31-05 v7
Questions and Contact Information
Peter Krenkel – [email protected]
Natural Gas Exchange Inc.Suite 2330, 140 4th Avenue SWCalgary, AlbertaCanada T2P 3N3
Phone 403.974.1700Fax 403.974.1719


![CARB Document: ......CERT STD SFTP @ 4000 miles SFTP @ * miles CO [g/mi] com osite CERT STD CO sc03 CERT 0.09 STD 0.14 CERT 1.7 STD 8.0 CERT 0.04 STD 0.20 CERT 2.4 STD 2.7 CERT STD](https://static.fdocuments.in/doc/165x107/601fc6dcad09a45b411bb1e3/carb-document-cert-std-sftp-4000-miles-sftp-miles-co-gmi-com-osite.jpg)