1. Cell-Cycle · PDF fileSI Appendix Contents 1. Cell cycle Synchronization 2. Data quality...
22
SI Appendix Contents 1. Cell cycle Synchronization 2. Data quality 3. The importance of the deconvolution for data analysis 4. Peak heights comparisons. 5. Detailed description of genes expressed in the various cell cycle stages. 6. Rank statistic. 7. Experimental validation of the dysregulation of cycling genes in cancer cells 8. Dysregulated cell cycle genes and cancer transformation. 9. Inter species comparison. 1. Cell-Cycle Synchronization One of the major criticisms of mammalian cell synchronization is that the level of synchronization is limited (1). Our novel computational approach overcomes this problem by deconvolving the measured “noisy” expression data into single cell expression values (2). A feature of this approach is that it allows estimation of the percentage of cells in a given cell cycle stage at a particular time point, which can be independently verified empirically, and thus serves as an internal validation of our computational analyses.
Transcript of 1. Cell-Cycle · PDF fileSI Appendix Contents 1. Cell cycle Synchronization 2. Data quality...
SI Appendix
Contents
1. Cell cycle Synchronization
2. Data quality
3. The importance of the deconvolution for data analysis
4. Peak heights comparisons.
5. Detailed description of genes expressed in the various cell cycle stages.
6. Rank statistic.
7. Experimental validation of the dysregulation of cycling genes in cancer cells
8. Dysregulated cell cycle genes and cancer transformation.
9. Inter species comparison.
1. Cell-Cycle Synchronization
One of the major criticisms of mammalian cell synchronization is that the level of
synchronization is limited (1). Our novel computational approach overcomes this problem by
deconvolving the measured “noisy” expression data into single cell expression values (2). A
feature of this approach is that it allows estimation of the percentage of cells in a given cell cycle
stage at a particular time point, which can be independently verified empirically, and thus serves
as an internal validation of our computational analyses.
Another criticism of whole culture synchronization experiments concerns artifacts due to the
synchronization methods themselves (3). To circumvent this complication, we defined a gene as
cycling only if it was found to be cycling in at least two datasets obtained by distinct
synchronization methods. Importantly, gene expression profiles obtained by using the two
synchronization methods in this study were found to be in good agreement with each other (see
below).
The third major criticism of cell synchronization is that synchronization is generally assessed
according to a single measurement, such as cell size or DNA content (4). In addition to DNA
content, as measured by FACS analysis, we used time lapse cinematography to measure the time
individual cells take to reach mitosis. The good agreement between our FACS and time lapse
data (Fig. 2b) indicates that our synchronization methods indeed reflect multiple cell cycle
features.
2. Data Quality
Specificity and Sensitivity. To determine the specificity of our deconvolution method we
computed the false discovery rate (FDR) using a permutation test. To assess the sensitivity of
this list we used a prior list of known cycling genes. Combining these analyses indicates that our
“common” and “primary FF” lists have a low false positive rate while still capturing a large
fraction of known cell cycle genes.
Specificity. To compute the FDR (5) for our list we used a permutation based test (6). For this
test we have randomized all four time series datasets used in our analysis (two from Whitfield et
al. (7) and the two fibroblast datasets presented in this article). For our sets we have also applied
the deconvolution algorithm to the randomized datasets so that we follow the same preprocessing
steps. Similar to the original datasets the resulting expression profiles were scored by using
Fourier transform (8). Based on these randomization analyses, the FDR was 7% for genes
identified as “primary FF”, 4% for genes identified as ”common” and 2% for genes identified as
“HeLa”.
Sensitivity. To determine the sensitivity of our method we used a list of known cycling genes
compiled by Whitfield et al. 3. This list contains genes identified in prior work (mostly small
scale experiments) as cycling. Of the 45 genes on that list that were present on the array we have
used, 39 (87%) were included in either the ‘common’ or the ‘primary FF’ lists. This result
supports our conclusion that the fibroblast expression data are sensitive enough to detect the vast
majority of cycling human genes.
Agreement Between the Two Expression Datasets. The expression profile was monitored
twice using two synchronization methods (serum starvation and thymidine block). For each
experiment a cyclicity score was calculated and a cell cycle phase was assigned to the genes that
pass a certain threshold.
The correlation coefficient between the normalized cyclicity score of each of the two expression
datasets is 0.4, although the average correlation for random data are 0.08. Thus, the two
expression datasets are in far better agreement when compared to random datasets.
The two experiments also concur regarding the phase assignments - the table below summarizes
the agreement between the phase assignments in the two experiments.
Serum /
Thymidine
M/G1 G1/S G2 G2/M
M/G1 20 27 6 15
G1/S 16 151 12 22
G2 17 18 11 42
G2/M 28 34 9 141
As can be seen, >56% of the genes were assigned to diagonal cells (which represents only 25%
of all cells) indicating a good agreement between the two experiments. For most of nondiagonal
assignments genes were assigned in the second experiment to one of the two close cells (either
the previous or the next cell cycle phase). Due to the nature of the data hard boundaries for phase
assignments are unlikely to be realistic and so assignment to two neighboring phases is a likely
outcome.
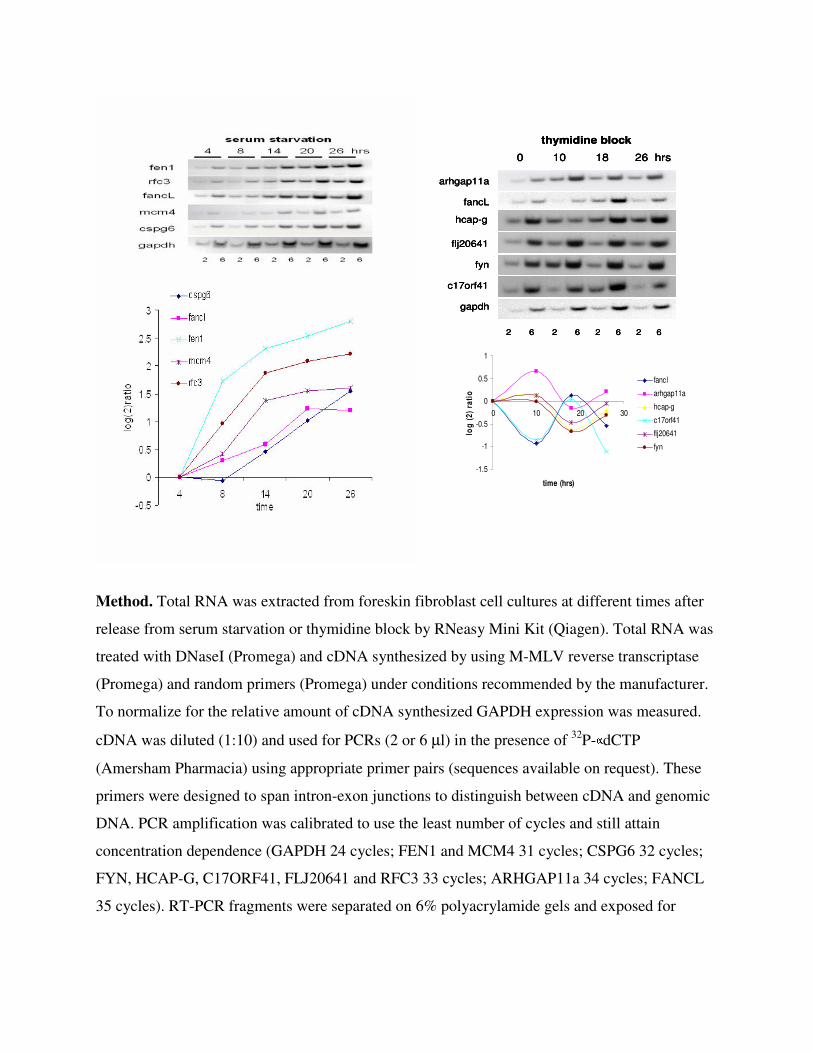
Validation of the Cycling Nature of Few Candidate Genes by RT-PCR. Semiquantitative
PCR was performed on cDNA from foreskin fibroblasts at different points along the cell cycle;
4, 8, 14, 20 and 26 h after release from serum starvation and 0, 10, 18, 26 h after release from
thymidine block. Twenty different genes were validated for cycling expression. Results are
shown for 10 of the genes (6 on cDNA from cells synchronized by thymidine block and 5 on
cDNA from cells synchronized by serum starvation). Although the other genes showed cycling
expression patterns the differences in expression were not large. This is not surprising because
this type of validation does not make any adjustments for the partial synchronization of the
primary foreskin fibroblasts. GAPDH expression was used for normalization. Two amounts of
cDNA (2 or 6 µl) were used for each point to ensure that the PCR was concentration dependent.
The top panel shows the results of these experiments, the bottom panel summarizes the results of
the top panel in a graph. Note that the level of expression was normalized to GAPDH expression
and plotted as log2 ratio of the first time point of each time series.
gapdh
fancL
arhgap11a
thymidine block
0 10 18 26 hrs
2 6 2 6 2 6 2 6
hcap-g
flj20641
fyn
c17orf41
-1.5
-1
-0.5
0
0.5
1
0 10 20 30
time (hrs)
log
(2
) ra
tio
fancl
arhgap11a
hcap-g
c17orf41
flj20641
fyn
gapdh
fancL
arhgap11a
thymidine block
0 10 18 26 hrs
2 6 2 6 2 6 2 6
hcap-g
flj20641
fyn
c17orf41
gapdh
fancL
arhgap11a
thymidine block
0 10 18 26 hrs
2 6 2 6 2 6 2 6
hcap-g
flj20641
fyn
c17orf41
-1.5
-1
-0.5
0
0.5
1
0 10 20 30
time (hrs)
log
(2
) ra
tio
fancl
arhgap11a
hcap-g
c17orf41
flj20641
fyn
Method. Total RNA was extracted from foreskin fibroblast cell cultures at different times after
release from serum starvation or thymidine block by RNeasy Mini Kit (Qiagen). Total RNA was
treated with DNaseI (Promega) and cDNA synthesized by using M-MLV reverse transcriptase
(Promega) and random primers (Promega) under conditions recommended by the manufacturer.
To normalize for the relative amount of cDNA synthesized GAPDH expression was measured.
cDNA was diluted (1:10) and used for PCRs (2 or 6 µl) in the presence of 32
P- dCTP
(Amersham Pharmacia) using appropriate primer pairs (sequences available on request). These
primers were designed to span intron-exon junctions to distinguish between cDNA and genomic
DNA. PCR amplification was calibrated to use the least number of cycles and still attain
concentration dependence (GAPDH 24 cycles; FEN1 and MCM4 31 cycles; CSPG6 32 cycles;
FYN, HCAP-G, C17ORF41, FLJ20641 and RFC3 33 cycles; ARHGAP11a 34 cycles; FANCL
35 cycles). RT-PCR fragments were separated on 6% polyacrylamide gels and exposed for
autoradiography. The level of transcription was judged by phosphor-imager analysis after
normalizing for GAPDH.
3. Importance of the Deconvolution for Data Analysis
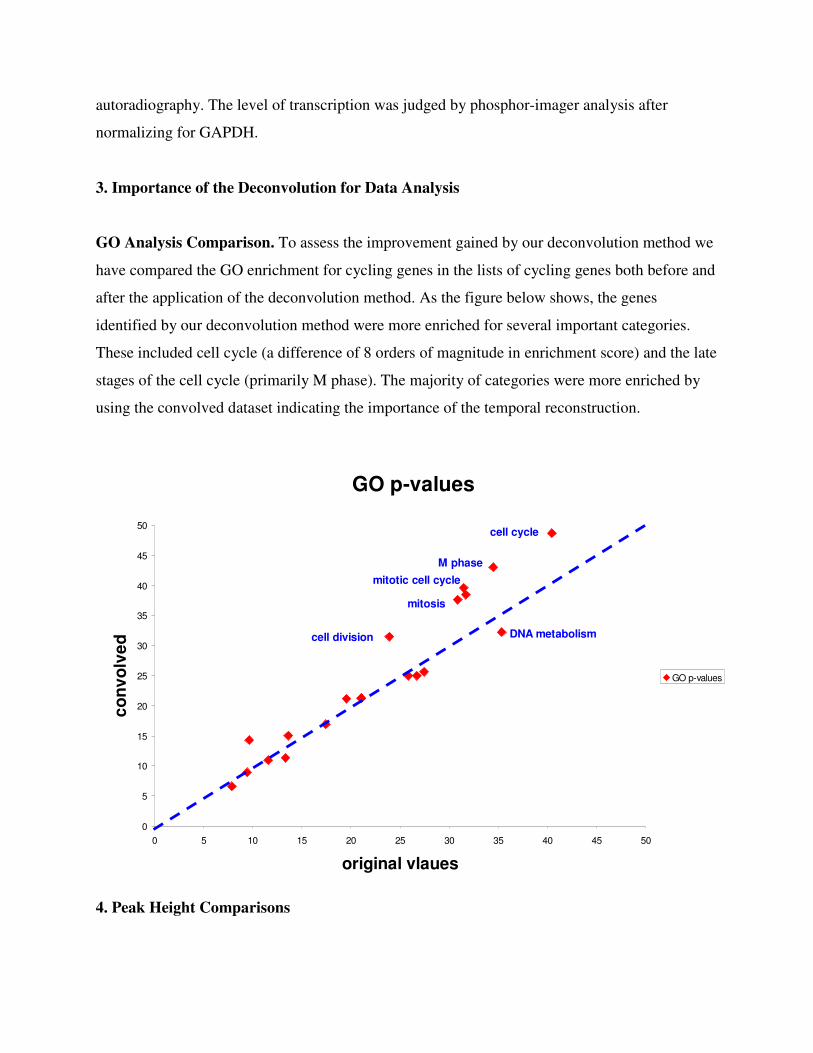
GO Analysis Comparison. To assess the improvement gained by our deconvolution method we
have compared the GO enrichment for cycling genes in the lists of cycling genes both before and
after the application of the deconvolution method. As the figure below shows, the genes
identified by our deconvolution method were more enriched for several important categories.
These included cell cycle (a difference of 8 orders of magnitude in enrichment score) and the late
stages of the cell cycle (primarily M phase). The majority of categories were more enriched by
using the convolved dataset indicating the importance of the temporal reconstruction.
GO p-values
0
5
10
15
20
25
30
35
40
45
50
0 5 10 15 20 25 30 35 40 45 50
original vlaues
co
nv
olv
ed
GO p-values
cell cycle
mitotic cell cycle
cell division
M phase
mitosis
DNA metabolism
4. Peak Height Comparisons
To correct for synchronization loss we applied a deconvolution method using a synchronization
loss model learned from FACS data. This helped us recover cyclic activity at later time points
which is masked by the synchronization loss at these points. For experiments measuring two or
more cycles, if our reconstruction was completely accurate, we would have obtained curves in
which the peak in the second cycle is exactly the same height as the first cycle.
If we over estimated the synchronization loss the second peak would be higher than the first
peak. We examined the deconvolved profiles for the thymidine experiment (the serum starvation
only measures one cycle). Based on this analysis it seems that we have indeed slightly over-
estimated the synchronization loss, but not much. For 36% of the “common” and “primary FF”
genes their peak in the first cycle was higher than their peak in the second. 64% of these genes
had a higher peak in the second cycle. These results indicate a relatively good agreement
between the first and second peaks suggesting that the parameters derived from the FACS data
agree with the expression data. Note that cyclic assignment is more dependent on the shape of
the curve (sinusoid like) than on the actual values or agreement between the peaks. Thus, this
slight bias to higher values in the second cell cycle should not influence the subset of genes
determined to be cycling.
5. Detailed Description of Genes Expressed in the Various Cell-Cycle Stages
Transcriptionaly Regulated Cell-Cycle Processes. In an attempt to map the major cell cycle
processes that are regulated at the transcriptional level we assigned each cell cycle gene to a
single stage (according to its expression profile) and to a single cellular process (according to the
literature) (Table 1).
DNA Replication Initiation. Of the 480 cell cycle genes identified, 175 showed peak expression
in the G1/S phase of the cell cycle. As expected many of the genes that had maximum expression
in G1/S phase of the cell cycle encode for components of complexes known to play a role in
replication initiation in eukaryotic cells. There was highly significant enrichment for genes in the
GO category of DNA initiation in the G1/S expressed genes. This includes subunits of the origin
recognition complex (ORC1L, ORC3L, ORC6L) and a highly conserved multiprotein complex
essential for the initiation of DNA replication (MCM2-7) and a protein associated with the MCM
complex (CDC45L). Note that MCM7 showed peak expression at a different phase of the cell
cycle, as did MCM 10, which is not part of the complex, but has been suggested to be essential
for initiation of DNA replication.
DNA Replication and Repair. Many of the cycling genes encode for proteins involved in DNA
replication and repair. We included these two subcategories together because many proteins play
a role in both processes. Proteins known to be involved in replication were significantly enriched
only in the G1/S category although proteins involved in DNA repair were enriched in both G1/S
and G2/M. Some of the proteins that are involved in the replication machinery that were found to
be cycling are: DNA polymerases (POLD3, POLE, POLE2 in G1/S and POLQ in G2/M);
replication factors (RFC3, RFC4, RPA2 in G1/S and RFC2 in G2/M, RFC5 in M/G1); DNA2L, a
DNA dependent ATPase which unwinds duplex DNA to generate template for replication;
GMNN, a factor which negatively regulates licensing factor and inhibits prereplicative complex
and both subunits of primase which synthesizes small RNA primers for Okazaki fragments
(PRIMA2 in G1/S and PRIM1 in M/G1); RNase HI which is involved in DNA replication and
participates with FEN1 in DNA repair.
DNA repair genes were highly enriched in both G1/S and G2/M. We found many of the cycling
genes to be involved in various DNA repair pathways, including the Fanconi anemia (FA)
pathway (FANCA, FANCG and FANCL; USP, BRIP1, BRCA1, BARD1, PCNA and
MRE11A); the Rad51 family of related genes known to be involved in DNA repair by
homologous recombination (RAD51AP1, RAD51C and RAD51L1); the mismatch repair
pathway (MLH3, MSH2, MSH5, MSH6 and EXO1) and three members of DCLRE1A, B, C
involved in the repair of interstrand cross-links.
Cell-Cycle Regulation. We divided cell cycle regulation into two subcategories; interphase and
mitosis. Genes which encode for proteins involved in cell cycle regulation were significantly
enriched in the G1/S category according to GO annotation and in the G2/M category. Not
surprisingly we found genes in this category that belong to the highly conserved cyclin family
whose members are characterized by a dramatic periodicity in protein abundance through the cell
cycle (CCNE1, CCNE2, CCNA2). In addition we found many related proteins such as catalytic
subunit of cyclin dependent protein kinase complex (CDK2, CDK4) and proteins that bind to the
catalytic subunit of cyclin dependent kinases (CKS1B, CKS2); cyclin dependent kinase
inhibitors (CDKN2C, CDKN2D, CDKN1B), activator (CDC25A) and interacting zinc finger
protein (CIZ1). Three genes which encode members of the E2F family of transcription factors
and one associated transcription factor were found to be cycling (E2F1,E2F8 and TFDP1 in G1/S
and E2F5 in G2/M). The E2F family of transcription factors plays a crucial role in the control of
cell cycle and therefore we included these E2F factors and related protein in the cell cycle
regulation category rather than RNA transcription and processing category. Three genes that
encode either Rb like or Rb binding proteins were also found to be cycling (RBBP8, RBBP6, and
RBL1).
The G2/M phase was also highly enriched for genes encoding proteins involved in regulation of
mitosis. In this category we again found several cyclins (CCNB1, CCNB2 and CCNF) that are
specifically involved in the G2/M transition. The B-type cyclins (CCNB1 and CCNB2) associate
with p34cdc2 (CDC2), which was also found to be cycling, and are essential components of the
cell cycle regulatory machinery. In addition other genes involved in regulation of mitosis were
found in this category; two members of the cdc25 phosphatase family that is required for entry to
mitosis (CDC25B and CDC25C); 2 kinases that inactivate cdc2/Cyclin B kinases and negatively
regulate cell cycle G2/M transition (WEE1 and PKMYT1), 2 M phase phosphoproteins
(MPHOSP1 and MPHOSH9), and a ubiquitin conjugating enzyme required for the destruction of
mitotic cyclins and cell cycle progression (UBE2C).
Microtubule and Spindle Formation. Another GO category that was enriched for in our list of
cycling genes was the category of microtubules and spindle formation. As expected this category
was highly enriched in G2/M phase of the cell cycle. This category includes a large group of
genes of the kinesin like protein family and an uncharacterized gene with a kinesin motor
domain (LOC146909). Members of this protein family are known to be involved in various kinds
of spindle dynamics including chromosome alignment and maintenance, centrosome separation
and establishing bipolar spindle during mitosis (KIF11, KIF14, KIF15, KIF22, KIF23, KIFC1,

KIF2C in G2/M and KIF4A and KIF18A in M/G1). Included in this category were also several
tubulin genes (TUBA1, TUBB, TUBD1) and a tubulin associated protein (TUBGCP3).
Spindle Regulation/Chromosome Condensation and Segregation. Also enriched in our list of
cycling genes with peak expression in G2/M were genes related to the process of spindle
regulation and chromosome condensation and segregation. Genes involved in spindle regulation
most notably included two kinases (BUB1 and BUB1B) involved in spindle checkpoint function
and two aurora kinases (AURKB and STK6) associated with microtubules during chromosome
movement and segregation. The category of chromosome condensation and segregation included
three centromere proteins (CENPA and CENPE in G2/M and CENPF in M/G1), genes involved
in condensation of chromosomes (BRRN1, HCAP-G, SMC421, CNAP1) and genes involved in
the process of sister chromatid cohesion (PTTG1, RAD21, CSPG6) and sister chromatid
separation (ESPL1).
Interestingly we identified many genes that are involved in RNA transcription and processing
that are cycling and have not been previously identified as such. This category was not
statistically enriched in any of the phases of the cell cycle because so many genes fall into this
category. We found in the list of genes with peak expression during G1/S enrichment for genes
encoding proteins in the metabolism category. This enrichment is significant although we were
not able to identify any single metabolic pathway that connects these genes but rather the genes
represented a wide range of metabolic enzymes and processes of the cell.
6. Rank Statistics
The claim about the similarity between the “common” and the “primary FF” sets regarding
normal tissues and their dissimilarity regarding cancer samples is supported by analysis of the
average expression levels of genes in a large variety of datasets (Figs. 4 and 5). To support this
conclusion we performed a different type of analysis in which genes were ranked in each dataset
according to their differential expression in proliferating versus nonproliferating tissues. Thus,
genes highly associated with proliferation will appear early on the ranked list of genes, genes
with similar expression in both tissue types will be in the middle of the ranked list and genes
with higher expression in arrested cells will appear at the end of the ranked list. For each set of
cycling genes, it is then determined whether they appear at the beginning of the ranked list of all
genes, which means they are highly associated with proliferation. This can be plotted as the
cumulative distribution of cycling genes along the ranked list of all genes on the array (SI Fig.
6). A steeply increasing curve indicates strong association with proliferation, whereas a set of
genes that are not associated with these conditions will plot a line close to the diagonal of the
plot. The significance of differences between cumulative distributions can be checked by
permutation.
We investigated four datasets [primary vs. arrested IMR90 fibroblasts (9), proliferating vs.
nonproliferating human endometrium (10), data from different sarcomas compared with normal
human tissues (11), and data from normal human lung tissue and from different types of lung
cancer (12)], for the cumulative distribution of the genes in the three cycling genes categories.
The plots in SI Fig. 6 a and b show nearly identical behavior of the ”common“ and ”primary FF“
sets, which corroborates the findings from the main manuscript with respect to the expression of
these sets in proliferating normal cells. In contrast, differences between the ”common“ and
”primary FF“ set are more pronounced in cancerous tissues (SI Fig. 6 c and d), although these
differences do not reach significance in the sarcoma dataset (see below). This, again, is in
agreement with the findings based on comparing average expression. Only the ”HeLa“ set of
genes does not show a pronounced association with proliferation, neither in normal cells nor in
cancer cells, supporting our suggestion that this set does not contain genuine cell cycle genes.
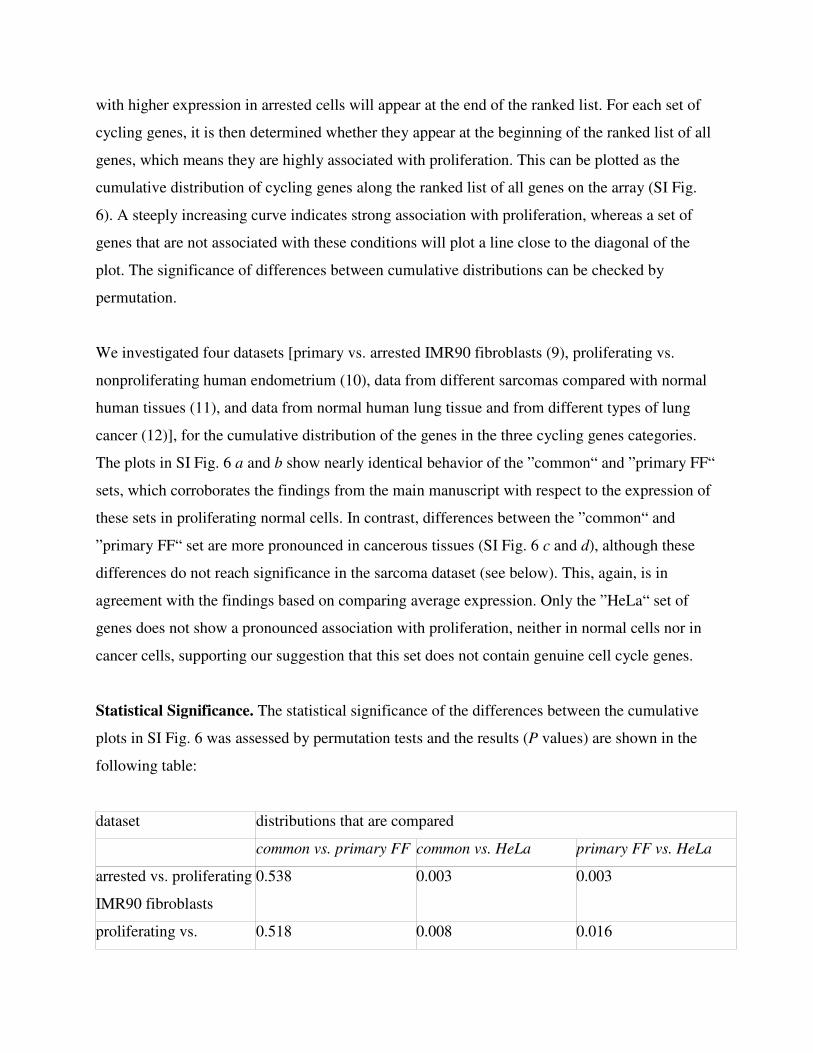
Statistical Significance. The statistical significance of the differences between the cumulative
plots in SI Fig. 6 was assessed by permutation tests and the results (P values) are shown in the
following table:
dataset distributions that are compared
common vs. primary FF common vs. HeLa primary FF vs. HeLa
arrested vs. proliferating
IMR90 fibroblasts
0.538 0.003 0.003
proliferating vs. 0.518 0.008 0.016
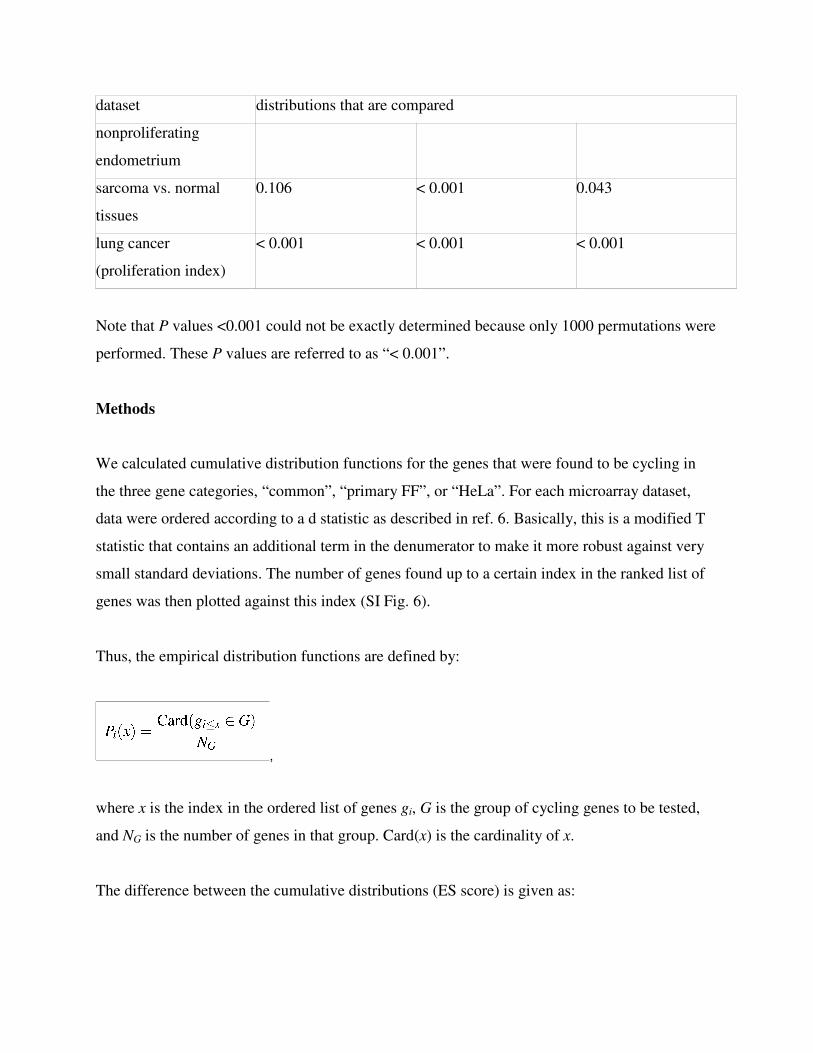
dataset distributions that are compared
nonproliferating
endometrium
sarcoma vs. normal
tissues
0.106 < 0.001 0.043
lung cancer
(proliferation index)
< 0.001 < 0.001 < 0.001
Note that P values <0.001 could not be exactly determined because only 1000 permutations were
performed. These P values are referred to as “< 0.001”.
Methods
We calculated cumulative distribution functions for the genes that were found to be cycling in
the three gene categories, “common”, “primary FF”, or “HeLa”. For each microarray dataset,
data were ordered according to a d statistic as described in ref. 6. Basically, this is a modified T
statistic that contains an additional term in the denumerator to make it more robust against very
small standard deviations. The number of genes found up to a certain index in the ranked list of
genes was then plotted against this index (SI Fig. 6).
Thus, the empirical distribution functions are defined by:
,
where x is the index in the ordered list of genes gi, G is the group of cycling genes to be tested,
and NG is the number of genes in that group. Card(x) is the cardinality of x.
The difference between the cumulative distributions (ES score) is given as:

,
which is similar to the statistic used in the Kolmogorov--Smirnov test for dissimilarity of
distributions. The method was inspired by the ”Gene Set Enrichment Analysis” (13-16).
To analyze whether the observed differences ES in the distribution functions were statistically
significant, the maximum difference between them was tested by permuting class labels in the
original data 1000 times. For each permuted dataset, d statistics were calculated like above, and
genes were ordered according to these statistics. The differences between cumulative distribution
functions Pi were then calculated. The empirical p value was obtained as the fraction of ES
scores obtained from permuted datasets that were equal or greater than the observed ES score for
that particular comparison of gene lists.
For the lung cancer dataset only, a proliferation index was assigned to the different samples: 0
for normal lung tissue, 1 for all lung cancer samples except small cell lung cancer, and 2 for
small cell lung cancer [which are known to posses higher percentage of proliferating cells than
the other lung cancer types (17)]. Significance Analysis of Microarrays was then performed with
a test statistic according to a quantitative response. In this case, the test statistic is given as:
,
where ri is the linear correlation coefficient for gene i over samples j
.
Here, yj refers to the quantitative response of sample j, and xij to the gene expression of gene i in
sample j. The estimated standard deviation si of gene i is given as
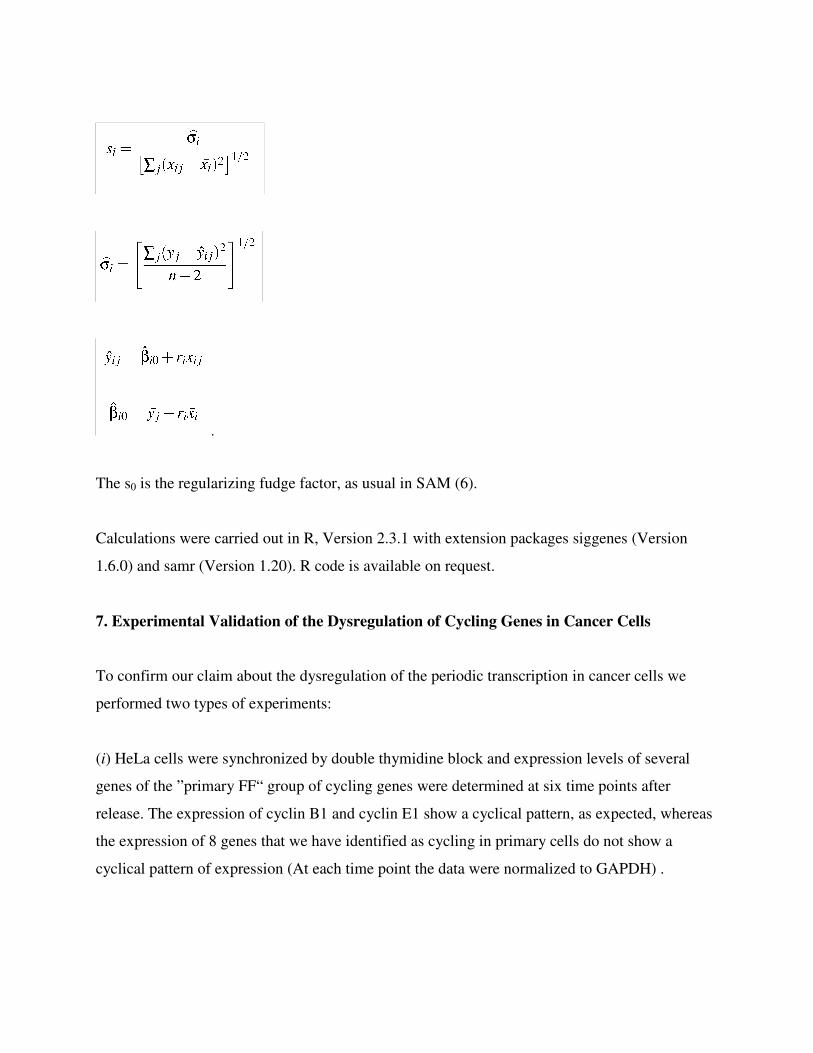
.
The s0 is the regularizing fudge factor, as usual in SAM (6).
Calculations were carried out in R, Version 2.3.1 with extension packages siggenes (Version
1.6.0) and samr (Version 1.20). R code is available on request.
7. Experimental Validation of the Dysregulation of Cycling Genes in Cancer Cells
To confirm our claim about the dysregulation of the periodic transcription in cancer cells we
performed two types of experiments:
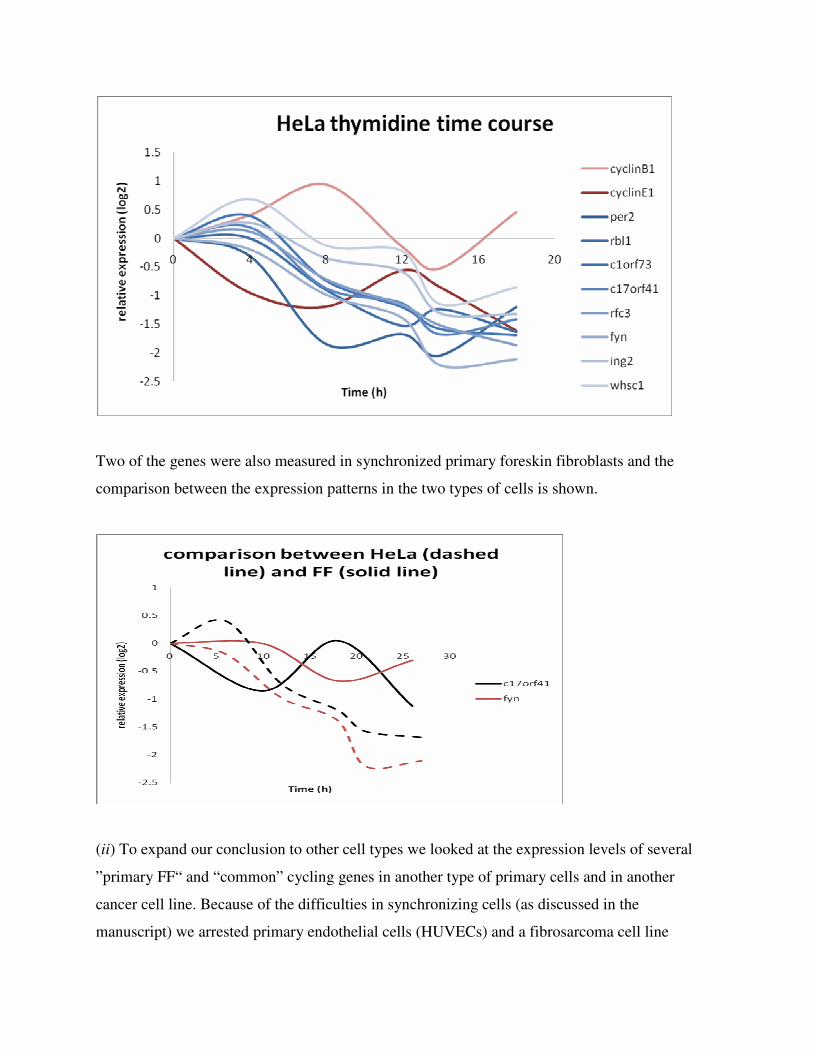
(i) HeLa cells were synchronized by double thymidine block and expression levels of several
genes of the ”primary FF“ group of cycling genes were determined at six time points after
release. The expression of cyclin B1 and cyclin E1 show a cyclical pattern, as expected, whereas
the expression of 8 genes that we have identified as cycling in primary cells do not show a
cyclical pattern of expression (At each time point the data were normalized to GAPDH) .
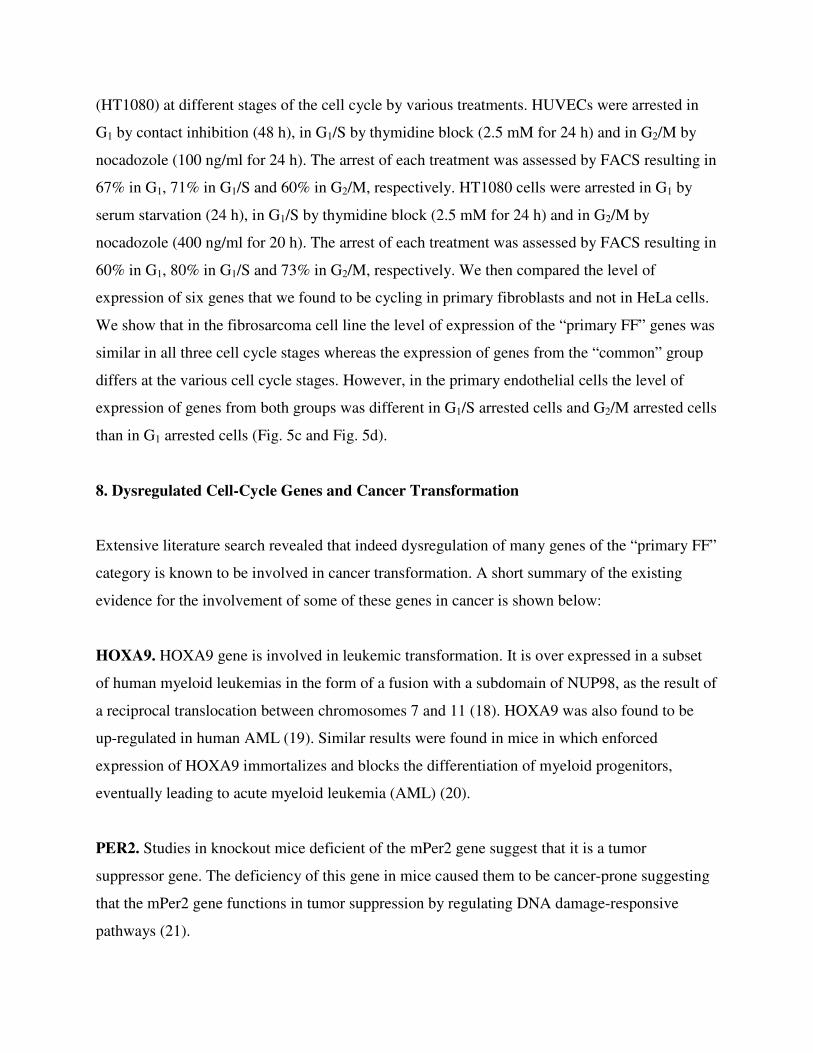
Two of the genes were also measured in synchronized primary foreskin fibroblasts and the
comparison between the expression patterns in the two types of cells is shown.
(ii) To expand our conclusion to other cell types we looked at the expression levels of several
”primary FF“ and “common” cycling genes in another type of primary cells and in another
cancer cell line. Because of the difficulties in synchronizing cells (as discussed in the
manuscript) we arrested primary endothelial cells (HUVECs) and a fibrosarcoma cell line
(HT1080) at different stages of the cell cycle by various treatments. HUVECs were arrested in
G1 by contact inhibition (48 h), in G1/S by thymidine block (2.5 mM for 24 h) and in G2/M by
nocadozole (100 ng/ml for 24 h). The arrest of each treatment was assessed by FACS resulting in
67% in G1, 71% in G1/S and 60% in G2/M, respectively. HT1080 cells were arrested in G1 by
serum starvation (24 h), in G1/S by thymidine block (2.5 mM for 24 h) and in G2/M by
nocadozole (400 ng/ml for 20 h). The arrest of each treatment was assessed by FACS resulting in
60% in G1, 80% in G1/S and 73% in G2/M, respectively. We then compared the level of
expression of six genes that we found to be cycling in primary fibroblasts and not in HeLa cells.
We show that in the fibrosarcoma cell line the level of expression of the “primary FF” genes was
similar in all three cell cycle stages whereas the expression of genes from the “common” group
differs at the various cell cycle stages. However, in the primary endothelial cells the level of
expression of genes from both groups was different in G1/S arrested cells and G2/M arrested cells
than in G1 arrested cells (Fig. 5c and Fig. 5d).
8. Dysregulated Cell-Cycle Genes and Cancer Transformation
Extensive literature search revealed that indeed dysregulation of many genes of the “primary FF”
category is known to be involved in cancer transformation. A short summary of the existing
evidence for the involvement of some of these genes in cancer is shown below:
HOXA9. HOXA9 gene is involved in leukemic transformation. It is over expressed in a subset
of human myeloid leukemias in the form of a fusion with a subdomain of NUP98, as the result of
a reciprocal translocation between chromosomes 7 and 11 (18). HOXA9 was also found to be
up-regulated in human AML (19). Similar results were found in mice in which enforced
expression of HOXA9 immortalizes and blocks the differentiation of myeloid progenitors,
eventually leading to acute myeloid leukemia (AML) (20).
PER2. Studies in knockout mice deficient of the mPer2 gene suggest that it is a tumor
suppressor gene. The deficiency of this gene in mice caused them to be cancer-prone suggesting
that the mPer2 gene functions in tumor suppression by regulating DNA damage-responsive
pathways (21).
ING2. ING2 (INhibitor of Growth 2) is involved in the regulation of cell cycle arrest and of
apoptosis through the regulation of the p53 pathway (22).
WHSC1. WHSC1 is thought to be involved in the progression of multiple myeloma (MM). In
15% of MM patients there is a t(4;14) (p16.3;q32) chromosomal translocation in which the
WHSC1 gene is involved (23, 24). Moreover, it has been recently reported that WHSC1
transcripts are strongly up-regulated in MM patients with the translocation (25). Appreciable
levels of WHSC1 expression in plasma cell leukemias negative for the translocation have also
been shown. These findings suggest that WHSC1 may contribute to the disease progression and
further support its putative role in the neoplastic transformation of tumors with the t(4;14) (26).
RBL1. RBL1 (p107) is a pocket protein sharing with Retinoblastoma (RB) both sequence and
function. The RB gene is deleted in many cancer types and thus it is considered a tumor
suppressor gene. Similarly, the RBL1 gene is deleted in some myeloid leukemia (27). The three
Rb-family members can inhibit cell growth, acting on the cell cycle between G0 and S phases,
primarily through binding and inactivation of transcription factors (28). Over expression of these
proteins cause cell cycle arrest (29), whereas their deletion cause cell transformation (30).
FANCL. FANCL has a crucial role in the Fanconi anemia pathway as the catalytic subunit
required for monoubiquitination of FANCD2. Fanconi anemia is a recessively inherited disease
characterized by congenital defects, bone marrow failure and cancer susceptibility. Fanconi
anemia proteins function in a DNA damage response pathway involving breast cancer
susceptibility gene products, BRCA1 and BRCA2 (31).
MRE11A. MRE11 is known to be involved in DNA double-strand break repair and participates
in exonuclease and endonuclease activities. Eight somatic mutations in seven different colorectal
cancers were found in the MRE11 gene (32).
BLM. BLM is a member of the family of RecQ helicases which maintain genomic stability by
functioning at the interface between DNA replication and DNA repair. Germ-line mutations in
BLM gives rise to a rare autosomal-recessive disorder that is associated with an elevated
incidence of cancer (33).
FYN. FYN is a member of the SRC family tyrosine kinase genes. The biological functions
reported for FYN are diverse, including both stimulatory and inhibitory effects on cellular
differentiation, proliferation and survival. A tumor suppressor role has been suggested for FYN
in neuroblastomas, possibly through induction of differentiation and cell cycle arrest (34).
BTG1. The BTG1 gene locus has been shown to be involved in a t(8;12)(q24;q22) chromosomal
translocation in a case of B-cell chronic lymphocytic leukemia (35).
DLEU2. DLEU2 was mapped to the minimally deleted region in B-CLL patients, with several
patients showing deletion borders within these genes, suggesting that DLEU2 is a tumor
suppressor gene involved in B-CLL leukemogenesis (36).
9. Interspecies Comparison
In a recent article of ours (37) we show that cyclic expression is much better conserved than
previously thought. For that article we used the HeLa expression data. To further explore how
the combined analysis of HeLa and primary cells improves the agreement we have now
computed the overlap between the conserved yeast genes and three lists of human genes: the
original Whitfield et al. HeLa list, the “common” and the “primaryFF” lists. The overlap
between the original Whitfield list and the conserved yeast list is significant (10-12
), the overlap
with the common list presented in this article is much more significant (10-17
). The overlap with
the primaryFF list is not as significant (only 2 of the ∼100 genes on that list have cycling
homologs in yeasts). Thus, the set identified in this article does improve the overlap with other
species indicating that the common set indeed contains genes of the core cell cycle machinery.
1. Cooper S (2002) Bioessays 24:499-501.
2. Bar-Joseph Z, Farkash S, Gifford DK, Simon I, Rosenfeld R (2004) Bioinformatics 20 Suppl
1:I23-I30.
3. Spellman PT, Sherlock G (2004) Trends Biotechnol 22:277-278.
4. Cooper S (2004) Trends Biotechnol 22:274-276.
5. Benjamini Y, Hochberg Y (1995) Journal of the Royal Statistical Society B 57:289-300.
6. Tusher VG, Tibshirani R, Chu G (2001) Proc Natl Acad Sci USA 98:5116-5121.
7. Whitfield ML, Sherlock G, Saldanha AJ, Murray JI, Ball CA, Alexander KE, Matese JC,
Perou CM, Hurt MM, Brown PO, et al. (2002) Mol Biol Cell 13:1977-2000.
8. Spellman PT, Sherlock G, Zhang MQ, Iyer VR, Anders K, Eisen MB, Brown PO, Botstein D,
Futcher B (1998) Mol Biol Cell 9:3273-3297.
9. Collado M, Gil J, Efeyan A, Guerra C, Schuhmacher AJ, Barradas M, Benguria A, Zaballos
A, Flores JM, Barbacid M, et al. (2005) Nature 436:642.
10. Talbi S, Hamilton AE, Vo KC, Tulac S, Overgaard MT, Dosiou C, Le Shay N, Nezhat CN,
Kempson R, Lessey BA, et al. (2006) Endocrinology 147:1097-1121.
11. Detwiller KY, Fernando NT, Segal NH, Ryeom SW, D’Amore PA, Yoon SS (2005) Cancer
Res 65:5881-5889.
12. Bhattacharjee A, Richards WG, Staunton J, Li C, Monti S, Vasa P, Ladd C, Beheshti J,
Bueno R, Gillette M, et al. (2001) Proc Natl Acad Sci USA 98:13790-13795.
13. Mootha VK, Lindgren CM, Eriksson KF, Subramanian A, Sihag S, Lehar J, Puigserver P,
Carlsson E, Ridderstrale M, Laurila E, et al. (2003) Nat Genet 34:267-273.
14. Lamb J, Ramaswamy S, Ford HL, Contreras B, Martinez RV, Kittrell FS, Zahnow CA,
Patterson N, Golub TR, Ewen ME (2003) Cell 114:323-334.
15. Sweet-Cordero A, Mukherjee S, Subramanian A, You H, Roix JJ, Ladd-Acosta C, Mesirov J,
Golub TR, Jacks T (2005) Nat Genet 37:48-55.
16. Subramanian A, Tamayo P, Mootha VK, Mukherjee S, Ebert BL, Gillette MA, Paulovich A,
Pomeroy SL, Golub TR, Lander ES, et al. (2005) Proc Natl Acad Sci USA 102:15545-15550.
17. Soomro IN, Whimster WF (1990) J Pathol 162:217-222.
18. Borrow J, Shearman AM, Stanton VP, Jr., Becher R, Collins T, Williams AJ, Dube I, Katz F,
Kwong YL, Morris C, et al. (1996) Nat Genet 12:159-167.
19. Golub TR, Slonim DK, Tamayo P, Huard C, Gaasenbeek M, Mesirov JP, Coller H, Loh ML,
Downing JR, Caligiuri MA, et al. (1999) Science 286:531-537.
20. Kroon E, Krosl J, Thorsteinsdottir U, Baban S, Buchberg AM, Sauvageau G (1998) EMBO J
17:3714-3725.
21. Fu L, Pelicano H, Liu J, Huang P, Lee C (2002) Cell 111:41-50.
22. Nagashima M, Shiseki M, Miura K, Hagiwara K, Linke SP, Pedeux R, Wang XW, Yokota J,
Riabowol K, Harris CC (2001) Proc Natl Acad Sci USA 98:9671-9676.
23. Chesi M, Nardini E, Brents LA, Schrock E, Ried T, Kuehl WM, Bergsagel PL (1997) Nat
Genet 16:260-264.
24. Richelda R, Ronchetti D, Baldini L, Cro L, Viggiano L, Marzella R, Rocchi M, Otsuki T,
Lombardi L, Maiolo AT, et al. (1997) Blood 90:4062-4070.
25. Mattioli M, Agnelli L, Fabris S, Baldini L, Morabito F, Bicciato S, Verdelli D, Intini D,
Nobili L, Cro L, et al. (2005) Oncogene 24:2461-2473.
26. Todoerti K, Ronchetti D, Agnelli L, Castellani S, Marelli S, Deliliers GL, Zanella A,
Lombardi L, Neri A (2005) Br J Haematol 131:214-218.
27. Ewen ME, Xing YG, Lawrence JB, Livingston DM (1991) Cell 66:1155-1164.
28. Paggi MG, Giordano A (2001) Cancer Res 61:4651-4654.
29. Zhu L, van den Heuvel S, Helin K, Fattaey A, Ewen M, Livingston D, Dyson N, Harlow E
(1993) Genes Dev 7:1111-1125.
30. Robanus-Maandag E, Dekker M, van der Valk M, Carrozza ML, Jeanny JC, Dannenberg JH,
Berns A, te Riele H (1998) Genes Dev 12:1599-1609.
31. Meetei AR, de Winter JP, Medhurst AL, Wallisch M, Waisfisz Q, van de Vrugt HJ, Oostra
AB, Yan Z, Ling C, Bishop CE, et al. (2003) Nat Genet 35:165-170.
32. Wang Z, Cummins JM, Shen D, Cahill DP, Jallepalli PV, Wang TL, Parsons DW, Traverso
G, Awad M, Silliman N, et al. (2004) Cancer Res 64:2998-3001.
33. Hickson ID (2003) Nat Rev Cancer 3:169-178.
34. Berwanger B, Hartmann O, Bergmann E, Bernard S, Nielsen D, Krause M, Kartal A, Flynn
D, Wiedemeyer R, Schwab M, et al. (2002) Cancer Cell 2:377-386.
35. Rouault JP, Rimokh R, Tessa C, Paranhos G, Ffrench M, Duret L, Garoccio M, Germain D,
Samarut J, Magaud JP (1992) EMBO J 11:1663-1670.

36. Liu Y, Corcoran M, Rasool O, Ivanova G, Ibbotson R, Grander D, Iyengar A, Baranova A,
Kashuba V, Merup M, et al. (1997) Oncogene 15:2463-2473.
37. Lu Y, Mahony S, Benos PV, Rosenfeld R, Simon I, Breeden LL, Bar-Joseph Z (2007)
Genome Biol 8:R146.