1 Best Practices for Performance Evaluation and Diagnosis of Java Applications Prashanth K...
42
1 Best Practices for Performance Evaluation and Diagnosis of Java Applications Prashanth K Nageshappa Venkataraghavan Lakshminarayan IBM
-
Upload
lambert-jordan -
Category
Documents
-
view
215 -
download
0
Transcript of 1 Best Practices for Performance Evaluation and Diagnosis of Java Applications Prashanth K...

1
Best Practices for Performance Evaluation and Diagnosis of Java
Applications
Prashanth K NageshappaVenkataraghavan LakshminarayanacharIBM

2
Agenda
• Inside a High Performance Java Virtual Machine (JVM)
• Performance Issues – Diagnosis Techniques
• The Healthcenter

3
Inside a High Performance JVM

4
Debugger Profilers Java Application Code
JVMTI SE5 Classes
SE6 Classes
Harmony Classes
User Natives
GC JIT Class Library Natives
Pluggable VM Interfaces Java Native Interface (JNI)
Core VM (Interpreter, Verifier, Stack Walker)
Trace & Dump Engines
Port Library (Files, Sockets, Memory)
Thread Library
AIX Linux Windows z/OS
PPC-32PPC-64
x86-32x86-64
PPC-32PPC-64
390-31390-64
x86-32x86-64
390-31390-64
Lifting the HoodOverall Architecture
User Code
VM Extensions
Core VM
Portability Layer
Operating systems
= User Code
= Java Platform API
= VM-aware
= Core VM

5
Java: Adaptive Compilation in J9/TR
• Methods start out being interpreted
• After N invocations (or via interpreter sampling) methods get compiled at ‘cold’ or ‘warm’ level
• Low overhead sampling thread is used to identify hot methods
• Methods may get recompiled at ‘hot’ or ‘scorching’ levels (for more optimizations)
• Transition to ‘scorching’ goes through a temporary profiling step
cold
hot
scorching
profiling
interpreter
warm

6
Code Example
public static int total = 55;
public static int dummy(int i, int j, int N, int[] a) {
int k = 0;
for (i = 0; i < N; i++) {
k = k + j + a[i] + (total + foo());
}
return k;
}
public static int foo() {
return 75;
}

7
Optimization and Effects
Opt level Code Size
(bytes)
Compilation Time (us)
Wall clock runtime (ms)
Cold 139 2260 31685
Warm 265 4900 10078
Hot 436 8900 7765
Profiling 1322 9000 n/a
Scorching 578 11,000 6187

8
Garbage Collection - GoalsTidying up…
• Fast allocation path
– Large contributor to overall JVM performance.• Low pause times and concurrent operation
– Fit for purpose – different algorithms with different tradeoffs.
• Hardware exploitation
– Multiple CPUs & varying memory architectures.– Algorithmic and processor parallelism.
• Accurate garbage collection
– Earlier IBM JVMs did a ‘partially conservative’ GC, which was suboptimal .

9
Compressed References
> 32-bit Object (24 bytes – 100%)
clazz flags monitorint
fieldobject field
object field
Clazz Flags Pad Monitor int field Pad object field object field
Clazz Flags Monitorint
fieldobject field
object field
> 64-bit Object (48 bytes – 50%)
> 64-bit Compressed (24 bytes – 100%)
> Use 32-bit values (offsets) to represent object fields With scaling, between 4 GB and 32 GB can be addressed
> To enable the feature : -Xcompressedrefs

10
Threading and Monitors
• Java uses monitors everywhere
– Good – easy to use, safety built-in for many cases!
– Bad – there’s a tax, even when there’s no contention.
• Central to performance in JVMs
– Avoid it?
• Escape analysis (but remember JSR 133!).
– Make it cheaper?
• Tasuki locks
• Lock reservations

11
• Bimodal lock – ‘thin’ or ‘inflated’
• Single atomic operation (on enter)
• A Study of Locking Objects with Bimodal Fields (Tamiya Onodera & Kiyokuni Kawachiya, IBM Research, OOPSLA 1999)
• Lock Reservation: Java Locks Can Mostly Do Without Atomic Operations (Kiyokuni Kawachiya, Akira Koseki, Tamiya Onodera, IBM Research, OOPSLA 2002)
Tasuki locks
0
0
1 Inflated Monitor
Thread ID
0Unowned
Thin owned
Inflated owned

12
Historical PerspectiveIs it just the hardware?
• We’ve come a long, long way…
• Why?– Processors – better control & understanding of the memory hierarchy– Language understanding (idiom recognition)– Processing budget (new instructions, more cores)
SPEC jbb2005: JVM leapfrogging on In tel Xeon
July 05 Jan 06 July 06 Jan 07 Jul 07 Jan 08 July 08 Jan 09
0 .8
1
1 .2
1 .4
1 .6
1 .8
2
2 .2
2 .4
2 .6
J9
JRockit
Hotspot
6sr1
P 27.4
P 27.2
P 26.4
P 27.1
5.0sr5
5.0sr2
5.0GA
P 26.0
R25.2 5.0u5
6u5p
6sr3
6sr5
P 28.0 6u14p
1
2.1

13
SPECjbb Trademarks and Results• SPEC and SPECjbb are registered trademarks of the Standard Performance Evaluation Corporation.• Results referenced are current as of June, 2009. The SPECjbb2005 results are posted at www.spec.org, which contains a complete list of
published SPECjbb2005 results. SPEC, SPECjbb reg tm of Standard Performance Evaluation Corporation.
Data Pt
Leap vs prev
Accum Leap vs base
JVM Hardware Xeon Chips Core(s)
GHz SPECjbb2005 bops
SPECjbb2005 bops/jvm
www math
1 base 1.0 JRockit R25.2 Jun 05 Dell PowerEdge SC1425 DP 2 2 3.6 24,208 24,208 link
2 5% 1.05 J9 5.0GA Oct 05 IBM eServer xSeries 346 dual 2 4 2.8 39,585 39,585 link 1.11 – 1.06 = 1.05
3a 6% 1.11 HotSpot 5u5 Dec 05 FSC PRIMERGY TX300 S2 DP 2 2 3.8 28,314 28,314 link 28314/24208*3.6/3.8=1.11
3b HotSpot 5u5 Dec 05 FSC PRIMERGY RX300 S2 dual 2 4 2.8 41,986 41,986 link 41986/39585=1.06
4 17% 1.3 JRockit P26.0 Mar 06 FSC PRIMERGY TX300 S2 dual 2 4 2.8 49,233 49,233 link 49233/41987=1.17; 1.11*1.17=1.30
5a 7% 1.39 JRockit P26.4 Jun 06 Dell PowerEdge 1850 DP 2 2 3.8 35,503 35,503 link 35503/28314=1.25; 1.25*1.11=1.39
5b JRockit P26.4 Jun 06 FSC PRIMERGY BX620 S3 5160 2 4 3.0 100,407 100,407 link
6 14% 1.59 J9 5.0sr2 July 06 IBM System X 3650 5160 2 4 3.0 114,941 114,941 link 114941/100407=1.14; 1.39*1.14=1.59
7a 14% 1.81 JRockit P27.1 Nov 06 Dell PowerEdge 2950 5160 2 4 3.0 130,589 130,589 link 130589/114941=1.14; 1.59*1.14=1.81
7b JRockit P27.1 Nov 06 Dell PowerEdge 2950 5355 2 8 2.66 210,065 105,033 link
8 4% 1.88 J9 5.0sr5 Feb 07 IBM System X 3650 5355 2 8 2.66 218,032 109,016 link 218.032/210,065=1.04; 1.81*1.04=1.88
9a 1% 1.90 JRockit P27.2 Mar 07 Dell PowerEdge 2950 5355 2 8 2.66 220,648 110,324 link 220648/218032=1.01; 1.88*1.01=1.90
9b JRockit P27.2 Aug 07 Dell PowerEdge 2950 5365 2 8 3.0 238,472 59,618 link
10a 6% 2.01 JRockit P27.4 Nov 07 Dell PowerEdge 2950 5365 2 8 3.0 252,403 63,101 link 252403/238472=1.06;1.90*1.06=2.01
10b JRockit P27.4 Nov 07 Dell PowerEdge 2950 III 5460 2 8 3.16 303,130 75,783 link
11 0.06% 2.01 HotSpot 6u5p Feb 08 Sun fire X4150 5460 2 8 3.16 303,297 75,824 link 303297/303130=1.0006
12a 7% 2.14 J9 6sr1 Mar 08 IBM System X 3650 5460 2 8 3.16 323,172 80,793 link 323172/303297=1.07; 2.01*1.07=2.14
12b J9 6sr1 Sep 08 IBM System x3650 5470 2 8 3.33 330,605 82,651 link
13 4% 2.23 J9 6sr3 Oct 08 IBM System x3650 5470 2 8 3.33 344,436 86,109 link 344436/330605=1.04; 2.14*1.04=2.23
14a 7% 2.38 JRockit P28.0 Mar 09 FSC PRIMERGY RX200 S4 5470 2 8 3.33 368,034 92,009 link 368034/344436=1.07; 2.23*1.07=2.38
14a JRockit P28.0 Mar 09 Cisco UCS B200-M1 5570 2 8 2.93 556,792 278,396 link
15 0.005% 2.38 HotSpot 6u14p Mar 09 Sun Fire X4270 5570 2 8 2.93 556,822 278,411 link 556822/557/792=1.00005
16 9% 2.58 J9 6sr5 Mar 09 IBM BladeCenter HS22 5570 2 8 2.93 604,417 151,104 link 604417/556822=1.09; 2.38*1.09=2.58

14
Performance Issue : Diagnosis Techniques

15
Debugging Performance Problems
• Four layers of deployment:
– Operating System / Infrastructure
– Java Runtime / Garbage Collection
– Application Code
– External Delays
• Simple process is to start at the bottom, and eliminate layers

16
Infrastructure and Java Runtime Issues

17
Application and External Issues

18
MustGather

19
“MustGather” Diagnostics• Set of data requested by IBM Support initial problem diagnosis
– Specified on a per-scenario basis
• Requests only the data relevant to the scenario– Specified on a per-platform basis
• Leverages OS specific tools and capabilities– Split into two parts:
• Setup: to be done before starting the Java application• Gather: to be done when the problem has occurred
• Linked to from product support pages
– Java: http://www.ibm.com/software/webservers/appserv/runtimes/support/
– WAS: http://www.ibm.com/software/webservers/appserv/was/support/

20
System Resource Contention

21
Resource Contention: Physical Memory• Lack of physical memory will cause paging/swapping of
memory
• Swapping is very costly for a Java process
– Particularly affects Garbage Collection performance
• Garbage collection touches every point of memory in the process
• All memory therefore would need to be paged back in
• Leads to long “mark” and “sweep” phases of GC

22
Resource Contention: CPU
• Insufficient CPU time availability will reduce performance
– Normally surfaces when something periodically takes CPU time on the box, eg.
• Cron Jobs running batch applications
• Database backups

23
System Resource Contention: Solutions• Ensure there are enough resources!
• Where resource can contention occurs it is important to ensure the Java application has its pool of resources
• Isolation be achieved on some platforms using LPARs/WPARs/ Zones
• Otherwise move other applications onto separate machines

24
Garbage Collection Performance

25
Garbage Collection Performance
• GC performance issues can take many forms• Definition of a performance problem is very user
centric– User requirement may be for:
• Very short GC “pause” times• Maximum throughput• A balance of both
• First step is ensure that the correct GC policy has been selected for the workload type– Helpful to have an understanding of GC mechanisms
• Second step is to look for specific performance issues

26
Object Allocation• Requires a contiguous area of Java heap
• Driven by requests from:
– The Java application
– JNI code
• Most allocations take place in Thread Local Heaps (TLHs)
– Threads reserve a chunk of free heap to allocate from
• Reduces contention on allocation lock
• Keeps code running in a straight line (fewer failures)
• Meant to be fast
– Available for objects < 512 bytes in size
• Larger allocates take place under a global “heap lock”
– These allocations are one time costs – out of line allocate
– Multiple threads allocating larger objects at the same time will contend

27
Object Reclamation (Garbage Collection)• Occurs under two scenarios:
– An “allocation failure”• An object allocation is requested and not enough contiguous
memory is available
– A programmatically requested garbage collection cycle• call is made to System.GC() or Runtime.GC()• the Distributed Garbage Collector is running• call to JVMPI/TI is made
• Two main technologies used to remove the garbage:– Mark Sweep Collector
– Copy Collector
• IBM uses a mark sweep collector– or a combination for generational

28
Global Collection Policies• Garbage Collection can be broken down into 2 (3) steps
– Mark: Find all live objects in the system
– Sweep: Reclaim unused heap memory to the free list
– Compact: Reduce fragmentation within the free list
• All steps are in a single stop-the-world (STW) phase
– Application “pauses” whilst garbage collection is done
• Each step is performed as a parallel task within itself
• Four GC “Policies”, optimized for different scenarios
– -Xgcpolicy:optthruput optimized for “batch” type applications
– -Xgcpolicy:optavgpauseoptimized for applications with responsiveness criteria
– -Xgcpolicy:gencon optimized for highly transactional workloads
– -Xgcpolicy:subpools optimized for large systems with allocation contention

29
Introduction to GCMV• Garbage Collection and Memory Visualizer
– Verbose GC data visualizer
– Eclipse based tool available as plugin in ISA and as a
standalone tool.
– Parses and plots all verbose GC logs
– Extensible to parse and plot other forms of input
– Provides graphical display of wide range of verbose GC
data values
– Handles optthruput, optavgpause, and gencon GC modes
– Has raw log, tabulated data and graph views and can
save data to jpeg or .csv files (for export to
spreadsheets)

30
GCMV usage scenarios
• Investigate performance problems
– Long periods of pausing or unresponsiveness
• Evaluate your heap size
– Check heap occupancy and adjust heap size if needed
• Garbage collection policy tuning
– Examine GC characteristics, compare different policies
• Look for memory growth
– Heap consumption slowly increasing over time
– Evaluate the general health of an application

31
Application Code Performance

32
The Healthcenter
33
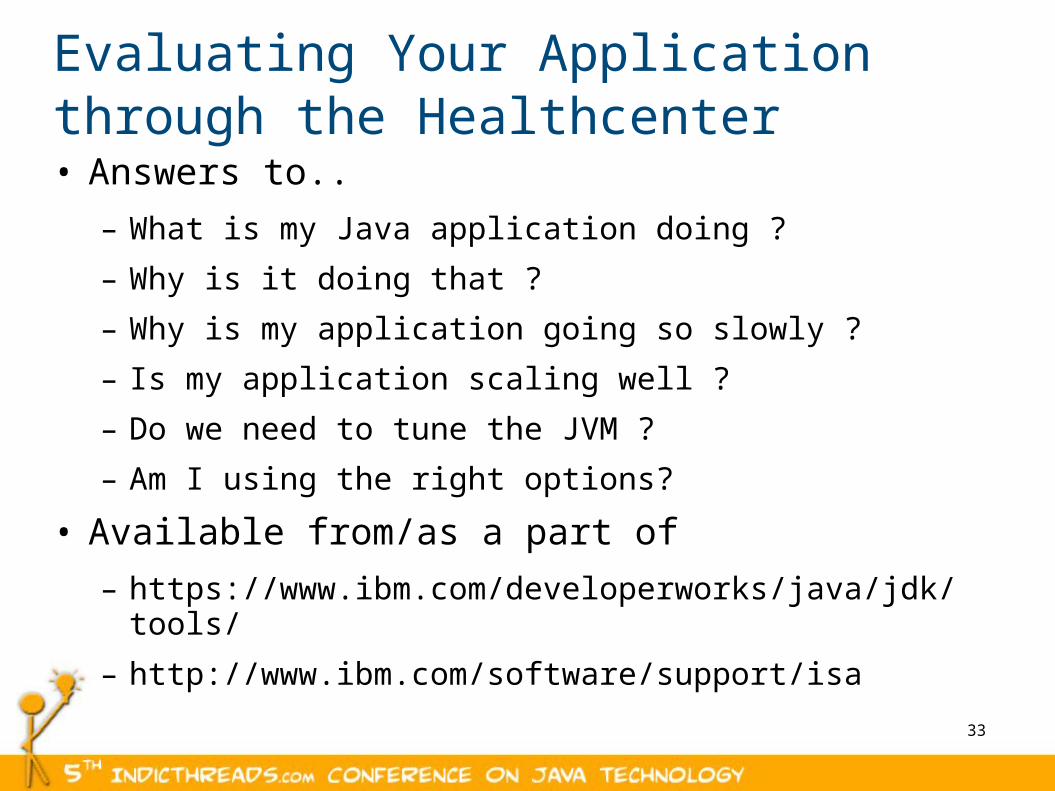
Evaluating Your Application through the Healthcenter• Answers to..
– What is my Java application doing ?
– Why is it doing that ?
– Why is my application going so slowly ?
– Is my application scaling well ?
– Do we need to tune the JVM ?
– Am I using the right options?
• Available from/as a part of
– https://www.ibm.com/developerworks/java/jdk/tools/
– http://www.ibm.com/software/support/isa

34
Health Center Overview

3535
Environment Subsystem• Shows
–Version information for the JVM
–Operating system and architecture information for the monitored system
–Process ID
–All system properties
–All environment variables

3636
–Shows all loaded classes
–Shows classes loaded time
–Visualizes classloading activity
–Identifies shared classes
–Makes recommendations
Classes Subsystem

3737
GC Subsystem
- Shows Used Heap (after collection) & GC pause times
- Identify memory leaks
- Provides tuning recommendations and analysis of GC data

3838
Locking Subsystem
- Always-on lockmonitoring
- All lock usage is profiled such as lock request totals, blocking requests and hold times
- Helps to identify points of contention that prevents the application from scaling

3939
Profiling Subsystem
- Sampling based
profiler
- Instantly identifies hottest methods in an application
- See full call stacks to identify where methods are being called from and what methods they call

40
Features (New)
I/O– Provides File open events
– Provides File close events
– Provides Details of files that are currently open
Native Memory– Provides native memory usage of
the process and system monitored
– Does not provide a native memory perspective view for the z/OS® 31-bit or z/OS 64-bit platforms.

41
Merci
Grazie
Gracias
Obrigado
Danke
Japanese
English
French
Russian
German
Italian
Spanish
Brazilian PortugueseArabic
Traditional Chinese
Simplified Chinese
Hindi
Tamil
Thai
Korean
Teşekkürlerturkish
Thank You

42
Special notices© IBM Corporation 2010. All Rights Reserved.
The workshops, sessions and materials have been prepared by IBM or the session speakers and reflect their own views. They are provided for informational purposes only, and are neither intended to, nor shall have the effect of being, legal or other guidance or advice to any participant. While efforts were made to verify the completeness and accuracy of the information contained in this presentation, it is provided AS IS without warranty of any kind, express or implied. IBM shall not be responsible for any damages arising out of the use of, or otherwise related to, this presentation or any other materials. Nothing contained in this presentation is intended to, nor shall have the effect of, creating any warranties or representations from IBM or its suppliers or licensors, or altering the terms and conditions of the applicable license agreement governing the use of IBM software.
References in this presentation to IBM products, programs, or services do not imply that they will be available in all countries in which IBM operates. Product release dates and/or capabilities referenced in this presentation may change at any time at IBM’s sole discretion based on market opportunities or other factors, and are not intended to be a commitment to future product or feature availability in any way. Nothing contained in these materials is intended to, nor shall have the effect of, stating or implying that any activities undertaken by you will result in any specific sales, revenue growth or other results.
Performance is based on measurements and projections using standard IBM benchmarks in a controlled environment. The actual throughput or performance that any user will experience will vary depending upon many factors, including considerations such as the amount of multiprogramming in the user's job stream, the I/O configuration, the storage configuration, and the workload processed. Therefore, no assurance can be given that an individual user will achieve results similar to those stated here.
All customer examples described are presented as illustrations of how those customers have used IBM products and the results they may have achieved. Actual environmental costs and performance characteristics may vary by customer.
The following are trademarks of the International Business Machines Corporation in the United States and/or other countries: ibm.com/legal/copytrade.shtmlAIX, CICS, CICSPlex, DataPower, DB2, DB2 Universal Database, i5/OS, IBM, the IBM logo, IMS/ESA, Power Systems, Lotus, OMEGAMON,
OS/390, Parallel Sysplex, pureXML, Rational, Redbooks, Sametime, SMART SOA, System z , Tivoli, WebSphere, and z/OS.
A current list of IBM trademarks is available on the Web at “Copyright and trademark information” at ibm.com/legal/copytrade.shtml.
Adobe, the Adobe logo, PostScript, and the PostScript logo are either registered trademarks or trademarks of Adobe Systems Incorporated in the United States, and/or other countries.
IT Infrastructure Library is a registered trademark of the Central Computer and Telecommunications Agency which is now part of the Office of Government CommerceJava and all Java-based trademarks are trademarks of Sun Microsystems, Inc. in the United States, other countries, or both.Microsoft and Windows are trademarks of Microsoft Corporation in the United States, other countries, or both.ITIL is a registered trademark, and a registered community trademark of the Office of Government Commerce, and is registered in the U.S. Patent and Trademark OfficeIntel and Pentium are trademarks or registered trademarks of Intel Corporation or its subsidiaries in the United States and other countries.UNIX is a registered trademark of The Open Group in the United States and other countries.Linux is a registered trademark of Linus Torvalds in the United States, other countries, or both.