1 Berkley Medical Excess Underwriters ERC ® Hospital Professional Liability: A Most Inhospitable...
51
1 Berkley Medical Excess Underwriters ERC ® Hospital Professional Liability: A Most Inhospitable Environment March 12, 2003 Matt Dolan, OneBeacon Insurance Daryl Douglas, GE ERC Sabrina Hart, Zurich North America Robin Maley, Maley Healthcare Strategies Kimberly Willis, Berkley Medical Medical Professional Liability Symposium
-
Upload
hector-ball -
Category
Documents
-
view
214 -
download
0
Transcript of 1 Berkley Medical Excess Underwriters ERC ® Hospital Professional Liability: A Most Inhospitable...
1Berkley Medical Excess Underwriters
ERC ®
Hospital Professional Liability: A Most Inhospitable Environment
March 12, 2003
Matt Dolan, OneBeacon InsuranceDaryl Douglas, GE ERC
Sabrina Hart, Zurich North AmericaRobin Maley, Maley Healthcare Strategies
Kimberly Willis, Berkley Medical
Medical Professional Liability Symposium

2
Agenda
Problem: Rising severity
Impact: Carrier results
Response: Reconsider underwriting architecture and risk management culture

3
Problem
Increasing severity of verdicts/settlements
– National and regional data
Trends driving the larger pay-outs
Strategies to reduce loss costs
ERC ®
4
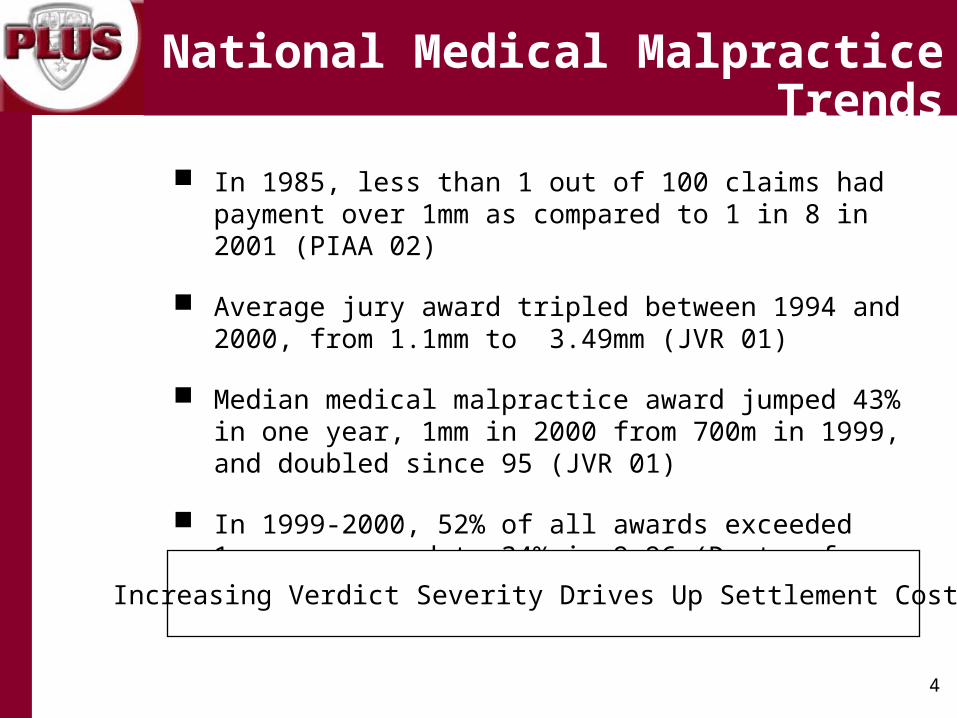
National Medical Malpractice Trends
In 1985, less than 1 out of 100 claims had payment over 1mm as compared to 1 in 8 in 2001 (PIAA 02)
Average jury award tripled between 1994 and 2000, from 1.1mm to 3.49mm (JVR 01)
Median medical malpractice award jumped 43% in one year, 1mm in 2000 from 700m in 1999, and doubled since 95 (JVR 01)
In 1999-2000, 52% of all awards exceeded 1mm as opposed to 34% in 9-96 (Dept. of Health, 7/02)
Increasing Verdict Severity Drives Up Settlement Costs
5
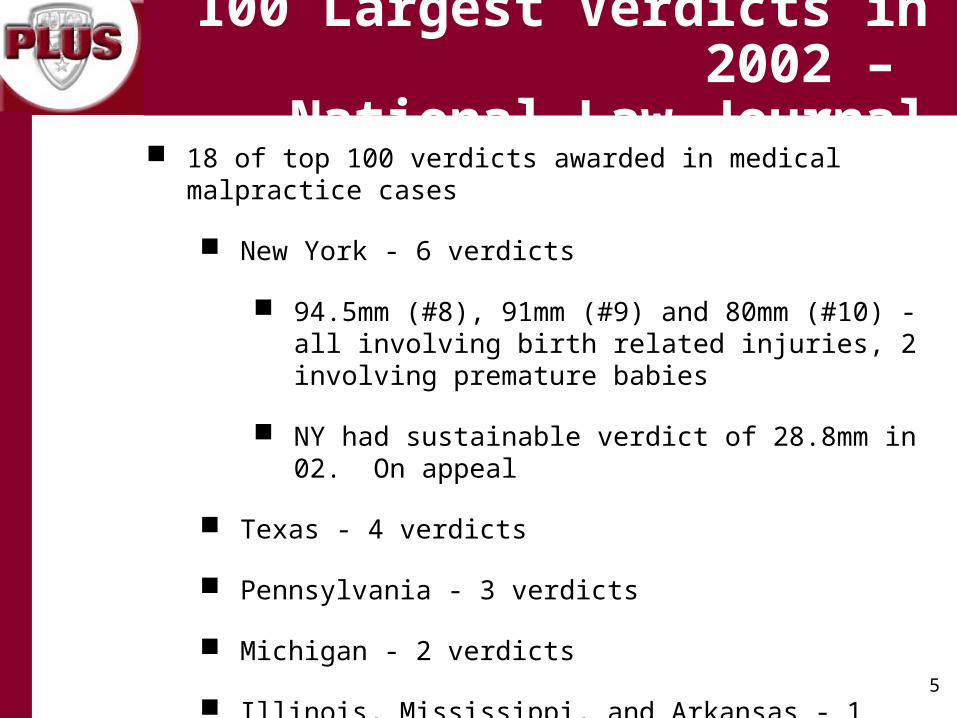
100 Largest Verdicts in 2002 – National Law Journal
18 of top 100 verdicts awarded in medical malpractice cases
New York - 6 verdicts
94.5mm (#8), 91mm (#9) and 80mm (#10) - all involving birth related injuries, 2 involving premature babies
NY had sustainable verdict of 28.8mm in 02. On appeal
Texas - 4 verdicts
Pennsylvania - 3 verdicts
Michigan - 2 verdicts
Illinois, Mississippi, and Arkansas - 1 verdict each

6
Chicago - 2002 Verdicts and Settlements
$30mm verdict - failure to timely deliver resulting in brain injury
$22.3mm verdict - failure to dx spinal cord impingement of 64 y/m resulting in quadriplegia
$22mm verdict - double amputation of cab driver
$20.25mm verdict - fail to dx fetal distress. 19 y/m spastic quad
$19.5mm settlement - death of mom and brain damaged infant
$19mm settlement - asphasia of former bond broker in 30’s
19mm settlement - young woman in vegetative state
18.4mm settlement - fail to dx fetal distress
17.5mm settlement - fail to prevent aneurysm of young female

7
Large Award Drivers - Common Jurisdictional Factors
Effective, aggressive, competitive, powerful and large plaintiffs’ bar
Failed or no tort reform measures
Limited mediation and counter-productive pre-trials
Demographics of the jury pool
History of large verdicts and settlements
Elected judiciary

8
Philadelphia
CAT Fund made record pay-outs in 02, rising to $348,000,000 from $321,600,000 in 01
In 02, 50% of CAT Fund pay-outs went toward Philadelphia cases
37 judgments for more than $1,000,000 in 2001
Other sample verdicts
2003- 24.6mm (failure to perform c/s leading to brain damage of infant)
2001 - 37mm, 25mm, 20.8mm
2000 - 100mm, 59mm, 49.6mm
9
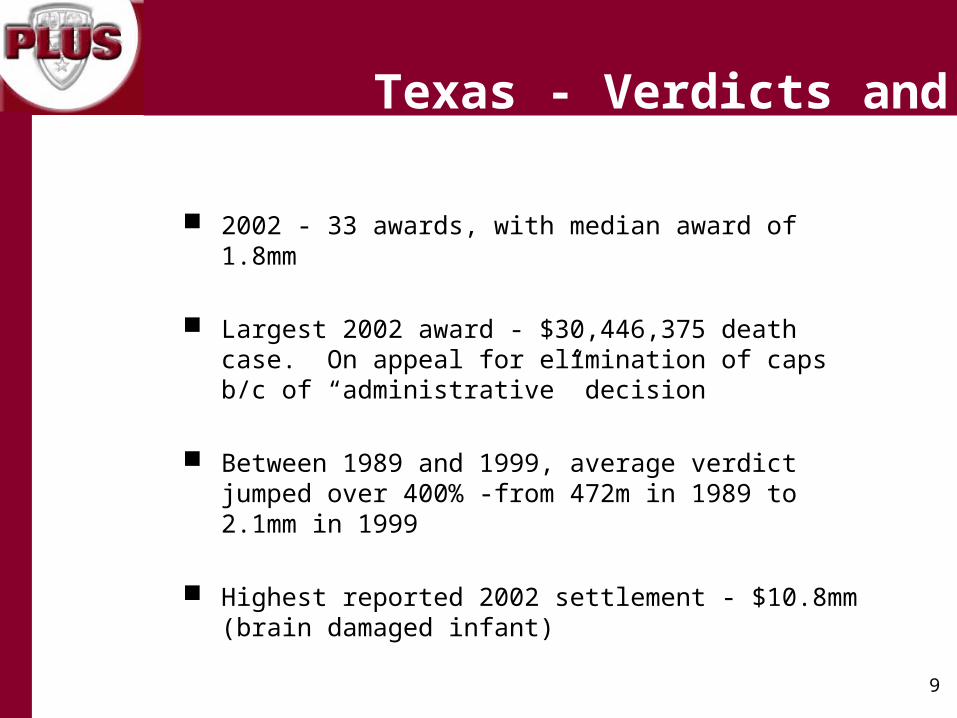
Texas - Verdicts and Settlements
2002 - 33 awards, with median award of 1.8mm
Largest 2002 award - $30,446,375 death case. On appeal for elimination of caps b/c of “administrative” decision
Between 1989 and 1999, average verdict jumped over 400% -from 472m in 1989 to 2.1mm in 1999
Highest reported 2002 settlement - $10.8mm (brain damaged infant)

10
Texas - Verdicts and Settlements
Other large Texas verdicts
$268 million wrongful death verdict in Dallas County in 2000 (settled pre-verdict for app. 2.5mm)
$67.5 million medical malpractice verdict in Dallas in 1999-above the knee amputation of child (settled app. 7mm)
$59 million medical malpractice verdict in Eagle Pass in 2000-impaired newborn (settled app. 30mm)
$40 million medical malpractice verdict in Houston in 2000-negligent credentialing case (reversed on appeal)
$20 million MCO E&O verdict in Corpus ChristiImproper de-selection of provider (settled app. 5mm)

11
Large Award Drivers - Sociological Factors
Monetary desensitization - sport/star salaries; lotteries; publication of large verdicts and medical errors
Emboldened plaintiffs’ lawyers - less willing to settle
Managed care backlash - staff reductions; reduced skill levels of providers; disgruntled health care staff
Jurors are experts and have access to more information
Advances in medicine

12
Large Award Drivers Medical/Legal Factors
Finger-pointing between doctors and hospital staff
Alleged altered records and late entries
Incomplete, inconsistent and outdated policies
used as a sword by plaintiffs
Lack of documentation
Shifting burden of proof: bad result = negligence
Apparent agency - ED, radiology, anesthesiology

13
Survey
Disagree Somewhat
1%Agree
Somewhat20%
Agree Strongly79%
A hospital is responsible for the actions of all medical professionals that practice at the hospital.

14
Survey
No28%
Yes72%
A doctor with privileges at a hospital (a doctor not on staff and not receiving salary from the hospital but able to admit patients and practice at the hospital) makes a mistake in treating a patient.
Is the hospital liable for the doctor’s actions?

15
So What Can We Do?
Support and lobby for tort reform
Focus on improving patient safety and error reduction
Focus on high risk areas - OB, ED
Hire the most respected and experienced trial lawyers
Cannot afford to defend on the cheap

16
Claims and Legal Management of Catastrophic Cases
Spend Money to Save Money - Bob Clifford, Chicago
But (claims specialists) won’t spend the dough. That’s where I’ve got an edge on you. Because my experience is that all these claims people who are watching this thing, they are cheap. They are penny wise and Tom Foolish…. I don’t have a budget on a case….They can … bury me in terms of their financial weight. But not on any one case….. I mean, here, it costs you $10,000 to $20,000 to do a focus group. Most defendants don’t do focus groups. And yet they’ll try the case and get wacked for an extra million bucks. Hello? What am I missing here?

17
So What Can We Do?
Utilize jury consultants
Consider effect of settlement amounts driving future costs
Try the right cases
fine line between overpaying and gambling
Push mediation
Hire an experienced and skilled claims staff

Restoration Phase - Return of the Fundamentals
Phase of cycle expected to last well into 2004 - 2005
Interest Rate >1% lower than last year
Lower Combined Needed for Same ROE
2002 interest rates95 Combined è13.5% ROE
2003 interest rates95 Combined è 12% ROE
Impact: Where Are We?
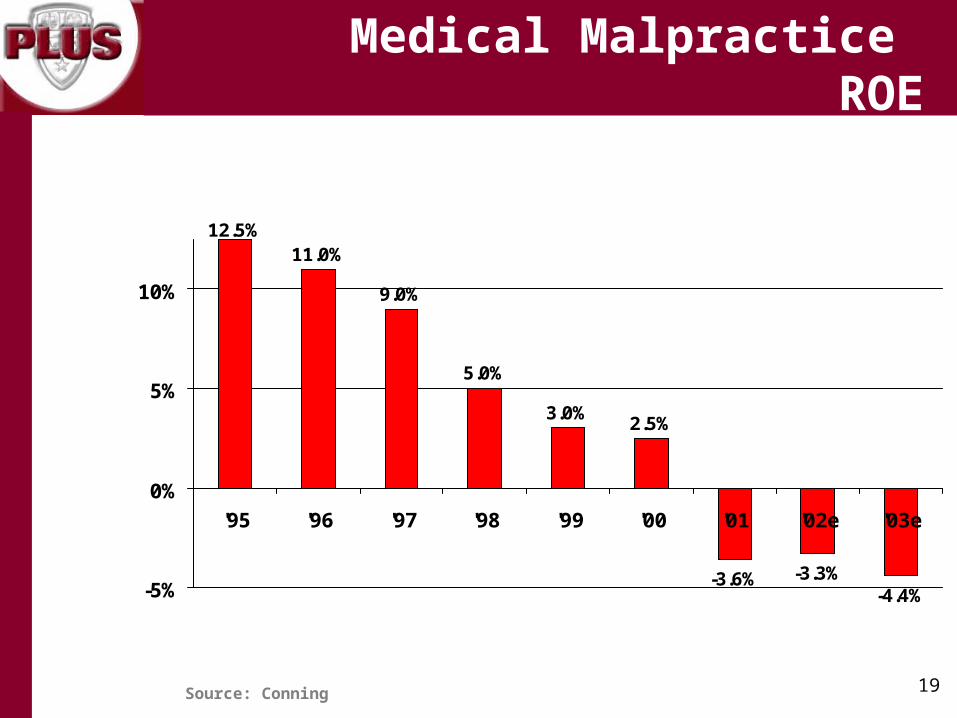
19
12.5%11.0%
9.0%
5.0%
3.0%2.5%
-3.6% -3.3%-4.4%-5%
0%
5%
10%
'95 '96 '97 '98 '99 '00 '01 '02e '03e
Source: Conning
Medical Malpractice ROE
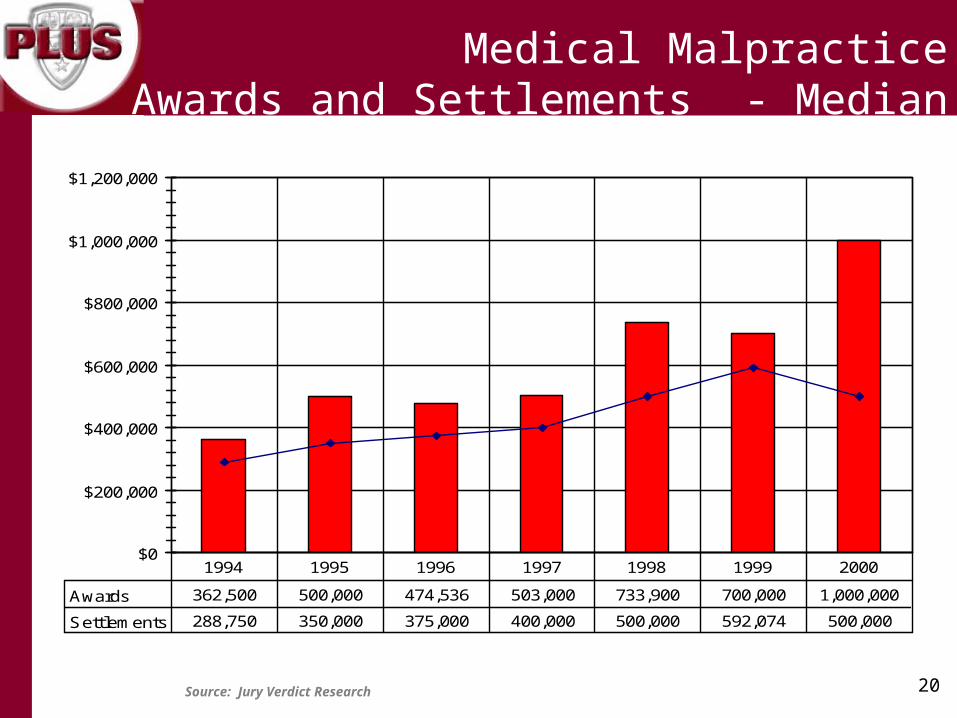
20Source: Jury Verdict Research
$0
$200,000
$400,000
$600,000
$800,000
$1,000,000
$1,200,000
Awards 362,500 500,000 474,536 503,000 733,900 700,000 1,000,000
Settlements 288,750 350,000 375,000 400,000 500,000 592,074 500,000
1994 1995 1996 1997 1998 1999 2000
Medical MalpracticeAwards and Settlements - Median

21Source: Jury Verdict Research
$0
$500,000
$1,000,000
$1,500,000
$2,000,000
$2,500,000
$3,000,000
$3,500,000
$4,000,000
Awards 1,139,862 2,039,037 1,900,870 1,970,872 2,981,796 3,429,019 3,481,876
Settlements 644,201 643,119 755,327 971,466 1,044,002 1,459,290 1,052,785
1994 1995 1996 1997 1998 1999 2000
Medical MalpracticeAwards and Settlements - Mean

Rate - What is Adequate?
$375k in 2000
$635K in 2000 with just 2% inflation
70%
139% 2001E Combined
121% Breakeven, 105% to return desired ROE
34%
Theory 1 Theory 2
$500k in late 80’s
33%
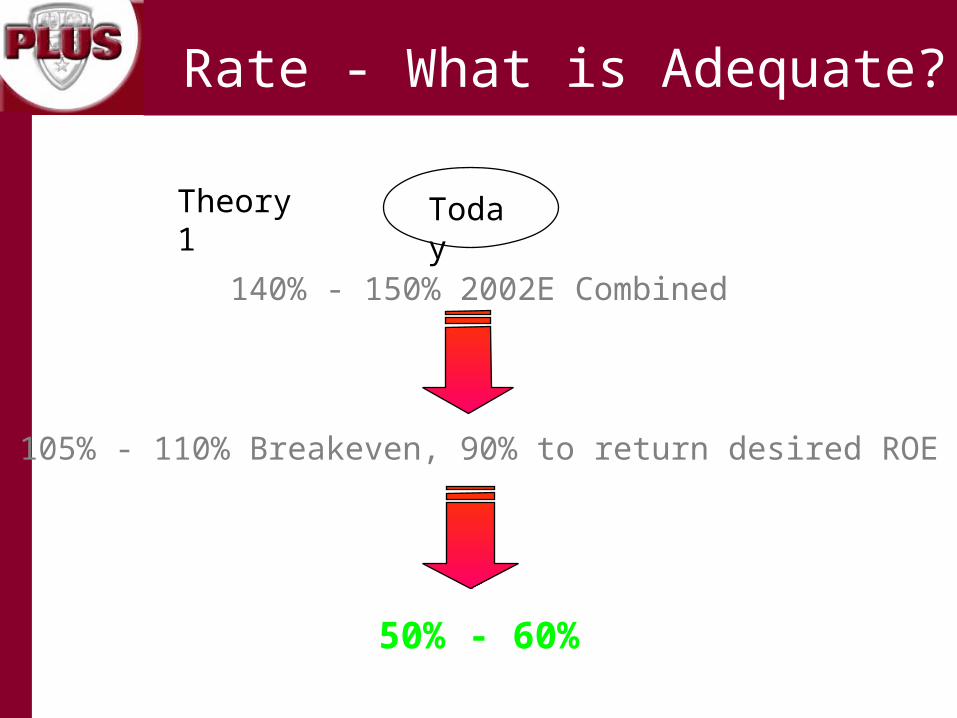
Rate - What is Adequate?
140% - 150% 2002E Combined
105% - 110% Breakeven, 90% to return desired ROE
50% - 60%
Theory 1 Today

Selection, Price, and Terms
• Risk Selection Commitment to holistic risk mgmt Risk Profiling Greater scrutiny of underlying
• Price Continued rate increases to ensure acceptable
ROE What is adequate? Minimum premiums

Selection is Key
Why Underwriting Matters…...
90% 100% 110%
5% of qtes
90% of quotes
5% of qtesAlthough most accts are priced adequately...
…carriers win most when risks are under-priced

Underwriting Matters
Misclassification of exposure units
Evaluation date of loss run > 90 days from eff date
Inadequate reserving
Failure to request/review excess loss runs
Failure to evaluate underlying coverage
Uninsured/under insured physicians
Insufficient attachment point
Inappropriate policy forms
Blanket named insureds
Incorrect retroactive date
Waiver of collateral

Terms
Adequate attachment point
Unaggregated attachment point
Maintenance retentions Reduced capacity Collateral Implied Warranty excl. Auto attachment points
Buffer layers/inner aggregates
ALAE within the limit of liability
Retroactive dates Punitive excl. Mold excl. Terrorism
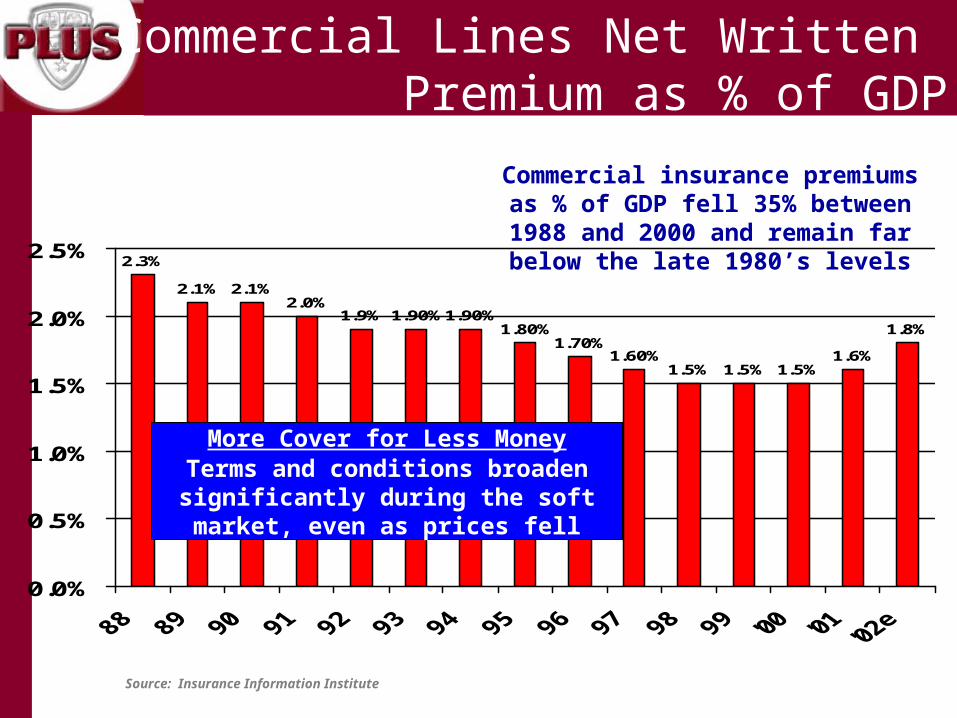
Source: Insurance Information Institute
2.3%
2.1%2.0%
1.9% 1.90%1.90%1.80%
1.70%1.60%
1.5% 1.5% 1.5%1.6%
1.8%
2.1%
0.0%
0.5%
1.0%
1.5%
2.0%
2.5%
Commercial insurance premiums as % of GDP fell 35% between 1988 and 2000 and remain far below the late 1980’s levels
Commercial Lines Net Written Premium as % of GDP
More Cover for Less MoneyTerms and conditions broaden
significantly during the soft market, even as prices fell

A Picture Is Worth A Thousand Words

30
The Price/Placement Framework Reconsidered
Capacity movement along the Price/Quality curve
The need to reconsider ROE expectations
The volatility factor
Trend and its impact on excess limits
The cost of capacity
Response: Underwriting Architecture

31
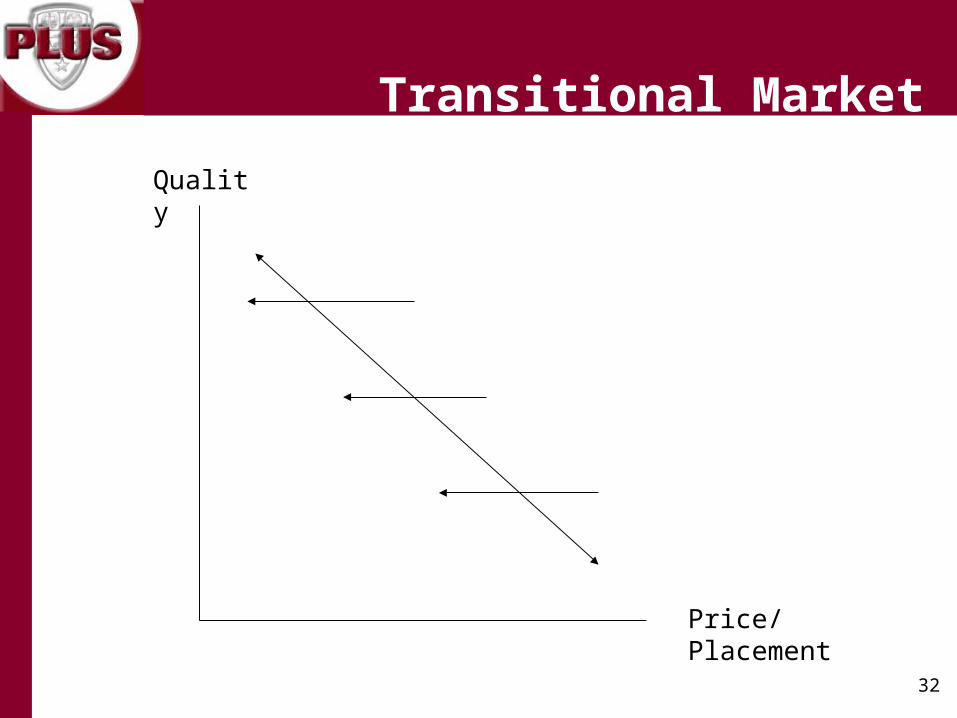
Quality
Price/Placement
Hard Market
32
Quality
Price/Placement
Transitional Market

33
Quality
Price/Placement
Soft Market

34
“Show Me the Money!”
Reimbursement/cash flow
Liability insurance premiums
HIPAA and corporate compliance expenditures
Increased ER patient flow
Patient safety/QI efforts
Disaster/emergency preparedness
Financial Challenges

35
Quality
Price/Placement

36
Pricing/ROE Assumptions
Industry-demonstrated propensity for loss
2001 CY loss > $2 billion
Risk loads must be imbedded in ROE targets
15%-17% > risk-free rate
Premium-to-surplus ratio must contemplate volatility of business and specific risk portfolio

37
The Volatility Issue
Example:
Account purchases $15 million in limit:
$ 900,000 for primary $5,000,000
$ 400,000 for $10,000,000 excess $5,000,000
Total: $1,400,000
Account experiences a loss of $12,500,000
Loss ratios:
Carrier writing entire $15,000,000 limit: 892% Carrier writing $5,000,000 primary layer: 555% Carrier writing $10,000,000 excess layer: 1,875%
38
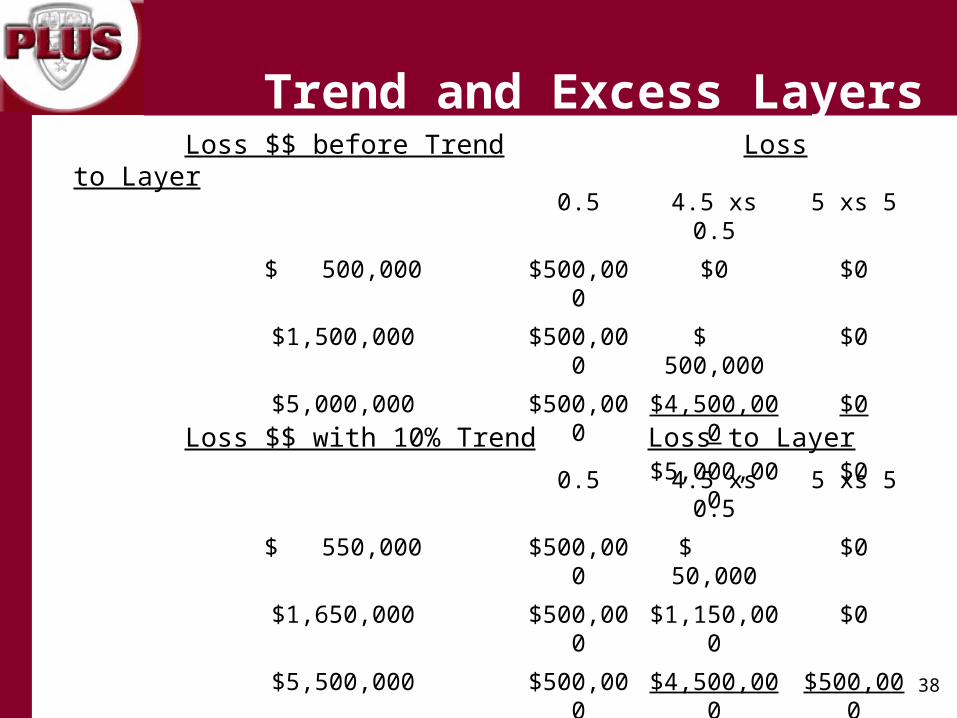
Loss $$ before Trend Loss to Layer
0.5 4.5 xs 0.5 5 xs 5
$ 500,000 $500,000 $0 $0
$1,500,000 $500,000 $ 500,000 $0
$5,000,000 $500,000 $4,500,000 $0
$5,000,000 $0
Loss $$ with 10% Trend Loss to Layer
0.5 4.5 xs 0.5 5 xs 5
$ 550,000 $500,000 $ 50,000 $0
$1,650,000 $500,000 $1,150,000 $0
$5,500,000 $500,000 $4,500,000 $500,000
$5,700,000 $500,000
Trend and Excess Layers

39
Trend to the Layer:
$500,000 = 0%
$4,500,000 xs $500,000 = 40%
$5,000,000 xs $5,000,000 = 100%

40
Attachment Rate per Million
Implied Funding
Implied Frequency
$15mm –$24mm
$12,000 136 0.7%
$25mm –$34mm
$10,000 163 0.6%
$35mm –$49mm
$ 8,500 191 0.5%
$50mm –Over
$ 7,500 217 0.5%
Cost of Capacity
41
It’s a Whole New Game!
Evaluating Risk in Healthcare Organizations
Response: Changing Risk Management Culture

42
Knowing your opponent and what risks prevail
Economic downturn Financial challenges Massive corporate restructuring Increased monitoring and reporting requirements Human resource dilemmas Safety emphasis Technology advancements Changing role of the Risk Manager
Key Factors - Impacting Risk Management Strategies
43
Strike Three – The Ten Pound Gorillas
Reimbursement/revenue Increasing unemployment and decreasing healthcare
benefits/insurance Discontent providers + patients = claims increases
Economic Downturn
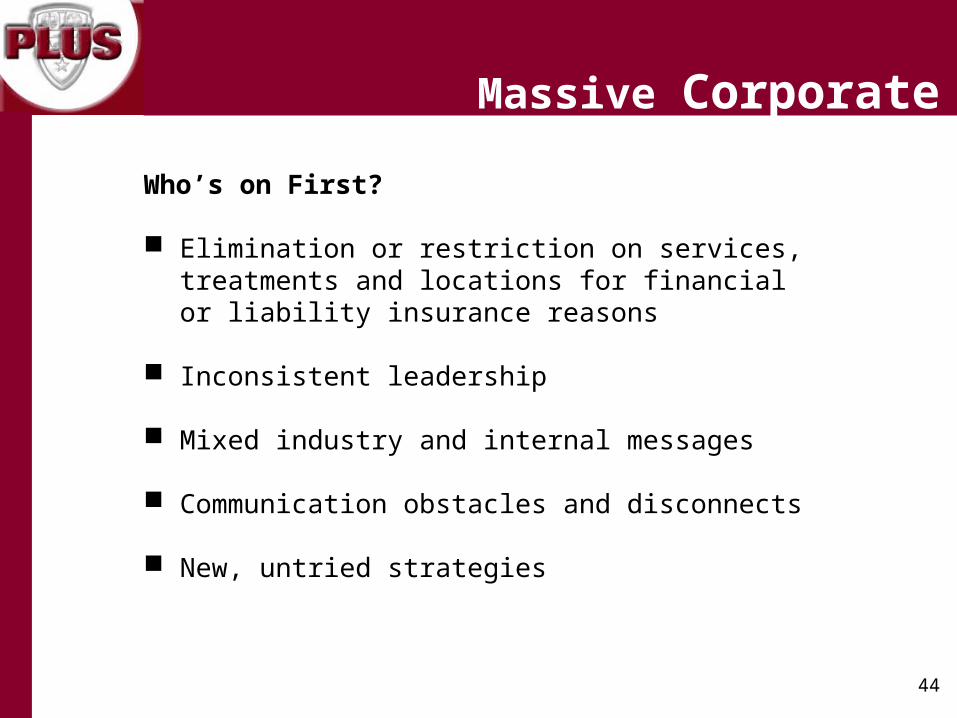
44
Who’s on First?
Elimination or restriction on services, treatments and locations for financial or liability insurance reasons
Inconsistent leadership
Mixed industry and internal messages
Communication obstacles and disconnects
New, untried strategies
Massive Corporate Restructuring

45
More Referees and Umpires!
Unflattering “newsmagazine” profiles (e.g., 60 Minutes, 20/20)
Legislative mandates/proposals
Increase in regulatory requirements (e.g., HIPAA, EMTALA)
New and increased accreditation standards
Increased Monitoring and Reporting Requirements

46
Fielding a “Competitive” Team
Continuing nursing shortage
New providers are fewer
More providers retiring (e.g., liability/insurance)
Education and training
Fraud and whistleblowers
Human Resource Dilemmas
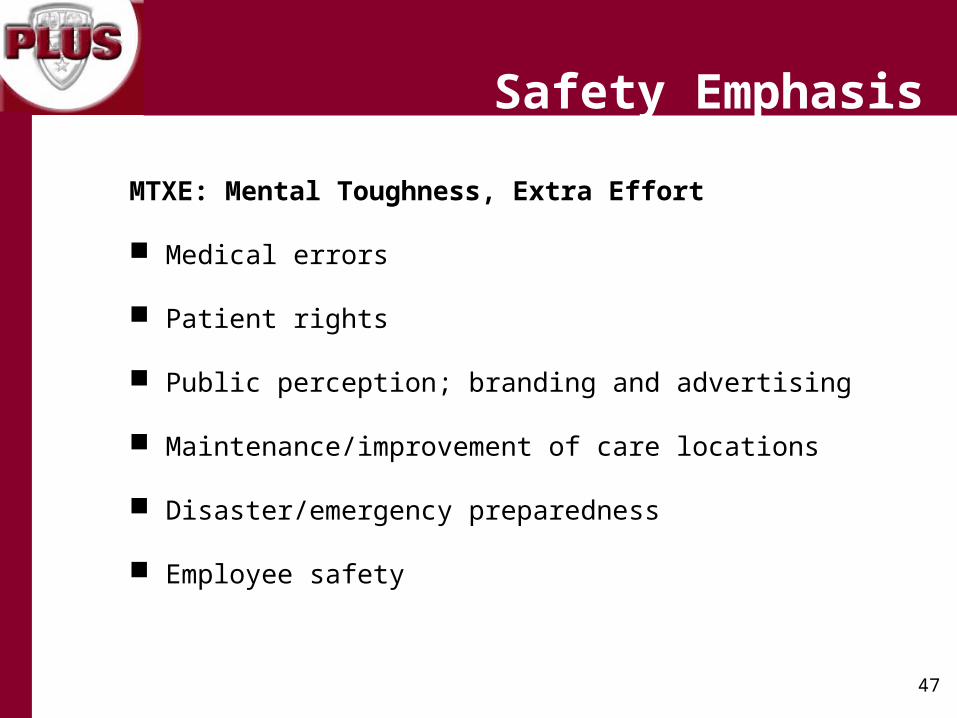
47
MTXE: Mental Toughness, Extra Effort
Medical errors
Patient rights
Public perception; branding and advertising
Maintenance/improvement of care locations
Disaster/emergency preparedness
Employee safety
Safety Emphasis

48
“12th Man”
Data abundance
Quicker decision timeframes
New education requirements
Third-party vendors and tools
Improved resource efficiency
Technology Advancements

49
Broadened responsibilities•Environment•Mold/air quality•Homeland security•Construction wrap-up•Institutional Review Boards•Advertising•Media Relations
Expanded knowledge base•More complex risks
Faster turnaround times•Adverse event resolution
Credentialing Greater interactions with
brokers/insureds Increased accountability
Changing Role of the Risk Manager

50
Developing an Effective Game Plan
Creative risk management solutions
Patient-centric focus
Strong leadership/accountability
Sharp, intuitive and skilled Risk Manager
Risk awareness at the grass-roots level
Risk management metrics/outcome measurements
Willingness to work collaboratively
Open door and communication
Sizing Up Risk

51
Score, Defend and Win!
Matching Insurance Solutions vs. Strategic Plans