1 Behavior of Free and Connected Double-Tee Flanges ... · Behavior of Free and Connected...
48
Page 1 of 48 1 Behavior of Free and Connected Double-Tee Flanges 2 Reinforced with FRP 3 G. Lucier, A. W. Botros, S. H. Rizkalla and H. Gleich 4 5 <subhead 1> 6 Introduction 7 Precast prestressed concrete double-tees are typically used in parking decks and commercial 8 buildings. Traditionally, the flanges of these members are reinforced with conventional steel 9 welded wire reinforcement to carry the load in the transverse direction and to control shrinkage 10 cracking and thermal stress. While traditional steel reinforcement is safe and effective from a 11 structural perspective, it is vulnerable to corrosion. 12 13 Recently, carbon fiber-reinforced polymer (CFRP) grid has been used by several precasters to 14 replace steel reinforcement in the flanges of double-tee members. The advantages of he CFRP 15 grid are a high strength to weight ratio, excellent resistance to corrosion, and ease of installation. 16 17 The use of CFRP materials in bridge girders was led by the construction of several concrete 18 highway bridges in Canada (Rizkalla et al. 2, 3 ). Carbon fiber reinforced polymer (CFRP) strands 19 and bars were used as prestressing and shear reinforcement for the bridge girders. Part of the 20 deck slab was also reinforced with CFRP. The long term performance of the bridges was 21 monitored using advanced sensing technologies. Monitoring indicated no significant degradation 22 in the CFRP after 15 years in service. The results indicated that CFRP tendons could be 23 effectively used as prestressed longitudinal reinforcement in precast concrete bridge girders. 24 25 The application of CFRP grid as inter-wythe shear reinforcement in precast prestressed concrete 26 sandwich panels was investigated in several studies (Pessiki et al. 4; Frankl et al.5; Sopal et al.6). 27 Test results from these studies indicated that a high degree of composite action can be achieved 28 by using CFRP grid as shear connectors. 29 30
-
Upload
duongthien -
Category
Documents
-
view
215 -
download
0
Transcript of 1 Behavior of Free and Connected Double-Tee Flanges ... · Behavior of Free and Connected...
Page 1 of 48
1 Behavior of Free and Connected Double-Tee Flanges 2
Reinforced with FRP 3
G. Lucier, A. W. Botros, S. H. Rizkalla and H. Gleich 4
5
<subhead 1> 6
Introduction 7
Precast prestressed concrete double-tees are typically used in parking decks and commercial 8
buildings. Traditionally, the flanges of these members are reinforced with conventional steel 9
welded wire reinforcement to carry the load in the transverse direction and to control shrinkage 10
cracking and thermal stress. While traditional steel reinforcement is safe and effective from a 11
structural perspective, it is vulnerable to corrosion. 12
13
Recently, carbon fiber-reinforced polymer (CFRP) grid has been used by several precasters to 14
replace steel reinforcement in the flanges of double-tee members. The advantages of he CFRP 15
grid are a high strength to weight ratio, excellent resistance to corrosion, and ease of installation. 16
17
The use of CFRP materials in bridge girders was led by the construction of several concrete 18
highway bridges in Canada (Rizkalla et al.2, 3). Carbon fiber reinforced polymer (CFRP) strands 19
and bars were used as prestressing and shear reinforcement for the bridge girders. Part of the 20
deck slab was also reinforced with CFRP. The long term performance of the bridges was 21
monitored using advanced sensing technologies. Monitoring indicated no significant degradation 22
in the CFRP after 15 years in service. The results indicated that CFRP tendons could be 23
effectively used as prestressed longitudinal reinforcement in precast concrete bridge girders. 24
25
The application of CFRP grid as inter-wythe shear reinforcement in precast prestressed concrete 26
sandwich panels was investigated in several studies (Pessiki et al. 4; Frankl et al.5; Sopal et al.6). 27
Test results from these studies indicated that a high degree of composite action can be achieved 28
by using CFRP grid as shear connectors. 29
30
Page 2 of 48
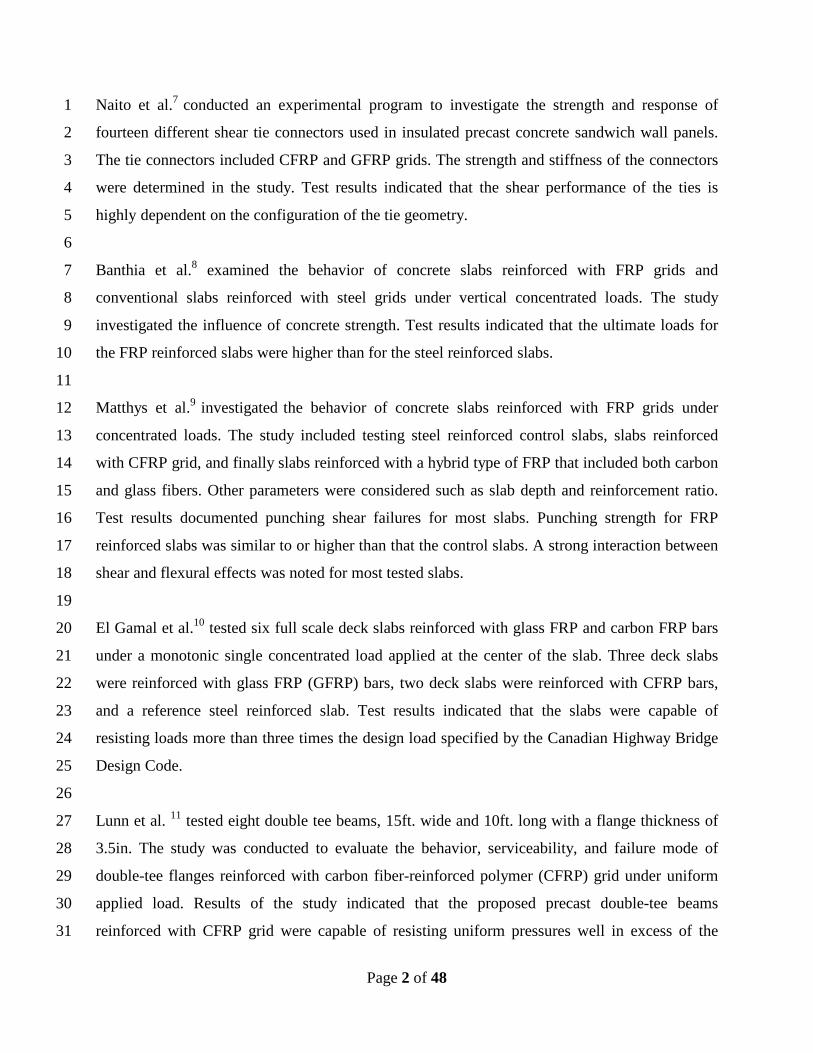
Naito et al.7 conducted an experimental program to investigate the strength and response of 1
fourteen different shear tie connectors used in insulated precast concrete sandwich wall panels. 2
The tie connectors included CFRP and GFRP grids. The strength and stiffness of the connectors 3
were determined in the study. Test results indicated that the shear performance of the ties is 4
highly dependent on the configuration of the tie geometry. 5
6
Banthia et al.8 examined the behavior of concrete slabs reinforced with FRP grids and 7
conventional slabs reinforced with steel grids under vertical concentrated loads. The study 8
investigated the influence of concrete strength. Test results indicated that the ultimate loads for 9
the FRP reinforced slabs were higher than for the steel reinforced slabs. 10
11
Matthys et al.9 investigated the behavior of concrete slabs reinforced with FRP grids under 12
concentrated loads. The study included testing steel reinforced control slabs, slabs reinforced 13
with CFRP grid, and finally slabs reinforced with a hybrid type of FRP that included both carbon 14
and glass fibers. Other parameters were considered such as slab depth and reinforcement ratio. 15
Test results documented punching shear failures for most slabs. Punching strength for FRP 16
reinforced slabs was similar to or higher than that the control slabs. A strong interaction between 17
shear and flexural effects was noted for most tested slabs. 18
19
El Gamal et al.10 tested six full scale deck slabs reinforced with glass FRP and carbon FRP bars 20
under a monotonic single concentrated load applied at the center of the slab. Three deck slabs 21
were reinforced with glass FRP (GFRP) bars, two deck slabs were reinforced with CFRP bars, 22
and a reference steel reinforced slab. Test results indicated that the slabs were capable of 23
resisting loads more than three times the design load specified by the Canadian Highway Bridge 24
Design Code. 25
26
Lunn et al. 11 tested eight double tee beams, 15ft. wide and 10ft. long with a flange thickness of 27
3.5in. The study was conducted to evaluate the behavior, serviceability, and failure mode of 28
double-tee flanges reinforced with carbon fiber-reinforced polymer (CFRP) grid under uniform 29
applied load. Results of the study indicated that the proposed precast double-tee beams 30
reinforced with CFRP grid were capable of resisting uniform pressures well in excess of the 31

Page 3 of 48
design loading. The mode of failure of the flanges was governed by the tensile strength of the 1
concrete followed by rupture of the CFRP grid. The research proposed design recommendations 2
for double tee flanges reinforced with CFRP grid. 3
4
This paper presents two experimental programs undertaken to examine the serviceability and 5
failure mode of free and connected precast prestressed concrete double-tee flanges reinforced 6
with CFRP grids. The double-tee flanges were tested under uniformly distributed loads and 7
concentrated loads to evaluate the behavior of the flanges under extreme loading conditions. 8
9
<subhead 1> 10
A. Uniform Load Tests 11
12
Two full scale 12 foot wide by 40 foot long double-tee specimens were tested under uniform 13
loading. The first specimen, DT1, was an un-topped member 28 in. deep with a 2 inch thick 14
flange. The second specimen, DT2, was a pre-topped member 29.5 in. deep with a 3.5 in. thick 15
flange. Both specimens were prestressed longitudinally and reinforced for shear at the ends of 16
each stem with steel welded wire reinforcement. A continuous sheet of FRP grid was used as the 17
only transverse flange reinforcement. This grid was comprised of 0.15 inch wide carbon fiber 18
strands spaced at 2.75 in. in the primary (transverse) direction held together by smaller glass 19
fiber strands running in the orthogonal direction. The CFRP strands provided the structural 20
flange reinforcement and the GFRP strands maintained spacing and provided anchorage for the 21
CFRP strands. Specimens were tested using a vacuum chamber, and uniform air pressure was 22
used to apply the load. 23
24
The double tees were tested in a simple beam configuration. At one end, the two stems were 25
placed on two load cells, acting as a pin connection. At the other end, the two stems were placed 26
on a 2 inch diameter cylindrical bar to provide a roller support. The specimen, supports, and 27
instrumentation were enclosed in a vacuum chamber constructed around the specimen. The 28
uniform distributed load was applied on the top surface of the double-tee deck by reducing the 29

Page 4 of 48
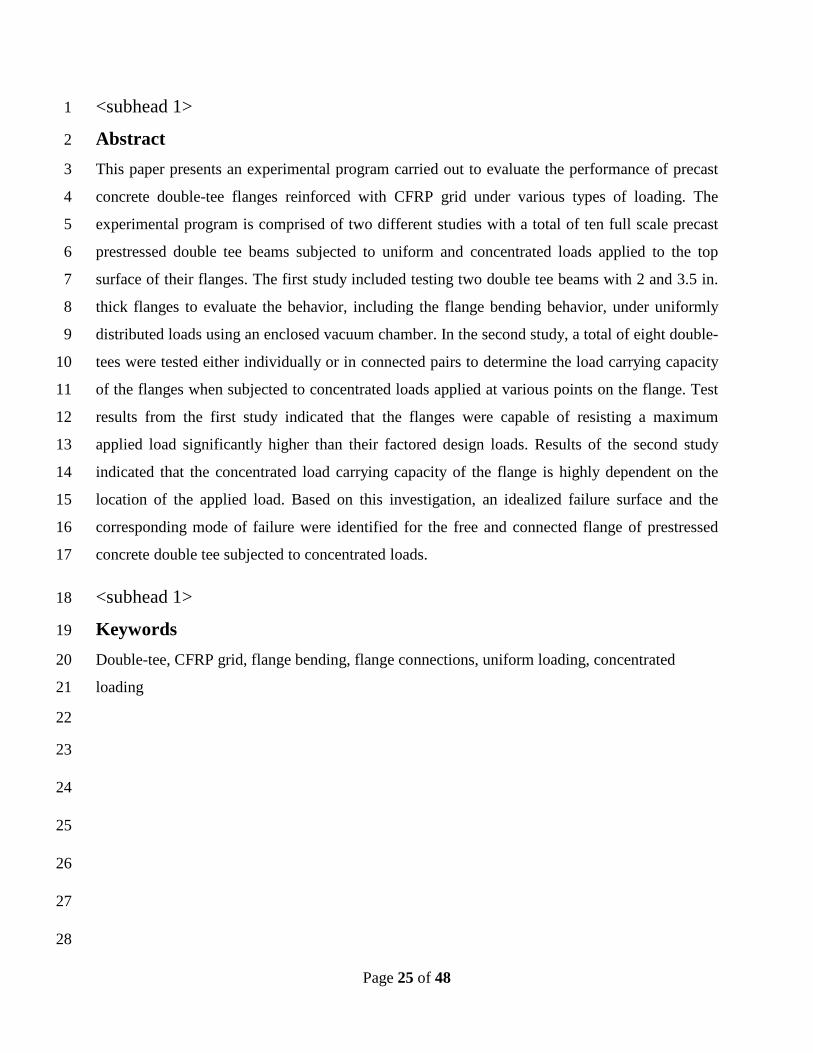
pressure inside the chamber using a combination of vacuum equipment. An isometric view of the 1
test setup is shown in Figure 1. 2
3
Figure 2 shows a cross section of the test setup and the concept used to apply a uniform pressure 4
loading condition to the top surface of the flange. At the start of the test, pressures P1 and P2 are 5
both equal to atmospheric pressure, and consequently, no load is applied to the top surface of the 6
double-tee deck. With the chamber is sealed, pressure P2 is reduced with vacuum equipment 7
while atmospheric pressure P1 remains constant. With pressure P1 greater than P2, the 8
atmospheric pressure acts evenly inward on the top surface of the double tee, creating downward 9
uniform load on the flange. 10
Modular formwork panels were used to build the four vertical walls of the chamber around each 11
double tee. Panels were sealed to the pavement surface and wrapped in plastic to minimize air 12
leakage. Chamber walls were also anchored to the pavement for stability and were braced against 13
one another with shoring to resist the horizontal pressures acting on the chamber. Bracing was 14
provided along the length of the chamber at the top and bottom of the sidewalls. The end walls 15
were braced at the bottom against the supporting concrete blocks and were stiffened at their top 16
edges with steel angles. The chamber was constructed with windows in all sides to allow access 17
for instrumentation and for observation of the behavior under the applied load. The chamber 18
under construction and the completed chamber prior to testing are also shown in Figure 2. 19
20
The total applied uniform pressure load was monitored by two load cells placed at one end of the 21
stem to measure the reaction. Prior to the start of each test, the self-weight of each specimen was 22
recorded using the two load cells. The performance of the flanges was monitored at selected load 23
levels for each specimen, including the design load. Specimen DT1, the un-topped specimen, 24
was designed for a dead load (D) of 38 psf representing a 2 in. field topping in addition to a 10 25
psf live load (L). Specimen DT2, the pre-topped specimen, was designed for a live load of 40 26
psf and a snow load (S) of 20 psf. The controlling load case considered for both specimens was 27
the factored load combination 1.2D+1.6L+0.5S. The factored load was sustained for 1 hour and 28
24 hours for specimens DT1 and DT2, respectively. Specimens were loaded and unloaded in 29
incremental cycles to failure. The loading sequences followed for testing DT1 and DT2 are 30
summarized in Table 1. 31
Page 5 of 48
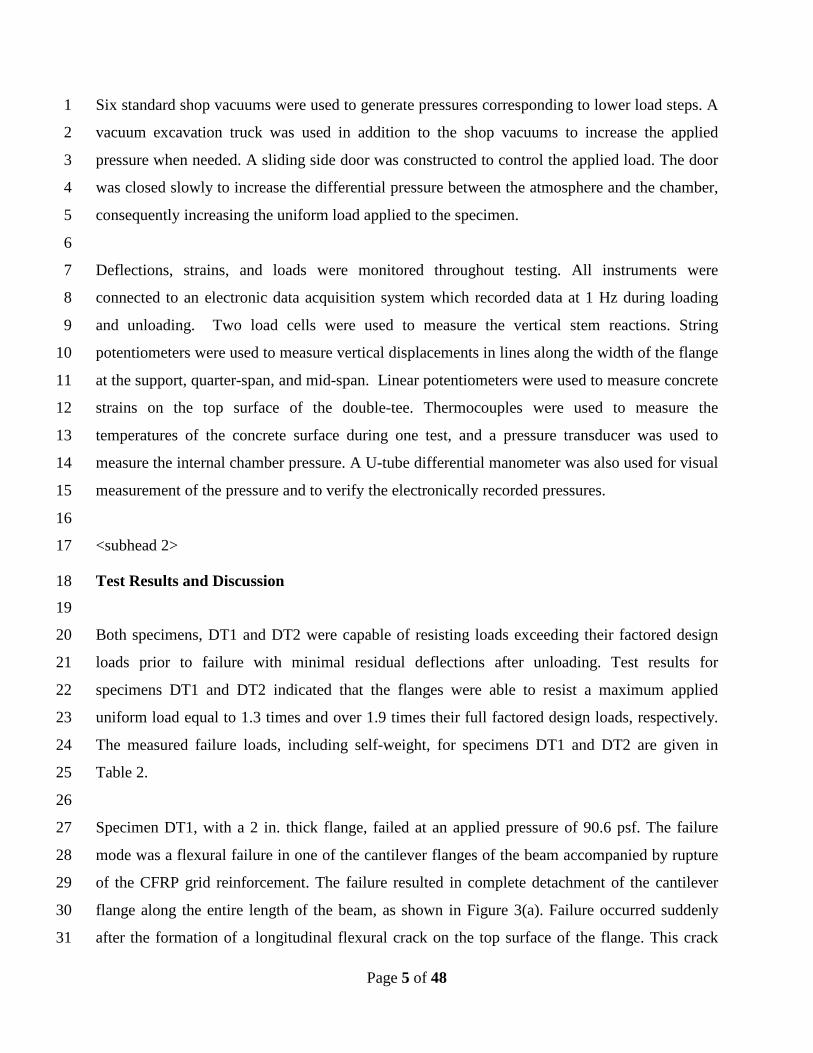
Six standard shop vacuums were used to generate pressures corresponding to lower load steps. A 1
vacuum excavation truck was used in addition to the shop vacuums to increase the applied 2
pressure when needed. A sliding side door was constructed to control the applied load. The door 3
was closed slowly to increase the differential pressure between the atmosphere and the chamber, 4
consequently increasing the uniform load applied to the specimen. 5
6
Deflections, strains, and loads were monitored throughout testing. All instruments were 7
connected to an electronic data acquisition system which recorded data at 1 Hz during loading 8
and unloading. Two load cells were used to measure the vertical stem reactions. String 9
potentiometers were used to measure vertical displacements in lines along the width of the flange 10
at the support, quarter-span, and mid-span. Linear potentiometers were used to measure concrete 11
strains on the top surface of the double-tee. Thermocouples were used to measure the 12
temperatures of the concrete surface during one test, and a pressure transducer was used to 13
measure the internal chamber pressure. A U-tube differential manometer was also used for visual 14
measurement of the pressure and to verify the electronically recorded pressures. 15
16
<subhead 2> 17
Test Results and Discussion 18
19
Both specimens, DT1 and DT2 were capable of resisting loads exceeding their factored design 20
loads prior to failure with minimal residual deflections after unloading. Test results for 21
specimens DT1 and DT2 indicated that the flanges were able to resist a maximum applied 22
uniform load equal to 1.3 times and over 1.9 times their full factored design loads, respectively. 23
The measured failure loads, including self-weight, for specimens DT1 and DT2 are given in 24
Table 2. 25
26
Specimen DT1, with a 2 in. thick flange, failed at an applied pressure of 90.6 psf. The failure 27
mode was a flexural failure in one of the cantilever flanges of the beam accompanied by rupture 28
of the CFRP grid reinforcement. The failure resulted in complete detachment of the cantilever 29
flange along the entire length of the beam, as shown in Figure 3(a). Failure occurred suddenly 30
after the formation of a longitudinal flexural crack on the top surface of the flange. This crack 31

Page 6 of 48
was located 6.5 in. outboard from the center of one stem where the flange tapered into the stem 1
as shown in Figure 3(b). It should be noted that two initial cracks on the top surface of the inner 2
flange were observed in specimen DT1 before testing. The initial longitudinal cracks were 3
located at the web-flange juncture and extended along the entire length of the beam. They were 4
also visible on the bottom face of the flange. 5
6
The measured net deflection profile and selected strain measurements for specimen DT1 are 7
shown in Figure 4 and Figure 5, respectively. C1 to C7, in Figure 4, are vertical deflection 8
measurement locations across the cross-section, from the tip of one flange to the tip of the other. 9
Deflection profiles are shown at the service load, factored load, and ultimate load levels. The 10
measured deflections at the tip of the cantilevers at service and factored loads were each less than 11
0.3 inches. The measured transverse strains, gages 2 and 4, located on the top surface of the 12
cantilever at the flange stem juncture indicated a linear load-strain behavior beyond the factored 13
load and up to failure. This behavior indicates that no cracks occurred at this location up to 14
failure. The behavior also justifies the very small measured deflections at failure. This result 15
indicates that flange failure occurred immediately after cracking of the cross section at the 16
maximum moment location. The load-strain behavior recorded by strain gages 1 and 3 across the 17
the inner flange-stem connection was nonlinear as shown in Figure 5. This result reflects the 18
widening of the pre-existing cracks and straining of the CFRP grid at these locations as the 19
applied uniform pressure was increased. 20
21
Specimen DT2, with a 3.5 in. thick flange, did not fail under the applied load. It exhibited 22
excessive flexural deflection at midspan at an applied load of 203 psf and the test was terminated 23
due to the inability of the test setup to increase the applied load above this level. This result 24
indicated that the flange was capable of carrying an applied load greater than 203 psf which is 25
1.9 times the full factored design load. It should be noted that the applied uniform pressure of 26
203 psf was maintained for approximately 10 minutes, during which time the double-tee 27
continued to deflect under constant load, indicating global yielding of the longitudinal strands. 28
Specimen DT2 after termination of the test is shown in Figure 6. 29
30

Page 7 of 48
At the conclusion of the test of DT2, the specimen was visually inspected for cracks. No cracks 1
were observed in the top or bottom surface of the flanges or on either side of both stems. 2
Specimen DT2 was entirely intact and visibly undamaged in any way at the conclusion of 3
testing. It is assumed that residual prestressing was sufficient to close flexural cracks in the 4
stems that certainly would have developed. 5
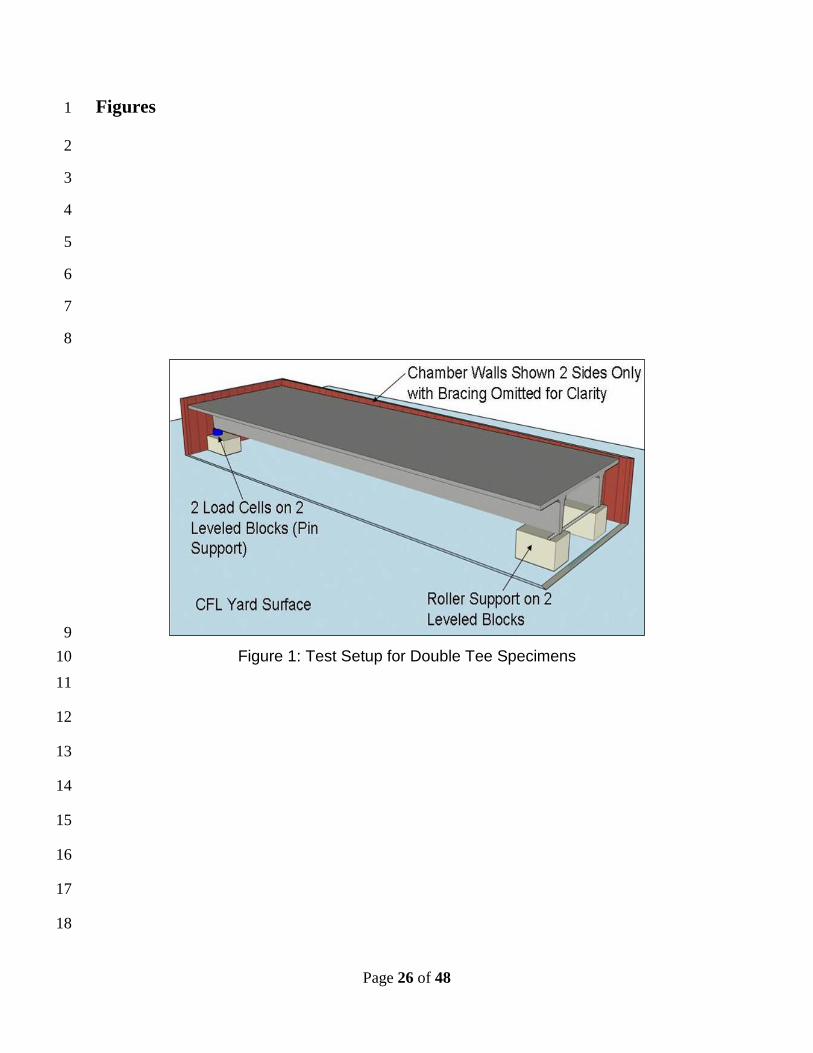
The measured net deflection profile and measured concrete strains for specimen DT2 are shown 6
in Figure 7 and Figure 8, respectively. The measured load-deflection behavior indicates very 7
small deflections at the service and factored load levels and the flange remained nearly flat, even 8
at factored load. As the load increased beyond the factored level, the deflection at the mid span 9
increased in comparison to the end of the cantilever. The deflection profile for specimen DT2 10
indicates global deformation of the flange beyond the factored load. The measured concrete 11
strains, shown in Figure 8, remained below 500 microstrain and the load-strain behavior was 12
relatively linear up to the maximum applied pressure with no evidence of cracks. 13
Comparing the behavior of the two specimens indicates the significant effect of the flange 14
thickness on both the load carrying capacity and the overall and local deflection of the double-15
tees. 16
17
<subhead 1> 18
B. Concentrated Load Tests 19
20
According to the PCI Handbook1, edition 7, precast concrete double-tee flanges should be 21
designed to resist concentrated loads at various locations on the surface. Since Specimen DT2 22
remained entirely intact after uniform loading , additional concentrated load tests were conducted 23
to evaluate the behavior of the flange at various locations on the surface of the tee. Concentrated 24
flange loads would commonly be caused in a parking structure by a vehicle jack and can control 25
the flange design. The concentrated loads were applied through 4.5 inch by 4.5 inch steel plates 26
bearing directly on the flange surface. Tests were conducted at the edge, mid-width of the flange 27
at the end and mid span sections of the beam using a simple test setup. The typical test setup and 28
failure patterns at various tested locations are shown in Figure 9. Measured failure loads and 29

Page 8 of 48
observed failure modes for the concentrated load tests are summarized in Table 3 by location of 1
loading. The numbers shown in Figure 9 correspond to the test numbers given in Table 3. 2
3
It should be noted that tests conducted on isolated edges of the flange do not simulate the typical 4
conditions in the field. Typically, double tee flanges are welded together at discrete points along 5
the span. Accordingly, concentrated loads applied on the flange are resisted by the connected 6
flanges of the adjacent double tees. The fact that a diaphragm action is developed in connected 7
double tees to resist the applied concentrated loads may result in higher failure loads and 8
different failure surfaces. This action requires testing of the connected double tees to determine 9
the structural mechanism and the failure surfaces under the effect of concentrated loads. 10
11
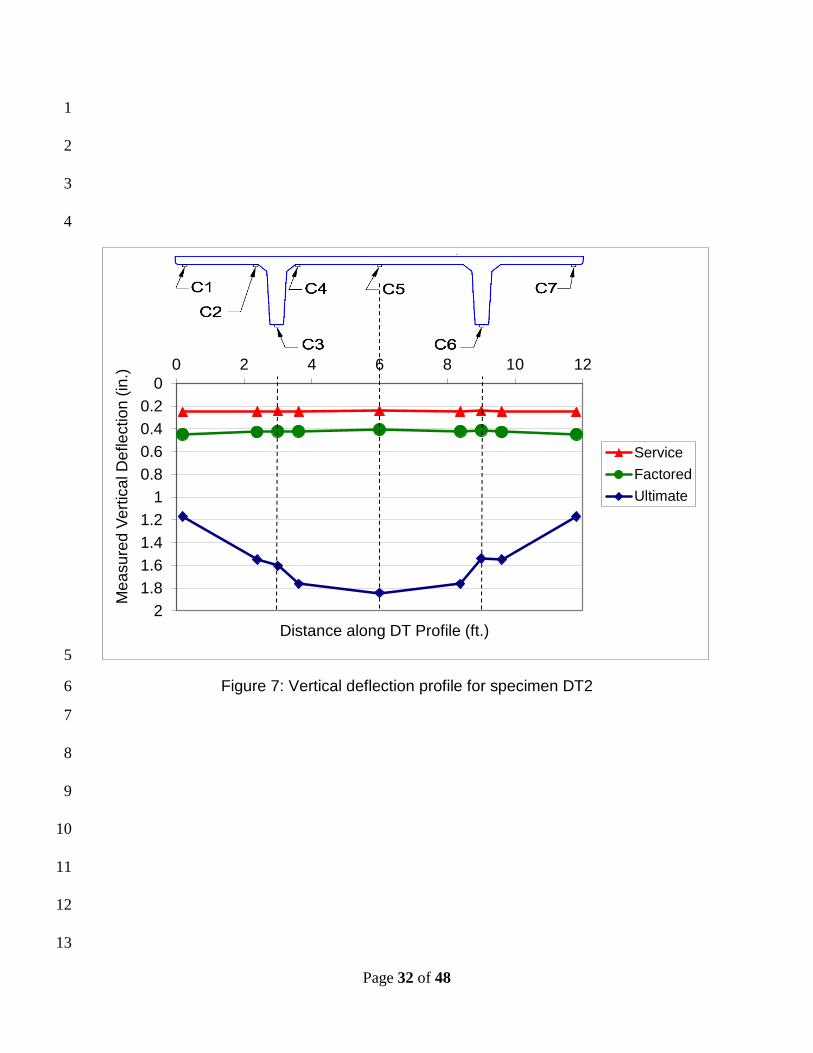
To study the influence of connected tee flanges, it was decided to perform additional tests in the 12
yard of a precast concrete facility on full-scale 12’ wide by 60’ long double tees. This field 13
testing program was designed to evaluate the behavior of adjacent, connected, CFRP-reinforced 14
double-tee flanges as well as free double tee edges subjected to concentrated loads. The double 15
tee members were connected by welding embedded flange connections located every 6 feet 16
along the length of the beam. The two types of flange connections used in the field testing 17
program (one straight and one twisted) are shown in Figure 10. 18
19
All prestressed concrete double tees used in the field testing portion of this program were 12 feet 20
wide and 60 feet long. The total depth for each beam was 29.5 in. including a 3.5 in. thick flange. 21
The specified nominal compressive strength of the concrete was 6000 psi, and each beam was 22
prestressed longitudinally by ten ½-S in. diameter strands. The double tees flanges were 23
reinforced with a continuous sheet of CFRP grid with a 3” spacing. The grid was the only 24
transverse flange reinforcement with the exception of two #3 steel reinforcing bars placed at each 25
end and a welded chord detail consisting of two #5 bars placed also at one end only. The steel 26
bars and chord detail are typical of all specimens, as shown in Figure 11. A total of six double 27
tees were tested in connected pairs while only two double tees were tested individually. A total 28
of forty-eight tests were performed. 29
30

Page 9 of 48
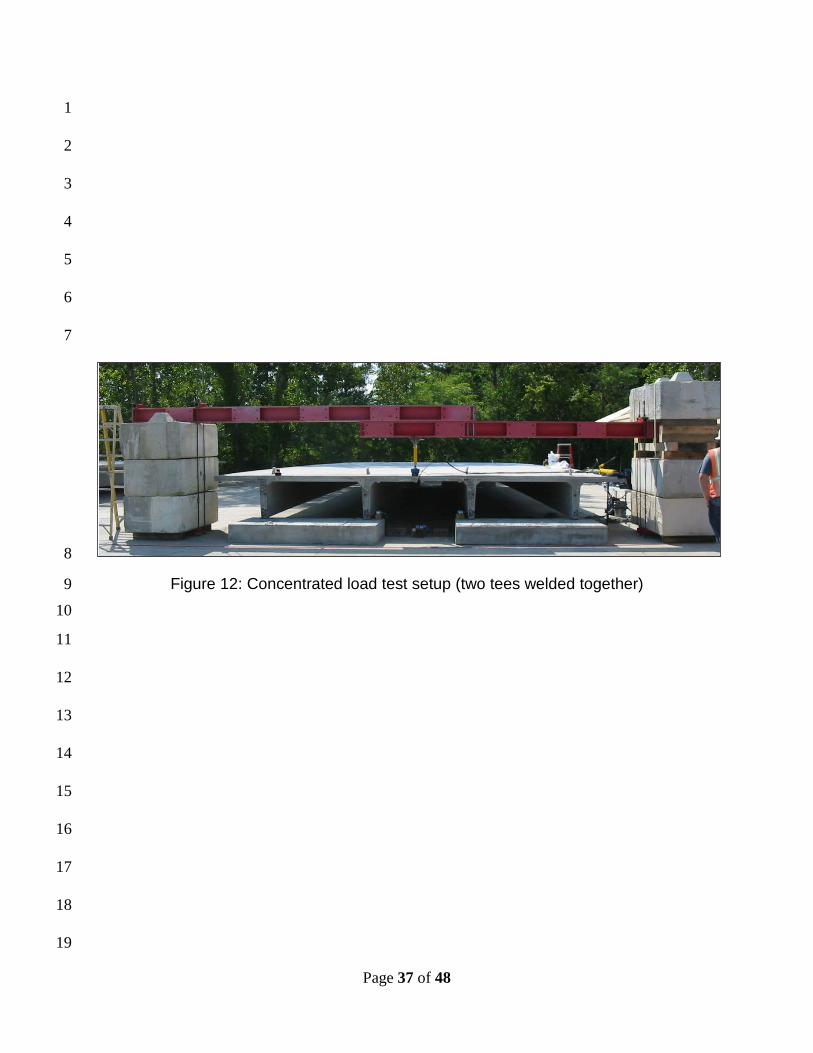
Tests were conducted by applying concentrated loads at selected locations on the top surface of 1
the flange using the hydraulic jack and self-reacting frame shown in Figure 12. The jack was 2
secured to the reaction beam, and the entire frame able to be moved along the length of the 3
specimens. The double tees were supported on masticord bearing pads at each end and were 4
elevated off the ground by concrete blocks. 5
Specimens were tested individually or in connected pairs. Table 4 summarizes the configurations 6
of the 48 tests. Specimens tested in pairs were welded together at their discrete flange 7
connections and at the chord connection. The location of the chord connection with respect to 8
each test is designated by a dotted line on the sketches shown in Table 4. After conducting tests 9
on the pair at the connected edges, the double tees were separated, rotated, and their remaining 10
intact edges welded together to conduct the additional tests shown in Table 4. Locations of the 11
applied concentrated loads are shown as open circles in the Table, and each test is designated by 12
a number and a letter. Letters A and B indicate similar locations on the adjacent flanges. For 13
each critical location, at least four data points were measured to provide adequate statistical data. 14
The shaded areas on each sketch represent the locations of pre-existing failures from prior tests 15
in previous configurations. 16
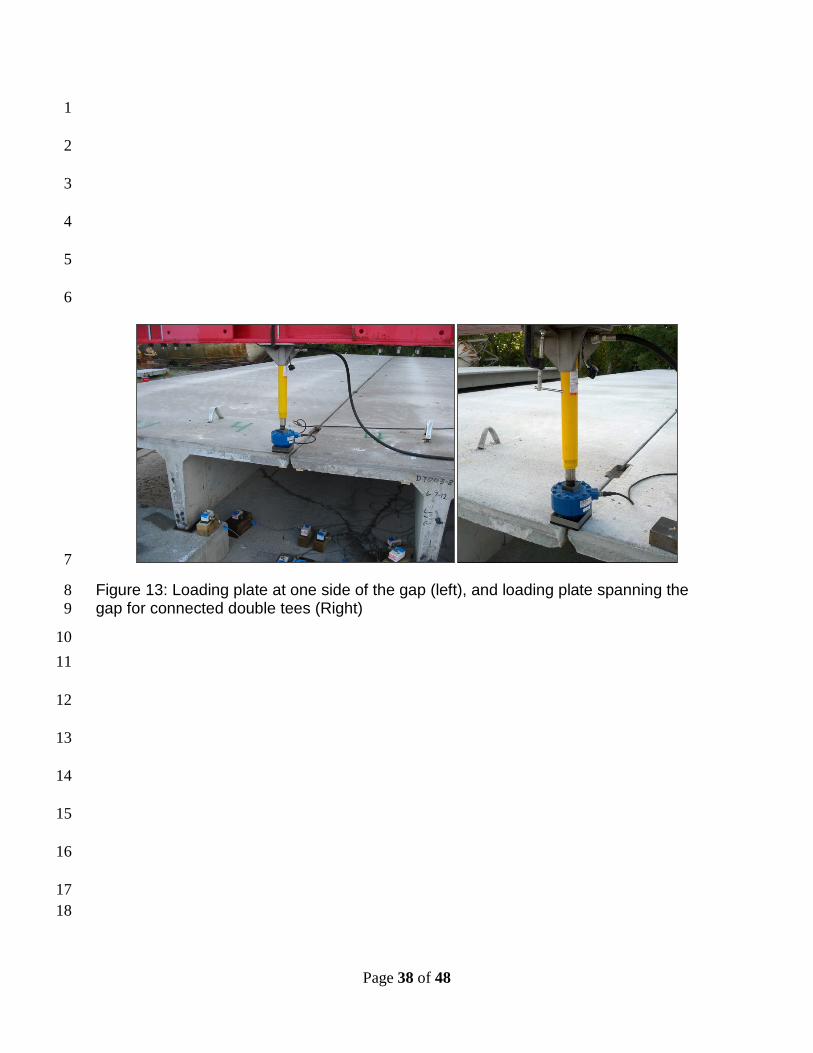
For the connected double tees, two types of loading were considered at the joint. In the first, the 17
concentrated load was applied with the bearing plate entirely on one side of the gap and was 18
referred to as “side of gap” loading. In the second, the bearing plate was placed to span the gap 19
and was referred to as “spans gap”. This difference is illustrated in Figure 13. 20
For all tests, the applied load was measured by an electronic load cell. The load was applied by a 21
hydraulic jack through a spherical bearing connection to a 4.5 inch square by 1 inch thick steel 22
plate bearing on a 4.5 inches square by 0.5 inch thick neoprene pad. For selected specimens, the 23
vertical deflection of the flange was measured during each test with string potentiometers placed 24
directly under the applied load. 25
26

Page 10 of 48
<subhead 2> 1
Test Results and Discussion 2 3
The failure modes observed for the flange of the double tee were either a flexure failure or a 4
punching shear failure. All failures occurred in a sudden fashion. Test results of all tests are 5
summarized in Table 5 by location of loading. Photos for the observed failure modes for 6
selected tests, listed in Table 5, are shown in Figure 14. 7
Test results of connected flanges loaded at internal corner locations with the load beside of the 8
gap (see Figure 14a), failed due to formation of an inclined flexure crack on the top surface of 9
the loaded flange. This inclined crack extended from the web flange junction to the connector 10
plate joining the two flanges. It should be noted that a portion of the concentrated load was also 11
carried by the adjacent flange since it is connected to the loaded flange, however, failure took 12
place in the loaded flange only and the adjacent flange remained intact after the test. 13
14
Loading the two flanges simultaneously at an internal corner in the configuration referred to as 15
“spans gap” resulted in a flexure failure in the two flanges. Failure occurred after the formation 16
of inclined flexure cracks on the top surfaces of the two connected flanges. These cracks 17
extended from the web flange juncture to the connector plate for each flange as shown in Figure 18
14 (b). 19
20
Test results for the case of a free DT loaded at the corner indicated failure due to formation of an 21
inclined flexure crack on the top surface of the flange. This crack extended from the web flange 22
juncture to the edge of the flange with an inclination of about 60 degrees. The failure mode for a 23
corner test of a free DT is shown in Figure 14 (c). 24
25
Comparing similar pairs of corner tests shown in Table 5 indicated that presence of the welded 26
chord steel at the corners of the double tees increased the ultimate capacity by 43% in some 27
cases. For the connected double tees, the location of the load with respect to the joint (on one 28
side of gap or spanning the gap) had a significant effect on the ultimate capacity of the flange. In 29
some cases, the failure load for the configuration with the load spanning the gap was 58% higher 30
than the case where the load was placed on one side of the gap. Comparing the corner test results 31

Page 11 of 48
of connected DTs and free DTs indicated that the concentrated load carrying capacity of internal 1
corners of connected DTs was higher than that of a free DT. This behavior is attributed to the 2
fact that the concentrated load is resisted by the two flanges in the case of connected DTs which 3
consequently results in higher load carrying capacity. 4
5
Test results of connected flanges loaded at the midspan location for the case of the load spanning 6
the gap (Figure 14d), indicated a flexure failure in the two flanges. The flexural cracks that 7
constituted failure occurred immediately after reaching the cracking capacity of the flanges at the 8
critical section. The cracks took place on the top surface of the flanges close to the web-flange 9
juncture. Under the applied load the cracks widened and propagated longitudinally and 10
transversely towards the gap between the two flanges. For each of the connected flanges, the 11
flexure crack intersected the edge of the flange beside the gap at two points almost 25 feet apart. 12
This behavior resulted in complete detachment of segments of the two connected flanges upon 13
rupture of the CFRP grid as shown in Figure 14 (d). In general, the failure was brittle and 14
occurred immediately after the formation of the flexure cracks. 15
16
Test results of connected flanges loaded at the midspan location for the case of the load placed at 17
one side of the gap exhibited a different failure mode. The failure mode for midspan “side of 18
gap” tests is also shown in Figure 14 (e), (f) and (g). As shown in Figure 14, the failure observed 19
in this case was a local punching shear failure in the flange at the location of the applied load. 20
The failure took place in a sudden fashion. In some tests, a flexure crack occurred on the top 21
surface of the flange close to the web flange juncture prior to the punching failure of the flange. 22
23
Test results for the case of loading the edge of a free DT at midspan, shown in Figure 14 (h), 24
indicated a flexural failure in the flange. Failure occurred after the formation of a longitudinal 25
flexural crack on the top surface of the flange. This crack initiated close to the web flange 26
juncture and progressed longitudinally and transversely towards the edge of the flange. The 27
failure resulted in complete detachment of a segment of the flange upon rupture of the CFRP 28
grid. 29
30

Page 12 of 48
Results of tests conducted directly over connectors indicated a flexural failure in the two 1
connected flanges. Failure occurred immediately after the formation of flexural cracks on the top 2
surface of the two flanges. The cracks initiated close to the web flange juncture and propagated 3
in the longitudinal and transverse directions towards the gap between the two flanges as shown 4
in Figure 14 (I). 5
6
In general, the load carrying capacity of the flange at midspan for connected double tees was 7
markedly higher than that of the free double tee. For example, the load carrying capacity of the 8
connected flanges at the midspan location (test 19 in Table 5) was almost twice that of a free 9
flange at same location, test 26. The case of connected double tees more closely match the 10
realistic conditions in parking structures where double tees are connected together using welded 11
joints. 12
13
For a connected pair of double tees, the corner locations are the most critical locations with the 14
least load carrying capacity as compared to the midspan locations. Test results indicated that the 15
ultimate capacity of the flange at a midspan location exceeded the capacity at an internal corner 16
location by up to five times in some cases. Results of tests conducted directly over the 17
connectors indicated that the two types of connectors considered in this study provided almost 18
equivalent strengths at all tested locations. 19
20
In general, concentrated load test results indicated that the failure load and mode of failure were 21
highly influenced by the test configuration, load location and presence of chord steel. Figure 15 22
(a) and (b) show the measured load versus the vertical displacement under the load for selected 23
tests at the corner and midspan locations, respectively. 24
25
<subhead 2> 26
Idealized Failure Surfaces and Design Methodology 27 28
Results of the concentrated loads tests conducted on the double tees in the field testing program 29
were used to develop idealized failure surfaces at various locations of the DT flange. 30

Page 13 of 48
Figure 16 shows the idealized failure surfaces for a corner location and a location at any point 1
along the edge of a free flange sufficiently far from an end or other discontinuity. Figure 17 2
shows the idealized failure surfaces and mode of failure for the internal corner and midspan 3
locations of connected DTs for the cases of the load placed at one side of the gap and spanning 4
the gap. 5
6
The nominal moment capacity of the flange 𝑀𝑛was determined using the method recommended 7
by ACI 440.1R-06 12. In Eq. 1, 𝐴𝑓 is the area of FRP reinforcement, b is the width of the flange 8
and d is the effective depth of the reinforcement. In Eq. 2, Ef is the modulus of elasticity of the 9
FRP, 𝜀𝑐𝑐 is the concrete crushing strain, 𝑓′𝑐 concrete compressive strength at 28 days, 𝑓𝑓𝑐 is the 10
rupture stress of the FRP, and 𝛽1 is a factor relating the depth of the equivalent rectangular 11
compressive stress block to the neutral axis depth as specified by ACI 318-1413. According to 12
ACI 440.1R-0612, if the FRP reinforcement ratio, 𝜌𝑓 calculated using Eq. 1 is less than the 13
balanced ratio, 𝜌𝑓𝑓 from Eq. 2, failure is likely due to rupture of the FRP before crushing of the 14
concrete. In this case, a simplified and conservative method recommended by ACI 440.1R-0612 15
was used to determine the nominal moment capacity, 𝑀𝑛 as given by Eq. 3, where 𝜀𝑓𝑐 is the 16
rupture strain of the FRP and 𝑐𝑓 is the distance from the extreme compression fiber to the neutral 17
axis at the balanced strain condition as determined by Eq. 4. 18
19
𝜌𝑓 = 𝐴𝑓 𝑏 𝑑⁄ Eq.1 20
𝜌𝑓𝑓 = 0.85 𝛽1 𝑓′𝑐𝑓𝑓𝑓
𝐸𝑓 𝜀𝑐𝑓𝐸𝑓 𝜀𝑐𝑓+ 𝑓𝑓𝑓
Eq.2 21
𝑀𝑛 = 𝐴𝑓𝑓𝑓𝑐 (𝑑 − 𝛽1 𝑐𝑓 2⁄ ) Eq.3 22
𝑐𝑓 = � 𝜀𝑐𝑓𝜀𝑐𝑓+ 𝜀𝑓𝑓
� 𝑑 Eq.4 23
The experimental results of this study indicated that for most of the tests, ultimate failure was 24
controlled by the flexural cracking capacity of the flange rather than the FRP reinforcement ratio. 25
This was also indicated by calculations since the cracking moment 𝑀𝑐𝑐, exceeds the nominal 26
flexural moment corresponding to the tensile rupture strength of the FRP𝑀𝑛. The cracking 27
Page 14 of 48
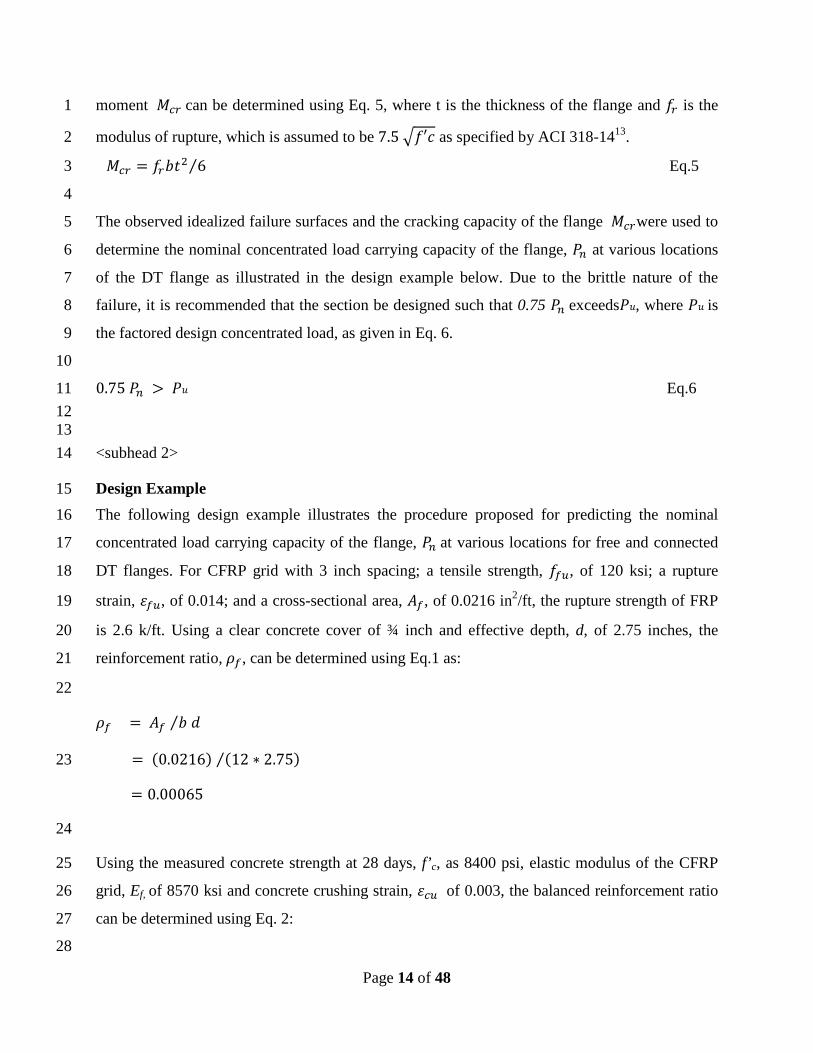
moment 𝑀𝑐𝑐 can be determined using Eq. 5, where t is the thickness of the flange and 𝑓𝑐 is the 1
modulus of rupture, which is assumed to be 7.5 �𝑓′𝑐 as specified by ACI 318-1413. 2
𝑀𝑐𝑐 = 𝑓𝑐𝑏𝑡2 6⁄ Eq.5 3
4
The observed idealized failure surfaces and the cracking capacity of the flange 𝑀𝑐𝑐were used to 5
determine the nominal concentrated load carrying capacity of the flange, 𝑃𝑛 at various locations 6
of the DT flange as illustrated in the design example below. Due to the brittle nature of the 7
failure, it is recommended that the section be designed such that 0.75 𝑃𝑛 exceeds𝑃𝑢, where 𝑃𝑢 is 8
the factored design concentrated load, as given in Eq. 6. 9
10
0.75 𝑃𝑛 > 𝑃𝑢 Eq.6 11 12 13 <subhead 2> 14
Design Example 15 The following design example illustrates the procedure proposed for predicting the nominal 16
concentrated load carrying capacity of the flange, 𝑃𝑛 at various locations for free and connected 17
DT flanges. For CFRP grid with 3 inch spacing; a tensile strength, 𝑓𝑓𝑐, of 120 ksi; a rupture 18
strain, 𝜀𝑓𝑐, of 0.014; and a cross-sectional area, 𝐴𝑓, of 0.0216 in2/ft, the rupture strength of FRP 19
is 2.6 k/ft. Using a clear concrete cover of ¾ inch and effective depth, d, of 2.75 inches, the 20
reinforcement ratio, 𝜌𝑓, can be determined using Eq.1 as: 21
22
𝜌𝑓 = 𝐴𝑓 𝑏 𝑑⁄
= (0.0216) (12 ∗ 2.75)⁄ 23
= 0.00065
24
Using the measured concrete strength at 28 days, f’c, as 8400 psi, elastic modulus of the CFRP 25
grid, Ef, of 8570 ksi and concrete crushing strain, 𝜀𝑐𝑐 of 0.003, the balanced reinforcement ratio 26
can be determined using Eq. 2: 27
28

Page 15 of 48
𝜌𝑓𝑓 = 0.85 𝛽1 𝑓′𝑐
𝑓𝑓𝑓 𝐸𝑓 𝜀𝑐𝑓𝐸𝑓 𝜀𝑐𝑓+ 𝑓𝑓𝑓
1
= 0.85 ∗ 0.65 8.4120
8570∗0.003(8570∗0.003+120)
2
= 0.0068
Since the FRP reinforcement ratio, 𝜌𝑓 is less than the balance ratio 𝜌𝑓𝑓 , the nominal moment 3
capacity of the flange, 𝑀𝑛 can be determined based on the conservative estimation of depth of 4
the compression zone for the balanced section 𝑐𝑓 using Eq. 3 and Eq. 4 as follows: 5
6
𝑐𝑓 = �𝜀𝑐𝑐
𝜀𝑐𝑐 + 𝜀𝑓𝑐� 𝑑
= �0.003
0.003 + 0.014� 2.75
= 0.485 𝑖𝑖
7
𝑀𝑛 = 𝐴𝑓𝑓𝑓𝑐 (𝑑 − 𝛽1 𝑐𝑓 2⁄ )
= 0.0216 ∗ 120 (2.75 − 0.65 ∗ 0.485/2) 8
= 6.7 kip-in/ft 9
10
The cracking moment capacity of the flange, 𝑀𝑐𝑐, can be determined using Eq. 5 11
𝑀𝑐𝑐 = 𝑓𝑐𝑏𝑡2 6⁄
= 7.5 ∗ √8400 (12) (3.52) (6 ∗ 1000)⁄
= 16.8 𝑘𝑖𝑘 − 𝑖𝑖/𝑓𝑡
12
The analysis indicated that the cracking moment capacity 𝑀𝑐𝑐 exceeds the nominal flexural 13
moment 𝑀𝑛. Therefore, the flexural capacity of the flange is controlled by the cracking moment 14
cracking and should be used to predict the concentrated load carrying capacity of the flange, 𝑃𝑛, 15
at the proposed failure surfaces for the free and connected DT flanges. 16

Page 16 of 48
Case 1: Load spanning the gap at the corner of connected flanges 1
The proposed failure mode for this case is flexure along the proposed failure surface 2
Assume that the load is shared equally by the two 3
flanges; therefore the load acting on each flange is 𝑃𝑛/2 4
The length of the failure surface, L can be determined 5
based on the 30 inches cantilever length of the flange as: 6
𝐿 = 30" cos 45⁄
= 42.4 "
The lever arm, a can be determined as: 7
𝑎 = 30" ∗ sin 45
= 21.2"
Using the cracking moment capacity, 𝑀𝑐𝑐 along the length, L, the nominal concentrated load, 8
𝑃𝑛 can be determined as: 9
𝑀𝑐𝑐 ∗ 𝐿 = 𝑃𝑛2∗ 𝑎 10
16.8 ∗ 42.4" 12 =𝑃𝑛2∗ 21.2"�
𝑃𝑛 = 5.5 𝑘𝑖𝑘𝑘
This value compares well with the average load of 6 kips measured for five tests. 11
12
13
14
15
16
17
18

Page 17 of 48
Case 2: Load spanning the gap at mid span of connected flange 1
The proposed failure mode for this case is flexure along 2
the failure surface 3
Similarly, assuming that the load is equally shared by the 4
two flanges, thus the load acting on each flange is 𝑃𝑛/2 5
The dimensions of the failure surface: 6
t = thickness of flange 7
= 3.5” 8
𝐿 = 8𝑡 sin 20⁄
= 81.8 "
The lever arm can be determined based on the proposed 9 failure surface 10
𝑎 = 8𝑡 ∗ cos 20
= 26.3"
The nominal load can be determined as follows: 11
𝑃𝑛4∗ 𝑎 = 𝑀𝑐𝑐 ∗ 𝐿 12
𝑃𝑛4∗ 26.3" = 16.8 ∗ 81.8"/12
𝑃𝑛 = 17.3 𝑘𝑖𝑘𝑘
This value compares well with the average load of 17.5 kips measured for two tests 13
14
15
16
17
18
19

Page 18 of 48
Case 3: Load at one side of the flange at mid-span of the connectors 1
The proposed failure mode for this case is a punching shear failure along the failure surface, 2
using concrete shear strength�𝑓′𝑐 , the nominal load 𝑃𝑛 can be determined based on flange 3
thickness, t and length of the failure surface, L as follows: 4
𝑡 = 3.5" 5
𝐿 = 2𝑡 sin 20⁄
= 20.4"
𝑃𝑛 = �𝑓′𝑐 ∗ 2𝐿 ∗ 𝑡
𝑃𝑛 = √8400 ∗ 2 ∗ 20.4" ∗ 3.5" 1000⁄
= 13.0 𝑘𝑖𝑘𝑘
The predicted value also compares well to the average 6
load of 14.6 kips measured for seven tests. 7
8
Case 4: load at the corner of free flange 9
The proposed failure mode for this case is flexure along the proposed failure surface 10
The length of the failure surface can be determined as: 11
𝐿 = 30" cos 45⁄ 12
= 42.4 "
𝑎 = 30" ∗ sin 45
= 21.2"
𝑃𝑛 ∗ 𝑎 = 𝑀𝑐𝑐 ∗ 𝐿 13
𝑃𝑛 ∗ 21.2" = 16.8 ∗ 42.4" 12⁄
𝑃𝑛 = 2.7 𝑘𝑖𝑘𝑘
The predicted value also compare well to the average load of 2.8 kips measured for eight tests. 14
15
16
17

Page 19 of 48
Case 5: Load at mid-span of free flange 1
The proposed failure mode for this case is flexure along the proposed failure surface 2
From the geometry of the failure surface: 3
t = thickness of flange 4
= 3.5” 5
𝐿 = 8𝑡 sin 20⁄ 6
= 81.8 "
𝑎 = 8𝑡 ∗ cos 20
= 26.3"
The load carried by each segment of the failure surface = 𝑃𝑛/2 7
𝑃𝑛2∗ 𝑎 = 𝑀𝑐𝑐 ∗ 𝐿 8
𝑃𝑛2∗ 26.3" = 16.8 ∗ 81.8" 12⁄
𝑃𝑛 = 8.7 𝑘𝑖𝑘𝑘
The predicted value compare well to the average load of 9.3 9
kips measured for four tests. 10
11
12
13
14
15
16
17
18
19
20
21

Page 20 of 48
<subhead 1> 1
Conclusions 2
Based on this study, the following conclusions and recommendations may be drawn: 3
1. CFRP grid can be used effectively as transverse flange reinforcement for prestressed 4
precast concrete double-tees. 5
6
2. The ultimate flange bending capacity is controlled by the flexural cracking capacity of 7
the flange. 8
9
3. Failures of flanges reinforced with CFRP grid are brittle, however, the load carrying 10
capacity is substantially higher than the specified factored load. 11
12
4. The concentrated load carrying capacity and failure surface of flanges reinforced with 13
CFRP grid is highly dependent on the location of the applied concentrated load. 14
15 5. The concentrated load carrying capacity for a connected pair of double tees is higher than 16
that for a free double tee. 17
18
6. For connected double tees, the location of the concentrated load with respect to the joint 19
had a significant effect on the ultimate capacity of the flange. 20
21
7. Idealized failure surfaces at various tested locations were developed for the free and 22
connected flanges and can be used to determine the concentrated load carrying capacity 23
of the flange. 24
25
26
27
28

Page 21 of 48
<subhead 1> 1
Acknowledgments 2
The authors would like to thank Altus-Group for supporting this research effort. They would 3
also like to thank Metromont Corporation for supporting the field trial at their Richmond, VA 4
facility. In addition, the authors are grateful to the staff and students at the Constructed Facilities 5
Laboratory at North Carolina State University for their help throughout the experimental 6
program. In particular, Mr. Johnathan McEntire was instrumental in the field testing program. 7
<subhead 1> 8
References 9
1. PCI Industry Handbook Committee. 2010. PCI Design Handbook: Precast and Prestressed 10
Concrete. 7th ed. Chicago, IL: PCI. 11
2. Rizkalla, S. and Tadros, G. 1994. A Smart Highway Bridge in Canada. Concrete 12
International, Vol. 16, Issue 6: pp. 42-44. 13
3. Rizkalla, S., Shehata, E., Abdelrahman, A., and Tadros, G. 1998. A New Generation: Design 14
and Construction of a Highway Bridge with CFRP. Concrete International, Vol. 20, Issue 6: 15
pp. 35-38. 16
4. Pessiki, S. and Mlynarczyk, A. 2003. Experimental Evaluation of Composite Behavior of 17
Precast Concrete Sandwich Wall Panels. PCI Journal, V. 48, No. 2: pp. 54-71. 18
5. Frankl, B., Lucier, G., Hassan, T., and Rizkalla, S. 2011. Behavior of Precast Prestressed 19
Concrete Sandwich Wall Panels Reinforced with CFRP Shear Grid. PCI Journal, Vol. 52, 20
No. 2 (Spring): pp. 42-54. 21
6. Sopal, G., Rizkalla, S., and Sennour L. 2012. CFRP Grid for Concrete Sandwich Panels. 22
Proceeding of the 2013 Asia-Pacific Conference on FRP in Structures (APFIS 2013), 23
Melbourne, Australia (December 11-13). 24
7. Naito, C., Hoemann, J., Beacraft, M., and Bewich, B. 2012. Performance and 25
Characterization of Shear Ties for Use in Insulated Precast Concrete Sandwich Wall Panels. 26
ASCE Journal of Structural Engineering, Vol. 138, Issue 1 (January): pp. 52-61. 27
8. Banthia, N., Al-Asaly, M. and Ma, S. 1995. Behavior of Concrete Slabs Reinforced with 28
Fiber-Reinforced Plastic Grid. Journal of Materials in Civil Engineering, Vol. 7.4: pp. 252-29
257. 30

Page 22 of 48
9. Matthys, S., and Taerwe L. 2000. Concrete Slabs Reinforced with FRP Grids. II: Punching 1
Resistance. Journal of Composites for Construction Vol. 4.3: pp. 154-161. 2
10. El-Gamal, S., El-Salakawy, E., and Benmokrane, B. 2005. Behavior of Concrete Bridge 3
Deck Slabs Reinforced with Fiber-Reinforced Polymer Bars under Concentrated Loads. ACI 4
Structural Journal, Vol. 102, Issue 5: pp. 727-735. 5
11. Lunn, D., Lucier, G., Rizkalla, S., Cleland, N., and Gleich H. 2012. New Generation of 6
Precast Concrete Double-Tees Reinforced with CFRP Grid. 7
12. ACI Committee 440. 2006. “Guide for the Design and Construction of Structural Concrete 8
Reinforced with FRP Bars (ACI 440.1R-06).” American Concrete Institute, Farmington 9
Hills, Michigan 10
13. ACI Committee 318. 2014. “Building Code Requirements for Structural Concrete (ACI 318-11
14)” American Concrete Institute, Farmington Hills, Michigan 12
13
<subhead 1> 14
Notation 15
16
𝜌𝑓 : FRP reinforcement ratio 17
𝐴𝑓: Area of FRP reinforcement 18
b: Width of the flange 19
d: Effective depth of the reinforcement 20
𝜌𝑓𝑓 : Balanced FRP reinforcement ratio 21
𝛽1: Factor relating the depth of the equivalent rectangular compressive stress block to the neutral 22 axis depth 23
𝑓′𝑐: Concrete compressive strength at 28 days 24
𝑓𝑓𝑐: Rupture stress of the FRP 25
𝐸𝑓: Modulus of elasticity of the FRP 26
𝜀𝑐𝑐: Concrete crushing strain 27

Page 23 of 48
𝜀𝑓𝑐: Rupture strain of the FRP 1
𝑀𝑛: Nominal moment capacity of the flange 2
𝑐𝑓: Distance from the extreme compression fiber to the neutral axis at the balanced strain 3 condition 4
𝑀𝑐𝑐: Cracking moment of the flange 5
t: Thickness of the flange 6
𝑃𝑛: Nominal concentrated load carrying capacity of the flange 7
𝑃𝑐: Factored design concentrated load 8
𝐿: Length of failure plane 9
a: Lever arm from the applied concentrated load to the failure plane 10
11
12
13
14
15
16
17
18
19
20
21
22

Page 24 of 48
<subhead 1> 1
About the authors 2
Gregory W. Lucier, is a Research Assistant Professor in the Civil, Construction and 3
Environmental Engineering Department and Manager of the Constructed Facilities Laboratory at 4
North Carolina State University. 5
Amir W. Botros, is a Ph.D. Candidate and graduate research and teaching assistant at the Civil, 6
Construction and Environmental Engineering Department, North Carolina State University, 7
Raleigh, NC. He obtained his B.Sc. and M.Sc. from Ain Shams University in Egypt. 8
Sami H. Rizkalla, PhD, FPCI, FACI, FASCE, FIIFC, FEIC, FCSCE, is a Distinguished Professor 9
of Civil Engineering and Construction, Director of the Constructed Facilities Laboratory, and 10
Director of the NSF Center on Integration of composite into infrastructural at North Carolina 11
State University. 12
Harry Gleich, P.E., FACI, FPCI is Vice President of Engineering for Metromont Corporation, 13
serves on many PCI committees including TAC and is the immediate past chair of R&D Council 14
for PCI and past chair of sandwich panels at PCI. At ACI he also serves on numerous 15
committees including former chair of ACI533 Precast Panels and is Chair of ACI550 Precast 16
Structures. 17
18
19
20
21
22
23
24
Page 25 of 48
<subhead 1> 1
Abstract 2
This paper presents an experimental program carried out to evaluate the performance of precast 3
concrete double-tee flanges reinforced with CFRP grid under various types of loading. The 4
experimental program is comprised of two different studies with a total of ten full scale precast 5
prestressed double tee beams subjected to uniform and concentrated loads applied to the top 6
surface of their flanges. The first study included testing two double tee beams with 2 and 3.5 in. 7
thick flanges to evaluate the behavior, including the flange bending behavior, under uniformly 8
distributed loads using an enclosed vacuum chamber. In the second study, a total of eight double-9
tees were tested either individually or in connected pairs to determine the load carrying capacity 10
of the flanges when subjected to concentrated loads applied at various points on the flange. Test 11
results from the first study indicated that the flanges were capable of resisting a maximum 12
applied load significantly higher than their factored design loads. Results of the second study 13
indicated that the concentrated load carrying capacity of the flange is highly dependent on the 14
location of the applied load. Based on this investigation, an idealized failure surface and the 15
corresponding mode of failure were identified for the free and connected flange of prestressed 16
concrete double tee subjected to concentrated loads. 17
<subhead 1> 18
Keywords 19
Double-tee, CFRP grid, flange bending, flange connections, uniform loading, concentrated 20
loading 21
22
23
24
25
26
27
28
Page 26 of 48
Figures 1
2
3
4
5
6
7
8
9 Figure 1: Test Setup for Double Tee Specimens 10
11
12
13
14
15
16
17
18

Page 27 of 48
1
2
3
Figure 2: Sketch of chamber cross section (top), the chamber under construction (left), 4 and the chamber prior to testing (Right) 5
6
7
8
9
10
11
12
13
14
15

Page 28 of 48
1
2
(a) 3
4
(b) 5
Figure 3: (a) Overview of DT1 failed flange, (b) CFRP Grid rupture 6
7
8
9
10

Page 29 of 48
1
2
3
4
Figure 4: Deflection profile for specimen DT1 5
6
7
8
9
10
11
12
13
-0.10
0.10.20.30.40.50.60.70.8
0 2 4 6 8 10 12
Mea
sure
d Ve
rtica
l Def
lect
ion
(in.)
Distance along DT Profile (ft.)
ServiceFactoredUltimate

Page 30 of 48
1
2
3
4
Figure 5: Measured strains for specimen DT1 5
6
7
8
9
10
11
12
13
14

Page 31 of 48
1
2
3
4
5
6
Figure 6: Specimen DT2 after failure and removal of chamber 7
8
9
10
11
12
13
14
15
16
17
Page 32 of 48
1
2
3
4
5
Figure 7: Vertical deflection profile for specimen DT2 6
7
8
9
10
11
12
13
00.20.40.60.8
11.21.41.61.8
2
0 2 4 6 8 10 12
Mea
sure
d Ve
rtica
l Def
lect
ion
(in.)
Distance along DT Profile (ft.)
ServiceFactoredUltimate

Page 33 of 48
1
2
3
4
5
6
Figure 8: Measured strains for specimen DT2 7
8
9
10
11
12
13
14

Page 34 of 48
1
2
3
4
5
6
7
8
9
10
11
12
13 14
Figure 9: Test setup and cracking patterns of concentrated load tests for 15 specimen DT2 16
17
18
19
20
21
22
Failure Plane
Page 35 of 48
1
2
3
4
5
6
Figure 10: The two types of flange connectors used in the program 7
(Straight connector, left; and twisted connector, right) 8
9
10
11
12
13
14
15
16
17
18

Page 36 of 48
1
2
3
4
5
6
7
8
Figure 11: Typical steel bars (both ends of beam) and 9 chord detail (one end of beam) 10
11
12
13
14
15
16
17
18
Page 37 of 48
1
2
3
4
5
6
7
8
Figure 12: Concentrated load test setup (two tees welded together) 9
10
11
12
13
14
15
16
17
18
19
Page 38 of 48
1
2
3
4
5
6
7
Figure 13: Loading plate at one side of the gap (left), and loading plate spanning the 8 gap for connected double tees (Right) 9
10 11
12
13
14
15
16
17 18

Page 39 of 48
1
2
3
4
5
Figure 14: Failure modes for selected load tests given in Table 4 6
7
8
(d) Test 19 Connected DTs- Mid span
Spans Gap
(e) Test 2B Connected DTs- Mid span
Side of Gap
(g) Tests 12 A&B Connected DTs- Mid span
Side of Gap
(c) Test 32 Free DT- Corner
(I) Test 38 Test at Connector
(h) Test 28 Free DT- Mid span edge
(a) Test 1A Connected DTs- Internal Corner
Side of Gap
(b) Test 11 Connected DTs- Internal Corner
Spans Gap
(f) Test 7A Connected DTs- Mid span
Side of Gap

Page 40 of 48
1
2
3
4
5
6
7
8
9
10
11 12
(a) 13
14
15
16
17
18
19
20
21
22
23 24
(b) 25
26
Figure 15: Load deflection for selected tests (a) Corner tests for connected DTs and 27 free DT (b) Mid span tests of connected DTs “Side of Gap” configuration 28
29
30
0
2000
4000
6000
8000
0 0.5 1 1.5 2
Appl
ied
Con
cent
rate
d Lo
ad (l
bs.)
Measured Deflection under Load (inches)
11 8
25 24
4B
4A 1A
1B
0
2000
4000
6000
8000
10000
12000
14000
16000
18000
0 0.5 1 1.5 2
Appl
ied
Con
cent
rate
d Lo
ad (l
bs.)
Measured Deflection under Load (inches)
2B 7B
6A
6B
7A

Page 41 of 48
1
2
3
4
5
6
7
8
9
10
11
12
13
Figure 16: Idealized failure surfaces for free flange 14 15
16
17
18
19
20
21
22
23
24
●: Applied Concentrated Load t: Flange thickness

Page 42 of 48
1
2
3
4
5
6
7
8
9
10
11
12
13
14
15
16
17
18
Figure 17: Idealized failure surfaces for connected flanges 19
20
21
22
23
●: Applied Concentrated Load t: Flange thickness
Page 43 of 48
Tables 1
2
3
4
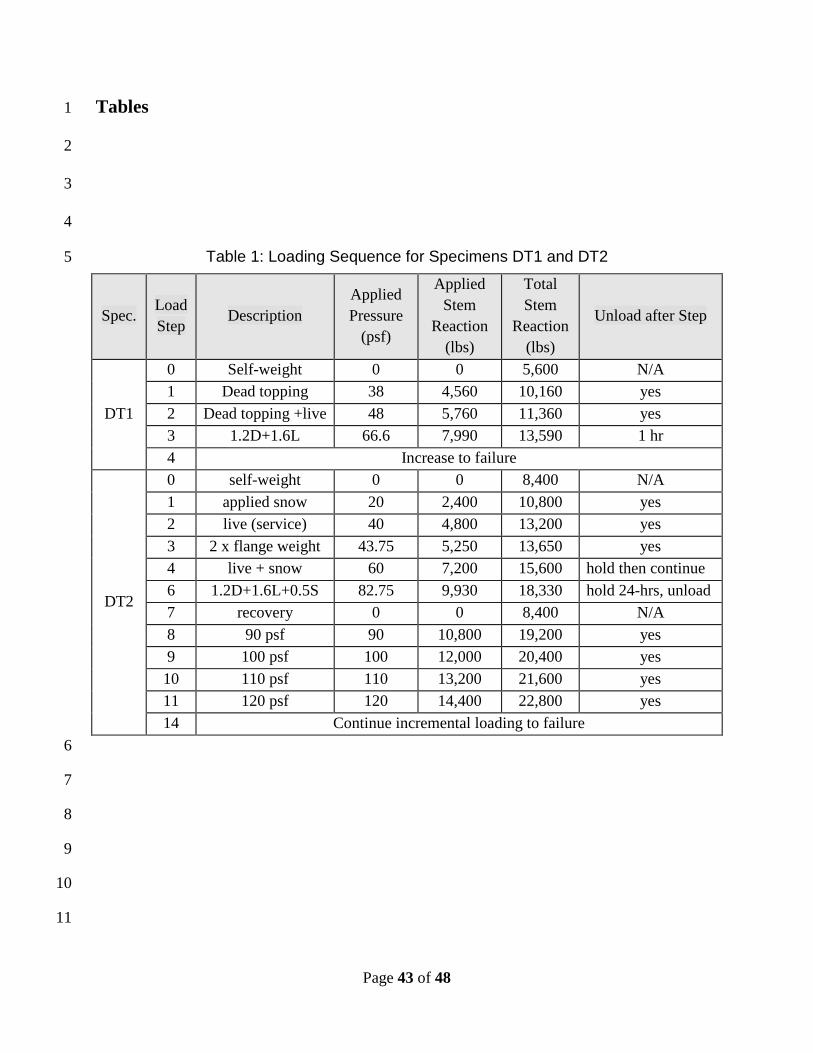
Table 1: Loading Sequence for Specimens DT1 and DT2 5
Spec. Load Step
Description Applied Pressure
(psf)
Applied Stem
Reaction (lbs)
Total Stem
Reaction (lbs)
Unload after Step
DT1
0 Self-weight 0 0 5,600 N/A 1 Dead topping 38 4,560 10,160 yes 2 Dead topping +live 48 5,760 11,360 yes 3 1.2D+1.6L 66.6 7,990 13,590 1 hr 4 Increase to failure
DT2
0 self-weight 0 0 8,400 N/A 1 applied snow 20 2,400 10,800 yes 2 live (service) 40 4,800 13,200 yes 3 2 x flange weight 43.75 5,250 13,650 yes 4 live + snow 60 7,200 15,600 hold then continue 6 1.2D+1.6L+0.5S 82.75 9,930 18,330 hold 24-hrs, unload 7 recovery 0 0 8,400 N/A 8 90 psf 90 10,800 19,200 yes 9 100 psf 100 12,000 20,400 yes 10 110 psf 110 13,200 21,600 yes 11 120 psf 120 14,400 22,800 yes 14 Continue incremental loading to failure
6
7
8
9
10
11

Page 44 of 48
1
2
3
4
5
6
Table 2: Ultimate Loads for Specimens DT1 and DT2 7
Load Level Total Load Resisted
by Flange (psf) DT1 DT2
Self Weight of Flange 25 43.8 Service Load (D+L) 73 83.8 Factored Load (1.2D+1.6L+0.5S) 91.6 126.6 Failure* 115.6 246.8 Failure Load / Service Load 1.6 2.9* Failure Load / Factored Load 1.3 1.9*
* Flange of DT2 did not fail. The test of DT2 was terminated with a 8 significantly- nonlinear load- deflection behavior at mid span. 9
10
11
12
13
14
15
16
17
18
19
20

Page 45 of 48
1
2
3
4
5
6
7
Table 3: Concentrated Load Results for Specimen DT2 8
Test Location Failure Load
(lbs.) Failure mode
(1) End of DT, Corner of Flange 2,530 Flexure (2) End of DT, Center of Flange 11,300 Punching (3) Midspan of DT, Edges of Flange 8,170 Flexure (4) Midspan of DT, Center of Flange 22,190 Flexure
9
10
11
12
13
14
15
16
17
18
19
20
21
22

Page 46 of 48
Table 4: Summary of Concentrated Load Tests for Connected Flanges 1
Configuration Plan View Connection Tests
Setup 1 DT001.1 and
DT001.2 6 Tests
Type I 1A, 1B, 2A, 2B, 3A, 3B
Setup 2 DT003.1 and
DT003.2 6 Tests
Type II 4A, 4B, 5A, 5B, 6A, 6B
Setup 3 Reuse
DT001.1 and DT001.2 5 Tests
Type I 7A, 7B, 8, 9A, 9B
Setup 4 Reuse
DT003.1 and DT003.2 9 Tests
Type II
10A, 10B, 11, 12A,
12B, 13, 14, 15, 16
Setup 5 DT001.3 and
DT001.4 5 Tests
Type I 17, 18, 19, 20, 21
Setup 6 Reuse
DT001.3 and DT001.4 5 Tests
Type I 34, 35, 36, 37, 38
Setup 7 DT002.1 6 Tests
None 22, 24, 26, 29, 31, 32
Setup 8 DT002.2 6 Tests
None 23, 25, 27, 28, 30, 33
2
DT001.1
DT001.2
1A
1B
3A
3B
2A
2B
DT003.1
DT003.2
4A
4B
5A
5B
6A
6B
DT001.2
DT001.1
8 9A
9B
7A
7B
DT003.2
DT003.1
10A
10B
12A
12B
11 13
14
16
15
DT001.4
DT001.3
18 171920 21
DT001.3
DT001.4
34 36 3537 38
DT002.1
24
22 26
29 32
31
DT002.2
23
25
27
28
30
33

Page 47 of 48
Table 5: Concentrated Load Test Results for Connected Flanges 1 Test ID
Test Description
Test Configuration Connectors Load
Location Load Point
Load (lbs.) Average Failure
mode 5A
Tests of Corners Without
Chord Steel
Connected DTs
Type II Internal Corner
Side of Gap
3,900
3326
Flexure 5B 3,300 Flexure
10A 3,080 Flexure 10B 3,024 Flexure 9A
Type I Internal Corner
Side of Gap
2,600
2898
Flexure 9B 2,800 Flexure 3A 3,294 Flexure 3B 2,897 Flexure 17 Spans
Gap 6,100 4600 Flexure
34 3,100 Flexure 30
Free DTs None Free
Corner N/A
2,700
2763
Flexure 33 3,100 Flexure 31 2,800 Flexure 32 2,453 Flexure 1A
Tests of Corners
with Chord Steel
Connected DTs
Type I Internal Corner
Side of Gap
4,310 4140 Flexure 1B 3,970 Flexure 4A Type II 3,400 3800 Flexure 4B 4,200 Flexure 8
Type I Internal Corner
Spans Gap
6,200 6166
Flexure 18 6,900 Flexure 36 5,400 Flexure 11 Type II 6,000 6000 Flexure 22
Free DTs None Free
Corner N/A
2,800
2821
Flexure 24 3,264 Flexure 23 2,638 Flexure 25 2,580 Flexure 2A
Tests Between
Connectors at Mid span
Connected DTs
Type I
Mid span
Side of Gap
14,800
15333
Punching 7A 14,952 Punching 7B 16,079 Punching 2B 15,500 Punching 6A
Type II
14,500
13875
Flexure 6B 12,600 Punching
12A 14,600 Punching 12B 13,800 Punching 19 Type I Spans
Gap 19,442 17521 Flexure
35 15,600 Flexure 26 Tests of Free
Edges at Mid span
Free DTs None Mid span
(edge) N/A
9,595
9347
Flexure 29 9,778 Flexure 27 9,773 Flexure 28 8,240 Flexure 15
Tests at Connector
Connected DTs
Type II 2nd Conn.
Side of Gap
12,521
13364
Flexure 13 4th Conn. 14,630 Flexure 20 Type I 2nd Conn. 11,956 Flexure 21 4th Conn. 12,023 Flexure 16 Type II 4th Conn. 15,066 Flexure 14 4th Conn. 13,985 Flexure 37 Type I 2nd Conn. Spans
Gap 13,800 13400 Flexure
38 2nd Conn. 13,000 Flexure

Page 48 of 48
1