1 Avon River - Wheatbelt NRM · PDF fileAvon River 2013 Strategy Review Page | 1 1 Avon River...
25
Avon River 2013 Strategy Review Page | 1 1 Avon River The Avon River is central to the character of the Avon Region. The river had a profound spiritual relevance to the Noongar people, and is still part of their songline dreaming trail. The Avon River is also significant to the broader community of the region, and in particular to those who reside in the Avon Arc. The Avon River drains into the Swan Canning estuary. The Avon and Swan Rivers are in fact a single river, with no confluence; the naming of the rivers is an historical anomaly. The river was first sighted by Ensign Robert Dale of the 63rd Regiment in August 1830 during one of his preliminary explorations eastwards of the Swan River settlement. Governor Stirling is thought to have named it after the Avon River in England (Landgate 2012). Prior to European settlement, the Avon River was a complex braided channel with many small channels interweaving between islands of vegetation. The riverbed supported many deep, shady pools and the associated woodlands supported a complex and dynamic ecosystem. After European settlement, the river was used as a domestic water supply, for watering stock, and as a source of fish and game, and formed the centre of many recreational activities for local residents. Land clearing of the Avon River catchment began early in the 1900s, yet the river maintained much of its original character until the 1940s and 1950s, after which the impacts of settlement, the river training scheme, grazing and salinity began to fundamentally change the character of the Avon River (WRC 2002a, WRC & ARMA 1999). Flooding of the riverside towns of Beverley, York, Northam and Toodyay and adjacent agricultural land resulted in the implementation of the River Training Scheme over 1956– 1972. Prior to this, there were 26 major pools on the Avon River between Walyunga National Park and the confluence with the Yenyening Lakes (WRC 2002a). Riparian vegetation and river pools are important environmental refuges of the Avon Arc sub-region, providing important habitat for aquatic and terrestrial flora and fauna. In addition, river pools and riparian vegetation are important in buffering water quality, including cycling of nutrients and controlling sediment loads within the river. 1.1 Hydrology The Avon is an extremely dynamic river, characterised by high flow variability. Streamflow is intermittent and responds rapidly to individual rainfall events. Annual flows can vary between 10–400 GL/year, with an average flow within the Avon at Northam of approximately 110 GL/year with a standard deviation of 100 GL.
-
Upload
truongdang -
Category
Documents
-
view
221 -
download
0
Transcript of 1 Avon River - Wheatbelt NRM · PDF fileAvon River 2013 Strategy Review Page | 1 1 Avon River...

Avon River 2013 Strategy Review
Page | 1
1 Avon River
The Avon River is central to the character of the Avon Region. The river had a profound
spiritual relevance to the Noongar people, and is still part of their songline dreaming trail.
The Avon River is also significant to the broader community of the region, and in
particular to those who reside in the Avon Arc.
The Avon River drains into the Swan Canning estuary. The Avon and Swan Rivers are in
fact a single river, with no confluence; the naming of the rivers is an historical anomaly.
The river was first sighted by Ensign Robert Dale of the 63rd Regiment in August 1830
during one of his preliminary explorations eastwards of the Swan River settlement.
Governor Stirling is thought to have named it after the Avon River in England (Landgate
2012).
Prior to European settlement, the Avon River was a complex braided channel with many
small channels interweaving between islands of vegetation. The riverbed supported
many deep, shady pools and the associated woodlands supported a complex and dynamic
ecosystem.
After European settlement, the river was used as a domestic water supply, for watering
stock, and as a source of fish and game, and formed the centre of many recreational
activities for local residents. Land clearing of the Avon River catchment began early in the
1900s, yet the river maintained much of its original character until the 1940s and 1950s,
after which the impacts of settlement, the river training scheme, grazing and salinity
began to fundamentally change the character of the Avon River (WRC 2002a, WRC &
ARMA 1999).
Flooding of the riverside towns of Beverley, York, Northam and Toodyay and adjacent
agricultural land resulted in the implementation of the River Training Scheme over 1956–
1972. Prior to this, there were 26 major pools on the Avon River between Walyunga
National Park and the confluence with the Yenyening Lakes (WRC 2002a).
Riparian vegetation and river pools are important environmental refuges of the Avon Arc
sub-region, providing important habitat for aquatic and terrestrial flora and fauna. In
addition, river pools and riparian vegetation are important in buffering water quality,
including cycling of nutrients and controlling sediment loads within the river.
1.1 Hydrology
The Avon is an extremely dynamic river, characterised by high flow variability.
Streamflow is intermittent and responds rapidly to individual rainfall events. Annual
flows can vary between 10–400 GL/year, with an average flow within the Avon at
Northam of approximately 110 GL/year with a standard deviation of 100 GL.
Avon River 2013 Strategy Review
Page | 2
The largest flood ever recorded on the Avon River was in 1872, well before clearing had
been undertaken within the catchment. The community living along the Avon River
expressed great concern during the flood of 1956, which caused serious flooding in
Northam, York and Toodyay. Other major flood years were 1872, 1910, 1917, 1926, 1930,
1945, 1946, 1955, 1958, 1963, 1964 and 1983 (WRC & ARMA 1999).
The annual flow cycle within the Avon River is characterised by three specific phases (GHD
2009):
Bank flow phase: medium to high flows, including bank flows and those
inundating associated floodplains
Wet connected phase: River pools are connected by flows allowing flora and fauna
to recolonise broader river areas from refuge pools
Wet isolated pool phase: pools contain water but are separated due to insufficient
base flow.
Several pools maintain permanent water over the summer months when the Avon River
ceases to flow (wet isolated pool phase). These pools are important summer refuges for
the aquatic and terrestrial fauna of the Avon, and the long-term sustainability of these
habitats is an important consideration for future water management planning within the
Avon Arc catchment (GHD 2009).
Water quality within Avon River pools appears to be influenced by groundwater discharge
as either seeping or upwelling, injecting fresh and/or saline plumes of groundwater into
river pools, particularly during summer months, and depending on surrounding
geomorphology and groundwater quality (Lewis 2008). The geomorphology and
hydrogeology of the Avon Arc is very complex and highly heterogeneous, made up of
many localised aquifers and interactions between surface and groundwater.
Groundwater systems are highly compartmentalised and influenced by localised
geological structures (Lewis 2008). Groundwater systems in the Avon region are
governed largely by interactions between river water levels, groundwater levels and
connectivity. As a result, development immediately adjacent to the river has the
increased potential to significantly affect the health of river pools and associated sections
of the Avon River.
Summer flow within the Avon River responds to sporadic rainfall events with nature of
flow determined by the extent and intensity of summer storms (Harris 1996). It is
estimated that at least 20 mm is required to initiate Avon River flow during summer, but
the amount of runoff occurring from individual storm events is governed by not only by
the amount of rainfall and intensity but also the amount of ground cover within the
catchment, which changes from year to year depending on winter rainfall and growing
conditions (Harris 1996). Summer flows are therefore relatively unpredictable,
particularly when compared to winter and spring flows when catchment vegetation
condition is less variable.

Avon River 2013 Strategy Review
Page | 3
1.2 River Training Scheme
The river training scheme operated between 1958 and 1972 and involved almost the
entire channel length of the Avon, from below Toodyay to Aldersyde – located
approximately 30km east of Brookton on the Avon River (Water and Rivers Commission
2002). River training involved:
Removal of channel vegetation and debris to a width of 60 metres
Removal of dead trees, logs and debris that impaired the river flow
Ripping of the river bed to induce erosion of a deeper watercourse
Removal of minor kinks and bends in the river.
(Water and Rivers Commission 2002).
Ripping the channel dramatically increased the amount of sediment in the river, causing
many river pools to partially or completely fill with sediment. The increased flow capacity
of the river channel resulted in the Avon River becoming less connection with the pre-
existing floodplain, as a result of reduced frequency of overbank flow. Floodplain
connection is generally important to nutrient and carbon exchange within river systems
and also to the lifecycle of many aquatic organisms. Removing connection from the
floodplain can influence the productivity of the entire river system (Thoms MC 2003).
The river appears to be moving toward a new structural equilibrium in some sections:
sand bars are reforming, and increased channel braiding, and regeneration of riparian
vegetation is evident. A study of the Boyagarra Pool section of the Avon River found that
aggregation of sediments and formation of lateral bars was slowly forming a braided
stream channel (Viney & Sivapalan 1999), but ongoing channel bank erosion throughout
the river means that erosion and sedimentation within the river is likely to continue for
the foreseeable future (WRC & ARMA 1999).
Attempts to restore the natural channel characteristics of the Avon River are likely to be
hindered by gaps in the knowledge regarding its fluvial mechanics, geomorphological
controls on channel characteristics, sediment transport and sediment yield (Southwell
1993).
1.3 Current River Condition
The condition of reaches of the Avon River and tributaries is well documented (DoW 2006
a-b, Dow 2007, WRC 1999 a-c, WRC 2001 a-b, WRC 1999, WRC 2001, WRC 2002 a-d, WRC
& AWC 2002). Fencing of large sections of the Avon River has occurred since 2005, largely
due to investment through the Wheatbelt NRM programs in association with the
Department of Water, which has markedly improved the condition of riparian vegetation.
Some of the published information regarding channel and riparian condition is likely to be
out of date because of the dynamic nature of the Avon River.
A detailed assessment of the Avon River’s condition, channel and bank stability and the
condition of riparian vegetation would provide additional insight into current priority
actions and a baseline for assessing the success of previous investment programs. It

Avon River 2013 Strategy Review
Page | 4
would also provide insight into which section of the river are stable and which are
changing more rapidly, important information when considering priority actions for
intervention and rehabilitation works.
It is estimated that more than 95% of the Avon River has been fenced and that significant
river recovery has occurred over the last decade as a result (Bern Kelly pers. comm. 2012)
However, many of the tributaries remain unfenced and foreshore assessments
undertaken in recent years indicate that large sections are degraded and poorly managed.
It is also generally accepted that much of the sediment contained within the Avon River
originates from its major tributaries. Tributaries typically have less riparian vegetation,
are less protected for grazing by domestic stock and have much higher natural gradients
that the Avon River.
1.4 Tributaries
There is a strong case for undertaking river management activities on the major
tributaries to the Avon River in addition to further management of the Avon River itself).
The tributaries contribute significant sediment loads, nutrients, salinity and other
management challenges to the Avon River.
In this document, the Avon River tributaries have been split into functional units based on
key geographical boundaries. Differences in landscape and geomorphology mean that
different tributaries contribute significantly different volumes and quality of flow to the
Avon River. Consequently, different river landscape units present different risks to the
river, and different management priorities exist for different tributaries. Individual
tributaries and river landscape units for the Avon River are presented in Figure 1.

Avon River 2013 Strategy Review
Page | 5
Figure 1. River Catchments of the Avon Arc

Avon River 2013 Strategy Review
Page | 6
1.4.1 Mortlock River East
The Mortlock River East extends south and east of Northam, draining a massive area of
neighbouring shires to the Avon River. The 356,000 ha primary catchment almost
completely engulfs the Shires of Cunderdin and Tammin, and extends into the Shires of
York and Quairading. A secondary catchment, containing an extensive lake system,
extends north over an additional area of approximately 630,000 ha within the Shires of
Wyalkatchem, Koorda and Dowerin.
Whilst the Mortlock East contributes a relatively small volume of flow to the Avon River
as its catchment extends into the dryer and less incised central Wheatbelt, it does
contribute significant nutrient and salt loads.
1.4.2 Mortlock River North
The Mortlock River North extends north of Northam, draining the Shires of Goomalling
and Wongan–Ballidu. The primary catchment extends over an area of 265,000 ha, with a
secondary catchment, containing an extensive lake system, extending over a further
415,000 ha.
The Mortlock River North contributes significant flow, salt and nutrients, particularly total
phosphorus (TP), to the Avon River. The Department of Water’s water quality monitoring
for 2006–2008 found that approximately 40% of TP readings from the Mortlock River
system exceeded the Wheatbelt NRM target of 0.1 mg/L. By way of comparison, only
13% of samples collected from the Avon River upstream of its confluence with the
Mortlock River exceeded the threshold of 0.1 mg/L for the same period (DoW 2009a).
1.4.3 Spencers Brook
Spencers Brook is a relatively minor tributary, draining an area of approximately 36,000
ha. Local anecdotal evidence suggests deep seasonal pools were located within Spencers
Brook before settlers began clearing native vegetation, but pools have subsequently filled
with sediment. Spencers Brook responds to high-intensity short-duration rainfall events
with sharp peak flows that result in bank erosion, which contributes to downstream
sedimentation in the Avon River (WRC 2002c).
1.4.4 Wongamine Brook
Wongamine Brook is a relatively minor tributary, draining an area of 21,500 ha to the
north of the Northam town site, extending into the Shire of Toodyay.
1.4.5 Toodyay Brook
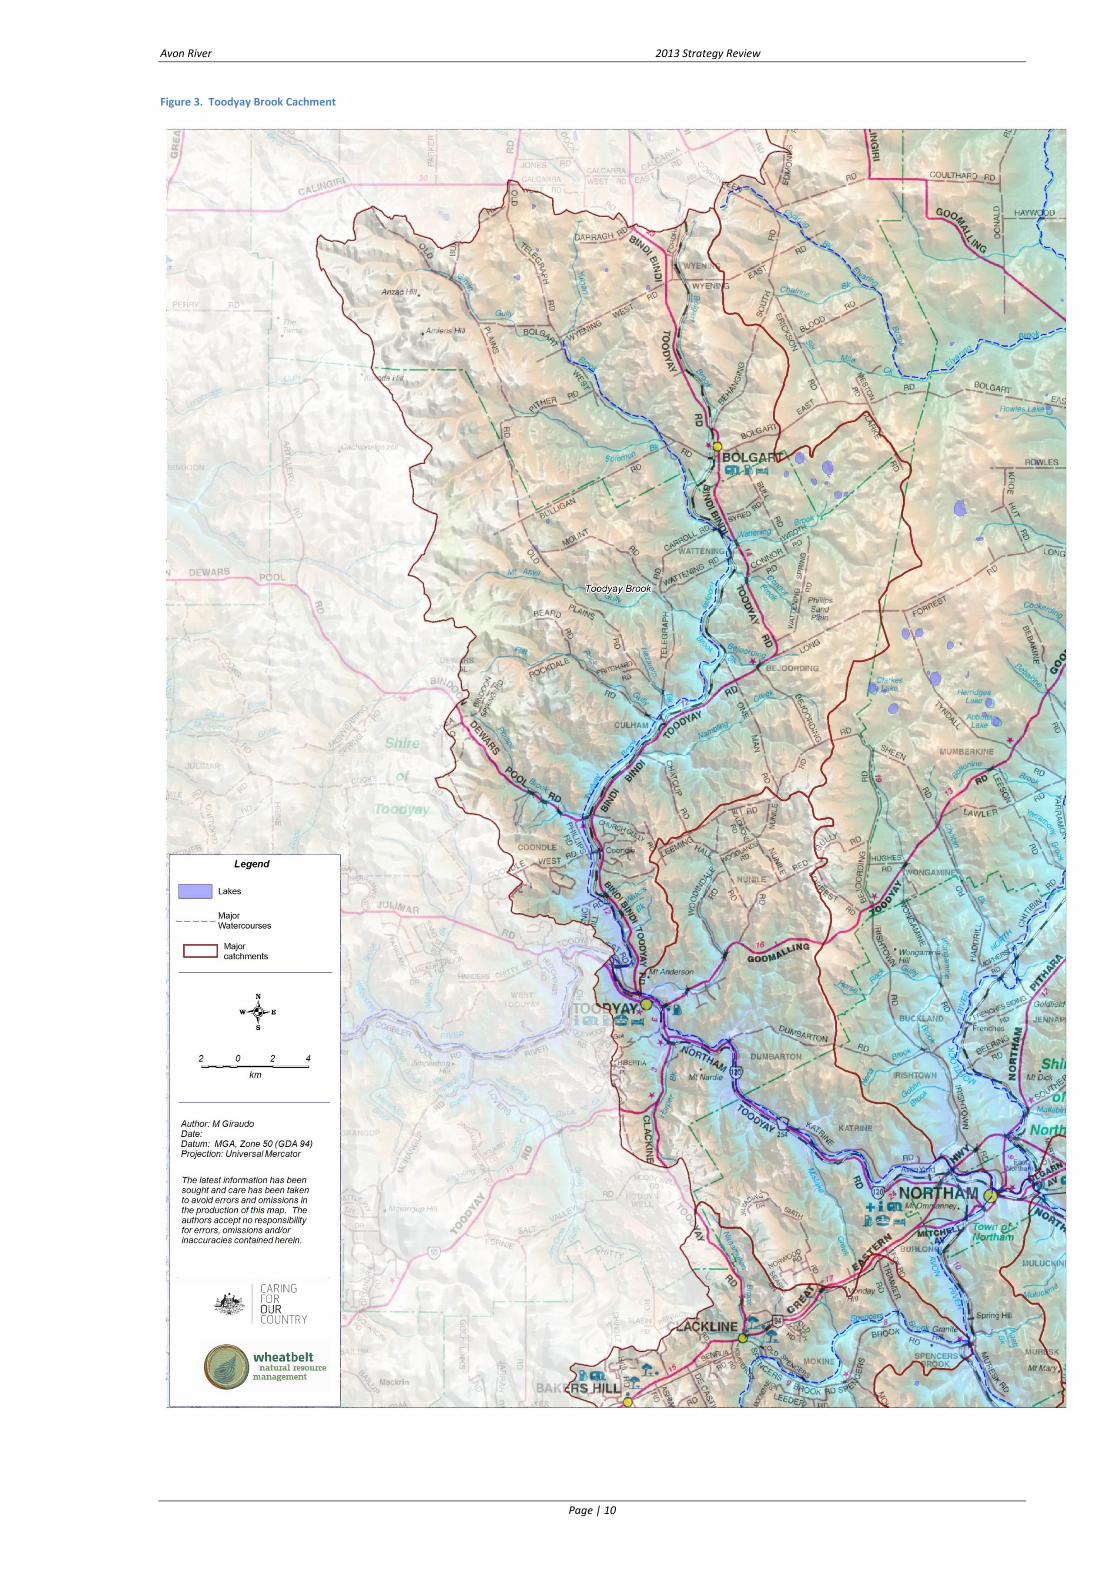
The Toodyay Brook extends approximately 48.5 km north of Toodyay into the Shire of
Victoria Plains and is fed by an 83,500 ha catchment characterised by steep shedding
slopes and incised valleys (WRC 2001b).
Avon River 2013 Strategy Review
Page | 7
Previous foreshore assessment indicates that many sections of the Toodyay Brook are
under threat of degradation from development pressure and inappropriate land use.
Stream erosion and control of stock access to the foreshore channel are considered high
management priorities (WRC 2001b).
The overall poor condition of the Toodyay Brook and in particular the extent of erosion
and sedimentation presents a risk to downstream riverine environments within the Avon
River.
1.4.6 Jimperding Brook
Jimperding Brook extends approximately 18 km south of the Avon River at Jimperding
Pool and is fed by a 19,500 ha catchment, contained predominately within the Shire of
Toodyay. Tributaries include Jingaling Brook, Gabidine Brook, Jim Crow Gully and Little
Jimperding Brook.
Jimperding Brook contains four deep pools and numerous cobblestone riffles, although
the condition of the Brook is generally considered degraded due to:
Active bank erosion, particularly in areas without appropriate fringing vegetation,
exacerbated by impacts of stock access
Significant areas of gully erosion, with Jimperding Brook likely to be a significant
source of sediment entering Jimperding and Long Pools
Grazing by domestic stock impacting regeneration of natural riparian vegetation
Agricultural environmental weed infestation of the riparian zone
Insufficient high quality fencing – only approximately 11% of Jimperding Brook has
been fenced to control stock access. (DoW 2008)
Effective management of current and future development pressure on the Jimperding
Brook will improve the health of downstream Avon River environments, and in particular
the health of river pools. Improved management of Jimperding Brook is highly
recommended to improve downstream river health (DoW 2008).
1.4.7 Mackie River
The Mackie River is approximately 46 km in length, fed by a catchment of approximately
326.5 km2, located predominantly within the Shires of York and Beverley.
The Mackie River delivers saline inflow to the Avon River but salt loads have not been
quantified. Historically the Mackie River contained a series of deep river pools, but these
pools have become shallow as a result of sediment deposition and no longer provide
important ecological refuges.
The banks of the Mackie River are dominated by York gum (Eucalyptus loxophleba),
flooded gum (Eucalyptus rudis) and Jam tree (Acacia acuminata). Areas of secondary
salinity and significant weed infestation are common along the length of the river (WRC
2001a).

Avon River 2013 Strategy Review
Page | 8
Land use in the Mackie catchment is predominantly agricultural, mainly sheep and wheat,
but there is an increasing tendency towards hobby farming and subdivision of rural farms
into smaller lots.
A survey of bank stability in 1995 indicated that approximately 70% of the banks of the
Mackie River were in poor condition and subject to erosion. Erosion and sedimentation
along the river links is common and the Mackie River is considered to be a significant
source of sediment influencing downstream Avon River pools (WRC 2001a).
1.4.8 Thirteen Mile and Warranine Brooks
The Thirteen Mile and Warranine Brooks feed the downstream Spencers Brook,
discharging to the Avon River within the Shire of Northam.

Avon River 2013 Strategy Review
Page | 9
Figure 2. Mortlock Nth Catchment
Avon River 2013 Strategy Review
Page | 10
Figure 3. Toodyay Brook Cachment

Avon River 2013 Strategy Review
Page | 11
Figure 4. Talbot and Spencers Brook Catchments

Avon River 2013 Strategy Review
Page | 12
Figure 5. Mortlock East Catchment

Avon River 2013 Strategy Review
Page | 13
Figure 6. Mackie River Catchment
Avon River 2013 Strategy Review
Page | 14
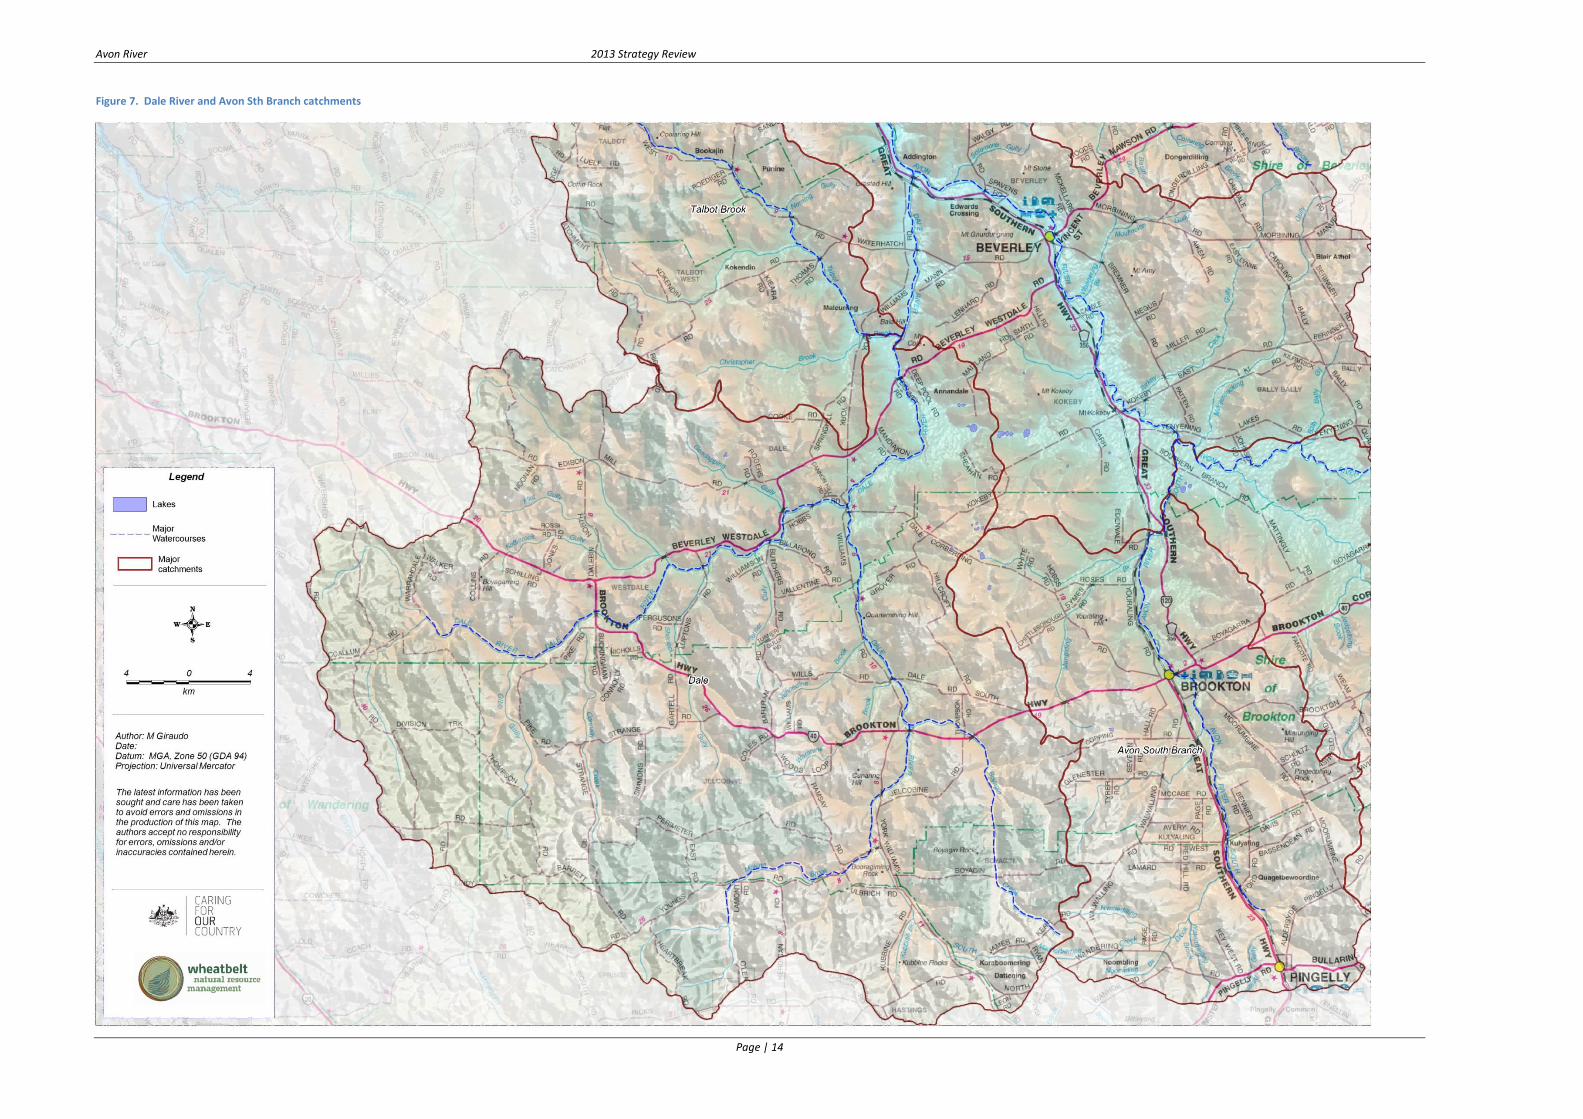
Figure 7. Dale River and Avon Sth Branch catchments

Avon River 2013 Strategy Review
Page | 15
Figure 8. Avon River South Catchment

Avon River 2013 Strategy Review
Page | 16
1.5 Water Quality
1.5.1 Salinity
In the early days of settlement the Avon River was utilised for watering domestic stock
during summer months, small-scale irrigation and industrial purposes. A flour mill is
reported to have had to stop operating during the summer of 1912 as a result of brief
saline flows within the Avon River, indicating that some saline discharge from the
Yenyening Lakes occurred early in the 20th century (Sanders, 1991).
Salinity has been monitored in the Avon River at Northam Weir since 1977, producing a
flow-weighted salinity range of between 3,000–8,000 mg/L with no clear historical trend.
However, the salinity of flows appears to have increased since the mid-1990s, consistent
with reduced flow for the same period (Mayer et al. 2005, GHD 2009). Salinity of flows in
the Avon River at Northam Weir is highly variable, ranging between 1,000–20,000 mg/L.
Variations of up to 10,000 mg/L can occur in a single year, with the greatest variation
occurring during early season flows, typically during early winter(GHD 2008).
Variations in flow are reflective of the complex upstream riverine system, with flow
contributions from very different sub catchments, including the Mortlock, Dale, South
Avon and Yenyening Lakes (Salt River) systems. In addition, seasonal and decadal
variations in rainfall, delayed impacts of rainfall trends and clearing of native vegetation,
in addition to changing land management practice, mean that trends in water quality are
extremely difficult to predict.
Flow-weighted salinity analysis of the Yilgarn and Lockhart Rivers indicates a rising salinity
trend since 1976. There is an increasing salinity trend within the base flow of these
eastern tributaries, reflective of salinity development trends within the central and
eastern sub-regions of the Avon River basin. No upward or downward trend within the
Avon River at Northam are consistent with a slowdown in salinity development within the
Avon Arc, indicating the likelihood of stabilisation of salinity within the western extent of
the ARB.
1.6 Nutrients
The Avon River is estimated to contribute approximately 69% of total Nitrogen (TN) and
43% of total Phosphorous (TP) loads to the Swan Estuary (DOW 2009a).
Eutrophication of the Avon River has been identified as a major threat to the health of the
river and downstream receiving environments, including the Swan Canning Estuary.
Many River pools within the river are seasonally eutrophic and some pool sediments
contain high concentrations of phosphorus (WRC 1999, WRC 2002a, WRC 2002b). The
interaction between mobilisation of sediment within the river and nutrient loads is not
well understood, but sediment may be a significant driver for nutrient fluxes within the
river. Better understanding the nature of sediment nutrient flux is essential to developing
appropriate management actions.

Avon River 2013 Strategy Review
Page | 17
Land use in the immediate Avon River catchment is predominately agricultural,
accounting for 90% of the catchment. Peri-urban and urban areas account for 1.2% of the
catchment, with the remaining 9% under native vegetation.
Preliminary water quality analysis suggests that 92% of TN and 98% of TP in the Avon
River at Toodyay originates from farmland. Urban and peri-urban environments are
estimated to contribute the remaining 8% of TP load and 2% of TN load to the Avon River
(WNRM 2011a, WNRM 2011b, WNRM 2011c). It is also estimated that TP loads from
urban and peri-urban sources will double over the coming decades due to projected
population growth within the Avon Arc (WAPC 2001).

Avon River 2013 Strategy Review
Page | 18
1.7 Key Stressors
Table 1 contains descriptions of the key stressors of aquatic environments in the ARB.
Table 1. Stress Factors Impacting Aquatic Environments (ANRMA 2011, Beecham 2002, Keighery and Lyons 2001, DoW 2006a-b, Dow 2007, WRC 1999a-b, WRC 2001a-b, WRC 2002a-g, WNRM 2009a).
Threat (Stressor) Details
Broad-scale vegetation clearing
Broad-scale clearing of valley floor vegetation has resulted in removal of vast areas of riparian vegetation and isolation of many riparian and aquatic environments. More than 70% of wetlands within the region have suffered medium to severe impacts from surrounding land use
Salinity and waterlogging
The region displays a rich and endemic aquatic microinvertebrate fauna, which is under threat from the altered hydrology associated with clearing and secondary salinisation. Changes to rainfall–runoff relationships and hydro-period due to clearing are additional stressors for aquatic flora and fauna, exacerbated by increasing salinity and decreasing pH of surface water flow. Approx. 40% of fauna are considered vulnerable to salinity
Sedimentation Sedimentation is a key stressor of habitat within the Avon River and its major tributaries. Large sediment loads occurred as a result of the River Training Scheme and loss of riparian vegetation. Revegetation and fencing to exclude grazing along the Avon in recent years is believed to have stabilised much of the river, however unstable tributaries remain a major source of sediment load
Eutrophication Nutrient loads to aquatic systems within the region from agricultural land, urban and peri-urban environments remain a major stressor.
Urban environments within the Avon Arc currently contribute 8% of all TP loads to the Avon River at Toodyay, and this load is expected to double in the next 20 years
Pollution Agricultural herbicides and pesticides, hydrocarbons and toxic metals discharging from urban catchments, and low pH discharge containing heavy metals from agricultural drainage are potentially lethal stressors to receiving aquatic environments
Reduced flow Climate change predictions are for reduced overall rainfall, particularly winter rainfall, longer periods of drought and more frequent and severe episodic events
Future climatic conditions are likely to result in decreased frequency of flow, increased frequency and severity of large episodic events and longer periods without flow, further impacting the nutrient and sediment dynamics of aquatic systems
Surface water modelling indicates that a predicted 10% reduction in rainfall will result in a 30%–40% reduction in runoff
Increasing temperature
Increased temperature may damage sensitive aquatic flora and fauna and affect their life cycles and recruitment. Increasing aridity and fire regimes may significantly affect riparian vegetation, particularly in the eastern areas of the region where traditional fire regimes are considered to have been less frequent.

Avon River 2013 Strategy Review
Page | 19
Land management practice is the key driver for ecological impacts to river health, riparian
vegetation and water quality in disturbed riverine systems. Understanding the linkages
between potentially hazardous land management practice, impacts and water quality
indicators helps in developing appropriate management responses. These linkages are
presented in Table 2.
Table 2. Land Management Impacts
Land Management Impacts Water Quality Indicators
Management Response
Agricultural and stormwater drainage
Direct impact of water quality discharge
Salinity, pH, nutrients, metals
Land use planning and regulation
Dams and water resources
Reduction in flow Salinity, reduced flow, nutrients
Land use planning and regulation
Management of tributaries
Sediment and nutrient mobilisation
Sediments, nutrients Planning and direct investment
Agricultural practice Ground cover, fertiliser management, grazing management
Salinity, pH, nutrients, metals, sediments, channel stability, reduced flow, weed invasion, fire
Education and industry engagement
Change in land use Urban & peri-urban development, industrial and commercial land use impacts, point source impacts from feedlot or wastewater treatment systems, abattoirs, refuge sites
Increased nutrients, changed hydrology, increase in dams, fire management, physical disturbance, weed invasion
Land use planning and regulation

Avon River 2013 Strategy Review
Page | 20
Figure 9. Key Aquatic Health Indicators and Thresholds (adapted from ANZECC 2000)
Indicator Threshold
Flow 30% decline in flow
Total suspended solids 10 mg/L
Riparian buffer – main river channel 30m – 3 trophic layers
Riparian buffer – minor trib 10m – 2 trophic layers
Total Phosphate (TP) 0.06 mg/L
Total Nitrogen (TN) 1.0 mg/L
Ammonia (NH4) 0.08 mg/L
Salinity (Western province) – refer Figure 1 3,000 mg/L
Salinity (Central province) refer Figure 1 7,000 mg/L
Salinity (Eastern province) refer Figure 1 10,000 mg/L
Lake Salinity Lakes < 30 g/L for 150 days (2 yrs/10)
< 45 g/L for 150 days (3 yrs/10)
Magnesium (Mg) 1000 mg/L
pH (Cacl) 6.5 – 8.0
Nickel (Ni) 15 ug/L
Zink (Zn) 30 ug/L
Copper (Cu) 2.5 ug/L
Cobalt 90 ug/L
Aluminium 0.08 mg/L
Boron 0.68 mg/L
Manganese 2.5 mg/L
Chromium 1.8 ug/L
Selenium 11 ug/L
Cadmium 0.4 ug/L
Lead 5.4 ug/L
Changes to land use represent potentially manageable hazards to aquatic receiving
environments. Risks to aquatic ecosystems resulting from development include direct
impacts associated with the removal and disturbance of native vegetation and wetland
environments to changes in hydrology and water quality.
These hazards include:
Loss of ground cover and riparian vegetation due to over grazing
Leaching of nutrient from fertilisers

Avon River 2013 Strategy Review
Page | 21
Sediment activation through gully and bank erosion and activation of bed
sediments, particularly in tributaries of the Avon River
Agricultural drainage, and in particular deep drainage intended to drain saline,
often acidic groundwater
Point source nutrient discharge, including from piggeries, stockyard, feedlot or
wastewater treatment systems, abattoirs, refuge sites etc.
Stormwater management and impacts of new urban and peri-urban development
particularly adjacent to the river and its tributaries
Increase in catchment dam storage
Reduced runoff associated with changing regional climate patterns.
1.8 Summary
The Avon River is central to the character of the region and contributes significant flow
and nutrient load to the Swan Canning Estuary.
The geomorphology of the river is complex and highly heterogeneous made up of many
local aquifers and displays strong surface – groundwater interactions and was
characterised by frequent flooding in the first half of the twentieth century.
Implementation of the river training scheme between 1958 and 1972 completely changed
the character of the Avon River. The most significant changes included increase in the
channel capacity and sediment load within the river, resulting in reduced over-bank flow
and filling of many of the river pools with sediment.
More recently the river appears to moving towards a new geomorphic equilibrium,
however many parts of the river remain unstable and sediment loads remain relatively
high, particularly during larger flow events.
Previous investment has resulted in approximately 95% of the river being fenced and local
anecdotal evidence suggests that the riparian zones of the river are recovering as a result
of this recent investment. However, tributaries typically have little riparian vegetation
and are generally considered to be a significant source of sediment to the main Avon
River channel.
The Avon River is estimated to contribute approximately 69% of total Nitrogen (TN) and
43% of total Phosphorous (TP) loads to the Swan Estuary. Eutrophication is considered a
primary ecological threat to the aquatic health of the river and projected urban and prei-
urban growth within the Avon Arc is likely to place additional stress on river health.
Projected climate change is also likely to result in degreased river flows, potentially
resulting in increased concentration of nutrients and other solutes including salinity as a
result of reduced dilution.

Avon River 2013 Strategy Review
Page | 22
The river is impacted by a range of stressors and threats, including potential changes in
land management with the catchment. These changes in land management practice
include:
Agricultural and stormwater drainage.
Increased water harvesting for dams and water resources.
Management of tributaries, including agricultural impacts.
Agricultural management practice, including fertiliser and grazing management.
Changes in land use and in particular further urban and peri-urban development.

Avon River 2013 Strategy Review
Page | 23
1.9 References
ANRMA 2011. Australian Natural Resource Management Atlas, online 2011.
http://www.anra.gov.au/topics/vegetation/assessment/wa/ibra-mallee.html
Beecham B 2002. Avon Wheatbelt IBRA Sub Region Biodiversity Strategy Case Study.
ANRA, Australian Government . www.anra.gov.au/topics/vegetation/pubs
DoE (2009 - unpublished) Yenyening Catchment Engineering Salinity and Water
Management Feasibility Project. Unpublished report commissioned by Department of
Environment, Perth. Prepared by GHD.
DoW 2006a Upper Avon River Recovery Plan; Section 20 – Yearlering Lakes, Report No
RRP 12, December 2006, Department of Water, Perth
DoW 2006b River Recovery Plan, Foreshore and Channel Assessment; Section 19 –
AldersydeKweda, Report No RRP 11, December 2006, Department of Water, Perth.
DoW 2007 Avon River Catchment Water Quality and Nutrient Monitoring Program for
2006, Department of Water, Perth
DoW 2009a Nutrient Management for the Avon River Basin – A Tool Kit for Managing
Nutrient Loss to the Environment from a Range of Land Uses. Department of Water,
Western Australia.
Harris, T. F. W 1996 The AVON an Introduction, Water and Rivers Commission, Perth, W.A
Keighery G, Lyons M 2001. Existing and potential natural diversity recovery catchments
indicative list. Department of Conservation and Land Management, 3 p.
Landgate 2012 History of River Names.
http://www.landgate.wa.gov.au/corporate.nsf/82289d1c922cd5eec82573620022343a/9
0a30ca470a2f19f4825799c00333cad?OpenDocument
Lewis F, 2008 Avon River Floodplain Salinity: Kweda to Gwambygine Pool. Faye Lewis
Consulting. Report for the Department of Water, Western Australia. July 2008
Southwell, C.E (1993) A preliminary study of the bed load regime response of the Avon
River to channelization. Waterways Commission. Report 36.
SRT 2009. Swan Canning Water Quality Improvement Plan. Swan River Trust, East Perth.
Thoms MC 2003. Floodpalin – river ecosystems: lateral connections and the implications
of human interference. Geomorphology Journal 56 (2003) pp. 335-349. Co-operative
Research Centre for Freshwater Ecology, University of Canberra, Canberra, ACT 2601,
Australia
Viney, N.R., and Sivapalan, M., 1999. A conceptual model of sediment transport:
application to the Avon River Basin in Western Australia. Hydrol. Process., 13, 727-743.

Avon River 2013 Strategy Review
Page | 24
Water and Rivers Commission and Avon River Management Authority 1999 Avon River
Management Programme. Water and Rivers Commission, Water Resource Management
Series No WRM 11.
WAPC 2001 Avon Arc Sub-Regional Strategy. Western Australian Planning Commission,
Perth.
WNRM 2009a Environmental Water Flow Requirements – Report by GHD for Surface
Water Self-Sufficiency Project - Wheatbelt NRM (formerly Avon Catchment Council).
Northam, Western Australia
WNRM 2009b Preliminary Water Management Plan – Background Paper, Shire of York.
Wheatbelt NRM, Northam Western Australia
WNRM 2011a Background Paper – Stormwater Quality for the Shire of Northam.
Wheatbelt NRM, Northam, Western Australia.
WNRM 2011b Background Paper – Water Management Plan – Stormwater Assessment –
Shire of York. Wheatbelt NRM, Northam Western Australia.
WNRM 2011c. Background Document – Stormwater Management Shire of York.
Wheatbelt NRM, Northam Western Australia.
WRC 1999a River Recovery Plan Section 5– Toodyay. Water and Rivers Commission
Western Australia Report number RRP1, February 1999.
WRC 1999b River recovery plan section 6 – Northam. Water and Rivers Commission
Western Australia. Report number RRP2.
WRC 1999c River Recovery Plan Section 10 – York. Water and Rivers Commission Western
Australia, Report number RRP3.
WRC 2001 Foreshore and Channel Assessment of Toodyay Brook. Water Resources
Management Series Report WRM22. Water and Rivers Commission (Department of
Water), Perth.
WRC 2002a Avon Waterways Committee River Recovery Plan Sections 1 and 2 – Avon
Gorge and Deepdale Valley. Water and Rivers Commission Western Australia, Report
number RRP7
WRC 2002b Avon Waterways Committee River Recovery Plan Sections 4 and 5 – Northam
to Toodyay. Water and Rivers Commission Western Australia. Report Number RRP8.
WRC 2002c Avon Waterways Committee River Recovery Plan Sections 7, 8 & 9 – Mile Pool
to Spencers Brook. Water and rivers commission Western Australia, Report number RRP9.
WRC 2002d Avon Waterways Committee River Recovery Plan; Section 13 – Beverly
Townsite to Edwards Crossing, Report No RR4, Water and Rivers Commission January
2002.

Avon River 2013 Strategy Review
Page | 25
WRC and ARMA 1999 River Recovery Plan; Section 6 – Northam, Report No RR2, Water
and Rivers Commission and Avon Rivers Management Authority, May 1999.
WRC and AWC 2002 River Recovery Plan, Sections 4 and 5, Northam to Toodyay, River
Recovery Plan Series No RRP 8, Water and Rivers Commission and Avon Waterways
Committee, October 2002.