1 August 29, 2017 Version - Health Data Collaborative · Vertical Health Program vis-à-vis HMIS 80...
196
1 | August 29, 2017 Version
Transcript of 1 August 29, 2017 Version - Health Data Collaborative · Vertical Health Program vis-à-vis HMIS 80...
1 | August 29, 2017 Version

2 | August 29, 2017 Version

3 | August 29, 2017 Version
Table of Contents Table of Contents 3
Acknowledgments 11
Executive Summary 12
Background 12
Aims 12
Target Audience 14
Guidance Structure 14
The Guiding Principles used in Building this Document 15
Chapter 1: Foundational Concepts for CHIS 16
Introduction 16
Foundational Terms for CHIS 16
Community 16
Community Health Worker (CHW): 17
Community Health Information System (CHIS) 19
How is a CHIS Different from a HMIS? 20
Five Design Principles for Implementing CHIS 23
Design Principle 1: Strengthen Government Ownership and Sustainability of the CHIS 23
Design Principle 2: Enable and Strengthen Community Engagement 24
Design Principle 3: Build a Balance between Reporting Burden and Provision of Care 24
Design Principle 4: Strengthening Capacity Development Processes of All CHIS Stakeholders 25
Design Principle 5: Follow Incremental and Evolutionary Principles of System Design and
Development 26
Chapter 2: Conducting a CHIS Assessment 27
Introduction 27
Why Do an Assessment? 27
Assessment at the Macro Level: Policy and Health System Issues 28
Pre-Assessment: Stakeholder Identification 28
The CHIS Assessment Tool 30
Assessment at the Macro Level: An Example 31
Conducting the Assessment 32

4 | August 29, 2017 Version
Interpreting the results 33
Assessment at the Micro Level: A Case Study 34
Assessment Framework 35
The Assessment Process 37
Focus Group Discussion 37
Field Visit 37
Training and Participatory Prototyping and Assessment 38
Advocacy, Planning, and Data Dissemination 39
Data Analysis and Reflections 39
Data Standardization 39
Fragmentation of HIS 40
Information Use and Demand 40
Recommendations from the Assessment Exercise 41
Building Synergies from Macro and Micro Level Assessments 42
Synergies between the Macro and Micro-Levels of Assessment 42
Chapter 3: Data Quality and Use 44
Introduction 44
The Virtuous Cycle of Data Use and Data Quality 44
Strengthening Supply Side: Essential Elements of Data Quality 45
Data Quality Tools in DHIS2 46
Additional Data Quality Resources 48
Strengthening Demand Side: Understanding Levels of Data Use 49
Client/Beneficiary Level 49
Facility Level 50
Health Systems Level 50
Principles to Enhance Data Use 51
1. Decentralized Use 51
2. Engaging Stakeholders 52
3. Strengthening Feedback Mechanisms 53
Guidance on Developing Feedback Mechanisms 55
4. Promote Data Use at community level 59

5 | August 29, 2017 Version
5. Develop Community Action Plans 60
6. Develop CHIS M&E framework 62
7. Build community Capacity for data use 63
Storytelling 63
Encourage friendly competition 63
Empower Community Champions 64
Stimulate local action 64
Case study: Local use of Information in Indonesia 65
Chapter 4: Sustainable CHIS DHIS2 Design and Architecture 67
Introduction 67
CHIS System Design, Develop, Test, and Deploy Process: 68
1. Mapping Current State Business Processes 68
2. Considerations in Translating Business Process to DHIS2 69
Logic of Data Aggregation 69
Reporting Periods/Frequency 71
Organization Units and Hierarchy 72
Case 1 - One or more CHW work in specific villages (BUT NOT in other villages). 73
Case 2 - CHW works in several villages/communities. CHWs DO NOT share villages. 74
Case 3 – CHW works in more than one village/community 75
Case 4 - CHW goes to more than one village. 75
Case 5 - CHW is assigned to a village as a user but not represented in the hierarchy. 76
Case 6 - Community data is submitted as aggregate at facility or higher level. 77
Case 7 - Representing a CHW as Category Option 78
Keeping the Organizational Hierarchy Clean 79
Scale - How big is too big for the hierarchy? 79
Vertical Health Program vis-à-vis HMIS 80
Partner Reporting 80
Outputs: Internal and External 80
Infrastructure Considerations 80
Technology Considerations for Data Acquisition I.e. Tool Selection 82
Security 83

6 | August 29, 2017 Version
3. Develop Mock-Ups and Prototypes of Analytics Outputs (Feedback Mechanisms) 83
4. Drawing CHIS Data Flow in DHIS2 85
5. Developing Reporting Guidelines 85
Frequent Questions on Data Capture Guidelines 86
6. Develop CHIS Meta-Data Dictionary 87
7. Perform DHIS2 Configuration 87
8. Populate Prototype Database and Test 87
9. Deploy 88
Tiered Technical Support to CHISs 89
Some Design Guidelines for More Sustainable CHIS 91
Participatory Design Approach 91
Architectural Thinking at the Core of Design 92
Design to Support Local Action 93
Adopt Hybrid Approaches 94
Design CHIS based on existing strengths 95
Interoperability with DHIS2 in CHIS 96
Why Interoperability? 96
Use Cases of Interoperability 97
Open Data Kit (ODK) – DHIS2 97
CommCare – DHIS2 97
Excel Import – DHIS2 97
SMS Data Import – DHIS2 98
Open MRS and DHIS2 Interoperability 98
Technical Approach for Interoperability 99
For ODK and CommCare Cases 99
Excel Import to DHIS2 100
For OpenMRS-DHIS2 Interoperability 101
SMS Import in DHIS2 102
India Use Case - Mobile Based Reporting by CHWs 104
SMS-Based Reporting for HMIS in Punjab, India 104
MHealth-Based Reporting for HMIS in Punjab 104

7 | August 29, 2017 Version
Issues and Challenges Experienced 107
Punjab SMS-Based Cancer Survey Reporting Use Case 109
Data flow 110
The Capacity Building Process 110
Himachal Pradesh SMS-Based HMIS Reporting Use Case 111
SMS Gateway Solution 112
Capacity Building Process 113
Issues and challenges 113
Chapter 5: Training and Supervision 115
Introduction 115
Training needs assessment 115
Requirements for a Sustainable CHIS Training Strategy 115
Some questions to address in the CHIS training needs assessment 116
Planning CHW training requirements 117
Physical requirements for training 118
Training Plan 118
Who to Train? 119
What to Train? 120
Technical skills 120
Public Health skills 121
When and Where to train? Modes of Capacity Strengthening 122
1 Pre-Service Training 123
Training Protocols 125
2 In-service training 127
Post-Training Supervision and Support 128
Types of Supervision: 130
In-Person Supervision 130
Remote Supervision 131
Supervision Protocol 132
Targeting Supervision 133
Data Quality during Supervision 135

8 | August 29, 2017 Version
On-the-Job Support during Supervision 135
After Supervision 136
Scheduling 137
Example of a Supervision Schedule 137
Budgeting 138
Training CHW College Lecturers and CHW Coordinators 139
Core team 140
Preparations for Training 140
Budgeting 140
Technical Preparations 141
Event Space and Agendas 142
Materials 142
Sample Material List 142
Evaluation of Training 144
Chapter 6 Sustainability and Governance 145
Introduction 145
What Do We Mean by Sustainability? 145
Ensuring CHIS Sustainability 146
CHIS Governance 148
Governance implications for donors and government 149
Governance of Data Management 150
Formal Governance Structures 152
Mission Statement 152
Organizational Chart 152
Effective participation structures 152
Reporting Structures 153
Master Facilities List 153
Planning Structures 153
Policies and Procedures for Data Management Governance 154
CHIS Regulatory Authority 154
E- Health and Information and Communication Technology Policies 154

9 | August 29, 2017 Version
CHIS Data Governance Plan Based on Best International Practices 155
Data Standardization Policies, Framework, and Procedures 155
Metadata stewardship 156
Data Quality Assessment and Auditing 156
Data Standards 156
Standard Operating Procedures (SOPs) 157
Overview 158
SOP Best Practices 158
CHIS Staffing and Workforce Planning and Development 159
Monitoring and Evaluation 161
Maintaining CHIS Quality 161
Technical Determinants 161
Organizational Determinants 161
Behavioral Determinants 161
Assessing CHIS Functionality 161
Assessment methods 162
Decentralised Self-Assessment 162
Health Metrics Network Assessment Framework 162
The PRISM Framework 163
Conclusion 163
Case Study: Community Led Total Sanitation from Zambia 164
Government involvement and Ownership 164
Capacity Development 165
Feedback to Stakeholders 165
Involvement of chiefs 165
CHIS Development 168
SOP Development 169
Lessons learned 171
Case Study Liberia Community Based Information System (CBIS) 172
The National Community Health policy and programs 172
Community Health Services Vision 173

10 | August 29, 2017 Version
Key figures in Liberia’s CHA program structure 173
Community 173
Community Health Assistant (CHA) 173
Community Health Services Supervisor (CHSS) 174
Officer in Charge (OIC) of the Facility 174
Community Health Services Focal Point (CHFP) 174
The CBIS 174
Service Delivery Package and Data Sources 175
Liberia Data Flow 175
Reporting Timeline 176
Data Use 176
Data Use at the CHA level 176
Data Use at the CHSS (facility) level 176
Data Use at County level 177
Data Use at Central level 177
Appendices 178
Assessment at the macro level: using the CHIS assessment tool 178
Conducting the assessment 178
Interpreting the results 179
CHIS Assessment Tool 181

11 | August 29, 2017 Version
Acknowledgments
These guidelines were made possible the Health Data Collaborative (HDC). The HDC is a global
network working to strengthen country-led health information systems. The HDC is composed of
several working groups and subgroups, including the Community Data Working group; whose
objectives, broadly speaking are 1) to develop global goods, including standards, generic guidance
and operational tools for community health information systems (CHIS) as an integrated
component of broader RHIS; 2) identify ways in which investments in improving CHIS as integrated
component of RHIS can be better harmonized at country level; and 3) promote and provide
coordinated financial and technical support to governments for strengthening CHIS based on joint
investment plans at country level.
These guidelines have been developed by the DHIS2 Health Information Systems Program (HISP) at
the University of Oslo (UiO) in collaboration with Akros Zambia. This work is based on 20 years of
action research at UiO, and active engagement from the global DHIS2 network. Valuable inputs, use-
cases, and best practices have been included from the Ministries of Health of Liberia, India,
Ethiopia, Malawi, Zambia, Uganda, Afghanistan, Nepal, Zimbabwe, Tanzania, South Africa, Ghana,
Bangladesh, and Nigeria. Additional inputs, use-cases, and edits have been provided by Last Mile
Health, UNICEF HQ, HISP India, HISP Tanzania, HISP South Africa, HISP Namibia, HISP East Africa,
HISP Bangladesh, HISP Zimbabwe, Measure Evaluation, CDC, JSI, and UNICEF West Africa.
Copy right: Akros, Inc.

12 | August 29, 2017 Version
Executive Summary
Background
The University of Oslo (UiO) was commissioned by the Global Fund, as part of the action plan of the
Community Data Working Group of the Health Data Collaborative1 to develop a “guidance
document” on community health information systems (CHIS), training curriculum, and modular
toolkit for routine CHIS as an integrated component of routine health information systems (RHIS).
The key outputs envisaged through this process included the following:
i) A practical guidance document to strengthen the design, development and use of CHIS
(paper and digital). This guide should cover data collection, data management –
including integration of parallel CHIS reporting into Routine Health Information
Systems (RHIS) such as DHIS2 and interoperability between CHIS and other information
systems (e.g. LMIS, HRIS, disease surveillance) serving community-based health service
providers – data analysis, use and dissemination for community-based health services.
ii) Development of a generic curriculum on CHIS for DHIS2 Academies and other pre-
service and in-service training opportunities (e.g. in-country training institutions,
training of trainers).
iii) Development of a Toolkit, Standard Operating Procedures (SOPs), sustainability and
governance guidelines to aid the practical development and use of a CHIS in a field
setting.
Aims
This guidance document aims to serve as a practical guide for national and local-decision makers
involved in the design, planning, deployment, governance and scale up of successful DHIS2 based
CHIS that support community-based health service providers and the communities they work in.
This guidance covers the full information cycle, including: data collection, analysis, dissemination
(feedback loops) and use/action taking for improved and equitable community-based health
services.
It provides an in-depth review of key questions that should be considered when addressing issues
relevant for governance, design, development and use of large-scale CHIS. It is applicable to
countries that are beginning the design process as well as for existing systems that are being
strengthened, scaled up or integrated with other information systems such as the facility based or
RHIS. It is meant to provide general guidelines whose applicability must be considered and
adapted to different country and within country contexts.
1
13 | August 29, 2017 Version
Community health data is broad and complex in terms of how it is produced, who produces it, how
it is used (or not) and who uses it (or not)2. This guide focuses primarily on community health
workers (CHW) programs and their routine information needs with direct links to the formal health
system; starting with information needs of CHWs and other community-based providers and
support at facility, district, and higher levels. While the CHW is the primary focus of our analysis,
the guidelines actively consider the linkages of the system of the CHW with other stakeholders at
the community and health system levels. In considering these multi-level linkages, this guide also
looks at sustainable governance and advocates an architecture based approach to avoid the
problem of the CHIS being considered as a standalone system, rather than as an entity within a
broader ecosystem of HISs which need to speak to each other for an effective CHIS.
The evidence base for this guidance document is derived from the broad experience of the more
than two decades of Health Information Systems Program (HISP) research and development
initiative of the UiO3. This led to the commissioning of this document, where specific experiences of
CHIS in different country contexts such as Zambia, India, Ethiopia, Liberia, Uganda, Indonesia and
others were examined to build case studies, insights, lessons and practical exercises on different
facets of building a CHIS, including monitoring of integrated community case management (iCCM)4.
The specific value add that this guidance document seeks to provide includes:
i) Provides insights into the building of a CHIS while considering, in a holistic manner, the work context of a CHW, and the particular complexities of their information needs.
ii) Adopts an architecture approach to enable viewing the challenge of building a sustainable and well-governed CHIS which is interconnected with other systems such as RHIS, logistics, human resources and others.
iii) Builds upon a wealth of practical and research experience, and adapts this to the complex particularities of a CHIS.
iv) Highlights that building a CHIS is a socio-technical and not just a technical challenge, and the people and institutional considerations must be treated with equal importance as the technical.
2 We define community health data as data on health, health services, and determinants of health derived from and relevant to community administrative/geographic units, community members, and/or the community level of health systems. 3 This initiative, which has action research at its core, has effectively combined research, education, and practical systems development including of the DHIS2 platform and its application to over 60 country contexts. While the primary focus of the HISP efforts to date has focused on facility based information systems, the value of the practical and educational experience is acknowledged by the global community for the building of CHIS. 4 Guenther, T., et al. (2014). Routing monitoring systems for integrated community case management programs: Lessons from 18 countries in sub-Saharan Africa, Journal of Global Health, 4 (2):1–8. Available at (accessed May 2017): http://www.jogh.org/documents/issue201402/Guenther_Final.pdf

14 | August 29, 2017 Version
Target Audience
While acknowledging there is a multiplicity of stakeholders engaged in the development of CHIS
like ministries, donors, software vendors, private sector, and NGOs, we believe one document
cannot detail relevant recommendations for all these audiences. We have, therefore, focused on the
primary audience to be the national Ministry of Health (MoH) of countries. Ministries of health are
ultimately the stewards and owners of the CHIS and key beneficiary in using the information
generated from the CHIS for strengthening their CHW programs and achieving global and national
health reform goals of Universal Health Coverage (UHC), Sustainable Development Goals (SDGs)
and others. The primary audience for these guidelines are the policy makers in MoH designing
sustainable and well governed CHIS that support community health systems and their
implementing team, including district, community health managers, and CHWs.
The secondary audience for this guidance includes other relevant stakeholders supporting
community health systems and CHIS such as:
● Development agencies and donors who provide technical assistance, governance
oversight or financing to community health programs and CHIS.
● Universities and “capacity builders” since many CHIS have their capacity building efforts
institutionalized at universities.
● Private sector practitioners, NGOS and other providers of community services who are
engaged in bridging the gap between private and public service providers (e.g. BRAC in
Bangladesh, or PSI for malaria in Cambodia)
We hope this guidance can provide insights to these groups on the complexities of CHIS and
approaches to their governance and sustainable development, which they can then adapt to their
particular use cases.
Guidance Structure
These generic guidelines are organized around the key components which describe the evolution
of CHIS built in DHIS2 from its initial planning and assessment phase through to achievement of
sustainability through government maintenance and cultivation of community ownership.
As such, it is structured as follows:
● Chapter 1 covers an Introduction to CHIS, including foundational concepts relevant to a
CHIS.
● Chapter 2 covers an Assessment tool to help assess the state of an existing CHIS, and
provides for a diagnosis on how to plan for a CHIS.

15 | August 29, 2017 Version
● Chapter 3 covers Data Use and Action taking based on a CHIS primarily from the perspective
of the community.
● Chapter 4 covers guidelines on how to configure DHIS2 to the meet the needs of a CHIS.
● Chapter 5 covers Training and Support to discuss how plan systems that meet the crucial
challenge of capacity strengthening for effective use of CHIS.
● Chapter 6 concludes with guidance on governance and sustainability of CHIS, addressing the
issues of participation, accountability and transparency within a MoH and including policies
and Standard Operating Protocols (SOPs) to guide the design, development and use of CHIS.
The Guiding Principles used in Building this Document
The following key principles have been taken into consideration when developing the guide:
● Treat CHIS as part of broader strategy and architecture and develop sustainable governance
systems to ensure interoperability.
● Seek to harmonize donor, country, and partner efforts while keeping the national MoH at
the center, always.
● Consider the CHIS in its broader supporting roles of advocacy, policy, communication and
not just reporting.
● Build on what exists and have integration as a guiding principle to help move beyond siloed
disease programs and other data sources into the national HMIS (e.g. DHIS2 as is the case in
many countries).
● Seek to actively work towards reducing the data management burden of CHWs and enable
those individuals to adopt processes of data use for local action taking.
● Adopt a multi-sectoral approach and move beyond the “health sector”, as in the case of
planning SDGs.
In each chapter, we formulate a set of design and implementation principles which provide
takeaways to guide the design, management, implementation and use of CHIS. These principles are
not meant to be prescriptive “how to do it” guides, but rather to highlight a set of issues that a
reader must be sensitive to in order to build a CHIS. Through case studies, examples, exercises, and
discussions we seek to provide alternatives on how to approach these different issues and the
contextual considerations that need to be incorporated.

16 | August 29, 2017 Version
Chapter 1: Foundational Concepts for CHIS
Introduction
This chapter outlines some foundational concepts relevant to the understanding of CHIS, their
nature, scope and purpose. Further, we discuss some key “design principles” that underlie this
entire approach to community health information systems.
Learning Objectives:
By the end of this chapter, readers should be able to:
● Build an understanding of foundational concepts of community, community health worker
(CHW) and community health information system (CHIS).
● Understand the important role of information in the work of a CHW, and how the landscape
of demands for information are radically and fast changing.
● Describe the diversity that is inherent in CHIS across and within countries, and the relevant
contextual parameters to consider in building a CHIS.
● Outline the design and implementation characteristics of a successful CHIS.
● Explain the guiding design principles for building an effective CHIS using DHIS2, and how
these should be used.
Foundational Terms for CHIS
To understand where CHIS is used, by whom, and what it is, we briefly outline some fundamental
concepts of a community, CHW and CHIS.
Community
A community can be considered a social unit, such as a group of people, who have something in
common, such as norms, values, or identity. Communities usually share a sense of place that is
situated in a given geographical area, such as village or neighborhood. For purposes of provision of
community health services, a community includes a set of stakeholders who meet one or more of
the following conditions:
● Reside in a defined geographic area.
● Share demographic traits (e.g. children under five, pregnant women).
● Behavioral or occupational characteristics (e.g. sex workers, truck drivers).
● Situational factors (e.g. orphans, prisoners).

17 | August 29, 2017 Version
In addition to the residents of the community, who are beneficiaries of health services being
provided by the CHW, the community also includes others such as local political or religious
leaders, village or tribal chiefs and other local decision-makers serving in policy or legislative roles,
overseeing local resource allocation, identification of individuals or families in need of services, or
similar capacities. The proposed CHIS which we build needs to also incorporate the information
needs of these stakeholders in addition to that of the health department.
Community Health Worker (CHW):
A widely accepted definition of a CHW was proposed by a WHO Study Group (WHO 1989):
Community health workers should be members of the communities where they work, should be
selected by the communities, should be answerable to the communities for their activities, should
be supported by the health system but not necessarily a part of its organization, and have
shorter training than professional workers.
This 20th century definition is based on global principles and does not directly address the
numerous variations that exist around CHWs across countries. We discuss some conditions of
variations which arguably have implications on the design and use of CHIS. These include:
i) Do they have to be community members or can they be "known and respected by the
community."
ii) Do they have to be literate? Many CHW programs insist on literacy and with increasing
technology, the ability to use a mobile phone is increasingly in demand.
iii) Who hires them? While in many countries the CHWs are recruited by the Ministry of Health
and are members of the health system, in many countries, CHWs are hired and managed by
development partners or local NGOs.
iv) Are they salaried or voluntary or incentivized? CHWs can either be salaried (paid by the
Ministry or the Development Partner), be voluntary in nature, or paid through some form of
incentive systems.
v) What tasks are they responsible for? In some scenarios, the CHWs perform a wide range of
primary health care related tasks that can be preventive, curative, and developmental,
while, in other cases, CHWs may be hired for very specific interventions or to support
certain health campaigns.
These variations in recruitment, modes of payments and activities performed by the CHW all have a
bearing on the CHIS. For example, a voluntary worker or one hired by a development partner will
not have the same degree of accountability to the national CHIS as those hired by the MoH. CHWs
working on specific campaigns may not have the responsibility to report into a routine and ongoing
CHIS.
Regardless of the scope of services, community activities that are measured by the CHIS need to be
carefully planned from the outset and well-supported financially and technically, with strong
managerial and political leadership from all levels. The scope of measurement needs to, at a
minimum, encompass and support the activities that the CHW performs including:

18 | August 29, 2017 Version
● Providing care and appropriate referrals for patients/ beneficiaries.
● Engaging with communities and their leaders.
● Providing information, education, and communication (IEC) activities.
● Promoting public health in other locally specific actions.
● Recording and reporting data to higher levels on activities performed and diseases
identified for surveillance.
● Managing stocks and inventory.
● Providing training and supervising community-based activities.
● Managing incentives to strengthen enrollment of beneficiaries in health programs.
Some of these activities such as patient care, community engagement, and IEC are mainly done by
CHWs, while others (stock management, training, incentives) require ongoing support and
supervision from the facility level. All of these activities need to be measured and supported by the
CHIS that is simple, appropriate and locally useful to CHWs and their supervisors. Furthermore,
there is a continually changing context of CHW work which has significant implications on the
information needs of the CHW and the CHIS. For example, while effective and low-cost
interventions to improve maternal and child health and survival are well known and practiced,
achieving universal health coverage of such services remains a challenge. Now, dealing with non-
communicable diseases (NCDs) under universal health coverage is emerging as a new challenge.
This requires different kinds of data to be collected that are case and transaction based rather than
aggregate, collected over time rather than one time, and have a key focus on provision of continuity
of care within an equity based framework.
The unsolved, existing challenges, the new frontiers of information, coupled with the continued and
acute shortage of CHWs5 makes the challenge of designing effective CHIS an urgent priority which
this guidance document seeks to address. Supported by a well-functioning CHIS that brings all
community-related data into one, easily accessible place, CHWs can make a valuable contribution to
overall community development and can improve access to and coverage of communities with
basic health services and undertake actions that lead to improved health outcomes, especially in the
field of primary care. CHWs represent an important health resource whose potential in providing
and extending a reasonable level of health care to underserved populations must be fully tapped.
Further, in order to implement, support, learn from and measure aspects related to community
health listed above, a well-functioning CHIS is necessary.
5 World Health Report, 2006

19 | August 29, 2017 Version
Community Health Information System (CHIS)
A working definition of CHIS adopted for this document is
“A CHIS is a combination of paper, software, hardware, people and process which seeks to support
informed decision making and action taking of CHWs. This includes:
● Recording of basic data such as population, health program transactions, case based
data, stock and resource availability
● Tracking and taking action on individual program based needs such as disease
surveillance, mortality and morbidity
● Reporting and feedback including routine upward reports, feedback reports, ad hoc
reports and specific reports for different stakeholders”
A CHIS is visualized by the information cycle (see Figure 1.1) for community health information.
The information cycle starts with decisions made or actions taken by the CHW at the community
level, clarifies data sources and collection methods, describes data aggregation and processing as
well as mechanisms for communication with higher levels, including data into the overall HIS and
getting expert analysis and interpretation.
While the details of this cycle will vary from program to program, and at different levels, the
principle applies to all information systems.
Figure 1 The health Information cycle
20 | August 29, 2017 Version
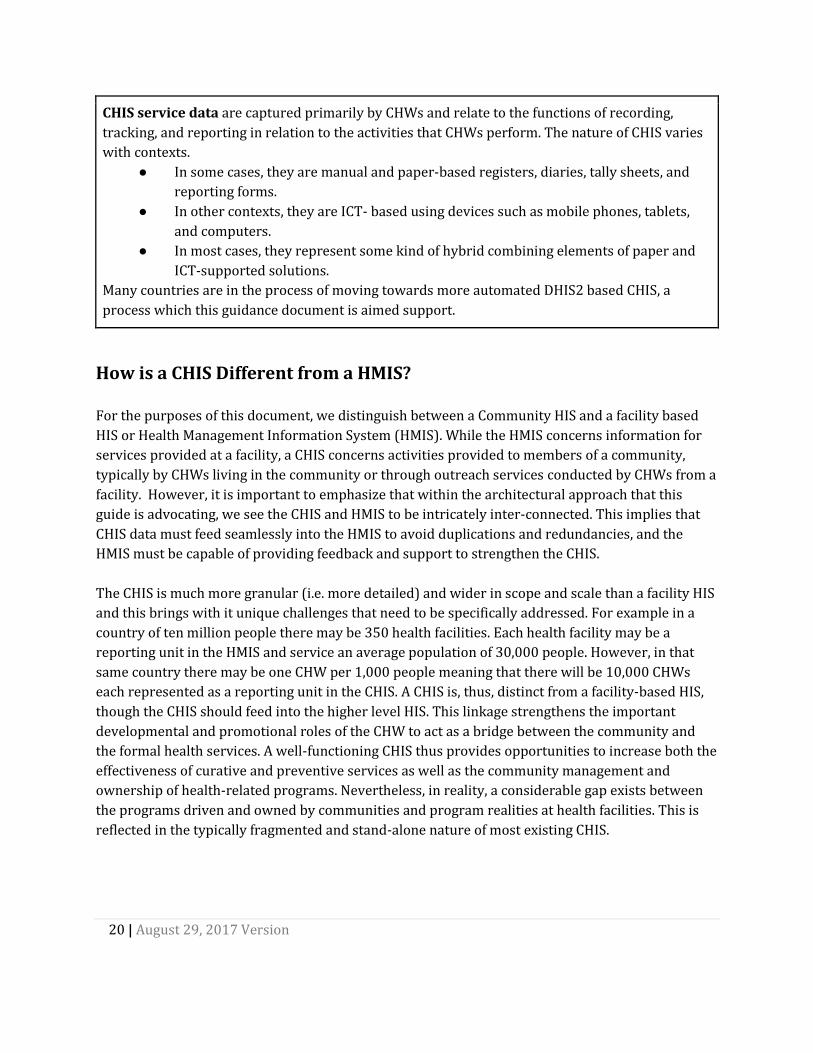
CHIS service data are captured primarily by CHWs and relate to the functions of recording,
tracking, and reporting in relation to the activities that CHWs perform. The nature of CHIS varies
with contexts.
● In some cases, they are manual and paper-based registers, diaries, tally sheets, and
reporting forms.
● In other contexts, they are ICT- based using devices such as mobile phones, tablets,
and computers.
● In most cases, they represent some kind of hybrid combining elements of paper and
ICT-supported solutions.
Many countries are in the process of moving towards more automated DHIS2 based CHIS, a
process which this guidance document is aimed support.
How is a CHIS Different from a HMIS?
For the purposes of this document, we distinguish between a Community HIS and a facility based
HIS or Health Management Information System (HMIS). While the HMIS concerns information for
services provided at a facility, a CHIS concerns activities provided to members of a community,
typically by CHWs living in the community or through outreach services conducted by CHWs from a
facility. However, it is important to emphasize that within the architectural approach that this
guide is advocating, we see the CHIS and HMIS to be intricately inter-connected. This implies that
CHIS data must feed seamlessly into the HMIS to avoid duplications and redundancies, and the
HMIS must be capable of providing feedback and support to strengthen the CHIS.
The CHIS is much more granular (i.e. more detailed) and wider in scope and scale than a facility HIS
and this brings with it unique challenges that need to be specifically addressed. For example in a
country of ten million people there may be 350 health facilities. Each health facility may be a
reporting unit in the HMIS and service an average population of 30,000 people. However, in that
same country there may be one CHW per 1,000 people meaning that there will be 10,000 CHWs
each represented as a reporting unit in the CHIS. A CHIS is, thus, distinct from a facility-based HIS,
though the CHIS should feed into the higher level HIS. This linkage strengthens the important
developmental and promotional roles of the CHW to act as a bridge between the community and
the formal health services. A well-functioning CHIS thus provides opportunities to increase both the
effectiveness of curative and preventive services as well as the community management and
ownership of health-related programs. Nevertheless, in reality, a considerable gap exists between
the programs driven and owned by communities and program realities at health facilities. This is
reflected in the typically fragmented and stand-alone nature of most existing CHIS.

21 | August 29, 2017 Version
A typical CHIS needs to focus on the following areas:
1. Patients treated, referrals, and drug availability: CHIS should measure CHW
program performance in terms of patients treated, referrals and drug availability. Note
that health worker performance also depends on many other aspects of management
such as selection, training, supervision and support, which are measured elsewhere.
2. Clients attending primary health care (PHC) activities: Use of CHW programs can be
measured by the number of clients seen for different PHC activities - preventive,
promotive, rehabilitative, and curative. Results are linked to community involvement in
the program and community preference for formal, established health services if they
are available.
3. Reporting rates: Retention/ attrition is measured by numbers of CHWs reporting each
month. High attrition rates (3 to 77 percent a year) have been reported in many CHW
programs and causes major problems that need to be dealt with through refresher
training and the broader package of management interventions.
A well-functioning CHIS, just as HMIS, is a balancing act between getting the data you need
(complexity), expanding the system to cover all services across the whole country (scale), and
minimizing costs. Typically, the goal of a HMIS would be to find a balance between these three
factors: scale, complexity, and cost. However, from experience, it is exceptionally difficult or nearly
impossible to find this
balance between all
three factors for a
CHIS primarily due to
the massive scale and
scope of a CHIS.
Therefore, for the
purposes of these
guidelines, a CHIS
implementer should
initially focus on
picking two of the tree
factors. Most
countries will be
likely to prioritize a
CHIS that is large in
scale and low-cost,
but this requires that
the complexity must
be minimized and tightly controlled. Practically, minimizing complexity results in a very simple

22 | August 29, 2017 Version
reporting platform capturing a small number of key indicators, extensive use of job aids and
automated feedback mechanisms to help CHWs and CHW supervisors understand their data and
perform tasks. From a governance perspective, adding additional reporting burden to CHWs must
be minimized and tightly controlled centrally.
Strengthening CHW work through improved CHIS runs contrary to the typical perception that
health professionals have of CHWs as mere aides who should be assistants within health facilities
and serve as passive data providers. Such a perception completely misunderstands the CHWs
health promoting and enabling roles within communities, and the need for the CHWs to be
empowered with relevant information. In many programs, even those personnel who are supposed
to supervise CHWs (usually nurses) are not taught about CHW work in their basic training and are
not involved in the planning, implementation, monitoring and evaluation of such programs. This
attitude is carried over to the CHIS which typically is the subject of abject neglect. Good quality
community data provides an entry point to promote change of entrenched attitudes as well as
promote the PHC Care principles of integrated service delivery - preventive, promotive, curative,
and rehabilitative, and provision of care to the population in an equitable manner. Extending data
collection to the community to “find the missing data” is a logical and necessary extension of facility
HIS to enable a full view of the health of the catchment population, including morbidity and
mortality profiles and unmet needs of health services.
While information flows around the CHIS varies significantly across contexts, a generic data flow
for a “hybrid” CHIS may be close to the following:
1. The CHW provides services to individuals or groups in the household and notes details
relating to that in her field diaries.
2. At the end of the day, the CHW transfers data from her diaries to her primary registers.
3. At the end of the reporting month, the CHW tabulates totals. The CHW extracts data
from her registers to put into reporting formats to send to the level above.
4. Reports are checked for quality and used to take local action. Selected data is sent to the
next level either manually, or using a computer/mobile application.
5. Denominator data is used to convert raw data into key performance indicators.

23 | August 29, 2017 Version
Five Design Principles for Implementing CHIS
When creating new CHIS in DHIS2, the system builders face many fundamental system design
considerations, and the choices they make profoundly influence the trajectory of the CHIS. We
describe these principles below and list a set of action points under each to enable
operationalization of the design principles in practice.
1. Design the CHIS to strengthen government ownership and sustainability.
2. Enable and strengthen community engagement.
3. Build a balance between reporting burden and provision of care.
4. Strengthening capacity of CHWs and other stakeholders as a team.
5. Follow incremental and evolutionary principles of system design and development.
Design Principle 1: Strengthen Government Ownership and
Sustainability of the CHIS
In the same way as community health fits within the larger arena of public health, the CHIS must fit
within the larger ecosystem of public health information systems. A government-led CHIS strategy
and implementation process ensures that essential community-level data are collected sustainably
and promptly delivered to the right people in the health system, to enable effective decisions to
strengthen health services delivery can be taken. Integrated design approaches which inherently
strengthen government ownership will help reduce the unsustainable fragmentation of information
systems, arising when non-standard systems are introduced by third-party agencies such as
donors, NGOs, and faith-based organizations.
Action points to operationalize the design principle 1. Meet and engage government stakeholders at all levels - particularly district and local
government - to discuss stimulating local demand for and availability of community-level health data.
2. Commit public, donor and NGO resources and infrastructure such as money, materials, and manpower to sustain locally developed plans to sustain the community system, right from the start.
3. Design CHIS to integrate with the existing government health management information system from the start.
4. Focus data collection on locally useful data on PHC, (preventive, promotive, curative, rehabilitative) and continuity of patient care. Also include data on SDGs/ MDGs, equity in care provision and universal health coverage.
5. Review CHIS-related health policies, M&E plans, and legislation regarding issues such as confidentiality, privacy, and data disaggregation.

24 | August 29, 2017 Version
Design Principle 2: Enable and Strengthen Community Engagement
Data collected through CHIS will only be accurate and consistent when the community and its
leaders find value in the data generated and use it for local action. The CHIS, thus, must be designed
to support community-based action, meaning that relevant local stakeholders should participate
early in system design and implementation, and be able to see added value to their everyday work
from the CHIS.
Action points to operationalize the design principle 1. Identify legitimate community stakeholders (e.g. traditional healers, chiefs, religious
leaders, health committees, teachers, etc.), who can hold local actors accountable through participatory processes. They may have multiple roles such as data auditing, triage of data, and identifying gaps in service coverage.
2. Draw on existing institutional structures rather than creating new ones for CHIS. Strike a balance between ensuring continuity and promoting innovative change.
3. Strengthen use of CHIS data in local supervision, mentorship, and support to stakeholders, depending on how they will use or interact with the CHIS.
4. Ensure timely and appropriate feedback that makes the analyzed CHIS data interesting and immediately useful for targeted local stakeholders.
5. Promote community-led CHIS innovations that improve data use, using an approach that encourages critical thinking and problem solving. Identify good ideas generated in the community and nurture them to scale.
Design Principle 3: Build a Balance between Reporting Burden and
Provision of Care
CHWs bear the brunt of data collection processes introduced by health programs and donors. Data
collection often cuts into the time and energy that CHWs could be using to provide health care
services. CHWs should prioritize care-giving tasks over data-reporting ones, which require CHIS
designers to promote local action over upward reporting to national systems. While detailed
household and individual data is essential for local use, it is not needed for action at higher levels
which requires more aggregated data. As a general principle, data should not be transmitted
upwards unless it can be used at higher levels.

25 | August 29, 2017 Version
Action points to operationalize the design principle 1. Keep information systems simple, sustainable, minimal, and frugal. 2. Standardize all CHW reporting forms across the country. 3. Simplify forms to make CHW data entry more efficient, user-friendly, and accurate. 4. Report only critical, “must know” information to next level. CHIS Data is for
strengthening local monitoring and evaluation of programs, not for ‘research purposes’
5. Follow the hierarchy of reporting standards. Retain detailed data locally, and only report data necessary to inform policy and generate indicators to higher levels.
6. Integrate job aids such as data quality assessments or CHW diagnosis guides into the CHIS.
Design Principle 4: Strengthening Capacity Development Processes of All
CHIS Stakeholders
CHIS should be both an object of capacity strengthening and a means to support teams of CHWs and
stakeholders to conduct community-based health provision tasks. For example, CHWs need to build
skills and capacity to use a mobile device based CHIS, but using this application they are able to
strengthen their interactions with other CHWs and clinicians which can contribute to building their
capacity to provide better health care services. Because of this potential, capacity strengthening
around CHIS needs to span the entire information cycle. Some areas of capacity building that
require attention in this context include:
● Target teams of CHWs, stakeholders and supervisors rather than individuals
● Understanding of basic concepts related to data elements and indicators, coverage, and
general population data.
● Understanding why certain data elements and indicators are reported and why they are
important in the larger health program picture.
● Knowing how to keep records and using appropriate technologies.
● Awareness and understanding of issues of data quality and health status assessment.
● Providing remote and supportive supervision

26 | August 29, 2017 Version
Action points to operationalize the design principle 1. Capacity strengthening must target teams of CHWs, supervisors and other relevant
stakeholders. 2. Use locally appropriate user-focused training methods in the local language.
● Use stories and images and perform training. ● Combine on-the-job technical support with classroom training.
3. Develop a system of continuous coaching, supervisor mentorship and peer-to-peer support, which empowers trainees through the CHIS.
4. Focus on data use and understanding, rather than only on data collection. 5. Develop locally appropriate standard operating procedures (SOPs), which will
provide the basis of capacity strengthening exercises, mentorship, and job aids. 6. Identify and train IT counterparts in local government who will be responsible for
maintaining the CHIS in the long-term, as part of the overall HIS strengthening.
Design Principle 5: Follow Incremental and Evolutionary Principles of
System Design and Development
This design principle focuses on adopting participatory and prototype processes that are
incremental and evolutionary in nature, rather than attempting perfection at the first attempt. This
requires building a prototype, exposing it to users and adapting and improving the prototype based
on the feedback received. This process reflects an iterative process of evolving system
improvements, and strengthening user ownership.
Action points to operationalize the design principle 1. Build upon systems that exist, ensuring that CHIS design is sensitive to history and
existing work practices. Remember that no system can be designed from scratch, from a “clean slate”.
2. Balance the system’s user requirements between continuity and change. Focusing only on continuity may lead to automating existing processes without considering process improvements, and seeking radical change may create resistance.
3. Use participatory design principles to promote local ownership and buy-in for the system.
4. When mapping the flow of data in a CHIS, implementers must balance the required complexity of data needs with the simplicity necessary for system reliability in resource-constrained communities.
5. Build simple, frugal, and user-friendly systems based on appropriate technology such as simple functional phones and dynamic dashboards.
6. Design iteratively; customize the CHIS through a prototyping framework that builds on principles of agile and incremental design.

27 | August 29, 2017 Version
Chapter 2: Conducting a CHIS Assessment
Introduction
This chapter covers important aspects of assessing CHIS. Acknowledging the diversity of CHIS, their
multiple technical, social, organizational, and cultural determinants, no assessment method or tool
will fit all situations perfectly. Therefore, this chapter focuses on the rationale for doing an
assessment, various potential methods which can improve understanding of the CHIS, and an in-
depth list of key questions, informed by the five design principles of this document, which should be
considered in the further design, development, and use of CHIS. Assessment is discussed at two
levels: one, the macro policy level, and, two, the operational system development level.
Learning Objectives:
● Build an understanding of the various benefits of conducting an assessment and its
inherent limitations.
● What are the two levels at which assessment is done, and what complementary insights
that can be gained from each.
● Understand the methodological approaches to these two levels of assessment and their
respective strengths and weaknesses.
● Build an understanding of various methods for assessing CHIS as well as their strengths
and weaknesses.
Why Do an Assessment?
The process of assessing CHIS has many aims. First and foremost, an assessment should reveal the
weaknesses and strengths of the CHIS with the aim of better planning for its improvement,
prioritizing resources, and garnering support and agreement among stakeholders for a way
forward. Given the complexity of CHIS, a thorough mapping of all aspects of the system will be
elusive, and indeed the result of any assessment must be seen as a product of subjective and
incomplete information.
Assessment can be done at multiple levels, and over time. In this chapter, we discuss two levels on
which assessment of CHIS is recommended. The first is a macro or policy level, which broadly
provides insights into the system level of infrastructure, resources, policy environment and
capacity. The second is at the information system level, which provides micro level insights into
issues of data flows, redundancies, integration needs, technologies in play, and similar issues. Taken
together, these two levels of assessment provide complementary insights, which help to develop a
holistic perspective of the state of the CHIS, the contextual conditions shaping this state, which
helps develop guidelines on what to do to strengthen the CHIS.

28 | August 29, 2017 Version
A key aim of the assessment described is not only on the end result of the assessment, but more so
in the process itself, which should be collaborative, participative and informative. This helps to:
● Inform stakeholders of potentially unfamiliar aspects of the CHIS. Conducting a broad
assessment with participation from multiple stakeholders contributes to a better
understanding of the CHIS at large, its challenges and strengths, its routines and
processes, tools, data flows and information needs.
● Build consensus around the priorities for strengthening CHIS and the actions that need
to be taken to achieve that goal. A key outcome of the assessment process is consensus
building among stakeholders concerning the challenges that need to be prioritized and
how to approach them.
● Mobilize joint technical and financial support for a CHIS strengthening plan. This
should include details on prioritization of investments in the short term (1–2 years),
intermediate term (3–9 years), and long term (10 years and beyond).
We now discuss the assessment methodologies at the micro and macro levels.
Assessment at the Macro Level: Policy and Health System
Issues
There are several assessment tools that support a more quantitative analysis of health information
systems, such as the Health Metrics Network Assessment Tool and tools related to the PRISM
framework. Inspired by these, an assessment tool is included in the annex of these guidelines. It has
been developed to focus on aspects of CHIS specifically, but is in method and outline similar to the
HMN Assessment tool.
Pre-Assessment: Stakeholder Identification
To get the most of any assessment, both in terms of covering all aspects of the CHIS as well as
building consensus on the way forward, all major stakeholders should be involved. The first step of
any assessment should, thus, be to identify the various stakeholders.
Stakeholders for this assessment will include, any person that has influence over CHIS outcomes,
both positive and negative on a community health worker or program and the CHIS.
These could be change agents in the community such as traditional chiefs, teachers, storekeepers or
religious leaders but could also be facility staff, district health officers, supply officers, etc.
The table below shows potential stakeholders from the various levels of the health system, and can
function as an example of a stakeholder identification exercise.

29 | August 29, 2017 Version
Hierarchy/Role Stakeholders
Community CHWs, Chiefs, Mayors, Religious Leaders, Parent Teachers Associations (PTA), Village Health Committees
Facility Information Officer, Clinic In-Charge, Supply Chain Manager, Clinician
District District Health Team members
Provincial Provincial Health Team
National
Health Program Units, such as the IDSR Unit, Ministry of Health-HMIS Manager, Disease Program Advisors, Human Resource, Finance Advisors, M&E Advisors, other ministries and governmental agencies
International: Donor Agencies, Implementing Partners
Figure 2.1: Potential Stakeholders at Various Levels of the Health System
● For each stakeholder, consider the following and add to the table as appropriate:
○ The critical decisions and actions they make.
○ What information they (could) use from the community to make decisions or
perform action.
○ How they would use this information to inform decision.
○ Where they get this information and in what format and frequency.
The primary roles and responsibilities of the various stakeholders should also be mapped against
the information cycle presented in Chapter 1. While the stakeholder identification is a part of the
assessment itself, consider also reflecting the breadth of stakeholders in conducting the further
assessment. For example, the provided assessment tool would benefit from input from a wide range
of stakeholders, and ideally representing the various roles, levels of the health system, and both
health and non-health stakeholders should partake.
30 | August 29, 2017 Version
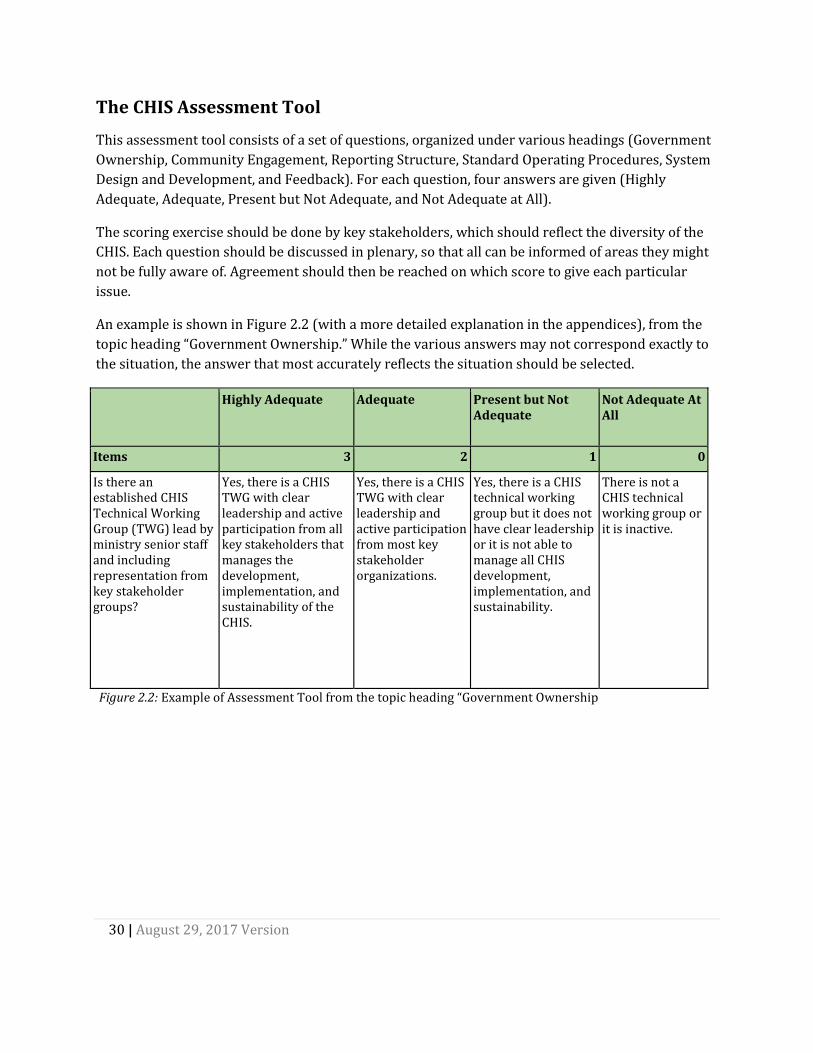
The CHIS Assessment Tool
This assessment tool consists of a set of questions, organized under various headings (Government
Ownership, Community Engagement, Reporting Structure, Standard Operating Procedures, System
Design and Development, and Feedback). For each question, four answers are given (Highly
Adequate, Adequate, Present but Not Adequate, and Not Adequate at All).
The scoring exercise should be done by key stakeholders, which should reflect the diversity of the
CHIS. Each question should be discussed in plenary, so that all can be informed of areas they might
not be fully aware of. Agreement should then be reached on which score to give each particular
issue.
An example is shown in Figure 2.2 (with a more detailed explanation in the appendices), from the
topic heading “Government Ownership.” While the various answers may not correspond exactly to
the situation, the answer that most accurately reflects the situation should be selected.
Highly Adequate Adequate Present but Not Adequate
Not Adequate At All
Items 3 2 1 0
Is there an established CHIS Technical Working Group (TWG) lead by ministry senior staff and including representation from key stakeholder groups?
Yes, there is a CHIS TWG with clear leadership and active participation from all key stakeholders that manages the development, implementation, and sustainability of the CHIS.
Yes, there is a CHIS TWG with clear leadership and active participation from most key stakeholder organizations.
Yes, there is a CHIS technical working group but it does not have clear leadership or it is not able to manage all CHIS development, implementation, and sustainability.
There is not a CHIS technical working group or it is inactive.
Figure 2.2: Example of Assessment Tool from the topic heading “Government Ownership

31 | August 29, 2017 Version
The scores derived from the assessment tool can then be used for planning CHIS strengthening
activities:
● A low score indicates that this particular area of the CHIS is weak. A higher score indicate
that this area is functioning adequately. This does not necessarily mean that all questions
with low scores should be prioritized, this will depend on the intended system, scaling
strategy, and resources.
● The scores can be used as a benchmark for later evaluation. Re-assessment can, for
example, be done yearly to track progress
● The items in the assessment tool can also be linked to targets. For example, a target can be
to improve from score 1 to a score 2 in a certain area.
These guidelines, and the tool itself, do not provide a list of direct actions, a recipe, to improve the
scores. The tool is rather meant as an input to the design, planning, and implementation of CHIS
strengthening activities, where the result will have to be interpreted to the context.
Assessment at the Macro Level: An Example
A short example can be used to highlight how the assessment tool can be used for assessing the
macro, policy level.
A country is in the process of examining its community health services, and, in that regard, wants to
assess the strengths and weaknesses of the overall CHIS before planning specific interventions. The
first step they take is to form a steering committee that will oversee the assessment and analyze the
results. The steering committee conducts a stakeholder identification exercise to see who should
take part in the assessment, and aiming for a rather small group due to logistical reasons, the
identify the following.
A community health worker and a representative from a community health committee are selected
to bring in the viewpoint of the community itself. They are selected since they have experience with
how the data collection and feedback is working between the CHW and the facilities to which they
report, and how the CHW interacts with the community at large.
An information officer from a facility is included since this person handles the flow of data between
the CHWs and the wider health management information systems, as well as having knowledge of
the facilities’ challenges with medical stock distribution.
Each district has a Community Health program officer, and the participation of one of them is
secured to get the input from this level. This person will, in addition to managing the community
health services in the district, also liaise between the CHWs and the other health program managers
that are based in the district headquarters, so this is considered adequate participation from the
district level.

32 | August 29, 2017 Version
From the national level, the head of the community health program, as well as the IT technician, is
joining. Finally, a representative from a large international NGO, who are supporting the CHWs in
some of the districts, is invited.
Conducting the Assessment
The steering committee, consisting of staff at the community health program, then invites the
identified stakeholders to a one-day workshop in the capital. Due to logistical challenges, the
community, facility, and district representatives are selected from the same district, though the
group would ideally bring in representatives from at least two districts. However, the NGO agrees
to invite one more CHW from another district as they are piloting new processes around CHW
reporting there.
The group goes through the tool question by question in plenary, since they are not so many. This is
also a chance for those who are familiar with the issue in question to inform the others on the team.
An example of how they answered one of the questions now follows:
The group is discussing the question: Do traditional health providers report through the CHIS?
The scoring scheme for this question is:
Highly adequate Adequate Present but not adequate
Not adequate at all
Items 3 2 1 0
Do traditional health providers report through the CHIS?
Yes, all traditional health providers working at the community level report their activities to the national CHIS.
Most traditional health providers working at the community level report their activities to the national CHIS.
Some traditional health providers working at the community level report their activities to the national CHIS.
Traditional health providers are not part of the CHIS.
Figure 2.3: Example of scoring scheme for traditional health providers.
First, the head of the community health program informs the team that, no, this is not taking place.
They have tried to incorporate data from traditional birth attendants (TBA) in the CHW reporting,
but due to the lack of formalized acknowledgment and collaboration, the TBAs see little incentive in
reporting neither to the CHWs or the facilities. This is something they would consider, but for now

33 | August 29, 2017 Version
they would need to give this question a score of 0.
However, both the attending CHWs can then attest to that, sometimes, they do collect data from the
TBAs. They know at least one TBA themselves, who is based in one of the villages they serve. They
have a good relationship, and sometimes communicate with the TBA to confirm a visit there since
there is no community health committee in this particular village. When they so do, they can inform
that they get relevant data on the TBA activities, and include in their reporting if this is appropriate.
However, one of the CHWs says that this is included, and thus part of, her report, while the other
says she is adding it on the side of the paper as performed by the TBA.
The team then decides that a score of 1 is appropriate for this question, but make a note in the
scoring sheet that how this TBA reporting is done varies and is not standardized at all.
Interpreting the results
And, so, they go through the questions of the assessment tools. In the end, they have a list of scores
for all the questions, as well as a number of notes clarifying certain issues. The scoring will itself
highlight the strengths and weaknesses of the CHIS, but the steering committee is then charged
with further analyzing the data and deciding on the priorities. For instance, since they don’t have
electronic reporting from CHWs, they realize an improvement in score on automatic reminders
when reporting is slow is far away. So, even if they set the score to 0 here, this is not seen as a major
weakness that needs to be addressed presently.
A report with the findings and such interpretations of the results is then shared with the team who
conducted the assessment, to get feedback. They decide to use a three-level prioritization scheme
(high, medium, low priority) for all of the questions, and present it at the next executive meeting for
all health programs, as well as sharing it with health partners.

34 | August 29, 2017 Version
Assessment at the Micro Level: A Case Study
We illustrate this assessment method, using an approach used by HISP in Indonesia.
In 2014, the Indonesian Ministry of Health in collaboration with its stakeholders (including Global
Fund, University of Oslo, among others) began an initiative to strengthen the country’s HIS with a
strong focus on the facility and community level in response to specific challenges. The Indonesian
HIS is structured with multiple vertical, health program-specific systems each with its own
platforms working in ‘silos.’ As a result, common problems occurred including limited data sharing
among programs which resulted in a duplication of the data collected from health facilities which
placed a heavy burden on health workers who were forced to enter similar data across multiple
programs. To alleviate these problems, the MoH and its stakeholders performed an assessment of
its current HIS. As a result, they began to see the potential of district dashboards to serve as central
repositories that did not significantly compromise the underlying structures of individual program
data. From there, the MoH and its stakeholders embarked on a mission to implement an integrated
dashboard that hosted information from several health programs (e.g. HIV, TB, Malaria, Maternal
and Child health etc.) using DHIS2. The project implemented the dashboard in 10 selected districts
located in 5 provinces. The district integrated dashboard approach focused on data quality and use
as well as identifying and including additional data sets in the system. While the provincial
approach was less comprehensive, focusing only on data that was easily available. The 10 districts
each had one HIS consultant employed, but the provinces had no extra resources.
All health programs in Indonesia, such as malaria, TB, HIV, nutrition, mother and child health, have
their own information system and reporting structures. The aim of the dashboard project was to
integrate data from across health programs in one data warehouse and to provide this data through
dashboards customized for each level (district, province and national). The main challenge of many
of these systems is that facility and community based data is not available at the national level as
only district aggregates are reported from districts and provinces. Some programs (such as HIV and
TB) have web based national systems with data by facility available in national servers. For these
systems, data are extracted directly into the DHIS2 at the national level. For the other systems,
however, data need to be identified and imported or captured at the district or in some cases the
provincial level.
The first phase of the implementation of district dashboards consisted of a 10-week action oriented
assessment in 5 provinces and 10 districts. This initial phase consisted of on-site ‘contextual’
assessments of the existing HIS as well as a participatory approach to training, dashboard design,
and evaluation of data quality using the dashboard system populated with local data. The
assessment and training included a situational analysis to establish the existing infrastructures and
create awareness amongst the local program managers about the value of district dashboards that
can drill down to the facility and community level. Furthermore, there was a need to establish a
mechanism to help enable effective data sharing between the implemented DHIS2 dashboard and
the existing district and provincial information systems. The training, demonstration, and feedback

35 | August 29, 2017 Version
sessions used the TB, HIV, and population data already included in DHIS2 to design dashboards and
to assess data quality. The assessment was tasked with identifying the following areas:
1. Data Sources and Management: The identification of standard data collection tools and data
sources for routinely reported data, as well as population surveys and other data sources.
This also includes the handling and processing of data at the source point.
2. Data Import Procedures to Create Comprehensive Dashboards: Electronic data for 2016 was
collected from all identified systems with the purpose of importing it into the DHIS2 in
order to develop a comprehensive dashboard system and design procedures for importing
data on a regular basis.
3. Data Flows: Data flow mechanisms from the community level to the national level. The
intermediated processing or conversion of data from one administrative level to another.
4. Information Systems: Available information systems and their linkages both horizontally
(across programs) and vertically (up the ministry hierarchy).
5. Indicators and Information Products: Identification of core set of indicators at different
administrative levels and their linkages to the national strategic plans.
6. Data Dissemination Mechanisms: Identification of available information dissemination and
use approaches to inform internal and external stakeholders.
Assessment Framework
The assessment team was composed of members from MoH (Pusdatin), UiO, University Gajah
Madah, and three universities selected as ‘centers of excellence’ in health informatics. Eleven
consultants (one for each district and one national) were also involved in the assessment process.
Prior to the 10 weeks rollout, each district went through a self-assessment using an adapted
version of the Health Metric Network (HMN) evaluation tool. This exercise helped local awareness
and commitment related to the more action oriented evaluation which followed. The assessment
team built on the results of the HMN questionnaires in a hands-on way by looking at the systems
and resources having been targeted by the questionnaires.
The assessment team adopted a nested cyclic approach which consisted of the sequential execution
of ‘cycles’, starting from the provincial MoH office focusing on mapping all of the provincial systems
(including the two pilot districts), before moving to the first district where a similar set of district
focused actions were performed. The learning from the province assessment informed the
assessment in the first district, which again informed the assessment in the second district. It was
useful to directly compare the perspectives at province level with how different aspects of the HIS
were regarded at district level. For example, in one instance, while the provincial drug management
in one province emphasized the usefulness of a system to monitor drugs out of stock using 20
‘tracer drugs’, the first district being assessed used this system in a wrong way; they used a

36 | August 29, 2017 Version
different list of drugs and they reported actual stock instead of out of stock. As people from the
province took part in district assessments, and vice versa, such misunderstandings were rectified
directly. The second district in this actual province, however, used the out of stock system as in line
with the province administrations instructions.
The learning from each cycle of repetitive assessment activities was used to inform and improve the
next cycle; the next district in the same province and then further provinces (see figure 1 below).
One cycle comprised of two weeks in each province including three days in the province office and
then three days in each of the districts. In each cycle, multiple tools/mechanisms were used to
assess the existing situation using Focus Group Discussions (FGDs), field visits, reports and tools
assessment, and data analysis. The assessment team was composed of health office staff (national,
provincial, and district levels), Puskesmas and Posyandu staff (community level), and other sector
staff (hospital, health insurance, national statistical bureau, local government, information and
communication office, social and welfare office, civil registration office and NGOs). Data
dissemination and advocacy sessions were conducted on the final day of the cycle encouraging the
head of local government (the mayor), local parliament, and provincial and district heads to
promote the implemented dashboards and provide feedback on the lessons learned.
Figure 2.4: One cycle of assessment mechanism in one province.

37 | August 29, 2017 Version
The Assessment Process
Focus Group Discussion
To gather enriched findings from the participants, in-depth discussions were organized in the form
of FGDs with key informants coming from various health departments within the province and
district (including hospital services, surveillance, and disaster management, among other specific
program departments HIV, TB, Malaria, etc.). A structured process was employed to identify the
existing health program data sources, data collection tools and data flows from the lower level to
the national level. The team also looked at the existing bottlenecks, disparities in infrastructure
information (i.e. information on reporting health facilities across the health program), and
duplication in the collection of data among the health programs. The initial data mapping process
employed was a manual mechanism where the information from the program managers was
outlined on paper sheets (See figure 2.5) for easy understanding and validation by participants.
With each cycle, the process was altered and improved by employing an electronic mechanism
where all data points were mapped using a software (Freemind). This software provided a direct
and effective mechanism for mapping data points within multiple administration levels (e.g.
province, district, and health facilities). The maps created using the software were projected on the
screen which invited immediate feedback and revisions from the participants which were then
reflected on the map.
Figure 2.5: Manual to Electronic data mapping
Field Visit
Another mechanism of the assessment was to gather additional information and validate the
collected data from the FGDs by conducting field visits. The team used a full second day in the field,
visiting the provincial or district offices, health facilities (hospitals and/or health centers) and
community centers. At the provincial and district offices, data collection tools were collected with
their reporting formats. Existing information systems and infrastructures were identified and
assessed based on the data collected, reporting modules, and linkages with other systems. At the
health facilities, data collection, processing mechanisms, and the flow of information to the district

38 | August 29, 2017 Version
level were assessed. At the community level, data collection and local information use, and any
existing feedback mechanism to and from higher levels were assessed.
Figure 2.6: Health facility assessment
Training and Participatory Prototyping and Assessment
In each province and district, one full day was dedicated to training in DHIS2 and dashboards as
well as participation in the assessment of data quality and prototyping of dashboards. The DHIS2
was already populated with data from the national TB and HIV system as well as with data from the
KOMDAT, which collected data on key indicators by district. Population data was also included in
the system. Training was conducted on how users could design their own dashboards and include
new data elements and indicators. The dashboard functionality was popular among users who used
it to display, graph, and assess their own data. In particular, the quality of TB data turned out to be
questionable. TB data is reported to the district from the facility either electronically or by paper
and compiled at the district using an offline system. Then the data is uploaded to the (SITT) online
system. In many districts, this created a systemic problem where there was less data in the online
system in comparison to the offline system. In fact, there was never more data in the SITT online
than in the offline system, indicating that from time to time, some data was not uploaded. It is
interesting that the first ‘results’ of making such national data accessible to local users is the
identification of data quality issues.
User participation in designing dashboards and in assessing data quality turned out to be an
important part of the assessment leading to more ownership and commitment to the
implementation process.

39 | August 29, 2017 Version
Advocacy, Planning, and Data Dissemination
A session with stakeholders from multiple sectors (in addition to health) was conducted for
information dissemination and advocacy in all the districts and provinces. Participants in this
session included the heads of provincial, district, and local government along with other health
program heads. The assessment team presented the implemented dashboard with a primary
emphasis on processes of information use. Key issues for discussion included where to include data
from other sectors in the dashboard approach. National statistics have offices in all districts and
provinces and were particularly interested in becoming part of the project. The presentation was
followed by discussions of future plans and an outlining of with probable action points.
Data Analysis and Reflections
In each provincial cycle, a few days were set aside for data analysis and mapping, system
configuration, and reflections on the observed assessment challenges. The team assessed data
collected during the focus group, field visits, and observations in a discussion format. Afterwards,
the assessment team provided recommendations and suggestions for improvement directly to the
larger group. Additionally, data mapping, processing, and importation into the DHIS2 platform were
done to allow the development of the district and provincial dashboards.
Findings obtained by the assessment approach were presented and discussed first to the internal
team and later to the MoH. The process and outcome of the assessment exercise led to the initiation
of the following HIS improvement activities.
Data Standardization
A key observation made by the assessment team was the lack of data reporting standards across
the assessed provinces. Data reported within the same program had different formats from one
province to another and sometimes within the same province. For example, an exclusive
breastfeeding data element was collected within the nutrition department. In NTB Province, the
monthly age disaggregation was from 0 to 5 months. However, the same data element in Java Timur
and Maluku Provinces combined the age dimension into 0-5 months while disaggregating it by
gender (male and female). The same was observed in the Integrated Recording and Reporting
System of Puskesmas (SP2TP) in LB1 form. In that case, Maluku Province had gender
disaggregation while other provinces reporting LB1 had disaggregated data elements by age group.
Most of the health program still uses paper tools supplemented by Excel sheets. The programs
areas range from Malaria, Nutrition, Immunization, Surveillance, Human resource etc. Furthermore,
Excel formats differed from one district to another depending on the local adopted decisions which
limited aggregation at higher levels.

40 | August 29, 2017 Version
Fragmentation of HIS
The assessment observed the health data in Indonesia was managed according to different
departments with minimal horizontal communication. Such fragmentation caused duplication of
collected data and limited data sharing across the departments. The existence of KOMDAT as the
national system which collects data for about 130 national health indicators (based on data
aggregated by district) was an example of efforts by the MoH to integrate information from health
programs. However, HIS fragmentation, and data quality issues still persist within the health
systems. Figure 2.7 outlines portion of the observed system architecture within the five visited
provinces.
Figure 2.7: Information System mapping.
Information Use and Demand
Local information use was observed at the community and health facility level. Standard practice of
identifying follow up cases was used by the health officials. Graphs and charts were plotted at the
district and provincial level to disseminate information. Annual bulletins and reports were created
from the health facility delivered to the provincial level following a standard format. The use of a
dashboard approach appeared to serve as a catalyst to bring stakeholders from different
departments together in this process. Managers were motivated by the possibility to have
comprehensive information for decision-making.

41 | August 29, 2017 Version
Figure 2.8: Information use by local community
Recommendations from the Assessment Exercise
● Build on the recent DHIS2 implementation to bring more stakeholders onboard and have a comprehensive approach look of cross-sector data (e.g. statistical data, civil registration data, hospital data, health insurance data).
● A provincial approach instead of, or rather in addition to, a district approach to enable
swift scaling up the implementation of district dashboards. However, not all data is
available by facility and community at the province level and will need to be collected in
the districts.
● Invest in capacity building through internal and external training.
● Encourage more integration with other stakeholders by using district dashboards.
● Ensure more functional coordination between health information department and other
health programs at the district level and upper administrative levels.
● Creation of standard data collection tools which will be used across the country.
● Build more robust approaches for accommodating other data source with disparate data formats.

42 | August 29, 2017 Version
Building Synergies from Macro and Micro Level Assessments
The two methods presented earlier in this chapter should be seen as complementary to each other.
In the table below, some strengths and weaknesses are outlined to aid in assessing which tool may
be more useful in a given context.
Macro Level Assessment Tool Micro Level Case Study
Strengths ● Can be performed with relatively few resources, although broad participation is encouraged
● Incorporates a scoring mechanism which can be used for periodic evaluation
● Gives a holistic view of important aspects of CHIS
● Gives a rich understanding of CHIS, such as data flows, work routines
● Helps to understand individuals and their reasoning and actions
● Appropriate for identifying contextual aspects
● Good for identifying challenges and opportunities which are hard to quantify
Weaknesses ● Process of scoring is subjective
● Does not go into depth in any of the aspects
● Relatively more static and does not account for process dynamics
● Predefined set of questions may not fit all contexts
● May not be representative of a multiplicity of views, and limited to those answering the questions
● Resource-intensive ● Hard to scale, some sample
areas must be taken as representative of the whole district/province/country
● Does not provide rich insights into macro-level conditions that shape CHIS
Figure 2.8: Macro and Micro-Level assessment pros and cons
Synergies between the Macro and Micro-Levels of Assessment
In the above table, we have summarized some of the strengths and weaknesses of both the
approaches. However, we argue that taken together there are richer insights that can be developed
around the assessment of the overall CHIS. While the macro assessment allows us to understand
the broader contextual and policy aspects that shape the CHIS, this is complemented by the
understanding of the individuals, their actions and various processes that constitute the CHIS. The

43 | August 29, 2017 Version
macro level defines the scope for change at the micro level, and vice versa. For example, macro level
SOPs such as for infrastructure strengthening is needed to initiate appropriate design at the micro
level, such as the need for developing hybrid (offline-online) solutions for the CHIS. At the same
time an understanding of the hybrid solutions possible or not at the micro-level, are fundamental to
develop the macro-level SOPs. Broadly, the macro level is useful to diagnose and identify the
challenges, while the micro level understanding helps to understand possible solutions to the
challenges identified. We thus advocate in these guidelines for the use of both the macro and micro
level assessments in conjunction, to be able to identify synergies and the corrective actions
required for the future improvements of the CHIS.

44 | August 29, 2017 Version
Data quality and data use
are intimately inter-
connected... the more it is
used, the better the quality.
Chapter 3: Data Quality and Use
Introduction
The primary purpose of a CHIS is to generate information that can be used by CHWs and other
stakeholders at various levels to improve and strengthen community health programs, to enhance
the health of populations.
Despite the primary importance of enabling data use, it is an area which lags behind in overall CHIS
strengthening efforts, as more focus is given to the use of new technologies and devices to automate
data collection and transmission processes. This chapter thus seeks to understand what we mean
by data use, what are its critical determinants, and how can this be strengthened overall.
Learning objectives
By the end of this chapter readers should be able to
● Describe the virtuous cycle of data quality and data use.
● Identify data quality strengthening tools in DHIS2, and how can they be used to enhance data use.
● Explain data use at community and various levels of the health system
● Discuss the principles for improving data use.
● Describe feedback mechanisms available in DHIS2, and how these are applied to the
data needs of community stakeholders.
The Virtuous Cycle of Data Use and Data Quality
The “vicious data cycle” is a scenario where the CHIS is seen by CHWs
and other stakeholders to provide poor quality data, so they do not
trust it and will not use it. They use their own sources, external
surveys, or, even worse, create new systems (adding to fragmentation)
for meeting their information needs. If they don’t use data, the CHIS
will be further neglected, produce even poorer quality data, and this
leads to more non-use.
Fortunately, the reverse also holds true, as shown in the “Virtuous data cycle”. The more the data
quality is trusted, the more it is used and this further improves the quality of data. As shown in the
feedback loops in the diagram, this is an ongoing, incremental process that takes time and needs to
be driven by increased demand for data, local ownership of data and visible links between data and
decision making. The end result of this virtuous cycle is a vibrant culture of information use

45 | August 29, 2017 Version
Figure SEQ Figure \* ARABIC 2 The Virtuous Data Cycle
This link between data quality and use requires CHIS developers to attack the problem of poor data
use at both the demand and supply sides, and strengthening their interlinkages. The demand side
involves improving awareness and capacities of stakeholders to use data for strengthening
community health management, while the supply side implies improving the overall quality of the
CHIS generated data. We see the DHIS2 as a tool that can help strengthening both these ends and
their inter-linkages. But first we discuss what we mean by data quality, and how can the tools in
DHIS2 help to strengthen quality.
Strengthening Supply Side: Essential Elements of Data Quality
Good quality data is that which is trusted by decision makers to be used for basing their decisions
on. Characteristics of good quality data include: Correctness, Completeness, Current, and
Consistency
Correctness (accuracy)
Does data accurately reflects the reality it seeks to measure?
● Are the data a reflection of what is actually happening in the community?
● Are there mistakes in data entry?
○ Are correct values being recorded in the appropriate places?
○ If there are errors, are they systematic, (e.g. due to a misunderstanding of the
indicator definition), accidental (i.e. random), or intentional?
● Are there calculation errors being made?

46 | August 29, 2017 Version
Completeness
Are all CHWs reporting on all the data elements they are supposed to report on?
● Are all units reporting?
● Are all CHWs transmitting all the forms expected?
● In each report, are all the required data elements being reported?
● What is the percentage of “zero” reporting (i.e. for cells for which there is no service
delivery, there is a zero recorded rather than a blank)?
Current (Timeliness)
Is data being reported in a timely manner according to set norms?
● Are facilities reporting by the deadline of reporting established by the MoH?
● Are reporting periods standardized across the country (i.e. the reporting period starts
and ends on the same dates in all facilities and districts)?
Consistency
Are the patterns of data reported, consistent, and not consisting of outliers?
● When compared with previous months, is there a consistent pattern (e.g. a similar
distribution of cases of diseases, or age/gender proportionality)?
● Are there values from CHWs that are markedly discrepant to values from similar CHWs
(i.e. outliers)?
Data Quality Tools in DHIS2
In addition to using data, there are many standard data quality tools embedded within DHIS2:
Data input validation: The most basic data quality check in DHIS2 is to make sure that the data
being captured is correctly formatted. The DHIS2 gives the user a message that the value entered is
not the correct format and will not save the value until it has been changed to an accepted value.
E.g. text cannot be inputted in a numeric field. The different types of data values supported in
DHIS2 are explained in the user manual in the chapter on data elements.
Min and max ranges: To stop typing mistakes during data entry (e.g. typing ‘1000’ instead of ‘100’)
the DHIS2 checks that the value being entered is within a reasonable range. This range is based on
the previously collected data by the same health facility for the same data element, and consists of a
minimum and a maximum value. As soon as the users enters a value outside the user will be alerted
that the value is not accepted. In order to calculate the reasonable ranges, the system needs at least
six months (periods) of data.

47 | August 29, 2017 Version
Validation rules: A validation rule defines a relationship between a number of data elements. The
expression forms a condition which should assert that certain logical criteria are met. For instance,
a validation rule could assert that the total number of vaccines given to infants is less than or equal
to the total number of infants.
The validation rules can be defined through the user interface and later be run to check the existing
data. When running validation rules the user can specify the organization units and periods to
check data for. When the checks are completed a report will be presented to the user with
validation violations explaining which data values that need to be corrected.
The validation rules checks are also built into the data entry process so that when the user has
completed a form the rules can be run to check the data in that form only, before closing the form.
Outlier analysis: The standard deviation based outlier analysis provides a mechanism for
revealing values that are numerically distant from the rest of the data. Outliers can occur by chance,
but they often indicate a measurement error or a heavy-tailed distribution (leading to very high
numbers). In the former case one wishes to discard them while in the latter case one should be
cautious in using tools or interpretations that assume a normal distribution. The analysis is based
on the standard normal distribution.
Completeness and timeliness reports: Completeness reports show how many data sets (forms)
that have been submitted by organization unit and period. There are three different methods to
calculate completeness:
1) Based on completeness button in data entry.
2) Based on a set of defined compulsory data elements.
3) Based on the total registered data values for a data set.
The timeliness report is based on a system setting called “Days after period end to qualify for timely
data submission” and shows
● which organization units in an area that are reporting on time,
● the percentage of timely reporting facilities in a given area.
Source: Using DHIS2 to improve data quality, Section 13.4 of DHIS2 Implementers Manual

48 | August 29, 2017 Version
Additional Data Quality Resources
Find these resources located in the appendices of this document.
1. Improving health data quality, recommendations, and guidelines. “[This] report
focuses on which measures that should be put in place to improve data quality. Suggested
improvements are based on lessons learnt in Malawi which also have validity beyond the
national experience.”
2. Manual for the DHIS2 quality tool. This is a manual for basic use of the DHIS2 quality tool.
The manual explains the possibilities of the quality tool, as an input to capacity building and
workshops. The data quality tool not only displays potential data errors, but also
contributes to improved understanding of the data quality.
3. Mobile CBHIS Data Quality Guidelines. This a comprehensive, general guidance on
community based health information systems. It consists of 3 sections:
Part 1: Designing Mobile Data Collection Systems for Improved Data Quality. This
component includes guidelines on designing mobile data collection systems, along with
checklist for assessing a system’s mobile data collection forms and systems.
Part 2: Implementing Programs to Increase Ownership and Commitment to Data Quality.
This component includes guidelines on engendering accountability and ownership for data
quality, along with a checklist to assess feedback loops and to motivate frontline health
workers on data quality issues.
Part 3: Verifying Field Level CBHIS Data. This component includes guidance on how to adapt
a Community Trace and Verify (CTV) tool to verify whether individuals who are reported as
being provided with services have actually received them.”
4. Data Quality Audit Tool
The DQA Tool focuses on (1) verifying the quality of reported data, and (2) assessing the
underlying data management and reporting systems for standard program-level output
indicators.
Two versions of the DQA Tool have been developed:
(1) the “Data Quality Audit Tool” which provides guidelines to be used by an external audit
team to assess a program/project’s ability to report quality data; and
(2) the “Routine Data Quality Assessment Tool” (RDQA) which is a simplified version of the
DQA Tool that allows programs and projects to assess the quality of their data and
strengthen their data management and reporting systems.”

49 | August 29, 2017 Version
Strengthening Demand Side: Understanding Levels of Data
Use
Figure 3 The information Triangle showing three levels of information use
As can be seen in figure 2, data use for the CHIS occurs at three levels, each of which needs to work
with the other levels.
Client/Beneficiary Level
The individual who accesses health services from the CHW is termed as the client or beneficiary,
and should be the main action level for CHWs and community stakeholders to provide preventive,
promotive, rehabilitative or curative care. Beneficiaries include pregnant women, children below
five years, communities implementing health programs and individual households with chronic
infectious and non-communicable diseases. The different programs of the health system often treat
these beneficiaries in isolated ways, depending on the programs of care they are enrolled in, with
implications on the CHIS, and limiting taking a holistic picture of care and wellbeing needs.
One of the goals of the CHIS is to provide for a more holistic perspective, both from the perspective
of the beneficiary needs and of the different health services that are being provided to them.

50 | August 29, 2017 Version
Facility Level
The facility in-charge uses data to ensure adequate resources to support community activities and
to ensure supportive supervision. Facilities are the link between communities and the health
system and facility managers serve as the first point of call for the CHWs for receiving appropriate
supervision and informed feedback, and advice on provision of better health care to the
beneficiaries.
To enable these functions and other support such as the provision of adequate infrastructure,
staffing, equipment and supplies, facilities need reliable CHIS data.
Facilities are also at the front line of promoting “discussions about data”, providing feedback to
CHWs and stakeholders on performance and other activities to promote the virtuous data cycle.
CHIS data also provides facilities with a picture of the overall resources needed and the “missing
data” that shows the real disease burden in their area, and ensuring that CHWs provide services
necessary according to the basic health services package. Facilities need to combine the CHIS data
with their own service data to create an integrated picture of the health of the catchment
population for upward reporting to the district and higher levels.
Health Systems Level
Managers at higher (district and national) levels use the systems approach to strengthen CHW
systems of governance, human resources, service delivery, infrastructure, finances and information
systems. Data comes from multiple sources, including CHIS, the facility HIS, program specific
systems, the census and health surveys and is used for two purposes.
1. to develop policies and plans that shape of the CHIS, including decentralization, resource
distribution, standard operating procedures, and supporting the tasks performed by CHWs.
2. to monitor and report on health system indicators such as the SDGs, MDGs and key
performance indicators which contain CHIS data.
CHIS data use takes place at multiple levels and for diverse purposes. A strong CHIS thus becomes a
firm foundation of the overall national HIS. The different purposes the CHIS supports can be linked
back to the functions of recording, tracking and reporting defined in Chapter 1. While recording and
tracking are core functions to support services at the client/beneficiary levels, the reporting
function builds upon the recording function to meet the information needs of the facility
management and health systems levels.
51 | August 29, 2017 Version
Principles to Enhance Data Use
In this subsection, we discuss key CHIS design principles to enhance data use. These include:
1) Design for decentralized use
2) Enabling local use engaging a larger group of stakeholders
3) Strengthening feedback mechanisms
4) Designing for sustainable use
5) Using automated tools for feedback
6) Best practices for promoting data use
1. Decentralized Use
The further one moves from the community, the less data is used for action. A fundamental
principle of the HISP CHIS approach is that data should be used as close to its point of generation as
possible. A decentralized CHIS empowers CHWs, supervisors and community leaders to feel
ownership and accountability of the program. When the people closest to the ground feel
ownership and accountability of the health outcomes of a program the outcomes of that program
will be stronger. Driving down authority and accountability to the lowest levels will demonstrate
the full utility of the CHIS.
The more the CHIS is designed to strengthen decision making at decentralized local levels, the more
chance there is for information to be demanded and used at lower levels to improve service
delivery. To enable this, the CHIS needs to provide data with high granularity and user-friendly data
analysis tools. A CHIS that is designed primarily to support local-level decision making, with some
of the data that flows up collaterally, will ensure a high chance of improved data quality and enable
effective local use of data for informed decision making.

52 | August 29, 2017 Version
Decentralized data use: The EPI example
Anyone who has been to small, rural health facilities anywhere in the world will have seen EPI
cumulative coverage graphs proudly pasted on the wall. This is a best practice achieved by one
unit in Geneva that has convinced every country in the world to monitor EPI at facility level by
drawing a simple graph that records key immunizations given every month towards a set
target. This practice has been sustained over many years by a number of simple data use
processes outlined in the virtuous data cycle above
1. Facility staff are trained to fill the graphs using clear, simple SOPs in the local
language.
2. Facility staff have a sense of pride in watching coverage increase every month.
3. Supervisors, even from other programs, check these graphs when they visit a
facility.
4. Districts have resources to provide ready-printed graphs (photocopied if
necessary) for every commodity at every facility, and to do supportive supervision
of EPI.
5. National EPI units have been convinced that this is standard practice in all other
countries, so they should do it too!
6. Community members when visiting the facility expect to be able to see how EPI is
doing in their area.
2. Engaging Stakeholders
Various local government, non-government and civil society groups are engaged in ensuring the
health of a community. These include village chiefs, local political leaders, women’s groups, and
NGOs who are engaged in activities such as implementing programs, conducting training,
monitoring data, investigating critical events such as maternal and child deaths and others. While
the primary stakeholder for the CHIS is local government, engaging these other stakeholders in
strengthening data quality, enhancing use, opening up the information for wider public scrutiny,
can go a long way in strengthening the CHIS.
Engaging Stakeholders: The Punjab example
Recently, the state of Punjab in India developed a health transparency portal in which all public
facilities and private facilities empaneled with the state would self-report details of their facility,
including address, contact person, services offered and their respective costs, equipment
available, and doctors on call. Using this information, a community member should be able to
identify what health services he can access where and most cost-effectively. The citizen can then
also provide a rating for the services that he/she has received, which can then also be used by
other citizens to inform their choice of service access. By making this health facility information

53 | August 29, 2017 Version
open to the public, the information use serves two key purposes. One, empower the health
worker to make better choices on health care. Two, allows the state to identify what are their
gaps in service delivery and take necessary corrective action.
3. Strengthening Feedback Mechanisms
When strong feedback mechanisms are implemented many profound phenomenon can occur, but
two that stand out are:
1. Reporting rates and data accuracy improve, because CHWs see the value of quality data.
2. If community based stakeholders track their own performance at a local level, they improve
their performance too.
We know from the transformational feedback model that a strong feedback mechanism is one that:
• Improves information transparency – People who need data have data. Raw data is able to be converted into knowledge and acted upon.
• Enable two-way dialogue - Feedback mechanisms need to connect the stakeholder to the performance community health program. As stakeholder make decisions and perform actions based upon the knowledge they obtain from the feedback mechanisms, community health is effected and subsequently is reflected in the data displayed in the feedback mechanisms. This cyclical process is a form of two-way dialogue. Another form of feedback that enables a two-way dialogue is support and supervision which is covered in chapter 5.
• Enables networks for learning – With multiple stakeholders in the community receiving feedback they can network together and devise stronger and more robust solutions to community health problems. It is a common misconception that community health projects must have all the answers to all problems that a community faces, but in truth the strongest community health programs is one in which the community learns from its members and devises this own informed solutions.
Feedback mechanisms minimize the barriers between data, decision making and actions, but
simply pushing data down to stakeholders will not have this effect. A feedback mechanism must
enable the stakeholder to receive data and then transform that data into information. Information
has meaning while raw data is typically viewed as more abstract and meaningless. Then
information must be processed into knowledge. Knowledge is contextual and actionable, but only
possible if the stakeholder trusts and has confidence in the source of the information, the raw data.
Therefor:
➢ Every feedback mechanism must be customized to the best way to give
information down to a stakeholder based upon their characteristics and roles.

54 | August 29, 2017 Version
Consequently, pushing information via a dashboard on a computer is not enough. This is especially
true at facility and community level where they will probably not have access to a computer, the
time, nor the ability to do data mining. In these cases, push out only critical indicators that they do
not need a computer or log-in to an application.
There are multiple types of feedback mechanisms. Below is a chart that describes these diverse
types. The selection of which type of feedback to use is dependent on the role and actions of your
identified stakeholders. Typically, a single stakeholder may receive multiple types of feedback
mechanisms.
Figure 3.3: Feedback Mechanism Model

55 | August 29, 2017 Version
Guidance on Developing Feedback Mechanisms There is not a single technology solution for every stakeholder. For example, a CHW may receive an
automated text SMS reminding them to send their monthly disease surveillance report. They might
also then receive an automated HTML report via an SMS that shows how their community or
catchment is performing in terms of disease burden compared to the district and other
communities. In that example, the CHW is receiving feedback mechanisms that supports their
workflow but also one that supports the intervention or service delivery. Both are delivered via
SMS because that is the most direct way to reach the CHW. A simple text messages prompts a very
specific action. The HTML report may not explicitly tell the CHW to perform specific actions but it
may prompt them to do something they know will improve their catchment performance.
When choosing the best technology and messaging, the following can be considered:
1) What are the indicators that provide the information stakeholders use to base their
decisions and actions? – Best practice is to prioritize a list of minimum essential indicators
with the stakeholder, as to many of them presents too much noise and renders the feedback
mechanisms useless.
2) What is the technical ability of the CHW to interpret data? – Best practice is to keep
information able to be interpreted by a child with little formal education. The “12-year-old
test” will ensure that you are presenting data in an easily comprehensible and actionable
manner.
3) How often do stakeholders need to get information? Is there targeted information that
certain stakeholders need? Are there formal reports that need to be created for different
stakeholders (Newsletter, monthly or quarterly information dissemination)? Who do the
stakeholders disseminate the information to?
4) The person who does data mining is not always the same as the person that does
presentation and communication, ask who does the presenting?
5) What is the most direct way to present them the data? Please remember that often the most
direct way is via push notifications like email and SMS. Only enabling access to data through
dashboards in DHIS2 dashboards can be a barrier for access.
6) How is the indicator going to be captured? If you identify an indicator for a feedback
mechanisms you must ensure that the data elements of that indicator are captured at the
right hierarchy level and at the right frequency to provide for the feedback mechanisms.

56 | August 29, 2017 Version
Automated tools for feedback – DHIS2
There are many ways to get information to people. It is important to remember that data for
decision making must be easy to access. Below are some examples of different technologies used for
feedback mechanisms. This is not a comprehensive list, but highlights common feedback technology
solutions as they have been applied to a CHIS.
● Automated SMS – DHIS2 can send out automated messages for the following occasions:
○ Validation rule alerts: Validation rules can be used for many purposes. Data
quality checks is the most common practice, but validation rules can be used for
programmatic alerts as well. For example, a validation rule “Cholera Total Cases ==
0”. In this case any instance where more than zero cholera cases have been reported
the user group for set to receive automated validation rule alerts will be notified
that there are cases of cholera, exactly where they were reported and they would
then be able to send out a disease control response team.
○ Reminder to submit data: It is always a best practice to send reminders to facility
and community health workers to submit their routine data via SMS. Often
community health workers do not monitor closely the day of the month or even the
week so it is important make sure they are reminded to submit their data.
○ Reminder of upcoming events using tracker: This could be used if tracking
patients from the community level through a treatment to remind them of an
upcoming appointment. It could also be used to remind a community health work of
who they need to meet with for follow-up outreach like in the case of a newborn
tracking project.
○ Alert of missed appointment using tracker: Enabling community health workers
to follow-up with people in their communities what have missed an appointment
can be very effective especially if the clinical care providers are unable to follow-up
with patients that have missed appointments.
○ HTML report – Often stakeholders are using different mobile technology, but
nearly all mobile devices now have a basic web browser. Using iReports standard
reports can be generated for a specific stakeholder based upon their permission
levels in DHIS2. For instance, you could make a standard report that is sent to all
chiefs. The chiefs will only be able to see data for the organizational units they are
assigned in this report. You can then embed the link to the report into an automatic
SMS that is sent to all Chiefs. The chief received the SMS and by clicking on the link
the web browser will automatically open to the chief’s custom report.
○

57 | August 29, 2017 Version
● Automated Emails – Much like automated SMS, DHIS2 can be configured to send out
automated Emails for the following occasions
○ Pushing Dashboard
○ Validation rule alerts
○ Messaging
○ Sharing interpretations
● Public Facing Websites - Using the web portal app or a custom webpage public analytics
can be published to a website. This has proven to be a tremendously effective way to give
the general public or government staff that have access to the internet access to health data
on their communities and projects.
● Standardized and custom dashboards - DHIS2 enables users with the proper permissions
to have access to customized or standard dashboards consisting of a broad range of
analytics (charts, maps, pivot tables, scorecards, league tables, etc.)
● PDF Reports - Using standard reports DHIS2 can produce automated, customized PDF
reports.
● HTML Reports - DHIS2 is able to produce automated HTML reports. These reports can be
useful in calculating complex indicators that are not available in DHIS2
● Dashboard Android Application - The dashboard application allows anyone with a DHIS2
dashboard to access that dashboard via their android smartphone.
● Sharing data interpretations in DHIS2 - Any analytical tool developed in DHIS2 is able to
be commented on and those comments can be made available publicly or to a specific user
group. This is an effective way of sharing information with groups of users and sparking
discussion around that data. This can also be a method of sharing information and assigning
tasks to multiple users
● Scorecard applications - Scorecards are simple but powerful analytic tools to present a
great deal of data quickly in an easily consumable fashion. Scorecards have been specifically
designed for village health teams enabling community health stakeholders to quickly get a
clear idea of areas where community health is underperforming.
Dashboards Dashboards allow for the easy access of analytics with pre-defined parameters. Charts, tables, and maps are created once, gathered into thematic dashboards, and then posted on the DHIS2 home page. These visualizations are updated as new data come into the system. Anyone with access to this dashboard can easily find these visualizations as soon as they

58 | August 29, 2017 Version
open DHIS2, encouraging them to revisit DHIS2 regularly, and dig deeper into data analytics. Like feedback loop notifications, these visualizations can be customized for each user group and organization unit. When combined with “relative periods,” powerful visualizations can be dynamically updated, and customized by the viewer’s role and location. Imagine you are an obstetrician managing traditional birth attendants in a rural district. At the end of March, you might receive a static table from the MoH called “maternal mortality in the nation last year”. If you open your DHIS2 dashboard, you might see an interactive bar chart titled “Maternal Deaths in *My* District Last Month, By Ward”. This information is much more meaningful to you, and you can use it to inform you programs.
Case Study: Zambia Chiefs Sanitation Dashboard Widget In 2014, the Ministry of Local Government and Housing in Zambia with UNICEF support launched the community lead total sanitation (CLTS) project. To engage community stakeholders, this project empowers local Chiefs with actionable community sanitation data via a DHIS2 dashboard widget on a tablet. The questions and answers below illustrate how it was decided what and how chiefs should be presented with this feedback mechanisms. 1. What are the indicators that provide the information stakeholders use to base their decisions and actions? Open defecation free status (ODF) is the measure of the household coverage of “adequate latrine.” This indicator is able to tell the chiefs which areas are performing well and which ones are performing poorly. 2. What is there technical ability to analyze data? Chiefs in general have a low ability to analyze data. Therefore, Chiefs are only presented with one indicator: latrine coverage. Chiefs do want to know how they are performing against their neighboring chiefdoms so they are presented their whole chiefdom latrine coverage in a bar chart against their neighboring chiefdoms. They are also shown how their district compares against the whole country and how each village in their chiefdom performs. 3. How often do stakeholders need to get information? Chiefs meet with village headmen monthly, but chiefs may reach out to villages or perform inspections at any time, so chiefs need access to information at all times. 4. Who presents the data? Chiefs are able to understand the data directly from the widget. In some situations where the chief is unable a chief's advisor is trained on how to use the tablet and widget. 5. What is the most direct and efficient way to present and communicate that data to them? Chiefs need to be able to interact with this data at any time. All chiefs are able to use smart phones, but remembering log-in credentials was identified as a bottleneck to using applications. Therefore, Chiefs are presented with these analytics via a widget on a tablet which is provided by the project. 6. How is it planned for that data to be captured? ODF is calculated = (the number of adequate latrines/the number of households) X 100. Both the number of adequate latrines and the number of household are captured by the village sanitation action group monthly from individual households via paper records. Monthly a community

59 | August 29, 2017 Version
• Easily understood, avoid using technical terminology
• Limited in number: three to five per program.
• Easily displayed on a chart, scorecard, or a map.
• Able to evaluate performance over time.
• Identify worst and best community performers.
• Comparable between communities.
champion aggregates the household data to the village level and the village aggregate are transmitted into the CHIS by the community champion via a DHIS2 application on a project feature phone. For more information on this use-case please see the Zambia Sanitation Use-Case in the annex. Figure 1 in this Case Study show Chiefs Mukobela’s widget.
Figure 1: Example Widget from Chief Mukobela Chiefdom
4. Promote Data Use at community level
To gain full value of the CHIS, it needs to provide sustainable use, implying the use processes will be
supported in the long run, and should be able to evolve with changing needs. Some steps towards
sustainable use, include clearly defined goals, targets and indicators and a CHIS M&E framework
A: CHIS Indicators, Goals, and Targets
Broadly agreed goals and targets and a set of indicators
linked to them is the basic tool to promote the shift to
an information-led CHIS. To ensure maximum use, all
data collected by the CHIS should directly relate to
indicators selected to monitor efforts to improve health
system performance.
Indicators which are defined as a “variable that help to
measure changes, directly or indirectly” 6 is at the core of
6 WHO, 1981

60 | August 29, 2017 Version
Where are we now?
Where do we want to go?
How will we get there?
How do we know when we have
arrived?
Figure SEQ Figure \* ARABIC 4Action
Planning Cycle
promoting a culture of information use. Crafting indicators that are useful for communities is the
center of the process of monitoring community health services and systems and is one of the most
important skills required for CHIS design.
A good indicator provides information about a broad range of conditions through a single measure
and enables CHWs and their supervisors to compare themselves to others doing similar work.
Indicators for community actors (CHW, community leaders, community health groups) must be:
A compendium of standards and measurement issues for 40 indicators has been produced by WHO7
and at regional level by the West African Health Organization. These need to be adapted to country
contexts and again to the community level.
5. Develop Community Action Plans
Community action plans vary across countries, but the
essential goal is to have a common set of activities that have
been agreed to by local stakeholders and will be achieved in
a set time period. These plans need to be developed around
locally generated CHIS data from the initial situation
analysis, through setting targets, allocating resources, and
using indicators to monitor results.
Traditionally, in most health systems the lowest level creating action plans is district, but a strong
CHIS can drive reporting and feedback mechanisms to community level to develop action plans at
that level. This can be a powerful way to bolster program performance, empower local authority,
and instill ownership and accountability.
7 WHO, 2017
61 | August 29, 2017 Version
There are many ways to produce action plans and this will vary from country to country or even
community to community, but there are many universal best practice of community action plans to
consider, listed below:
● Publicize the action plan to get maximum accountability
○ Publicly post the action plan at a community gathering spot like a health facility,
school, water point, traditional ceremony area, etc.
○ Have a website that enables anyone to see community performance. Make sure that
all community members know how they can access the website.
○ Ensure that other community organizations such as PTA, religious study groups,
social/athletics clubs, women’s groups, etc. are also aware of the action plan.
● Turn the action plan into a contract.
○ Make the community members sign the action plan and acknowledge that they
understand what needs to happen.
○ Require that the community electronically submit their action plan into the CHIS,
with a picture of it or manual entry.

62 | August 29, 2017 Version
6. Develop CHIS M&E framework
A Monitoring and evaluation (M&E) framework should be developed to monitor and evaluate the
action plan, using the same indicators and parameters as the plan.
The M&E framework is a systematic method of organizing and defining indicators, goals, and
Baseline values and targets, and is part of the standard operating procedures.
The M&E framework will dictate what indicators stakeholders have available to them and it will
form the foundation of conducting performance review and developing action plans.
Below is a template for a community M&E Framework:
M&E Framework - Key Performance Indicators
Program Key Indicator
Numerator Denominator Baseline (Date)
2020 Target
Data Source
Frequency Responsible Person
Antenatal Care (ANC)
1st visit coverage
ANC 1st visits
Expected Pregnancies
72% 80% CHIS Monthly CHW
LLITN ANC coverage
ANC LLITN distributed
Expected Pregnancies
62% 80% CHIS Quarterly CHW
Delivery and Postnatal Care
Facility delivery rate
Facility Deliveries
Expected Deliveries
43% 55% CHIS Monthly Facility
PNC coverage
PNC <48 hours
Expected Deliveries
52% 70% CHIS Monthly CHW / Facility
PMTCT ANC HIV test rate
ANC HIV tested
ANC 1st visits 72% 90% HMIS Monthly Facility / CHW
EPI Measles coverage
Measles dose given
Children <1 year
53% 75% HMIS Monthly Facility
Malaria Malaria test rate
Malaria case treated
RDT performed
47% 70% CHIS Quarterly CHW
Table 1 Template for Community M&E framework
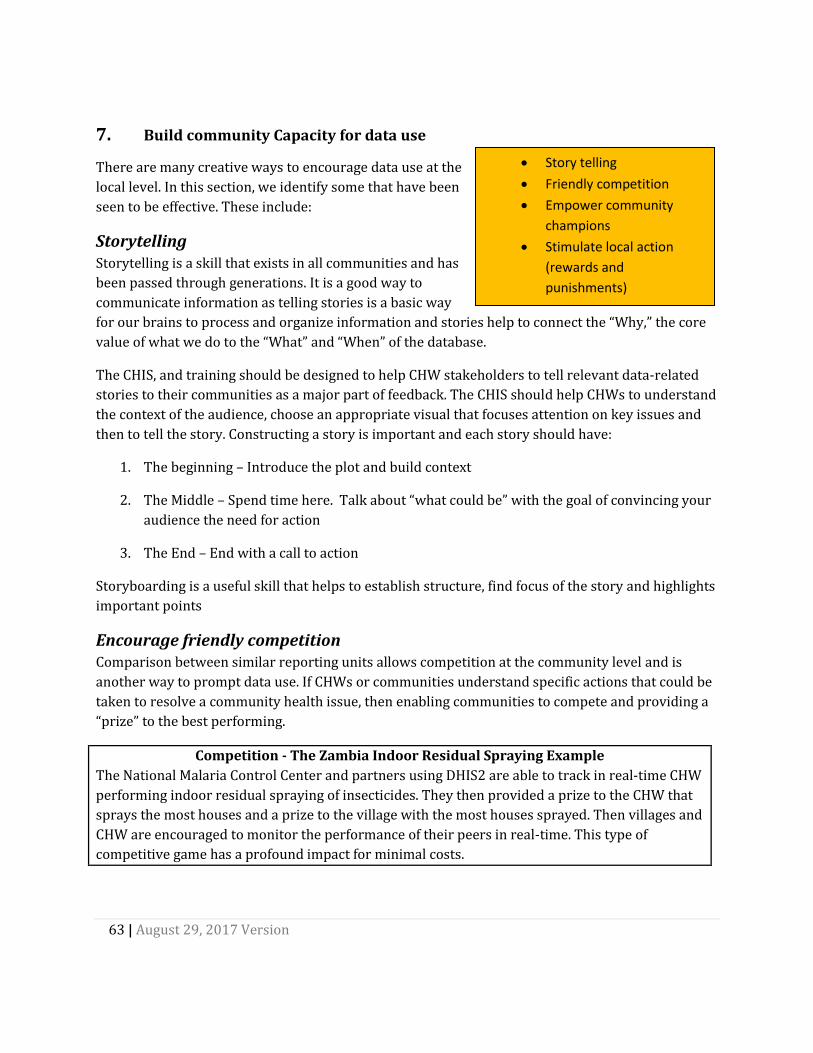
63 | August 29, 2017 Version
• Story telling
• Friendly competition
• Empower community
champions
• Stimulate local action
(rewards and
punishments)
7. Build community Capacity for data use
There are many creative ways to encourage data use at the
local level. In this section, we identify some that have been
seen to be effective. These include:
Storytelling Storytelling is a skill that exists in all communities and has
been passed through generations. It is a good way to
communicate information as telling stories is a basic way
for our brains to process and organize information and stories help to connect the “Why,” the core
value of what we do to the “What” and “When” of the database.
The CHIS, and training should be designed to help CHW stakeholders to tell relevant data-related
stories to their communities as a major part of feedback. The CHIS should help CHWs to understand
the context of the audience, choose an appropriate visual that focuses attention on key issues and
then to tell the story. Constructing a story is important and each story should have:
1. The beginning – Introduce the plot and build context
2. The Middle – Spend time here. Talk about “what could be” with the goal of convincing your
audience the need for action
3. The End – End with a call to action
Storyboarding is a useful skill that helps to establish structure, find focus of the story and highlights
important points
Encourage friendly competition Comparison between similar reporting units allows competition at the community level and is
another way to prompt data use. If CHWs or communities understand specific actions that could be
taken to resolve a community health issue, then enabling communities to compete and providing a
“prize” to the best performing.
Competition - The Zambia Indoor Residual Spraying Example
The National Malaria Control Center and partners using DHIS2 are able to track in real-time CHW
performing indoor residual spraying of insecticides. They then provided a prize to the CHW that
sprays the most houses and a prize to the village with the most houses sprayed. Then villages and
CHW are encouraged to monitor the performance of their peers in real-time. This type of
competitive game has a profound impact for minimal costs.

64 | August 29, 2017 Version
Empower Community Champions Identifying “champions” of data use within the communities is essential to sustaining the CHIS. The
champions will vary from community to community, but all should be actively connected to the
program leads and be given data that can promote the uptake of the program. In most communities,
there are traditional or religious leaders that have tremendous influence and are able to speak to a
large number of community members on a regular basis. Empowering them with data and specific
actions the community could take to improve may be the best way of broadcasting the program to a
large number of people.
Community Champions (traditional, religious leaders etc.) should have influence to mandate that
community members follow through on actions. Community members that did not comply with the
action plan or were found to be the bottlenecks may be punished.
Empowering Community Champions -The Zambia Sanitation Preachers In Zambia community pastors were given prepared sermons in local language with references to
specific Bible passages on the value of community sanitation. These highly respected religious leaders are then able to reach a broad audience of community members.
Stimulate local action Getting community stakeholder, leaders, and changes agents to do what they planned to do is often
a major bottleneck unto itself. If the organization at community level is poor or the CHWs are
themselves unresponsive or simply overwhelmed it can be very difficult to get the community to
perform the activities they have set out to do. It is critical to instill a sense of accountability and
ownership for the outcomes of these activities. Below are some best practices to establish to this:
Local Action - Punishment to Improve Sanitation Access In Zambia, community members that would not build latrines were made to build latrines at the chief's palace every month until they built one at their own house. The latrines at the Chief’s palace could then be available for traditional ceremonies, community meetings, and weddings, that often happen at the chief’s palace.
● Phone calls from supervisors to CHWs or community members with responsibilities.
● Track key indicators that show impact of the actions.
● Show key indicators from other communities so they can gauge their performance and
create competition.
● Reward the best performing community with a ceremony, certificate, or trophy.
● Produce a district/state newsletter that ranks communities based upon their performance
and includes stories about successes and best practices.

65 | August 29, 2017 Version
Case study: Local use of Information in Indonesia Indonesia is a densely populated countries with estimated population of 260 million people and a well- developed infrastructure with regional variations. Administratively, the country is divided into 36 provinces and 514 districts. The Ministry of Health (MoH) (also known as Kementerian Kesehatan) is a government institution, which organize public health affairs within the Indonesian government. The basic health care within the country depends highly on the provision of services at the health facilities, which are managed by the districts. Larger health facilities such as public hospitals are managed directly by the hospital service department under the MoH. The involvement of community level to improve health provision service was adopted in Indonesia through the Community Based Health Services (UKBM). This involved the establishment of pustu (Sub health center), posyandu (Integrated Health Post) and poskesdes (Village health post) (Indonesia Health Profile 2014). As is typical in most countries, health data in Indonesia is collected at the lower level mostly in a monthly basis and send to the higher level with most of the decision making and planning are done at the higher level with top down push of regulation and policies. In its ambition to strengthen the CHIS, the MoH in Indonesia with its stakeholders embarked in a mission to introduce district dashboards as an integrated dissemination platform. The initiative composed of a situation analysis activity where an assessment was conducted to establish the existing infrastructures and create awareness to the district dashboards. The assessment revealed several findings, however this report attempts to document the finding observed in relation to local information use at the lower level. Data Flow At the community level, the data collected is central on the mother and child health as these are the two family members who need to be prioritized in health service care. At the health facility, outpatient and inpatient data are collected together with other data from health programs (HIV, TB, Malaria, etc.). Data at the health facilities are usually aggregated and sent to the higher administrative level for processing and analysis. The use of health information system to manage data was observed to be highly used with disparities on the level, which the systems starts. For example, some community posts had access to the health information system for data collection and reporting generating while other communities’ posts in other districts were collecting and reporting using paper and books.
Figure 1: Data Flow from Community level to national level

66 | August 29, 2017 Version
Local Information Use- Approaches Observed during Assessment
● Data dissemination strategies: The health facilities and community level posts had a structured means of documenting the maternal and child cases within the community. Figures 2 & 3 demonstrate the graphical and textual based reports which the facilities use to track maternal cases within their community. The graphical mechanism also categorizes the cases into three cases (i.e. red, green, and yellow). Red cases are those exposed to risk factors, yellow cases have intermediate risk factors, and green cases are low risk. The cases are also positioned within their villages and street locale for easy follow ups.
Figure 2 & 3: Local use of data
● Monthly meetings in PHC: Data from health workers in the community level usually are collected by the Program Manager at the end of the month. Regular meetings are conducted where the Program Managers present the coverage by the villages and discuss the health problems in that month and the priorities. More discussions were done on how to improve the achievement and areas of low coverage e.g. immunization coverage.
● Quarterly meeting with stakeholders: Quarterly, a cross sectorial meeting is conducted at the district level, Head of health facilities present health data at the current quarter, discuss the role of cross sectoral stakeholders (head of sub-district, head of villages, religious leader, schools, etc.) to improve community service.
67 | August 29, 2017 Version
Chapter 4: Sustainable CHIS DHIS2 Design and
Architecture
Introduction
A sustainable CHIS needs to be well designed to meet the information needs of the relevant
stakeholders and flexible enough to evolve with changing information needs of the system.
Architectural considerations are important for the CHIS to not be standalone and capable of
speaking with other systems. This requires a well-designed data model to guarantee outputs and
outcomes of the envisioned CHIS. This chapter discusses considerations to build sound
architecture and design for a CHIS using the DHIS2.
Learning Objectives:
● Understand the CHIS design, test, and deploy process.
● Appreciate major considerations in building a technical design for the CHIS using DHIS2.
● Understand aspects to consider when introducing mobile based reporting in CHIS and
recognize the most appropriate mobile reporting tool for their use-case.
● Recognize some approaches to design for interoperability of systems with DHIS2 based
CHIS.
Step-by-step guidelines for customizing DHIS2 have been well documented and available on DHIS2
website (www.dhis2.org/documentation), along with discussions and recommendations on DHIS2
as system design, database development, data harmonization, analysis, deployment, human
resources needed and integration with other systems.
Without repeating existing material, this chapter discusses the specific characteristics of CHIS
design. The following chapter concerning the design and architecture of CHIS was written with the
following assumptions in mind:
● Person leading the data model design has extensive working knowledge of DHIS data
models: aggregated, events, and tracker
● Person leading the roll out has extensive knowledge of the national infrastructure and
previous experience on similar roll-outs

68 | August 29, 2017 Version
CHIS System Design, Develop, Test, and Deploy Process:
The process of designing a CHIS in DHIS2 is composed of a nine step process.
1. Mapping Current State Business Processes
The worst configuration of a CHIS in DHIS2 is typically where the current community health
program business processes are simply digitized into DHIS2 without any modifications to optimize
them. To avoid this mistake the first step to designing a well-functioning CHIS in DHIS2 to perform
a thorough mapping of the current state of the community health program M&E data flow. The
principal goal of mapping the current state are to:
1. Harmonize CHW reporting tool into as few as possible (1 or 2).
2. Standardized the harmonized reporting tools across the whole country.
3. Identify what is working well.
4. Identify what is not working well and how it could be improved.
There are essentially two steps to mapping the current business process.
1. Compile all current data collection forms. For each form identify:
a. What are the data elements and indicators on this data collection form? Are these in the CHIS M&E framework? If not, should we still capture them?
b. Who is responsible for capturing the data and how long does it take complete?
c. What is the frequency of the completing the reporting form?
d. What are the common mistakes or difficulties with completing the data collection form?
e. What job aids or workflow support tools are built into the data collection form? Do they work? Are more needed?
f. Map the electronic or paper data flow from point of collection to central level
i. What organizational unit is the data captured against?
ii. What are the points of aggregation? Who performs the aggregations?
2. Compile all current data analysis/data use tool. For each tool identify:
a. What is the level of granularity of the data presented?
i. Organizational level of aggregation (i.e. community, facility, district, or national)

69 | August 29, 2017 Version
ii. Periodicity level of aggregation (i.e. daily, weekly, monthly, ex.)
b. What decisions are made or actions performed based on that tool?
c. What are the problems or issues with the tool?
d. What could be done to address these problems or issues?
2. Considerations in Translating Business Process to DHIS2
Translating the data flows of community in DHIS2 is the most crucial step in the design process.
There are nine critical elements that must be considered. These are:
1. Logic of data aggregation
2. Reporting periods and frequency
3. Organizational hierarchy
4. Vertical health programs vis-à-vis HMIS
5. Partner reporting
6. Outputs: Internal and External
7. Infrastructure considerations
8. Technology considerations for data acquisition = tool selection
9. Security
Logic of Data Aggregation
While designing the aggregation, there could be five typical scenarios
1. Extending from the existing facility system to community health workers needs to
ensure that the logic for data aggregation stays synchronized within the existing CHIS, in
both ways of:
a. CHW Aggregate data reporting: If aggregate data is being collected at facility level,
and CHWs are also submitting aggregate numbers, the summed value of facility and
CHW needs to represent a meaningful figure. For example:
i. Case 1 – CHWs is solely responsible for reporting on all pregnant women
registered for ANC in the area. This data element should be reported by all
70 | August 29, 2017 Version
CHWs and its aggregate should be taken as facility reported number: i.e.
Number of pregnant women registered for ANC at facility = CHW1+ CHW2 …
ii. Case 2 - In case CHWs are to report on this data element of community
services and the facility is also providing similar services, then the total
count of services provided is the sum of CHWs + facility: i.e. Number of
pregnant women registered for ANC = facility + CHW1+ CHW2 …
Note on keeping CHW and facility data sets separate: It is generally considered a best practice to have separate data sets for facilities and CHWs. Meaning, the CHW should not be submitting data via the facility data set. This is to minimize potential for double counting of patient between facility and CHW, and it enables better performance monitoring of CHWs and facilities.
b. Case based (tracker) data reporting where case location is not important: In case aggregate data is being collected at facility and CHWs are to collect name/case based data for the same, in such case aggregation of all case/names should be done at facility level. Meaning cases should be enrolled as tracked entities against the facility even if CHWs are capturing the data. For example, if there are 10 records of individual ANC cases captured by the CHW in the ANC tracker program for one month, then the facility value for ANC cases is 10. In DHIS2, this process of aggregation is automated.
An example organizational hierarchy:
|__ Facility (Org unit level)
ANC Case 1 (Tracked entity)
ANC Case 2 (Tracked entity)
ANC Case 3
ANC Case 4
…….
c. Case based (tracker) data reporting where case location is important: In
situations where the case location is important (i.e. village, community, etc) for
epidemiological disease control (ex: malaria active case detection) or door-to-door
outreach services (ex: immunization campaigns) it may be best for the case to be
enrolled in the tracker program against the lowest level organizational unit that
reflects their location of habitation, where they live. In this situation aggregated
facility reporting will typically be a separate data set and only capture aggregated
cases that happen just at the facility. Often in the case of epidemiological control
programs facilities will also be performing individual case reporting.
For example, in a malaria program where CHW are performing active case detection

71 | August 29, 2017 Version
to villages of people who test positive for malaria the individual case should be
enrolled against the village. This allows CHWs to know the location of cases for
active case detection. Example organizational hierarchy below:
|__ Facility (Org unit level)
|__ Village (Org unit level)
Malaria Case 1 (Tracked entity)
Malaria Case 2 (Tracked entity)
Malaria Case 2
d. Case based (tracker) data reporting where case association with CHW is
important: In situations where it is important to associate specific cases with a
CHW that is providing services (ex: health education program) the case may be
enrolled into the tracker program against the CHW which is actually configured as
an organizational unit. To accommodate for high CHW turnover it is very important
that the organizational unit for the CHW represents the CHW’s position and not
necessarily the specific name of the CHW, meaning the actual CHW working as an
organizational unit can change without having to change the name of the
organizational unit itself.
For example, in a HIV/AIDs education program where a CHW will provide young
women with STI education, contraceptives, and counseling and testing it may be
very important to associate an individual case with a specific CHW. The example
organizational hierarchy is below:
|__ Facility (Org unit level)
|__ CHW 1 (org unit level)
Girl 1 (Tracked entity)
Girl 2
|__ CHW 2
Girl 3 (tracked entity)
e. Designing a new CHIS when it is not required to feed into an existing facility HIS,
then it leaves space for the defining aggregation logic to be relatively independent of
the need to synchronize with bringing aggregation to the facility. An example of this
could be a CHIS being set up from scratch for a specific campaign or event, then this
is relatively independent of the aggregation logic of the facility.
Reporting Periods/Frequency
Important when the reporting period for CHWs is different from the reporting period at the next
level which is the facility. The CHW reporting should be at the same frequency or more frequent
than facility reporting. Facility reporting should not be more frequent that CHW. For example:

72 | August 29, 2017 Version
CHW data element:
● Number of mosquito bed nets distributed today (daily reporting)
● Number of mosquito bed nets distributed this week (weekly reporting)
Facility data element:
● Number of mosquito bed nets distributed this month
In the first case (a) 30 daily reports will make monthly aggregate for bed nets distributed: Total
nets distributed = Facility (Month) + CHW Day 1 + CHW Day 2 . . . . . + CHW Day 30
In the second case (b) 4 weekly reports will make the monthly aggregate for bed nets distributed.
Total nets distributed = Facility (Month) + Week 1 + CHW week 2 . . . . . + CHW week 4
If the reporting periodicity is same for CHW and facility, then we must ensure that the aggregation
logics must be matched, as discussed above.
Organization Units and Hierarchy
Another important consideration is how to add CHWs in the reporting hierarchy. Given the scale
and number of CHWs, this becomes one of the fundamental decisions in CHIS design.
A organizational tree represents the administrative or geographical division located inside a
hierarchy. For example:
|__ Country, HQ [L1] |__ Province, district (administrative unit) [L2]
|__ Facility, clinic, hospital (providing services) [L3]
In this example above the organizational unit hierarchy follows the administrative and geographical
division. The hierarchy is then divided into organizational units such as a province, district, or
individual facility. Organizational units drive: data entry, security: capture and outputs, and
analytics: data is aggregated/rolled up through the hierarchy (Gold Rule: Aggregation should
always be meaningful).
The when properly configured the organizational hierarchy should enable the user to know:
1. Where the data is associated with (i.e. individual patient, household, village, health facility,
community health posts, etc.).
2. What the data means. Is the data able to be aggregated up the hierarchy in a meaningful
way? Is data captured at that organizational unit meaningful to that level?
3. When is the data captured. The period assigned to the data set or the program should be
aggregable up the hierarchy to larger and larger periods. For example, you can not have a
monthly reported data element at community level aggregating into a weekly data element

73 | August 29, 2017 Version
at its parent facility.
4. Who captures the data and provides the services. This is especially important for
community health programs where we need to know the actions and services delivered by
individual CHWs. This is possible to configure in the hierarchy.
Every hierarchy should pass the CHIS hierarchy test:
1. Does it enable data to be captured against an organizational unit that represents
where and who the data is associated?
2. Does the organizational hierarchy enable security and access controls?
3. Does the aggregation produce the desired outputs: indicators, analytics,
dashboards, maps, etc.
4. Is the data able to be associated with a single CHW? (Not necessary, but highly
recommended)
Based on the empirical experiences from various country setting, we understand that could be
found the following organizational hierarchy scenarios:
Case 1 - One or more CHW work in specific villages (BUT NOT in other villages).
Country [L1] |__ Regions [L2]
|__ Facilities [L3] |__ Village [L4] |__ Health Worker 1 [L5] |__ Health Worker 2 [L5] |__ Village [L4] |__ Health Worker 3 [L5] |__ Health Worker 4 [L5]
Does it pass the test?
1. Does it enable data to be captured against an organizational unit that represents where and who the data is associated? Yes, data can be captured at Health Worker level [L5], which is only present under one Village [L4]. This represents that data was collected by the specific Health Worker and that it belongs to one specific Village unequivocally.
2. Does the organizational hierarchy enable security and access controls? Yes, every health worker will be assigned to its own organization unit, which is the lowest level. It implies that s/he will be able to see only data that him/herself has collected.
3. Does the aggregation produce the desired outputs: indicators, analytics, dashboards, maps, etc. Yes, aggregation at each level will accumulate data into health worker, villages, facilities, regions…

74 | August 29, 2017 Version
4. Is the data able to be associated with a single CHW? (Not necessary, but highly recommended)
Yes, data can always be associated to the level where it was captured, which in this case is the CHW. Yes, it passes the test.
Case 2 - CHW works in several villages/communities. CHWs DO NOT share villages.
Country [L1] |__ Regions [L2] |__ Facilities [L3] |__ Health Worker 1 [L4] |__ Village A HW1 [L5] |__ Village B HW1 [L5] |__ Health Worker 2 [L4] |__ Village C HW2 [L5] |__ Village D HW2 [L5] Does it pass the test?
1. Does it enable data to be captured against an organizational unit that represents where and who the data is associated? Yes, data can be captured at Village level [L5], which is only present under one Health Worker [L4]. This represents that data was collected in the specific Village and that it belongs to one specific Health Worker unequivocally.
2. Does the organizational hierarchy enable security and access controls? Yes, every health worker will be assigned to its own organization unit [L4], being able to see data that belongs to that organization unit and its children [L5]. In this case children are Villages in which the health worker works, hence, s/he will be able to access only to data that him/herself has collected.
3. Does the aggregation produce the desired outputs: indicators, analytics, dashboards, maps, etc. Yes, aggregation at each level will accumulate data into village, health worker, facilities, regions…
4. Is the data able to be associated with a single CHW? (Not necessary, but highly recommended) Yes, data can always be associated to the Health Worker level [L4].
Yes, it passes the test on the web or Android, but does not work for SMS data capture.

75 | August 29, 2017 Version
Case 3 – CHW works in more than one village/community
Country [L1] |__ Regions [L2] |__ Facilities [L3] |__ Village A [L4] |__ Health Worker 1 [L5] |__ Health Worker 2 V-A [L5] |__ Village B [L4] |__ Health Worker 2 V-B [L5] |__ Health Worker 3 [L5] Does it pass the test?
1. Does it enable data to be captured against an organizational unit that represents where and who the data is associated? Yes, data can be captured at Health Worker level [L5], which is under one or more Villages [L4]. This represents that data was collected by the specific Health Worker and that it belongs to one specific Village unequivocally.
2. Does the organizational hierarchy enable security and access controls? Yes, every health worker will be assigned to its own organization unit, which is the lowest level. It implies that s/he will be able to see only data that him/herself has collected.
3. Does the aggregation produce the desired outputs: indicators, analytics, dashboards, maps, etc. No, we can aggregate by village, facility, region… , however, due to the repetition of health workers in different villages (Health Worker 2 in the example) we cannot aggregate data by Health Worker using the hierarchy.
4. Is the data able to be associated with a single CHW? (Not necessary, but highly recommended) Yes, data can always be associated to the Health Worker level [L5].
No, it does not pass the test because CHW work cannot be aggregated because of repeated names. This will also not work for SMS.
Case 4 - CHW goes to more than one village.
Country [L1] |__ Regions [L2] |__ Facilities [L3] |__ Health Worker 1 [L4] |__ Village A HW1 [L5] |__ Village B HW1 [L5] |__ Health Worker 2 [L4] |__ Village B HW2 [L5]

76 | August 29, 2017 Version
Does this pass the test?
1. Does it enable data to be captured against an organizational unit that represents where and who the data is associated? Yes, data can be captured at Village level [L5], which is only under the Health Worker [L4]. This represents that data was collected in the specific Village and that it belongs to one specific Health Worker unequivocally.
2. Does the organizational hierarchy enable security and access controls? Yes, every health worker will be assigned to its own organization unit [L4], being able to see data that belongs to that organization unit and its children [L5]. In this case children are Villages in which the health worker works, hence, s/he will be able to access only to data that him/herself has collected.
3. Does the aggregation produce the desired outputs: indicators, analytics, dashboards, maps, etc. No, aggregation at each level will accumulate data into health worker, facilities, regions… but we cannot aggregate data by Village using the hierarchy (see Village B).
4. Is the data able to be associated with a single CHW? (Not necessary, but highly recommended) Yes, data can always be associated to the Health Worker level [L4].
No, it does not pass the test. Village data cannot be aggregated. This will also not work for SMS.
Case 5 - CHW is assigned to a village as a user but not represented in the hierarchy.
Country [L1] |__ Regions [L2] |__ Facilities [L3] |__ Village A [L4] |__ Village B [L4] Does this pass the test?
1. Does it enable data to be captured against an organizational unit that represents where and who the data is associated? Partially, data can be captured at Village level [L4] but there is no organization unit to relate to the Health Worker.
2. Does the organizational hierarchy enable security and access controls? Partially, as long as the Health Worker is allowed to access all data in the Village to which s/he is assigned.
3. Does the aggregation produce the desired outputs: indicators, analytics, dashboards, maps, etc. Partially, as long as we don’t need aggregation by Health Worker. Aggregation at each level will accumulate data into villages, facilities, regions…
4. Is the data able to be associated with a single CHW? (Not necessary, but highly recommended) No, CHW is not present in the Hierarchy and we cannot filter data by Health Worker using the

77 | August 29, 2017 Version
hierarchy. Partially (first 3 questions but not 4). The work of a single CHW is not defined in the hierarchy and will not be able to be viewed in the analytics. Custom analytics could be made to produce this, but these analytics will require significant development and maintenance.
Case 6 - Community data is submitted as aggregate at facility or higher level.
Country [L1] |__ Regions [L2] |__ Facilities [L3] ← Aggregated village data Does this pass the test?
1. Does it enable data to be captured against an organizational unit that represents where and who the data is associated? No, we cannot register data against the community or the village.
2. Does the organizational hierarchy enable security and access controls? No, all village and community data will be accessible from all users assigned to the Facility level [L3]
3. Does the aggregation produce the desired outputs: indicators, analytics, dashboards, maps, etc. No, aggregation at each level will start accumulating at facility level, we cannot have data aggregated by village or community.
4. Is the data able to be associated with a single CHW? (Not necessary, but highly recommended) No, CHW is not present in the Hierarchy and we cannot filter data by Health Worker using the hierarchy.
No, it does not pass the test. The data for an individual community cannot be disaggregated.

78 | August 29, 2017 Version
Case 7 - Representing a CHW as Category Option
In small CHIS where there are less than 250 CHWs it is possible to use configure CHWs as category options. This configuration will satisfy the test. The graphic below illustrates how this option can associate a village with many CHWs:
Figure 4.1: Relationship possibilities when CHWs are represented by category options.
Does this pass the test?
1. Does it enable data to be captured against an organizational unit that represents where and who the data is associated? Yes, data can be captured at Village level [L4] and we can relate it to the Health Worker using the Health Worker Category as a filter.
2. Does the organizational hierarchy enable security and access controls? Partially, if the Health Worker is allowed to access all data in the Village to which s/he is assigned.
3. Does the aggregation produce the desired outputs: indicators, analytics, dashboards, maps, etc.
Yes, aggregation at each level will accumulate data into village, facilities, regions… And data can be discriminated by Health Worker by using the Category as a filter.
4. Is the data able to be associated with a single CHW? (Not necessary, but highly recommended) Yes, data is linked to the Health Worker through the Category Option selected in Data Entry. Yes, it passes the test. However, this configuration is not scalable for large CHIS with many CHWs. It also is not currently enabled for SMS or Android Data Capture without a custom application.

79 | August 29, 2017 Version
Keeping the Organizational Hierarchy Clean
DHIS2 does not support multiple organizational hierarchies. To enable data mining at scale each
level should represent a single type of reporting unit. Different types of reporting units at a single
level make it virtually impossible to perform analytics in DHIS2. For example:
BAD |__ Facility [Org unit level] |__ CHW 1 [Org unit level] |__ Village 1 |__ CHW 2 |__ Village 2 |__ Borehole 1 |__ Borehole 2 |__ Village 3 |__ Village 4 |__ Borehole 3 |__ Borehole 4 |__ Borehole 5
GOOD |__ Facility [Org unit level] |__ CHW 1 [Org unit level] |__ Village 1 |__ Borehole 1 |__ Borehole 2 |__ Village 2 |__ Borehole 3 |__ CHW 2 |__ Village 3 |__ Borehole 5 |__ Borehole 6 |__ Village 4
Figure 4.2: Bad vs. Good Ways to Structure Organizational Units
WARNING: If CHWs are included in the hierarchy it is best practice to name the organizational unit
with the position and not the actual name of the CHW. For example, if Peter Banda is a CHW
working as a CHW under Choma Health Facility; his organizational unit would be named, “Ndola
CHW 01,” and not “Peter Banda CHW.” In this example if Peter leaves the role of a CHW then a new
CHW can be trained to replace him and can then fill the organizational unit Choma CHW 01. If 20%
of CHWs need to be replaced annually and the name of the CHW is the name of the organizational
unit they represent then 20% of the CHIS organizational unit will have to be changed annually.
Scale - How big is too big for the hierarchy?
If CHWs or individual communities are included in the hierarchy and the CHIS is taken to national scale it is very likely that the CHIS/HMIS will contain tens of thousands of organizational units. As long as the organization units are well defined and organized it is very possible to have a huge number of organizational units. For example, the Zambia CHIS contains nearly 45,000 organizational units representing all villages in the country. In dealing with the above multiplicity of conditions presented, CHW can be created as an organization unit in DHIS2 or as a user for the org unit. In each case, it is important to consider and evaluate vis-à-vis the complete organization hierarchy for the country or project, to ensure the hierarchy is manageable, typically not going beyond 7-8 levels.

80 | August 29, 2017 Version
Vertical Health Program vis-à-vis HMIS
In case CHWs are being introduced to report on health program specific data (malaria, HIV, infant
feeding habits, contraception counselling, etc.), and this data needs to be included in the facility
reporting system / routine HMIS, in such case additions need to be made in the facility dataset
reflected in the DHIS2.
Partner Reporting
In case CHWs are being introduced to report on specific projects being run by a partner (and not
the routine facility HIS), in such a case project specific data sets and data flows should be defined
and followed, which would be independent of the routine HIS.
Outputs: Internal and External
Dashboards, visualizations, internal reports, donor reports, other agencies reports - One of the
crucial element running the CHIS system design is the expected outputs and analytics from the
system. Though this is a general rule of thumb in the design of any information system at any level,
but becomes a crucial consideration in a CHIS when the scale of data is very large and has
immediate implications on the workload of a CHW.
Infrastructure Considerations
● Backend Infrastructure & Hosting- Local vs Cloud DHIS: Sizing- Server hosting becomes
crucial in case of CHIS if mobile based reporting using SMS is to be used. SMS based
reporting will not work if the server is hosting on a cloud outside the country, as it will
involve international messaging. As such, it is in such the server must hosting within the
country.
● SMS Gateway Setup and Maintenance: To enable SMS based reporting, integration with
SMS gateway is a primary requirement. Local/country based gateway providers should be
contacted and APIs checked for enabling integration.
● Toll Free vs. User Paid: In case of making SMS’ free for the sender/CHW, mobile service
provider or gateway service provider with toll free subscription is required for integration.
In this case, the cost needs to be borne by the MoH centrally and provided toll free for the
CHWs
● Airtime Management & Reimbursement to Workers: In case of using mobile based
reporting for CHWs (SMS or internet based), use and management of airtime is to be
allocated for reporting planned. An effective system of reimbursement for CHWs must be
defined, as if CHWs do not receive the money in time for what they have spent, they could
resist the use of the phone.
81 | August 29, 2017 Version
● Assessing Network Connectivity and Power Supply: While initiating reporting from
CHWs using mobile phone, an assessment of network coverage needs to be considered,
especially in rural and border areas. The timings of internet supply is often variable and
needs to be considered in defining reporting routines. Often, CHWs must deal with
intermittent power supply which impedes reporting and also the charging of their phones
and other devices.
● Device Ownership and Usage:
○ Right at the time of giving the devices (phones, tables, etc.) to CHWs, it is important
to clarify the ‘ownership’ of the devices along with responsibilities of maintenance,
upkeep and loss. There is often confusion on whether the device is owned by the
institution or the individual, and what the respective responsibilities are.
○ However, if the CHWs are expected to use personal devices for reporting, it is all the
more important to clarify issues on airtime/data cost along with the reimbursement
mechanism.

82 | August 29, 2017 Version
Technology Considerations for Data Acquisition I.e. Tool Selection
Paper SMS/USSD Simple phones
Smart Phones 3rd party
integration Computers
When to use it
Always an option, especially when digitizing data is not a priority
Digitizing data at source is priority, reporting burden is very low, mobile internet is not available or phones are not able to be provided.
Digitizing data at source is priority, higher reporting burden, CHWs have a low ability to use smart phones, and mobile internet is available
Digitizing data at source is priority, reporting, mobile internet is available, and CHWs are able to use smartphones.
Digitizing data at source is priority & a data collection solution is implemented
Digitizing data depending on the level of computer availability
Scalability (geography, service, users, domains)
Scalable across all three elements
Technically east to scale, while training of users will required when adding new elements
Easy to scale geography & users, but not in terms of increasing reporting requirements
Easy to scale in terms of geography, users, and increasing data
Managing integration is an ongoing task; Scaling across users is easiest, while scaling on services & domain will need to be built within the integration approach
Easy to scale across all 3
Data Granularity
Possible to design for deeper dis-aggregation
Not advised for very disaggregate data or long forms
Not advised for very disaggregate data or multistage tracker programs.
Possible to design for deeper dis-aggregation and complex tracker programs.
Integration approach should build in all capturing whatever is reported
Possible to design for deeper disaggregation
Sustainability (Initial cost, ongoing cost)
Initial & ongoing printing; Training cost
Low cost solution; but at extremely high-volume of SMS costs can become significant Training is a cost Reporting incentives to CHWs
Initial & ongoing training cost; Procurement Ongoing internet costs Reporting incentives to CHWs
Initial & ongoing training costs; Procurement Ongoing internet costs Reporting incentives to CHWs
Integration of systems is a big cost
Initial training costs; Ongoing hardware maintenance
Human Capacity
Needs training on forms & logic of forms vs. registers
Needs training on forms & logic of SMS. Significant issues can be expected with short codes for SMS and timeout errors for USSD.
Training on forms, training on reporting using the application. CHWs should be able to troubleshoot basic application and phone problems
Training on forms, training on reporting using application. CHWs need to be able to troubleshoot basic application and phone problems
Training of CHWs is not required, as the integration is happening at server level
Training on forms: Training on the logic of forms vs. registers
Figure 4.3: Conceptualizing Data Acquisition

83 | August 29, 2017 Version
Security
DHIS2 is inherently a very secure software. Furthermore, many countries have strict laws on data
security especially in terms of patient level data. Make sure you are aware of all national laws and
policies around data security prior to developing a CHIS in DHIS2. As it is applied to CHIS in DHIS2
generally there are several considerations:
● If CHWs are tracking individual patients ensure that CHWs are only able to see the patients
that are assigned to them.
● Ensure users are only able to see data as it applies to their role, actions, and decisions. Do
not give users access to more data than they need.
● Access to data should always be protected by at least one level of access control. (i.e.
password, pin code, etc) Simply swiping a mobile device to “unlock” it is not considered
access control.
● Interception of unencrypted data via mobile signals is possible for SMS, USSD and J2ME.
There are measures possible to prevent this. Please contact the core DHIS2 team for more
information.
● Servers should be in a secure setting.
● Users should not be given more access to DHIS2 applications or features than what is
necessary based on their duties.
● Sharing and privacy settings in DHIS2 can significantly increase security but must be
carefully managed. For more information please see the DHIS2 User Manual.
3. Develop Mock-Ups and Prototypes of Analytics Outputs (Feedback Mechanisms)
All information systems should be designed for data use. An architect does not start constructing a
building before he knows exactly what it will look like and the features it will have by making a
blueprint and a mockup or prototype. Likewise, for a CHIS prior to system configuration all of the
stakeholder analytics, feedback mechanisms, and dashboards must be designed and have mockups
and prototypes.
In chapter two, these guidelines introduced the process for identifying stakeholders and in chapter
three the process for selecting a feedback mechanisms for stakeholders was covered. Now that you
know the data-use framework (who needs data and how it needs to be presented) the final step is
to create mockups and prototypes of what those feedback mechanisms actually will look like.

84 | August 29, 2017 Version
A mockup is a scale model of what the feedback mechanisms looks like. For example, below is a
mockup of a district ICCM dashboard. This mockup was developed prior to the configuration of the
data base.
Figure 4.4: Prototype of a CHIS District Dashboard
The mockup is then used to:
● Ensure all data elements and indicators necessary for the stakeholders is being included in
the system.
● All indicators are able to be presented in the analytics shown considering the degree of
granularity of the analytics. For example, the mockup of the bar charts above is weekly
counts at community health post (CHP) level. That means we are able to calculate those
indicators given the data we have available at the frequency desired (weekly) at CHP level.
Alternatively, if we only had the data elements available to create that indicator captured
monthly at facility level we would not be able to calculate the indicator to a sufficient degree
of granularity as what is required (weekly and at CHP level).
● Guide the actual development of the live analytics and feedback mechanisms.

85 | August 29, 2017 Version
4. Drawing CHIS Data Flow in DHIS2
The goals of this process are:
1. Develop a clear idea of the desired state of the CHIS in DHIS2
2. Formulate how to harmonize parallel or redundant existing data flows
3. Resolve overly burdensome or unclear standard operating procedures
4. Formulate how to reconcile multiple reporting hierarchies into one.
5. Identify job aids or workflow support that could be incorporated into the DHIS2 data
capture tools.
6. Develop new data flow diagram/wireframe
5. Developing Reporting Guidelines
From the assessment and system design chapters, data flow from beginning to end is clearly
defined. To develop data capture guidelines, start with the first event of the data flow and move
upwards including all events, whether they utilize paper, mobile applications, or computers. For
each point at which data is captured or transmitted the exact process and responsibilities
for how that event is achieved needs to be defined.
For each step in the data flow define each event in the format in Figure 4.4.
Event: Event name
Dataset/Reporting tool(s):
The name of the data set or reporting tool(s)
Modality of transmission or
entry:
Name the application that is used and on what device or outline the paper trail to data entry. (Remove this if the event is only data capture and not transmission or entry into DHIS2)
Responsible person: This is the person/role that is ultimately responsible for the completion of this event.
Periodicity: The frequency with which this event takes place. For example, “monthly,” “weekly,” or “quarterly
Event deadline: When the event should be completed. For example, “The 10th of the current month,” “By 17:00 on Tuesday of the Current Week”, or “By the 5th of the first month in the new quarter.”

86 | August 29, 2017 Version
Data transmission or entry incentive
What is the reporting incentive and how is the incentive delivered? (if applicable):
Data quality checks performed:
Outline what are the checks that are performed during this event. This does not include the quality checks performed after the data has been submitted.
Access to reporting tools
: How are necessary reporting tools (e.g. registries, reporting forms, applications, phones, etc.) stored, accessed, and replenished?
Narrative: The narrative describes the event in long text. It is very specific. This could include best practices, instructions on completing the paper registries, instructions for ordering or making new registries, instructions for using mobile phones, etc. Think practically on what could form bottlenecks for data submission.
Figure 4.5: Data Capture SOPs
Frequent Questions on Data Capture Guidelines
What if my CHIS has a paper trail from CHW or community levels to facility or district level?
Some CHIS do not have data submission at CHW or community level. In this event, paper records or
registries are produced at community level and then physically transported to facilities or higher
levels. It is important for the protocol to include all CHIS activities, even if they are paper trail, as
the timeliness and quality of one reporting stage directly impacts the success of the next.
Can the data capture guidelines be made to follow the roles of CHIS users?
Yes. You may be more use to seeing SOPs based on programmatic roles, while these data capture
guidelines are based on the data flow. Many countries and programs incorporate the data capture
guidelines into a larger programmatic SOP organized by stakeholder roles/titles (e.g. CHW, CHW
Supervisor, District Health Officer, etc). The data capture guidelines can be incorporated into this
format as long as a sufficient level of detail is provided for each event performed by the stakeholder.
What if my CHIS uses paperless patient registries at CHW level?
In some CHIS, CHWs may be tracking individual patients completely paperless via DHIS2 tracker
application or similar application on an android or feature phone. In this event, there will not be a
paper registry where information is initially recorded and there will be no production of periodic,
aggregate reports. In these cases, typically it is best to consider the patient-CHW interaction and the

87 | August 29, 2017 Version
capturing the patient data as a single event to be included in the data capture guidelines. Keep these
factors in mind:
● In some cases, tracker use significantly increases the reporting burden of the CHW, so in
high patient volume settings patient tracker may be too burdensome. However,
configured as job aid for the CHW employing program rules and skip logic using the
tracker application can reduce the reporting burden, increase data quality, and support
CHW service delivery.
● Tracker will provide much more granular data and has shown to be appropriate at
community level in disease elimination, epidemic control, expanded immunization
programs, referral tracking, and neonate tracking.
● At community level, tracker should only be used if there is a targeted action requiring
data from a single tracked entity. The specific response to that data should also be
defined in the data capture guidelines.
6. Develop CHIS Meta-Data Dictionary
A meta-data dictionary is used to describe all of the meta-data attributes. The enables that system
users and administrators understand the meaning and purpose of each meta-data item.
For more information on how to develop a DHIS2 meta-data dictionary please see: the Logical
Outcomes website (http://logicaloutcomes.net/using-a-meta-data-dictionary/)
7. Perform DHIS2 Configuration
The final step after compiling a meta-data dictionary to actually perform DHIS2 system
configuration. Step-by-step guidelines for configuration of DHIS2 have been well documented and
available on DHIS2 website (www.dhis2.org/documentation).
8. Populate Prototype Database and Test
Thoroughly testing a CHIS is critical prior to deployment. There are several goals of testing:
● Test indicator calculation - mock or legacy data should be imported into the prototype
database to test if all the indicator calculations are correct.
● Use acceptance (analytics) - to test if all stakeholders are satisfied with the analytics,
dashboards, and feedback mechanisms user experience.
● User acceptance (data entry) - to test if all stakeholder performing data entry are satisfied
with the data entry user experience. It is also necessary to test if any skip logic, validations,
alerts, workflow support, or job aids are working and users are satisfied.
● Bug capture and reporting. With virtually all new database there will be glitches or bugs. It

88 | August 29, 2017 Version
you are thoroughly testing your database then most of these bugs will be noticed. It is best
to resolve all bugs before you deploy your CHIS to scale. Bugs can be reported DHIS2 JIRA
(http://jira.dhis2.org)
Have a “sandbox” database for testing: It is a very good idea to have a cone of your production database to perform testing in. Any change you make to your productions database should be tested first in your “sandbox” prior to being done in your production.
DHIS2 version updates: It is best to keep up to date on versions of DHIS2. There is a new version of DHIS2 released every six months. Typically, it is best to keep one or two versions behind the latest releases. If you do not keep up with the releases then you may find it difficult to find people to support your version of DHIS2 when you do have serious problems. Upgrades need to be planned well in advance for. The same testing process outlined here for a new database can be employed when you have upgraded. Please remember that something almost always breaks or stops working when you upgrade a large production database so please be plan and test thoroughly before upgrading.
9. Deploy
There are many ways to deploy a CHIS. The deployment strategy is dependent on many things like
training strategy, scale of the CHIS, etc. In general, there are two deployment strategies, “The big
bang and a phased roll-out. Both strategies tend to ultimately cost the same amount of resources.
1. “The Big Bang” - This deployment strategy is often used in situations where development,
testing, and initial training of users can or must be achieved quickly. This typically a CHIS
small in scope with a lot of implementation support staff working initially on it. This
strategy is preferred in situations where rapid crisis response is necessary like in a disease
outbreak where community data is needed for epidemic control. Because of the rushed
nature of this strategy, there will be technical issues that are identified post deployment
that may hinder system use.
2. Phased Roll-out - This is the most typical approach to deployment of the CHIS where
deployment is done region by region. Depending on the scale of the CHIS this may take
years, but it will result in a much more stable, well tested CHIS.

89 | August 29, 2017 Version
Tiered Technical Support to CHISs
To provide support to the CHIS, the technical central unit must be able to capture, catalogue, and process all support requests, system errors, and flaws (also known as “bugs”). In most large information systems, a multi-tiered support system is required. Multi-tiered means simple issues are able to be addressed by lower level supervisors and more difficult or complex issues are moves up the tiers until they reach someone who is able to address them. Below is model of a CHIS tiered support system with an example issue that that tier may be expected to address.
Figure 4.6: Model of a CHIS Tier Support System
The vast majority of issues requiring support will be simple issues that should be able to be addressed by the first tier of support. Often this first tier is the CHW’s direct supervisors. This tier
should be able to address simple hardware and software issues. If the CHW supervisors cannot resolve the issue that will then have to escalate it to a higher tier.
Tier Two requests are addressed by are often addressed by district level or sub-national information systems officers, who are trained to manage system configuration issues and all advanced issues around the user interface, data imports and exports.
Tier Three requests are typically addressed by central level IT support persons. They should be able to respond to any back-end maintenance requests.
Many countries with very large-scale CHIS will have more tiers than three. While, smaller programs may have fewer. Regardless of the number of tiers, it is essential that support requests can be submitted by any user directly through either their DHIS2 instance, phone or by email. Using the
messaging application, a user may message to the ‘Central Technical Support’ user group for their sub-national technical support group depending on how the tiers are composed. The “Technical Support” user group is typically made up of central level technicians. Similarly, they could call or email the technical team directly. Once a request for support has been sent to the technical team

90 | August 29, 2017 Version
should acknowledges receipt of the request within a short time period like 12 hours
Best Practice
Have a 24-hour technical support hotline and support desk user group in DHIS2 maned by central level HMIS support staff. When users of the system have difficulties using the system if they feel that they have no avenue to receive technical support they may ultimately quite using the system. A 24-hour, toll free technical support hotline and support desk can give users a sense of support and resolve issues on the fly. Additionally, for CHIS users with a computer they can use the DHIS2 messenger to send support requests to the support desk user group. Below is an example of South Africa’s guide to using their support desk build into DHIS2 messenger.

91 | August 29, 2017 Version
Some Design Guidelines for More Sustainable CHIS
In this section, we discuss some design guidelines to develop more sustainable CHIS. A running
theme across these guidelines is our effort to shift the focus from a more supply side approach to
one that is more grounded in a demand side based thinking that is human-centered and focused to
reducing the data burden of CHWs and adding value to their everyday work. These design
guidelines include:
1. Build the CHIS based on a participatory design approach
2. Have an architectural thinking to design at the core
3. Design CHIS based on an overarching framework of data governance and standards
4. Design CHIS to support local action rather than enabling more control and surveillance from
the top
5. Build CHIS based on existing infrastructure conditions, that necessarily must be hybrid in
nature
6. Plan for incremental evolution of the systems, and not seek to design based on a “clean
slate” approach
These guidelines are now discussed in some greater detail.
Participatory Design Approach
A participatory design approach assumes that the end users are not just passive providers of data
and recipients of systems that are “designed from nowhere,” but are actively engaged in their co-
construction together with the design and development teams. While traditionally, various
techniques have been described to enable participatory design (storytelling, focus groups,
interviews, mock ups, etc.), these techniques have been developed based on assumption of co-
location, single systems, largely situated in single organizational settings. However, the diverse
settings of CHIS in terms of scale, prior experience with computerization, levels of literacy and
extreme diversity, require these techniques to be sensitively adapted and extended.
The advent of web-based systems implies that the designers and developers become more
geographically and culturally remote from the users, and further challenges the use of traditional
participatory design techniques. Appropriate approaches to enable participatory design need to be
customized to existing contextual conditions, which may also involve the use of online methods
coupled with some co-located means. This is of course easier said than done, given some of the
challenges discussed, but needs to become an integral part of the project planning process.

92 | August 29, 2017 Version
Case Study: Participatory Design in India A HISP project in rural India ongoing is aimed at building patient centric systems for primary health care. This project was carried out by a collaboration of the HISP team from the University of Oslo and India, and a public health team from the Post Graduate Institute of Medical Education Research (PGIMER), Chandigarh, India. This collaboration enabled the creation of multi-disciplinary expertise required for system design. To ensure the active involvement of the CHWs a “living lab” was established in one rural clinic, which was a designated study area for PGIMER. The living lab has become a site for the design study team to work with the CHWs and medical doctors to understand their everyday challenges and needs. By situating the living lab in the clinic, the CHWs also developed a strong ownership of the system, as they saw themselves integral to its process of evolution, and both sides could mutually understand the perspective of the other. The developer team could gain insights into the world of the CHW which they otherwise would never have obtained through the use of traditional design approaches.
For example, during a discussion the CHWs said they wanted the system to generate the primary registers. This was a novel insight, as the assumed approach took the primary registers as a given to the situation, and started the design based on existing data collection formats. This insight structured the design of the system in a novel way, which when completed provided more value and increased job satisfaction to the CHWs.
The important takeaway from this excerpt is the need to develop approaches to design in context
which represents the world of work of the CHW. The living lab is one such approach, and there will
surely be others. In different contexts, appropriate approaches will need to be constructed to
enable these processes of contextualized design.
Architectural Thinking at the Core of Design
Architectural thinking in simple terms implies a systems and holistic thinking which seeks to
ensure that the different existing systems can “speak with each other” in a relatively seamless
manner. This speaking with each other is not just a technical problem requiring technical solutions,
but involves complex institutional challenges of getting health programs and people to speak with
each other. This undoubtedly is more challenging than building the technical solutions, and needs
to come as the primary effort.
Another characteristic of the architectural thinking is that the system development is seen as a long
term and evolutionary approach, and thus decisions should not be taken based on a static and one
time thinking. An implication here is not to take decisions at one point which will prevent you from
taking other choices in the future which may become available and be preferred.

93 | August 29, 2017 Version
For example, taking the decision to use a proprietary platform may prevent you from building
interoperability with other systems in the future. This requires a forward-thinking approach, which
seeks to predict future informational requirements, and also be on top with technological trends,
and what kind of new opportunities that come up in the future. The system design should ensure
we are able to keep on top of these challenges and are able to leverage on the opportunities when
they do come up.
Case Study: Collaborative Design in the Living Lab Taking another example from the living lab project, a starting point of the design was to first understand the different systems the CHWs were currently engaged with. CHWs were dealing with 9 different systems (computer and paper based) which involved 22 primary registers, and 30 monthly reports, with a lot of overlaps and redundancies between them. A process of mapping the redundancies listed out all the data elements in these registers, identifying the existing duplicates and creating a consolidated list of all the non-repeating data elements. This list was then used to develop the metadata definitions to be customized in the DHIS2 database. Further, this metadata was then adapted to the national MDDS (Metadata and Data Standards) to ensure scalability. In this way, linkages between the different systems were identified, ensuring linkages at the data collection level, which then enabled generation of the primary registers, the main concern of the CHWs. This process was carried out jointly by CHWs and the system designers, who as a team could identify unwanted or unused elements which would not have been possible by the designers alone. This process also ensured that the designed CHIS would be integrated with the everyday work practices of the CHWs, was primarily aimed at providing added value to CHWs through reducing their work burden. Further, it was designed to be expanded in the future, for example by aligning to the national standards, in terms of generating all required reports for upward reporting and to support local action.
An important takeaway from this excerpt is that system design is not just about creating technical
artefacts as solutions, but should be grounded in the everyday work practices and artefacts in use
by the CHWs.
Design to Support Local Action
Local action refers to all the work being carried out by the CHW, which includes all information
related work which relates to the recording, reporting and tracking functions performed by the
CHWs. Local action represents the CHW doing recording and reporting, as well as local analysis of
data and taking steps to improve health services delivery. While analysis is an important aspect of
the CHW work, and one which we actively seek to enhance, we should not lose tracking of the
recording and reporting functions which the CHW is obliged to perform. Expecting her to enhance
her action taking function, while ignoring her recording and reporting functions, will be unfair to
the CHW as she will be reprimanded by her seniors.
An important aspect of the design process is to understand from the perspective of the CHWs what

94 | August 29, 2017 Version
they consider relevant local action (spanning her three key functions), and what outputs she needs
from the CHIS to support her different functions.
From the example given above of the living lab, a primary need of the CHW was to support the
generation of primary registers, as that would dramatically reduce their work burden, and free up
time for provision of more effective care. Such an approach also exemplifies the advantage of taking
a holistic systems approach rather than a narrow program specific and standalone. The benefits of
adopting a holistic approach influences all the different roles of the CHW and all the health
programs. On the contrary, an isolated stand-alone approach enhances fragmentation with limited
benefits.
Chapter 3 provides more specific example of local use, so we are not repeating those issues here.
The reader is advised to read that chapter for more specific examples of approaches to enhance
local use.
Adopt Hybrid Approaches
Hybrid approaches are those that cater to a multiplicity of settings, political conditions, and
infrastructures. This is key to ensuring scalability and with it sustainability. Community conditions
by design are variable, multiple, and relatively dynamic. The CHIS design process must necessarily
be hybrid in nature and be capable of catering to this multiplicity. The hybrid approaches
encompass technical, institutional and project management approaches.
For example, building a system that relies completely for its operations on internet connectivity
only caters to a single environment – the presence of continuous and reliable internet supply – and
is unable to functions in settings where this condition is not met. Such a system is unlikely to
succeed in a scalable manner, as ideal internet condition is unlikely to be available throughout a
province, or even all sub-districts within a district. An approach here would be to design a hybrid
system which can run in both regions of internet availability or not. Allowing for offline data entry,
and subsequent syncing of data with the server when internet is available, is a practical solution to
deal with these multiple environments. The DHIS2 has adopted such functionality, which has
contributed to its widespread use in a multiplicity of environments and settings.
Case Study: Different approaches in South Africa and Cuba Different political settings also call for hybrid approaches. For example:
● The HISP project in South Africa, experienced great success with bottom up, participatory approaches in the changing post-apartheid environment of where enhancing health worker environment was at the core of the health reform agenda.
● This same approach when transferred to the HISP project in Cuba turned out to be dramatically unsuccessful as the environment was extremely top down, driven by the office of the President. In hindsight, in this environment, HISP should have first obtained
buy-in from the top, used this buy-in to create spaces to work with participatory design approaches at the field level, and gradually build ownership using that approach. In the

95 | August 29, 2017 Version
absence of top-down approval, the bottom were fearful of engaging with the alien approach of bottom up design of HISP, and reacted by rejecting the project.
A takeaway from this discussion is the need to first analyze the given contextual conditions, then
identify feasible approaches for design and implementation. Always be open to adapt and
improvise on the way, and not to be dogmatic to a certain approach which may have worked in a
different setting and time frame.
Design CHIS based on existing strengths
The HISP approach to CHIS design has always emphasized the importance of the installed base,
existing work practices and the CHIS history which exists, and seek to nurture or cultivate it over
time. This approach uses the basis that all systems have a history and past, and there are deeply
embedded systems and human behavior and attitudes, which can never be done away with.
This HISP approach is the opposite to the “clean slate” approach popularized by management
consultants in North America in the nineties, and operationalized through the methodology of
“business process reengineering (BPR).” This clean slate approach has been adapted by designers
of CHIS where they are not sensitive to what already exists, but has not had much success, such as
when adopted in Ethiopia in early 2000 during the health sector reform process.
The dominant assumption of BPR system development is based on a clean slate approach, which
1. Seeks to “obliterate” existing processes and systems and start from scratch, creating a clean
slate.
2. Assumes that the existing work practices and attitudes of the CHWs is irrational, not
modern, needs to be killed and replaced with techniques and technologies that are more
modern and rational.
Case Study: CHIS design in Mocambique A HISP project was introducing DHIS in the community health system in Mozambique While conducting training at the community level, various strengths of the CHWs were seen.
1. CHWs had strong abilities to multi-task, developed through decades of working in extremely resource constrained environments. For example, they could engage in providing care in addition to doing administrative tasks at the same time.
2. CHWs were very strongly linked to multiple local and non-work environments, such as the church. So, when the printer of the health facility was not working, they would go to
the nearby church to print out the urgently required report. Instead of seeing the practices of the CHWs as being irrational and impediments to the introduction of new systems, it was recognized that these should be seen as potentials that should be leveraged upon to support the system introduction. This exposed the limitations of existing approaches to design and implementation using the “clean slate” approach.

96 | August 29, 2017 Version
The takeaway from this discussion is the need to seriously consider history in the system design
process, what the positive and negative potentials that come with it are, and how the positive
potential can be incrementally leveraged upon and cultivated over time.
Interoperability with DHIS2 in CHIS
Why Interoperability?
Community settings have particularities such as poor internet coverage, uneven infrastructure and
largely manual systems that make it very difficult to deploy a complete web-based system. There
may be also multiple pre-existing systems, owned by different stakeholders which are performing
distinct functions, and which have a high degree of user acceptance. As a result, there is a significant
need for finding alternative ways through interoperability to bring the data into DHIS2 so required
aggregations can take place, analytical dashboards can be created, and for tracking of patient based
care. Interoperability aims at sharing data between two systems without disturbing them. In
contrast, integration involves the merging of two systems into one, so only one system continues
and the other one is not needed anymore. Given that in general there will a reluctance of a system
owner to give up their system, integration will often meet resistance in the context of CHIS.
In summary, interoperability can be seen to respond to the following use cases:
● Systems like ODK and CommCare are being used in various contexts to collect individual
and aggregate data, and this needs to be interoperated with DHIS.
● Due to ease of portability and better mobile network coverage (than internet), mobile
phone could be used to collect data, and can be most easily transmitted through SMS. This
SMS data then needs to be imported to the DHIS2, and further processed.
● Where manual systems dominate, Excel sheets could be used to enter data, and then these
Excel files need to be sent into DHIS2 for further processing.
● Community based data could also be collected in hospital systems, where residents go to
receive referral care. This hospital data, typically collected in an Electronic Medical Record
kind of system, then also needs to be interoperated with DHIS2.
We provide examples of use cases that represent these above conditions, and then provide a technical
overview of how interoperability was achieved with DHIS2. For each of these use cases, we also present
some technical guidelines on how interoperability can be achieved in other contexts.

97 | August 29, 2017 Version
Use Cases of Interoperability
Open Data Kit (ODK) – DHIS2
The National Institute of Epidemiology, Chennai India is building a system on DHIS2 for fever
surveillance. The aim is to record all cases of fever reported in a district to understand
epidemiological patterns that underlie these fever cases. For this, they need to capture name based
data on fever surveillance which they are doing using ODK. Each case records required
demographic information and fever details. This data is then required to be pushed into DHIS2 for
further tracking, generation of hotspots and creating required reports and indicators displayed
through the dashboard. Thus, building interoperability between the ODK and DHIS2 was a core task
in the system development process.
CommCare – DHIS2
In Nepal the Hellen Keller Institute (HKI) is using DHIS2 as a nutrition tracking system. Derived
from census population of households in selected districts of Nepal, DHIS2 captures individual level
data on demographics and selected nutrition parameters. Based on this data interventions are
carried out and impact on nutrition parameters need are monitored at the individual level. To
collect this programmatic data HKI is using CommCare. The programmatic CommCare data needs to
be interoperated with the census based data in DHIS2. Furthermore, DHIS2 is also being used for
various other data reporting formats for other program needs. There is thus the requirement to
build a common warehouse of data where these multiple programs data together with the nutrition
data could be analyzed for cross-cutting indicators, and displayed through attractive and easy to
use dashboards.
Excel Import – DHIS2
While the use of Excel sheets for community level data is a common use case in the context of CHIS,
the use case discussed concerns comprehensive case based management of malaria. This project,
implemented in Odisha state in India, involes the collection of data on malaria cases in a name
based format using Excel due to low internet availability. The Excel files with name-based data is
periodically sent to the higher authorities through emails or pen drives etc. At central levels the
excel file is converted into a CSV and manually imported into DHIS2 via the data import application.
DHIS2 is then able to automatically aggregating to higher levels in the HMIS. The DHIS2 thus
contains both name based and aggregate data. Thus, there is a requirement to send the data in
these Excel sheets to DHIS2 for monitoring and maintaining the data quality and also enable the
connection between the different elements of entire longitudinal record of the patient. The
challenge here was to develop a methodology for importing the Excel data into DHIS2.

98 | August 29, 2017 Version
SMS Data Import – DHIS2
The use of SMS based reporting is another common means of data collection and transmission in
community health settings. WHO India initiated the use of SMS based system for supporting their
Mass Drug Administration for LF in a campaign spanning 34 rural districts of India over an
intensive one week period. SMS rather than web-based transmission was selected because many of
the CHWs did not have the resources to access smartphones, so were not oriented to its use.
Further, SMS was selected because data needed to be collected only for few elements (such as
number of households visited, males, females and children administered the drug, and side effects
observed). In this campaign, the CHWs would go house to house administering the drugs, recording
the data on their phones, and then sending it by SMS which was received by the DHIS2, where
dynamic dashboards were constructed to monitor coverage by day and geography.
Open MRS and DHIS2 Interoperability
OpenMRS is the platform on which an EMR was customized for an integrated hospital management
system for district hospital in Himachal Pradesh, India. The system collects individual level data as
a patient goes through different encounters in a hospital including registration, billing, OPD, IPD,
lab tests, pharmacy etc. This individual level data needs to be aggregated (by hospital, department,
period, etc.) and then sent into DHIS2 where aggregate reports, for morbidity and mortality can be
prepared, hospital management and administrative indicators (for example, average length of stay
and bed occupancy rates) can be generated, and comparisons across the different hospitals in the
state can be made. This would not have been possible through the OpenMRS system alone, and so
the technical task involved building interoperability between the two applications, and ensuring a
process to synch the two databases at predefined intervals.
After presenting these different use cases of interoperability with DHIS2, in the next section the
technical approach for this is discussed including guidelines for implementing the interoperability
solution.

99 | August 29, 2017 Version
Technical Approach for Interoperability
For ODK and CommCare Cases
A similar process of building interoperability was followed in both the cases. A tool (Data Motor)
was designed that requests for data from the CommCare/ODK application. Data is pulled out from
the API through this pool and is pushed through the API again to DHIS2 application. The diagram
below depicts this process.
Figure 4.6: DHIS2 Interoperability Model with CommCare and ODK
Guidelines for Implementation
1. Identify "data points" which needs to be shared from the data collection system.
2. Find out where they fit in the data model of the system from which they are to be pulled.
3. Find out where they fit in the data model of the system into which they are to be pushed.
o In case of DHIS2 these are Data Elements, Periods and Organization Units
o In case of ODK and CommCare these are questions/data entry prompts.
4. Map the two data models based on a unique identifier between the two.
5. Make the data motor
o Fetch data from one data collection system,
o Restructure the data to fit the data model of the other data collection system
o Push the restructured data in the other system

100 | August 29, 2017 Version
o Keep unique identifier in both systems for integrity checks
6. Set up the data motor to auto run periodically
7. Keep a log of all activity that the motor does for monitoring and debugging.
Excel Import to DHIS2
An Excel micro has been created in DHIS2 with a predefined Excel template. The data from Excel is
mapped to UIDs for data elements, organization units and periods for which the data which needed to be
imported in DHIS2. The mapping in Excel should only have to be completed one time. Once the mapping
is done the data can be maintained in the Excel sheets and imported in DHIS application when internet is
available. The data is sent to DHIS2 through the UIDs being mapped in the Excel sheet and sent to
respective program and program stages in DHIS2 in the case of name based data.
Guidelines for Implementation
● To maintain the data quality, minimum open text fields should be used in the format. More of
drop-down options should be created so that user can select the required options which can be
easily linked to DHIS2 data values.
● The sheet should be protected so that the user cannot add any new fields or make any changes in
the application.
● Validations same as in DHIS2 need to be built in the Excel sheets.
● Organization unit codes are a preferred option for sending the data to DHIS2 to avoid any
mismatch in the organization unit names.
● It is important to have a unique identifier for each record in DHIS2. This unique identifier can
then be used to link the longitudinal records (program stages) of the patient so that the patient can
be updated as and when visits are made and duplicates are not created.

101 | August 29, 2017 Version
For OpenMRS-DHIS2 Interoperability
The interoperability module from the EMR based on OpenMRS to the DHIS2 was developed by the
HISP India team to support an architecture where the name based encounter data was stored in the
individual hospital’s server, would be aggregated through queries and the data would be moved to
the state repository (DHIS2) through a data exchange module. The architecture envisaged was that
the name-based data was retained at the facility and aggregated data moved on to the state DHIS2
portal through the data exchange module.
The interoperability standard (SDMX - Statistical Data and Metadata Exchange, initially promoted
by WHO and later replaced by the ADX standard), data was exchanged between OpenMRS and
DHIS2, and all metadata (data elements and facilities) were synchronized taking DHIS2 as the base
and aggregated information into it using DHIS2 API services on periodic basis. The reports
exchanged included all national disease program reports, reports on disease profiles for the
population, and stocks and inventory reports. Implementing this module was a tremendous
challenge. Technically, creating the data transfer required writing hundreds of queries to aggregate
and push the data into DHIS2. Initially, it was done manually, where some staff had to just push the
export button. When this was not done regularly, this transfer process was automated to enable it
at a fixed time everyday where the data would be synched. This too was problematic, because of the
intermittent and unreliable internet and power supply.
The architecture for this data exchange is sketched out in Figure 4.7.
Figure 4.7: DHIS2 interoperability with OpenMRS

102 | August 29, 2017 Version
Guidelines for Implementation
● All the data which needs to be transferred to the DHIS2 requires to be defined as data
elements in the DHIS2. Data sets need to be created for the aggregate reports required.
● All indicators need to be created in the DHIS2, and also all numerator data (such as number
of beds and number of doctors) need to be stored in the DHIS2 which are then used for the
generation of indicators.
● Queries need to be written to aggregate the name based data from the OpenMRS database,
and then post it into DHIS2 as the defined data elements.
● Reports and dashboards need to be customized in the DHIIS2
● An automatic scheduler should be created to enable periodic data exchange.
SMS Import in DHIS2
SMS gateway and APIs are required for receiving the SMS in the DHIS2. If feedback messages also
need to be sent (to confirm receipt or not of the SMS in the DHIS2) to the user, an API for sending
messages will also be required. The messages need to be sent on a specific number and the same
could be read for a predefined set of data items. Separator such as dot (.) or space ( ) could be used
for separating the data elements while sending the messages to make them easier for the user to
understand. The phone number of the users need to be registered for the respective organization
units to which they belong, such that when the SMS is received from the same number, it can be
registered at the organization unit.
Guidelines for Implementation
● While using the SMS functionality, the data elements to be reported should be minimal for
the user to remember the sequence. The sequence and format should be provided written
on paper to the CHW for ease of use.
● It is significant to have the phone numbers registered for all the users, and it should be
ensured that the user sends the message through the same numbers for the data to be
registered at the correct organization units.
● The pictures below describe the different screen shots the user will see in the process of
sending the SMS and receiving the confirmation message.

103 | August 29, 2017 Version
Figure 4.8: Example SMS Import into DHIS2
104 | August 29, 2017 Version
India Use Case - Mobile Based Reporting by CHWs
Mobile based reporting is a vital part of CHIS in many contexts. In this section, we discuss three
different modes of mHealth based reporting from the community level in India.
1. SMS based reporting for HMIS in Punjab, India.
2. SMS based reporting for supporting cancer survey in Punjab, India.
3. GPRS based reporting for HMIS in Himachal Pradesh, India.
In each case we provide details of the technology, the implementation and capacity building
processes, the issues and challenges faced and how they were resolved.
SMS-Based Reporting for HMIS in Punjab, India
In 2011, the national MoH initiated a pilot project across 5 blocks in 5 different states covering
about 200 CHWs, to test the technical efficacy of mobile based reporting from the community level.
A simple JAVA based application was developed in J2ME and installed in the mobile phone of the
CHW. A modem with a SIM was installed at the block (sub-district) level to receive the messages. A
software “SMS Listener” was installed in the computer of the Block Program Manager along with
the offline DHIS2 application. When the CHW sends the report through the mobile application, it
comes through a SMS. The SMS listener installed received this SMS in Binary form and imported the
data into respective organization unit by recognizing the mobile number from which the message
has been received. The mobile number of a particular health worker was entered in DHIS2 offline
application for their respective organization units. Some useful lessons were learnt from the pilot.
There were technical issues encountered such as the clogging of modems, signal issues in hilly
areas, and some data loss. Some CHWs were reluctant to use the mobile as they felt more
comfortable with paper based reporting.
Overall, the pilots were seen to be successful, and two states Punjab and Himachal Pradesh came
forward for a full statewide scaling for this mobile based reporting
MHealth-Based Reporting for HMIS in Punjab
Punjab state has about 5000 CHWs, with each sub-center having 2 ANMs (Auxiliary Nurse Midwife),
one regular and the other contractual. The state provided each ANM with a mobile phone (Nokia
2330 Classic) to enable reporting the monthly routine HMIS data.
Unlike the pilot which was based on the offline DHIS2, Punjab went for an online application,
developed in J2ME (JAVA) and in Punjabi language. The application was installed via Bluetooth in
the mobile phone of the ANM. This was a simple SMS based solution. It included three forms to be
filled by the ANM: Daily Reporting, Monthly 1 & Monthly 2. After filling these forms, the ANM sent

105 | August 29, 2017 Version
her data through SMS on a number for which the SIM was installed in the Modem at the state’s
server. After importing the data in DHIS2 an Acknowledgement SMS was is sent back to the ANM
for the confirmation of the report. There were two modems installed at state server one modem
each for 10-10 districts.
Figure 4.9: Example J2ME Data Entry Application
This was an online DHIS2 application with the three datasets. The mobile number of every ANM
was registered on the sub-center on which the ANM was posted. As soon as the message is received
from a number it is converted into an XML file and imported in DHIS2 for the respective
organization unit on which the respective number is registered. Since every sub-center had two
ANMs, under each sub-center two more organization units were created ANM1 & ANM2 and the
numbers were registered in their respective user names. This mobile project ran in parallel to the
state HMIS application on DHIS2, and it was expected that after a few months of reporting all
community data in the DHIS2 would only come through the mobile reporting.
Along with mobile phones a CUG connection was provided which included a Rs 200 credit for the
ANM to enable SMS reporting along with free calling facility.

106 | August 29, 2017 Version
Figure 4.10: Punjab Use-Case Data Flow Model
107 | August 29, 2017 Version
The process of implementation involved the following steps:
● Procurement of Hardware: Nokia 2330 Classic with SIMS card and EZ-SMS model modem
for receiving the SMS.
● Finalization of formats: Three formats were finalized: Daily Dataset, Monthly 1 and Monthly
2 with 10, 56, and 83 data elements respectively.
● ANM Classification: The ANMs were classified as ANM 1 and ANM2.
● Installation: The JAR file of the three datasets were installed using Bluetooth in 5000 mobile
phones and pasting of stickers on the back of mobile phones mentioning ANM names and
sub centers. This process took place at state head quarter over one and a half months.
● Distribution of mobile phones in districts: After installation, the mobiles were sent in the
respective districts and distributed to the ANMs prior to the trainings.
● Preparing Training Manual: The training manual in Punjabi was then prepared
demonstrating the use of application through screen shots and diagrams, and these were
distributed during the training session
● Capacity Building: The trainings on the use of the application were carried out over 2
months covering 4545 health workers and done at state/district/block/sub center levels.
Two-member teams were created each covering 5-7 districts. On the first day, a district TOT
was done, followed by block level trainings.
● Handholding Support: One-year handholding support was provided through a 3-member
team placed at the state head quarter.
Issues and Challenges Experienced
Daily Dataset: Initially the ANMs showed resentment towards the application, which became
easier with time. Key to this resentment was the Daily reporting which included data elements
representing activities done on mainly on Wednesdays in the EPI sessions, which meant that other
than on Wednesday, the elements were reported as zeros. This pattern, the ANMs felt would be
perceived by the administrators that they were slacking off on other days. To deal with this rising
resistance, the administrators had to ultimately scrap daily reporting.
Age Factor: The elderly ANMs were resistant, as they had not used a mobile phone before. So,
making these ANMs learn the application was a difficult task.
Other Issues: Signal issues, balance related issues and delays in confirmation reports from the
server side was experienced due to load on application

108 | August 29, 2017 Version
Modem Clogging: The modems were receiving nearly 5000 SMS daily which put a huge load on the
state server and modem, which delayed the sending of the acknowledgement message which
created a panic among the ANMs if their reports were received or not. Also, the messages started
failing because the mobile operator kept the unreceived messages only for 3 days on its server. Two
more modems were installed for sending the acknowledgement messages to enable huge load
sharing.
Figure 4.11:A district wise data status percentage showing the reporting percentage in initial days.
A district wise data status percentage showing the reporting percentage in initial days.
Key Take-Aways:
● Increasing reporting frequency just because the technology enabled that is not a
good idea as it increased the sense of surveillance for the ANMs.
● Modems seemed ill-equipped to handle large scale SMS traffic, and a SMS gateway
solution would have been more appropriate for a full-scale project.
● State is considering Android based application for HMIS reporting.

109 | August 29, 2017 Version
Punjab SMS-Based Cancer Survey Reporting Use Case
After the success of the routine HMIS reporting in 2011, the state initiated in 2012 a new SMS based
project for cancer survey for:
● To generate awareness on warning signs and symptoms of Cancer.
● To enable early detection of the disease based on the symptoms
● To identify disease incidence (actual number of cases) for further planning
The implementation process for the survey is briefly outlined:
● Survey in rural areas was done by CHWs, while in urban areas by nursing and medical
college students
● The surveyor went to each and every household of his/her own area
● Survey was done using a questionnaire including proformas: One, for capturing basic
information of each and every family member of a household, such as name, age group,
education and family history of cancer, etc.; Two, if any person was found cancer positive or
with symptoms of cancer name based details specific to the disease was collected, and
reported through the mobile phone (JAVA SMS application) into the DHIS2.
● Same mobile phones (Nokia 2330) and modems were used for the survey.
The previously existing list of old mobile numbers were used, and then the new numbers used were
added and registered in the DHIS2 application. The surveyor sent the SMS of a particular case,
which was converted into a XML file and then imported in the respective organization unit, where a
Unique ID of that particular case was generated and sent back on the acknowledgement SMS. The
surveyor then noted this unique number on the particular form to track the case in the online
application. The mobile application was used in the rural areas, whereas in the urban areas where
the internet was more reliable, data was entered directly into the online application.

110 | August 29, 2017 Version
Data flow
Figure 4.12: Data Flow from Sub-Center Level to State Level.
The Capacity Building Process
Before a state-wide roll out a pilot was done in one district over 2 blocks, and a similar
implementation process to the HMIS was initiated. A 150-member training team was constituted,
and state-wide training was completed in 2 weeks.
● Trainings were conducted at the district HQ or at the block level
● Two-three-member training team conducted training at each site.
● Attendance of the training participants was taken
● CHWs collected the mobile phones when they came for the training
● One member did the application installation, while the other focused on training, using an
Emulator followed by a PowerPoint presentation
● In the hands-on session, the field worker was trained on how to fill all the fields included in
the dataset, and send the data through the mobile.

111 | August 29, 2017 Version
● For urban areas, the form was designed on the DHIS2 Tracker. The individual record was
entered on the patient registration screen and the output in form of reports can be viewed
through reports available in the application
The data from rural area through mobile reporting was done smoothly but still the issue of modem
clogging persisted. To cater to this issue one server administrator was placed at the state server
room to monitor the SMS traffic on a real-time basis. In urban areas, the user was not able to save
the data in the online application because of the huge database. To address this, an Excel import
functionality was introduced to enter proforma 2 data in the Excel sheet which was then pulled into
DHIS2.
Himachal Pradesh SMS-Based HMIS Reporting Use Case
After a one block pilot, the state agreed to go for a whole state pilot. Learning from Punjab led to a
change from SMS to a GPRS based application. Some of the learnings from the HP pilot included:
● GPRS recharge was more expensive than SMS
● GPRS connectivity poor in hilly and remote areas.
● State did not give phones to the ANMs, and their existing phones were used.
● The GPRS based solution was not compatible on many of the user phones and also
incompatible with the Opera mini browser. Out of 201 mobile phones only 74 phones were
compatible i.e. only 37%.
● The ANMs found it difficult to operate a web based solution and the GPRS settings to be
done on the phone were cumbersome for the ANM
After the learnings from the pilot, the state agreed to go for a J2ME application. The Monthly Sub
Centre form was selected for the reporting. The state subsequently decided to buy phones for the
ANMs, and chose Nokia C1-01, and Rs 50 was given to each ANM for charging. Similar to Punjab, a
J2ME SMS based application was developed for sending the reports. But the formats chosen were
not only for sub-center like in Punjab, but multiple formats were selected:
● SC Form– For sub center health worker (monthly)
● IDSP – For sub center health worker (weekly)
● PHC Form 1 & PHC Form 2 – For PHC health worker (monthly)
● CHC Form 1 & CHC Form 2 – For CHC health worker (monthly)
● Mortality – For SC, PHC, CHC health worker (monthly)
JAR files for all these formats were created, and installed on respective facility phones.

112 | August 29, 2017 Version
SMS Gateway Solution
From the learnings of Punjab implementation, it was found that modem was not a good choice for a
full state wide roll out hence instead of Modem, SMS gateway solution was used.
● State’s Department of Information Technology (DIT) already had a SMS gateway solution
bought from a private player.
● The implementers contacted this provider to build the integration with DHIS2. But then the
State changed the provider to the government IT department. This required the integration
to be redone.
● The server and SMS gateway were both placed in the state IT office which created many
logistical challenges.
● The final application integrated with SMS gateway was deployed.
Some of the issues experienced included:
● In testing it was found that the government IT department did not support the compressed
SMS which was previously used in Punjab.
● The server only supported the basic SMS length of 160 characters and for some operators it
was only 110/120 characters. This was often insufficient, as our SMS was prefixed with a
keyword HP NRHM.
● At the 161st character, the server could not understand the second SMS which was not
prefixed with HP NRHM and as a result the second SMS got lost, leading to complete data
not being reported.
● So, the SC form was divided into three parts containing 100 characters each, but was not an
optimal solution to divide one form into three parts.
● The application was then reworked with the second SMS at the 121st character also being
prefixed with the keyword HP NRHM. The second SMS would cut at 121st character and the
reporting became smoother.
● In some of the blocks, the ANM was responsible for multiple sub centers, but in the
application only one mobile number could be assigned to one organization unit. To address
this, a 4-digit Facility Code was introduced for every organization unit, which enabled one
health worker to report from multiple organization units from the same mobile phone.

113 | August 29, 2017 Version
Figure 4.13: ANMs going through the application in one of the training sessions in Kangra District.
Capacity Building Process
● The training was done mainly at block level, through a 2-3-person training team.
● Attendance of training participants along with their mobile numbers was taken.
● Health workers collected their mobile phones when they came for training.
● One member was responsible for the application installation while the other was for the
training on formats and the application.
● Mobile numbers were registered in the respective organization unit in DHIS2.
● One member sensitized the health worker to send the report using mobile phone through
the Emulator, followed by hands on training.
● Orientation was provided on the formats, and described in the training manuals which were
distributed to all health workers.
● Respective facility codes were also given to the health workers, and they were asked to send
a dummy SMS to check the working of the application.
● Then this dummy data was deleted from the server side and the health workers were asked
to start their monthly reporting on the reporting date.
Issues and challenges
● The vendor of SMS gateway was changed implying a rework of the whole integration
process.
● The SMS was relatively expensive on the short code.
● The short code was changed which implied changing the short code in 201 mobile phones

114 | August 29, 2017 Version
again
● Deployment and maintenance of the server was difficult due to the strict government norms
such as no remote access to the server was provided, requiring a physical update to the
server each time.
The table below summarizes the differences in approaches to the mobile health application in
Punjab and Himachal.
Difference in Punjab & Himachal Pradesh
Punjab Himachal Pradesh
J2ME SMS based J2ME SMS based
Modem SMS gateway solution
Only SC Form Multiple forms for SC, CHC, and IDSP form S
Training State initiated the training dates
Training: State conducting their own HMIS trainings along with Mobile district TOT. In district TOT dates for block trainings were taken. Application is being installed in block trainings itself
Postpaid CUG Tariff plan of Airtel Pre-paid , no CUG, BSNL
Training only given to ANM and supervisor.
All health workers and supervisors were trained.
Figure 4.14: Difference among India Use Cases.

115 | August 29, 2017 Version
Chapter 5: Training and Supervision
Introduction
This chapter describes how to operationalize the design principle, “Capacity strengthening of
CHWs” for CHIS. This involves a number of processes to support the developing of CHW knowledge,
skills and support, improving decentralized use of data and feedback to CHWs to increase data
quality. Most CHIS in developing countries are still paper-based, though many are moving towards
more digitized systems. This requires that CHIS training is introduced and is continually followed
up through all stages of the information cycle.
Learning Objectives:
● Describe the capacity strengthening requirements for a sustainable CHIS.
● Explain different domains of capacity strengthening.
● Identify the technical and public health skills CHWs need to use CHIS.
● Make protocols for training and supervision from the provided templates.
● Explain pre-service, in-service and supervision and support modes of training.
● Describe diverse ways to evaluate a training program.
Training needs assessment
The first step in any new CHIS capacity development program has to be a Training needs
Assessment that looks at the existing situation surrounding the CHIS and the needs to improve this
situation. Ideally this should be done as an integral part of the overall CHW training plan, with CHIS
experts forming part of the overall CHW training needs assessment
This assessment needs to look at the existence of basic requirements for a CHIS and answer a
number of practical questions about what is needed to address these requirements
Requirements for a Sustainable CHIS Training Strategy
Capacity strengthening of CHWs is a significant challenge and lies at the core of developing a
sustainable CHIS. There are some inherent limiting conditions to effective capacity strengthening
programs including:
● Decentralization: To ensure sustainability, CHWs should receive support and training
locally in a decentralized approach, as close to their place of work as possible.

116 | August 29, 2017 Version
● Training Conflicts: CHWs because of the nature of their work are continually being
pulled into different kinds of training programs, and CHIS skills tend to receive
relatively lower priority.
● Literacy: CHWs, especially the older ones, typically come with weak computer literacy,
and sometimes even basic literacy skills, making learning about information and
computers a difficult task.
● Acknowledgement of CHIS skills: CHWs typically do not get recognized for building CHIS
related skills, and that does not show in their job advancement or annual appraisals.
● Scale: This, in particular, is a very significant challenge. While there be a few dozen
districts in a province, there may be a thousand villages and hundreds of CHWs.
Training cannot be done through traditional means of classroom, and requires the use
of different and innovative training methods such as mentorship, in-service training and
online media.
● Attrition: loss amongst CHWs means that the CHIS is continuously challenged by the
exodus of trained staff.
● Refresher Training Budgets: The continuity of CHIS is normally subject to limited
training budgets, implying that new CHIS do not receive adequate training, particularly
after the initial training. Therefore, a sustainable CHIS requires a continuous stream of
refresher trainings for old CHWs and comprehensive trainings for new CHWs.
Some questions to address in the CHIS training needs assessment
CHIS Training Supervision
● How many CHWs need training in CHIS
o How often should they be
trained
o How long will training be?
● Who will train them? Who will train the
trainers?
● How is CHIS training related to other
CHW training?
● Who will do the CHIS training? ….
o how will they be trained?...
o what curriculum will they use?
● Who will do supervision ?
o Who will support the
supervisors?
● How will supervision be done?
o How many CHWs per
supervisor?
o How often?
Table 2 CHIS Training and supervision training
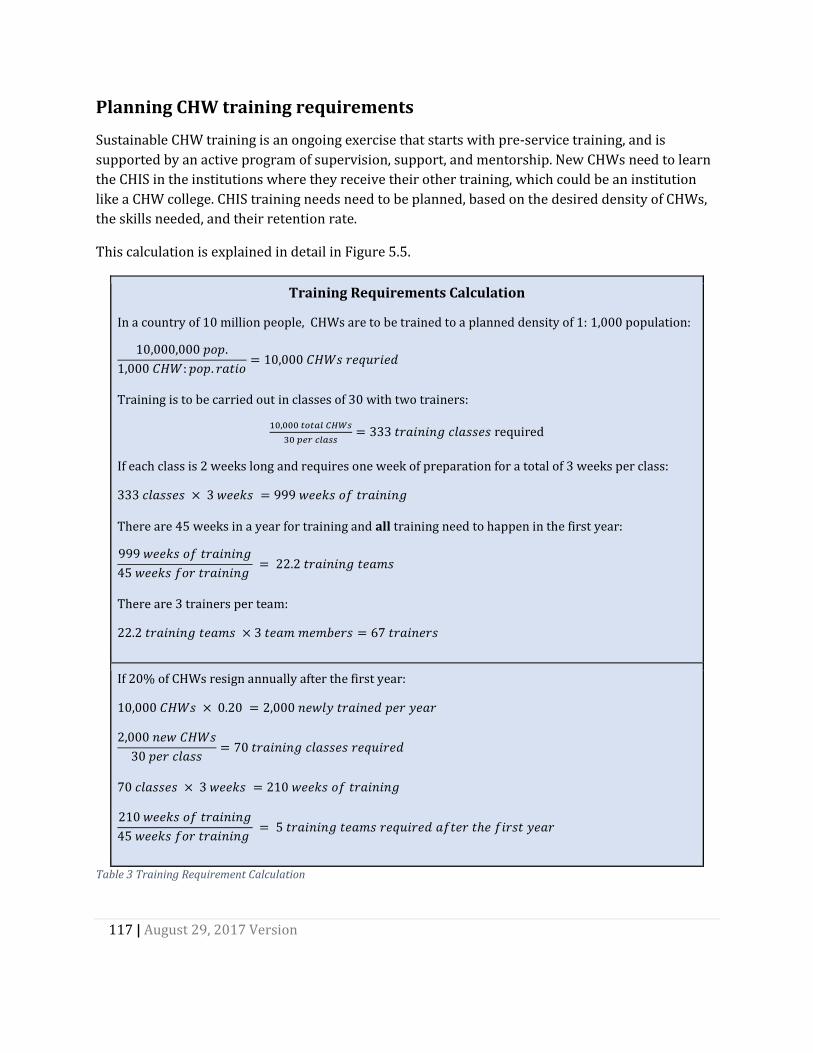
117 | August 29, 2017 Version
Planning CHW training requirements
Sustainable CHW training is an ongoing exercise that starts with pre-service training, and is
supported by an active program of supervision, support, and mentorship. New CHWs need to learn
the CHIS in the institutions where they receive their other training, which could be an institution
like a CHW college. CHIS training needs need to be planned, based on the desired density of CHWs,
the skills needed, and their retention rate.
This calculation is explained in detail in Figure 5.5.
Training Requirements Calculation
In a country of 10 million people, CHWs are to be trained to a planned density of 1: 1,000 population:
10,000,000 𝑝𝑜𝑝.
1,000 𝐶𝐻𝑊: 𝑝𝑜𝑝. 𝑟𝑎𝑡𝑖𝑜= 10,000 𝐶𝐻𝑊𝑠 𝑟𝑒𝑞𝑢𝑟𝑖𝑒𝑑
Training is to be carried out in classes of 30 with two trainers:
10,000 𝑡𝑜𝑡𝑎𝑙 𝐶𝐻𝑊𝑠
30 𝑝𝑒𝑟 𝑐𝑙𝑎𝑠𝑠= 333 𝑡𝑟𝑎𝑖𝑛𝑖𝑛𝑔 𝑐𝑙𝑎𝑠𝑠𝑒𝑠 required
If each class is 2 weeks long and requires one week of preparation for a total of 3 weeks per class:
333 𝑐𝑙𝑎𝑠𝑠𝑒𝑠 × 3 𝑤𝑒𝑒𝑘𝑠 = 999 𝑤𝑒𝑒𝑘𝑠 𝑜𝑓 𝑡𝑟𝑎𝑖𝑛𝑖𝑛𝑔
There are 45 weeks in a year for training and all training need to happen in the first year:
999 𝑤𝑒𝑒𝑘𝑠 𝑜𝑓 𝑡𝑟𝑎𝑖𝑛𝑖𝑛𝑔
45 𝑤𝑒𝑒𝑘𝑠 𝑓𝑜𝑟 𝑡𝑟𝑎𝑖𝑛𝑖𝑛𝑔 = 22.2 𝑡𝑟𝑎𝑖𝑛𝑖𝑛𝑔 𝑡𝑒𝑎𝑚𝑠
There are 3 trainers per team:
22.2 𝑡𝑟𝑎𝑖𝑛𝑖𝑛𝑔 𝑡𝑒𝑎𝑚𝑠 × 3 𝑡𝑒𝑎𝑚 𝑚𝑒𝑚𝑏𝑒𝑟𝑠 = 67 𝑡𝑟𝑎𝑖𝑛𝑒𝑟𝑠
If 20% of CHWs resign annually after the first year:
10,000 𝐶𝐻𝑊𝑠 × 0.20 = 2,000 𝑛𝑒𝑤𝑙𝑦 𝑡𝑟𝑎𝑖𝑛𝑒𝑑 𝑝𝑒𝑟 𝑦𝑒𝑎𝑟
2,000 𝑛𝑒𝑤 𝐶𝐻𝑊𝑠
30 𝑝𝑒𝑟 𝑐𝑙𝑎𝑠𝑠= 70 𝑡𝑟𝑎𝑖𝑛𝑖𝑛𝑔 𝑐𝑙𝑎𝑠𝑠𝑒𝑠 𝑟𝑒𝑞𝑢𝑖𝑟𝑒𝑑
70 𝑐𝑙𝑎𝑠𝑠𝑒𝑠 × 3 𝑤𝑒𝑒𝑘𝑠 = 210 𝑤𝑒𝑒𝑘𝑠 𝑜𝑓 𝑡𝑟𝑎𝑖𝑛𝑖𝑛𝑔
210 𝑤𝑒𝑒𝑘𝑠 𝑜𝑓 𝑡𝑟𝑎𝑖𝑛𝑖𝑛𝑔
45 𝑤𝑒𝑒𝑘𝑠 𝑓𝑜𝑟 𝑡𝑟𝑎𝑖𝑛𝑖𝑛𝑔 = 5 𝑡𝑟𝑎𝑖𝑛𝑖𝑛𝑔 𝑡𝑒𝑎𝑚𝑠 𝑟𝑒𝑞𝑢𝑖𝑟𝑒𝑑 𝑎𝑓𝑡𝑒𝑟 𝑡ℎ𝑒 𝑓𝑖𝑟𝑠𝑡 𝑦𝑒𝑎𝑟
Table 3 Training Requirement Calculation

118 | August 29, 2017 Version
Physical requirements for training
CHIS training requires four conditions to be met:
1. CHW colleges should have lecturers who can teach CHWs CHIS competences.
2. Local CHW supervisors can provide regular support to handle the 10 most common
requests of CHWs. Supervisors also review the reporting systems.
3. CHW supervisors and CHW college lecturers can get help from the national level.
4. There should be SOPs providing protocols and explanations of the data capture and
transmission events. Supporting documentation provides explanations of data fields; the
app they use are available in the language the CHW college lecturers know best.
CHW college lecturers teach the reporting systems regularly and should know the CHW tasks. They
are the right staff to carry out the initial in-service training when the system is introduced. This
contributes to the institutionalization of the training for reporting in the CHW colleges. If more
trainers are needed during the initial training, CHW supervisors can assist.
The national team adapting the CHIS to the needs of the country should be as representative as
possible. Some CHW college lecturers, CHW coordinators, and CHWs should participate as well as
national level HMIS and program officers. This team should provide the training of all CHW
lecturers and participate in parts of the training for the CHWs.
Training Plan
A training plan to strengthen CHIS capacity should be developed, based on the needs assessment.
The plan needs to answer certain basic questions around a number of Capacity Strengthening
Domains raised in the needs assessment
Domain Questions to be answered
Who to train? CHWs, CHW supervisors, Facility in-charges, District program
managers, Trainers
What to train? Public health skills and Technical CHIS skills
When to train? Frequency and Duration of training
Where to train? Pre-service, In-service, Supervision and support
How to train? Training materials and methodology
What will training cost? Budget

119 | August 29, 2017 Version
Who to Train?
Various kinds of staff, such as CHWs, their supervisors, and CHS managers will have different
training needs.
● CHWs need to have appropriate training if they are able to effectively use the CHIS to
perform their everyday tasks of recording, reporting, micro-planning and data driven
actions. In addition to CHWs,
● CHIS training also needs to be imparted to supervisors, which is often the most neglected
part of most CHIS programs. Data use training for supervisors needs to be integrated into
overall supervision skills training and become the focal point of problem identification,
support and monitoring of CHWs. Supervisors need to be able to use data before, during and
after supervision.
● Similarly, CHIS managers perform different functions and will need training adapted to
their specific needs. They may already have advanced knowledge in public health and
available computer skills, and may need specific training on the use of DHIS2 for data
analysis and dissemination of analyzed information. For this, they could request training
materials specifically tailored to their DHIS2 database.
● Community leaders and stakeholders may also need to be trained in the use of data or to be
able to discern data quality issues. Community stakeholders and leaders need specific
training according to their roles and responsibilities. These actors need to put into context
the data they receive from the CHW and feedback they receive from DHIS2 and take the
appropriate actions to improve service delivery.
Involving leaders in data use can have dramatic impact on a community program, as can be seen
from the Zambia case study (see Chapter 6). Community leaders understand the local context and
they should be involved in setting the local targets for the individual CHWs, adjusting these targets
each year based on performance and population. Community leaders should also be involved in
local management of the CHWs and use data on incentives, density, and attrition rates to ensure
that the program is working effectively. Training to them should address these needs.

120 | August 29, 2017 Version
What to Train?
We divide the skills required into two broad categories of technical and public health related. These
are briefly discussed.
1. Technical skills
a. Use of DHIS2
b. Use of mobile devices
c. Hardware and software support skills
2. Public health skills
a. Understanding data, indicators and supporting concepts
b. Understanding how data is used to inform local action.
Technical skills
DHIS2: Skills in the use of DHIS2 is fundamental. However, DHIS2 is a large piece of software, and
the CHW needs to know only particular functionalities, such as:
➢ Mobile Devices: Many CHWs use mobile devices for data collection and reporting. They need to
know how to use the device for recording data, send it either by SMS or the web, and to confirm
receipt of reports. Further, if equipped with a smartphone, they should be able to use the value-
added services available such as SMS, MMS, WhatsApp, Facebook and other social media tools.
This not only helps them to access technical support when needed, but also stimulates interest
in the devices when they are able to communicate with friends and family.
➢ Data Quality Checks: CHWs should be able to assess data for correctness, currentness,
consistency and completeness (the 4Cs) both on paper and on mobile devices.
➢ How to Generate and Transmit Reports: CHWs have large reporting requirements, and they
should be able to use the DHIS2 to generate their required reports, and transmit them to the
next level. For this they need to understand reporting formats and mode and times of
transmitting reports.
➢ Hardware and Software Support: Typically, the CHW is located remotely and far away from
easily accessible means of technical support. Hardware support is never easy, and long periods
of non-functioning equipment can significantly erode the interest of the CHW in the CHIS. The
CHW should be as self-sufficient as possible, able to do basic troubleshooting tasks with the
hardware and software (DHIS2).
121 | August 29, 2017 Version
These skills include ability to:
■ Reset passwords.
■ Reboot the hardware.
■ Reinstall applications on mobile devices
■ Logging into mobile applications
■ Diagnose why a printer is not working and provide basic maintenance.
■ Read a user manual or SOP to diagnose a problem.
■ Accurately communicate with the supporter on the problems they experience and the
solution required.
Public Health skills
Public health skills should be related to the scope of work and should include:
● Understanding data elements, indicators, and public health concepts: Understand the
meaning of data, indicators, and supporting concepts such as coverage, and data quality
parameters. For this, she can be aided with appropriate data and indicator dictionaries which
describe each term used, its meaning, how it is collected (or generated), data sources and
procedures for its collection and reporting. Concepts such as coverage are useful for her to
understand her targets and the proportion she is able to reach or not. Understanding of data
quality parameters can help the CHW interrogate the quality of data that she is collecting and
take corrective actions closest to the source, which is most desirable.
● Use of data to inform local action: Unless CHWs understand the data to be entered, the CHIS
tends to be useless. This is the reason for including the ability to take informed action on the
CHW’s competences. Without experiencing use from the CHIS, the CHWs will stop using it or
they may enter data carelessly, hence the importance of understanding data flow. Also, if staff
at higher levels of the health services do not respond to the data CHWs enter (by providing
required support), the CHWs lose their sense of the CHIS being useful.
As the role of a CHW varies from broad-based IEC and community development to specific
programs for MCH, Malaria and home-based care, their use of data will vary accordingly. “Data use”
is different at higher and lower levels of the health system and training must recognize that and
develop appropriate curricula for each level, linked to SOPs.
Whoever is being trained, exercises should be practical for the audience, referring to “real life” data
analysis scenarios, versus theoretical or academic cases.

122 | August 29, 2017 Version
A common myth is that
competence learnt in a
training course is practiced
at work after training.
In general, the opposite is
true: competence is NOT
transferred from training to
work.
While data use is a skill that is learned in the field under mentorship of a more experienced CHW or
during formal supervision from the facility staff, it is something which can also be supplemented
with more formal training on concepts. For example, use the DHIS2 to plot graphs to:
➢ Match achievements versus targets to identify her areas of improvement.
➢ Compare their facility and neighboring facilities.
➢ Gain a better understanding of their performance over time and space.
The competences listed above constitute some elements of the repertoire needed for CHWs to use
the CHIS. These competences, combined with support and encouragement from their supervisors
and colleagues, provide them with a sense of ownership of the CHIS and the data.
When and Where to train? Modes of Capacity Strengthening
A successful training strategy requires:
1. Pre-service training that provides new graduates with an integrated package of skills
that includes CHIS.
2. Continuous support and supervision from decentralized teams of supervisors who
themselves have necessary CHIS skills.
3. In-service training where needed to address specific CHIS issues.
These three approaches to CHIS training need to be adopted and approached in an integrated and
cohesive process, starting with comprehensive pre-service training, followed by regular in-service
training, with continuous supportive supervision, mentorship and continuous learning woven into
all activities.
This three-pronged training strategy requires different modes of capacity strengthening. For
example, while pre-service training is best done through institutionalized approaches of CHW
colleges, continuous support requires supportive supervision from nearby facilities and peer-to-
peer learning.
Skills for CHWs should be built through continual training,
and it is important to transfer these competencies to the
everyday work of the CHW.
There are many factors that improve the likelihood that
transfer actually happens:
1. Learners are motivated during the training.
2. Learners imitate practice shown by trainers, videos

123 | August 29, 2017 Version
or written material during training.
3. Learners solve problems requiring more than imitation during training.
4. Learners improve self-efficacy during training.
5. The training environment is as realistic as possible.
6. There are opportunities for practicing newly acquired competence at work after training.
7. Colleagues, superiors and others put social pressure on workers to perform.
8. Support is available after training when needed.
The first five factors are taken into consideration in the pre-service CHIS training. The three last
factors concern the circumstances at work during in-service training and supervision.
1 Pre-Service Training CHW pre-service education varies enormously between countries, from a few weeks up to a year,
and CHIS skills also have great variations. After pre-service training, CHWs should have basic CHIS
skills such as knowing how to use SOPs, how to capture and record data, how to use the mobile
applications, and how to contact support.
Timing of CHIS training is essential and should happen at the time the CHIS becomes functional.
● Training before the system is up and running means that CHWs forget all they have learned
when the CHIS is launched and the training was probably not as practical as it should have
been.
● Training after the system is up and running results in frustrated, angry and disappointed
CHWs appearing for training. The trainers will have a very hard time changing their
negative attitude.
While there is no one way to train CHWs in CHIS, the following principles should be adhered to for
better learning outcomes
1. Training should focus on practical data collection and data use skills. Regardless of the
amount of time available, more than half of the training needs to be practice.
2. CHIS training should be fully integrated into other programmatic training. Service delivery,
data collection, data analysis and data use should thus be part of the process of client care
and systems management.
3. Repeating the activity for each program strengthens CHIS competence. Rather than
including reporting activities in just one session, it is better to repeat reporting activities
throughout the training.

124 | August 29, 2017 Version
4. The different tools need to be introduced in the first program. The CHW practices
summarizing and entering data in the collection tools (paper or electronic) and acting on
feedback received using role play.
5. Training should include both the paper based forms and ICT device, interpreting the reports
on health status, and service performance.
6. Looking up help in the SOPs or in the device, and contacting the CHW coordinator for
support are problem solving methods best taught in separate sessions.
7. Length of training should be tailored to CHW knowledge
a. CHWs who are already familiar with paper reporting and feature phones can be
easily trained on routine reporting in a short amount of time. Possibly even in one
day.
b. CHWs who have not used smartphones before will require more time, one to several
additional days
c. If the training includes many health programs, a week or more of CHIS training is
appropriate.
Generic CHIS training material in English for CHWs will be handed out to participants
at the CHIS Academy and will be downloadable. The material needs to be adapted to
local needs and translated into local languages. Sample outlines of a training program
and examples of training materials are available at dhis2.org
Best Practice: Training Session Each training session should include one topic, e.g. Comparing health in my village with the neighbor villages, and it should last for 30±10 minutes. A session should be structured like this:
1. Introduction. Plenary presentation
a. Introduction of the topic, including a demo where learners watch, not do.
b. Explain new functionality and data structure, include demo.
2. Practical hands-on exercises, individuals, or pairs. More than half the time of the session. Trainers walking around helping the learners when necessary.
a. Hand out Minimal Manual and SOPs
b. Make the learners follow the instructions in the Minimal Manual.
c. Give the learners two exercises which differ slightly from the Minimal Manual.
3. Summary. Plenary discussion with the participants.

125 | August 29, 2017 Version
a. Discuss functionality/data structure and confront misconceptions
b. Discuss usefulness
Making the users follow the Minimal Manuals and SOPs during training has the advantage that they
become familiar with written materials and are more likely to look up in the manuals and
successfully solve problems on their own after training.
Training Protocols
As community health programs expand and decentralize, training quality may decline, resulting in
diminished project outcomes and poor data quality. Having a robust set of training protocols in
place can help prevent this situation. A training protocol helps to develop training material and
events that are standardized, scalable, and reproducible.
Additionally, it is important to capture institutional knowledge from past supervision and trainings.
To learn from successes and avoid repeating the same mistakes, use the SOPs as living documents
where institutional knowledge is captured on what works and what doesn’t in your particular
setting.
Training approaches will vary from country to country or even project to project. The best practice
is to have an integrated approach in which the training protocol and materials are harmonized
across programs. The shared location for these documents should be clear for each training defined
in the training protocol.
The training protocol template below is not a complete training package, but should be used to
outline all CHIS trainings, from community up to national level. It defines critical information about
planned trainings, both for pre-service and in-service training.

126 | August 29, 2017 Version
Training Name Standardized name
Purpose of Training
Why it is being carried out, backed up by concrete, action-oriented learning objectives
Duration: Days / weeks / months of training
Frequency: Some training may be once off, but some others may need to be repeated periodically epically at district and facility level where there is typically high staff turn-over.
Venue/ Location
: Where will the training take place in general (district office, chief’s palace, ministry of health HQ, etc.)?
Attendees: Who is being trained, and how many attendees are expected?
Facilitators: Who are these and how many are required? What are their minimum qualifications, and what training should they have received?
Training program
Goals and Objectives for the overall training and learning objectives for each presentation or exercise
Participant assessment:
How are you assessing that the participants understand all the materials? This is typically best done with a pre-exam, grading of exercises, and post-exam. What is the pass rate for the participants?
Links Links to standardized materials, presentations, exams, facilitator's manual, etc.
Post training follow-up:
After trainings, it is often necessary to conduct a follow-up or supervision visit to reinforce training materials and if possible directly support the first round of data submission.
Guidelines for editing
materials:
All training materials will need to be edited over time as the program matures and the system is updated. Define who has control over the standard materials, how edits can be made, how new materials will be updated, and when new materials will be announced to everyone conducting trainings
Training best practices:
List of best practices developed from conducting the training event.
Access to training
materials
Where are training materials both electronic and physical stored? Who is responsible for maintaining an adequate supply of training materials? How are stocks of training materials controlled or distributed?
Table 5.1: Training Protocol Table

127 | August 29, 2017 Version
2 In-service training Initial in-service training on CHIS may require from a day to a week, depending on the CHWs pre-
service training, the scope of the information systems and their familiarity with IT if mobile devices
are used.
Initial in-service training should aim at the CHWs being comfortable with CHIS with help from their
supervisors. In-service CHIS training for CHWs should wherever possible be done by the same
people doing supervision for other CHW activities. CHIS training, like CHW training should be
decentralized as low as possible, while still ensuring adequate quality.
In addition to CHWs, other CHIS stakeholders may also need an orientation to data use
1. Community leaders such as chiefs and others who have the power to influence program
activities and can be empowered through data
2. Community health committees might need to know how to interpret data.
3. District level and local government officials involved in the program and some
implementing partners will need to be trained on web-based DHIS2 analytics and
management.
For each of these, you will have to develop a training protocol and organize the logistics.
It is vital to make sure the appropriate people come to each training. Failure to do so results in
project failure or require an additional training in the future. Government personnel can assist in
selecting the appropriate participants. At District-level DHIS2 trainings, for example, a District
officer should serve as the lead point-of-contact for all training related guidance on invitation lists,
scheduling, and provide guidance on government protocols for inviting attendants to a training.
CHIS project timeline should have a general outline for trainings. Allow yourself adequate time for
planning and communication prior to each training.
Each administrative level should have a point person for CHIS training. Refer to this and work with
your district point person to coordinate schedules for these trainings.

128 | August 29, 2017 Version
Best Practice: Learning in Pairs
Making the participants work in pairs after gaining initial skills has positive effects on learning.
1. They discuss, which helps people understand.
2. Participants who have a low confidence with tech devices see their colleague manages, and
this is the strongest incentive for improved confidence.
3. Spectators watching others explore, experiment and trouble shoot can imitate their ways of
doing it.
Post-Training Supervision and Support
Supervision and support is the key to sustainable CHIS functioning, yet often is neglected,
underfunded, and given low priority by supervisors, who themselves often do not have adequate
skills to support CHIS.
The CHIS training should feed into a strong data system with well-trained users. However, no
system or individual is perfect, and there should be regular, structured follow-up to monitor data
quality. This follow-up will be ongoing in supervision visits.
Best Practice
CHIS users should have one point of support, which means that CHIS supervisor should be
integrated into the general CHW support team. Since they know the CHW supervisor and get
support them for other issues, having them supporting the CHIS is an advantage.
To ensure an efficient continuous training and surveillance system, periodical Supervision Visits
(SV) are performed to community health workers by the CHW direct supervisor and possibly
implementing partners or other Ministry staff.

129 | August 29, 2017 Version
How supervision is conducted varies from country to country or program to program, but there are
three core goals of any type of supervision:
1. Ensure quality, timely reporting from the community and feedback from the CHIS to the
community.
2. Review program principles, SOP, and service delivery with the reporting cadre.
3. Troubleshoot program, hardware, and software challenges
To achieve these core goals, a supervision visit should examine at least these aspects of CHW
functioning:
● The CHW’s ability to perform service delivery (Diagnose and treat diseases, conduct community sensitization events, etc.).
● The CHW’s ability to capture data, record data, and perform data quality checks.
● The CHW’s ability to submit data and troubleshoot data transmission/application problems.
● The CHW’s ability to perform basic data analysis and communicate that analysis to community change agents.
● The CHW’s major bottlenecks in service delivery, reporting, or communicating.
● Any additional issues faced by the CHW (Lack of community support, distances too far to travel, not enough time to perform activities, etc.).
Best practice
Introduce the CHWs and the CHW SOP to community leaders during supervision. Community
leaders are often key agents of community behavior change. They must understand and support the
role of the CHWs working for their constituents. You can support their engagement by helping them
understand the role CHWs and their data play in preventing and treating diseases in the
community.
● If community leaders do not support the CHWs the community health program in
many countries is more likely to fail.
● Engage community leaders from the start.
● If possible, request their support to monitor CHW reporting rates or conduct data
verifications.
In some community health programs, large community orientation sessions are held to introduce
CHWs, explain their roles and the services they provide, and have community leaders publicly
support CHWs. This elevates the role of the CHW and provides them with the necessary credibility
to do their job well.

130 | August 29, 2017 Version
Types of Supervision:
There are many ways in which to conduct supervision. The style and approach will change over
time as the process is refined and becomes tailored to the specific needs and desired outcomes of
the supervision. For the purposes of these guidelines we have outlined two broad types of
supervision: In-person and Remote.
In-Person Supervision
A common type of supervision is direct face-to-face meetings with CHIS supervisors or the CHWs.
An in-person meeting will directly impact the program performance and provides an opportunity to
provide on-the-job support or address complex problems or issues. It is also the best way to
provide direct technical support in the field that cannot be done remotely. In person supervision,
however, is costly to maintain.
In-person supervision can be central or local:
1. Central or regional level (government or partner organization) supervisor travels to meet
with the CHW supervisors or CHWs with district and local staff and other key stakeholders.
○ Pros: Excellent at capturing and addressing issues in a timely manner. Able to
provide expert support directly to CHWs. Highly promotes status of CHWs
○ Cons: Costly and ultimately unsustainable
2. Local: The district, clinic, or CHW supervisor staff meets directly with the CHW without
partners.
○ Pros: Inexpensive and capable to sustain. Captures and addresses more routine,
simple problems. Provides CHW with continuous sense of support.
○ Cons: May not be capable of addressing complex technical problems

131 | August 29, 2017 Version
Remote Supervision
In addition to on-site supervision visits, remote supervision through phone calls, Skype, WhatsApp,
or another platform can be used to discuss with CHW supervisors or CHWs. When the topics to be
discussed are simple and uncontroversial, remote supervision saves time and resources. This may
work well on following-up tasks and status reports.
Remote support works best for:
● Support to CHW supervisors who are on track and do not need problem solving support
● Preparation to ensure readiness for an on-site visit could also be done remotely.
Remote support is less effective for:
● Introduction of changed or new practices or discussion of controversial or complex issues
are less likely to succeed through remote communication.
● Improving poor performing or deteriorating community health programs or CHIS.
Two types of remote supervision are described below:
1. Remote supervision to districts and CHW Supervisors: The partner or central or
provincial government has a remote Skype or phones call with the district office or sub-
district actors to support healthy program implementation.
● Pros: Inexpensive and capable to sustain. Captures problems as they are interpreted
from the CHW supervisors. Provides supervisors a feeling of accountability.
● Cons: Does not hear problems directly from CHWs.
2. Remote supervision to CHW: The Supervisor contacts the CHW.
● Pros: Enables CHWs to directly express problems and concerns. Provides CHWs a
sense of accountability and support. Can be done whenever a CHW has a specific
technical problem that local supervisors are unable to address.
● Cons: In large scale programs, it may not be possible to contact for all CHWs.

132 | August 29, 2017 Version
Supervision Protocol
CHIS supervision (in-person and remote) should be clearly described through a supervision
protocol that provides oversight to each supervisor, embedded within a larger programmatic CHW
supervision protocol.
The protocol defines the type and frequency of how supervision and support is provided to all
levels of the CHIS. Just as with the training protocol, it is necessary to clearly define the supervision
so that they are standardized, scalable, and reproducible. A CHIS supervision visit protocol outlines
in detail the following for each type of supervision:
Supervision Type:
● In-person or remote ● Central or local
Purpose ● Aims and objectives of the supervision
Target Audience:
● Who receives the supervision? How many participants should be in a session? ● Where will supervision take place
Team Members:
● Who conducts the supervision? ● How many supervisors are required?
Frequency: ● How often should this event take place? Insert the supervision calendar as
described. Take note if this frequency is meant to decline over time and outline that schedule here.
Objectives: ● Clearly define targets, with associated performance or outcome indicators that can
be monitored for effectiveness of the supervision.
Pre-supervision
● Tasks or activities prior to supervision (e.g. gather materials, send invitations, run validation rules, get phone credit, print dashboards, etc.)
Activity Checklist:
● Activities or topics to cover during supervision (e.g. check ability of CHW to describe data elements, use phone for reporting, review data quality issues, describe health indicators, troubleshoot application issues, etc.)
● Post supervision reporting requirements by the supervisor. These could describe outcomes of the supervisions, findings, next steps, etc.
● Budget for the supervision. Describe what is and what is not an acceptable expense.
Narrative: ● Describe the events of the supervision in narrative form.
Common Findings:
● Keep a running list of common findings, questions, issues, or experiences had during supervision.
● This list can serve to prepare new CHW supervisors, plan additional supervisions, and document institutional knowledge.
Feedback on Best
Practices:
● How do CHWs and other stakeholders benefit most from supervision? ● What worked well? What did not work? ● Best practices of supervision so other CHIS supervisors can learn from others.
Figure 5.2: Supervision Protocol Template

133 | August 29, 2017 Version
Targeting Supervision
Typically, supervision employs a blanket approach in that every CHW receives the same
supervision regardless of the specific issues that they face. This antiquated approach is uninformed
and does not address or
uncover all of the
problems that CHWs
may be experiencing.
CHWs must feel like
their issues are being
heard and taken
seriously, and they must
see specific actions that
address their issues.
Targeted supervision is a
cycle of planning
supervision, conducting
supervision, solving
problems, capturing new
problems, solving those
problems, and planning
supervision again. Figure
5.3 summarizes this:
Figure 5.3: Targeted Supervision Cycle
● Planning Supervision: Before a CHIS supervision visits the supervisor should analyze data
from each community and community health worker to be visited. Analysis should focus on
data quality as well as key output, outcome, or impact indicators. As you plan, keep a list of
key issues and data errors to address during the field visit. Dashboards for comparison
between wards/villages/communities will be helpful in guiding targeting. These points can
guide you in making list of
○ Areas where data shows problems that need personal supervision
○ Medium/low priority areas where remote supervision can be given
● Conducting supervision: CHW supervisors should provide solutions to known existing
issues and capture new capture the priority issues faced by CHWs.

134 | August 29, 2017 Version
● Post supervision: After supervision has occurred, analyze the problems that have been
identified and develop solutions to them. Then push these solutions to the CHWs. It may be
possible to directly push devised solution to CHW’s or their supervisors via a feedback
mechanism prior to conducting another supervision visit.
● Planning supervision again: While planning the next round of supervision target CHWs
based upon the problems they have reported and during supervision ensure that CHWs are
receiving solutions.
Best Practice
Before supervision, run validation rules for each CHW or community you are going to visit. Print
out the specific data quality issues you want to share with the CHW.
● Results of the validation rule analysis s.
● Dashboards, scorecards, or any analytics.
Best Practice
Use DHIS2 event capture or tracker to record the details of every supervision visit.
● Use mobile applications to capture the most pressing problems faced by CHWs
● Observe a CHW actually perform the action they are trained to do.
● Always ensure that there is a free text box in which the supervisor can record an issue that
is not included in the pre-existing option set.

135 | August 29, 2017 Version
Data Quality during Supervision
Supervision should aim to maintain and support the 4Cs of data quality:
1. Correctness: (Accuracy) Submitted data is believable based on the context; the units and
ranges for the data are what is expected. Note that validation rules can be built in DHIS2 to
help guide data correctness.
2. Currentness: (Timeliness) The reported data is current and was collected during the correct
time frame; the figures are not identical to last month’s data, which may indicate
falsification of data or submitting an old data set.
3. Completeness: All forms are completed, and within each form, all required data elements
are filled out.
4. Consistency:
a. High quality data does not usually vary over time for most PHC activities, apart from
seasonal variations.
b. Always check data for “outliers” that may reflect data entry errors.
c. Data is submitted regularly and on time. Data reporters are consistent in their
adherence to data submission practices.
These are the items field officers should train their eyes for once data collection begins. Issues in
data quality could reflect poor or inadequate training.
On-the-Job Support during Supervision
Supervision visits should cover issues identified prior to the visit, but supervision visits are also
ideal times to conduct on-the-job support to address program performance, resolve issues in real
time, and enforce SOPs. On-the-job support should include:
1. A general overview of performance at all levels to give the CHW or the Supervisor a better
sense of perspective and motivate them to better performance:
a. How CHWs performance (key indicators, reporting rates, reporting completeness)
compares to other CHWs, district performance, national performance, etc.
b. How CHW supervisors perform in relation to national performance:
i. Average reporting rate for the CHWs under the supervisor compared to
national.

136 | August 29, 2017 Version
ii. Average program performance for the CHW supervisor compared to
national levels.
Specifically discuss performance of those groups that are present. Present the data and ask
them for feedback on why they think they are performing better/ worse than their peers.
2. Discussion of common data errors as identified by your pre-visit data analysis. Explain what
those errors are, and clarify them. Review data entry forms, focusing on data elements that
are commonly entered incorrectly. Correct data errors and resubmit the corrected data
during the supervision visit.
3. Identify challenges if there is a noticeable difference between CHW performances. The team
should create specific tasks to address those challenges.
4. Hardware and software troubleshooting should be addressed. Any outstanding issues
should be resolved and CHWs should be shown how to resolve those issues themselves in
the future. CHW supervisors should travel with extra phones/tablets during SVs.
5. If community workers have data entry that is late or outstanding, they should be
encouraged during these visits to submit the missing data.
6. The visit should conclude with a summary to the entire group, based on discussions in the
small groups, key findings, challenges, successes, and action points. These should be
documented in a supervisory report that is left on site, as well as on DHIS2.
After Supervision After a supervision visit, it is important to capture what was discussed and learned during the visit.
A formal report containing this information should be completed shortly after the visit and
submitted into the CHIS. The report should capture where the visit took place, who was met, which
activities were discussed, and what the findings and recommendations were. These reports should
be specific, as they will guide program surveillance officers and other staff in how to follow-up on
issues and with whom. They might also inform program staff of larger patterns that require
attention.
Best practice
CHWs become motivated when issues they communicate to their supervisor are resolved. This
could include diverse things like hardware and internet, understanding of health indicators and
fear of making mistakes. Also, issue or resources and public health competence resolved motivate
the CHW to improve their performance, CHIS work included. Facility and district management as
well as partners need to help the CHW supervisors resolving CHWs’ issues.

137 | August 29, 2017 Version
Scheduling
Developing long-term schedule for supervision is important for budgeting, planning, and
supporting the success of the system. Scheduling of supervision often happens prior to project
implementation. While the frequency of your supportive supervision depends on the scale and
scope of your intervention, we recommend for a large community health programs,
● The first supervision visit should happen during the first or second reporting period to
assist CHWs complete their initial data submission.
● For the first six months to one year supervision should take place every 4-8 weeks.
● Once consistent competency and quality have been attained, visits can be reduced to
quarterly or less.
● A district or area that is performing particularly well, may not require such frequency.
● CHWs should receive supervision and support whenever they visit the health facility or
district offices to receive commodities or materials.
● If the program is launched by a partner organization and is intended to transition to
government control ensure that the frequency of supervision is of a type and at the
frequency that the ministry can sustain.
With the point person in each district, establish an appropriate schedule of visits.
Example of a Supervision Schedule
Figure 5.4 is an example of a three-year supervision schedule for a district that is implementing a
CHW ICCM program by a large NGO that will transition to government control by the end of year
three.

138 | August 29, 2017 Version
Figure 5.4 - Example Supervision Schedule
● In the first year, partner-lead in-person supervision to CHWs and CHW supervisors is
conducted three times. This is important because partner-led supervision will be very
effective, but it will also be expensive to sustain.
● In year two, partner-led supervision only happens twice.
● In year three, partner-led supervision happens just once.
You also see the local-led supervision to CHWs happens monthly. This is because in this example
CHWs must visit the health facility monthly to get resupplied on commodities. During that time the
CHW also received supervision from the Clinic In-Charge.
In this example for years one and two the implementing partner with central government staff
conduct bi-annual remote supervision to CHW supervisors and directly to CHW themselves. In year
three bi-annual, remote supervision continues to CHW supervisors while remote supervision to
CHWs offices once. It is envisioned that the supervision schedule for year three is sustainable by the
government without direct support from partners or donors.
Budgeting
Keep in mind the same best practices principles as when budgeting for training.
Figure 5.5 is a sample budget for surveillance visits is below. All unit costs listed are arbitrary and
not necessarily representative of real costs.
It is typically necessary to produce a detailed budget for supervision visits so that supervisors
clearly understand what is and is not an allowable, budgeted cost.

139 | August 29, 2017 Version
Figure 5.5: Example In-person Supervision Visit Budget
Training CHW College Lecturers and CHW Coordinators
Lecturers at all CHW colleges should be able to teach the CHWs effectively and follow them up in
the field. If the teachers have a background of M&E or public health, they should be familiar with
indicators, reporting systems, and evidence based health management. If CHW lecturers come from
a clinical background, they will need to learn these topics.
All trainers need thorough training on new IT systems. The rule of thumb is trainers should know
the subject matter 10 times as well as the learners. This means 10 times as long training as the
CHWs. Trainers need:
1. A wide selection of training data and examples.
2. To learn the pros and cons of various reports and also how to interpret reports.
3. To know the 10 most common support requests from users. Note that these requests will
not be known until a pilot has been run for a couple of months.
To become effective CHIS trainers and supporters, explicit explanations, and practice are essential.
This includes:
● Knowing how to carry out operations on your own phone while giving instructions to the
CHW.
● Helping the learner rather than taking over the learner’s device during on-site training.
● Convincing CHW about personal and organizational usefulness through the trainer telling
personal stories. This helps the learners relate to their own practice.
● Being aware of common mistakes and misconceptions which should be collected
internationally.

140 | August 29, 2017 Version
Training material for CHW college lecturers and coordinators should be available for download and
adaptation.
Core team
Implementation of the CHIS needs a core team to train the CHW college lecturers and coordinators
and to follow through implementation. This requires a multidisciplinary team with broad
knowledge base with skills in CHW, public health and IT and its members should be members of the
team managing the overall CHW program, rather than a separate team. They should have several
years of experience and preferably also be people who have been CHW or CHIS champions in some
respects in their work.
The team adapting the reporting system to national needs participants from CHWs, CHW college
lecturers and coordinators, public health, and IT people and should have strong stakeholder
representation from decentralized levels. Some countries tend to pick juniors for such tasks, since
the seniors are too busy with other projects. However, for the CHIS to succeed, system
implementation has to be anchored in the top level, put pressure on the colleges and health services
to select the right people and ensure continued monitoring and feedback of project activities.
Preparations for Training
Budgeting
Efforts should be made to keep costs low and existing resources be used wherever possible. Some
guidelines on preparing the budget include:
● Follow organizational policies in using approved budget templates and rates (indirect,
DSAs, etc.) for all expenses including:
○ Travel (e.g. fuel, car hire, lodging)
○ Personnel (e.g. per diems, meal costs)
○ Venue (e.g. conference space, tea breaks)
○ Materials (e.g. printing, hardware, projectors)
○ Miscellaneous items
● Build budget based on in-sheet calculations of materials needed, unit cost of that material,
and number of units needed. You can also build in additional multipliers to illustrate
number of units per attendee. This allows flexibility in updating the budget if unit costs
change, or number of participants increases or decreases.
● Budget anticipated expenses in local currency, with a conversion rate built in (that can be
updated as needed) to convert to the desired currency of your organization or funder.
A sample budget for a five-day training using hypothetical costs is given in figure 5.6:

141 | August 29, 2017 Version
Figure 5.6: Sample 5-day Training Budget
Technical Preparations
When preparing for the training, ensure all the practical technical requirements including
computers and a router are in place. This means knowing whether to use a cloud based DHIS2
training instance or local DHIS2 training instance. The availability of internet connectivity
influences such a decision.
If the training location is rural and might have problems with internet connectivity, it is best to have
a local DHIS2 training instance set up on a computer. A local instance allows users to access the
DHIS2 training server via computer IP without the need for internet connectivity. However, the
number of users that can work effectively from one computer IP is limited by the router size; it is
important to know the number of attendees, to select a router that can support the number of
participants. You should familiarize yourself with local network providers and hardware capacity
(mifis, etc.) they produce.
To use a local instance, you need to have it set up ahead of time on a computer. Your technical
experts should help you set this up; the CHIS DHIS2 community of practice, www. Knowledge-
gateway.org/dhis2-chis-community, includes three guides on the necessary steps for this set up
(A1.i. Setting up a Virtual Machine, A1.ii. Building your DHIS2 Local Instance, A1.iii. Sharing Your
DHIS2 Server). The use of a production instance of DHIS2 should be avoided for training purposes.
Before doing the training, the exercises should be tested in the chosen instance (local or cloud
based) to ensure everything is working. Troubleshoot issues detected during testing so they do not
arise during training. You may have a second person repeat the test to spot any issues missed in the
first round.

142 | August 29, 2017 Version
Best Practice
If training with a local server connection, at the end of the training, let the learners access a remote
server, to experience delays in the network for operating the system and for challenging their
patience. Without experiencing the delays, they may later interpret network delays as faults in their
device.
Event Space and Agendas
Be aware of the number of attendees you expect at each training, as providing sufficient materials
and space will be necessary. Event space should be large enough for the group and also appropriate
for the planned activities. Consider:
1. The type of seating you require (round table, individual desks, etc.).
2. Technological requirements (computers for all, Wi-Fi bandwidth, etc.),
3. Finance for conference center allowances, participant food and beverages
4. Trainers need space to walk around to observe and help each participant.
Materials
Sample Material List
Training of community-based, aggregate DHIS2 system with mobile data entry. ● Minimal Manuals to be distributed to each participant. ● Standard Operating Procedures as relevant to the participants. ● Projector(s). ● Flip chart(s). ● Markers. ● Notepads and pens for each participant. ● 1 set of hardware for each attendee (Smartphone, tablet, feature phone). ● Printed copies of..... (list will vary):
○ Attendance Sheet. ○ Participant’s Agenda (1 copy per participant). ○ Hardware Agreement Forms (2 copies per person receiving hardware, one for
them to keep, one to be collected). ● DHIS2 App Configuration Guide (1 copy per data collector supervisor and district officer). ● Village/Community ID Form (used in determining organizational unit hierarchies). ● Practical Exercises. ● Data Collection Form(s) that will stay on paper, (multiple copies per participant). ● Aggregate Data Collection Form (to be put on paper then into DHIS2).

143 | August 29, 2017 Version
The materials you will need for your trainings will depend on your activities. To ensure you are
planning for everything, walk through your training agenda with a partner, and discuss what will be
done for each part of the training, taking note of the materials needed.
The agenda for training sessions should be defined well-ahead of the training and included in
materials distributed. See sample agenda for community supervisor/facility staff training.
Best Practice: Phone Tracking System
When distributing phones for mobile surveillance, have a tracking system for this hardware.
1. Number each phone box and two copies of the phone agreement (i.e. #1 on a box and on
both agreement forms) and hand both to a community health worker supervisor to fill in
the forms against the details of that phone.
2. Ensure that the phones and boxes do not get mixed up.
3. Collect the agreement forms, and have a council sign and stamp both copies. One copy will
remain with the district, and the other will be returned to the partner and kept in the
district box file in the office.
4. Use a QR code generator to generate a QR code with the phone's information (number,
CHW, SIM number, district, etc.). You can then print this QR code onto a heavy-duty label
sticker and apply the sticker to the back of the phone or inside the phone in the battery
compartment.
5. If providing SIM cards with phones, document the associated SIM card and phone.
6. To prevent tampering of the SIM card is provided with the phone, glue the SIM into the
phone by placing the SIM card in the phone and applying glue to the back.
Best Practice: Minimal Manuals for Tasks
User documentation should be packaged in Minimal Manuals. These manuals explain a specific
work task (e.g. enter monthly data from village health register or compare health in your village
with the neighboring villages). After explaining the work task, the Minimal Manual provides
numbered step-by-step instructions with screenshots, so that users recognize what to do. Keep in
mind that Minimal Manuals do NOT explain the functionality of the app, one by one, like a typical
vendor user manual.
Note: Since users prefer doing and not reading, the manuals should be a short as possible while still
containing all steps.

144 | August 29, 2017 Version
Evaluation of Training
Evaluation of training is essential, both during training and afterwards. Evaluation may be either
qualitative (feelings of trainees about quality of training) or quantitative (data quality)Some
options for evaluation are included below:
1. Feedback during Training: It is important to know whether your participants feel they are
or are not benefitting from your trainings. This can inform future trainings and lead to
improvements.
a. Get participants to write their feelings anonymously on paper or “post its” at the end
of each day - Green for Good and red for bad.
b. Facilitators then review the responses from the “post its” at the end of the day and
modify the training accordingly based upon responses.
2. Competence Assessment: Performing an assessment at the end of the training is another
source of knowledge. This can be used to:
a. Tie work performance to learning outcomes after training.
b. Evaluate the training as a whole.
These assessments should be similar to, but not identical to, the exercises done during the
training, and should require trainees to apply rather than recite what they learned. Make
sure the test is accompanied by a rubric to ensure fairness if responses are graded.
3. Data Quality: A cost effective evaluation of transfer of competence from training to practice
is to assess the quality of the data entered by the CHWs and to link this data quality with the
training.
a. Data quality can be assessed automatically in the database.
b. Interviews with the CHWs can tie their performance to the training, software,
hardware, support, social pressure and other factors.
4. Impact Assessment: These are complicated and expensive assessments and need
specialized training, technologies and skills so are not covered here.

145 | August 29, 2017 Version
Chapter 6 Sustainability and Governance
Introduction
Ensuring sustainability, broadly concerning how the CHIS endures over time and space is one of the
most difficult challenge that policy makers and implementers have to deal with.
The key to long term sustainability rests with governance of data management, which is a cross-
cutting issue that involves formal management structures, policies and procedures, staffing, and
workforce development, monitoring and evaluation of the CHIS program. By the end of this chapter,
readers should be able to:
Learning Objectives
● Describe sustainability of CHIS, and its important facets.
● Explain what “designing for sustainability” means and the important considerations in
this process.
● Explain the important role of governance in enhancing sustainability of the CHIS.
● Describe the four components of governance for CHIS data management.
What Do We Mean by Sustainability?
Sustainability of HIS in general, and CHIS in particular, is one of the most significant challenges
facing designers, implementers, and policy makers of CHIS. Sustainability is a “wicked” problem,
implying that if you try to address one of its facets, other problems will arise elsewhere. For
example, to address the problem of CHIS continuity, a donor may be approached for funding.
However, this may lead to other dependencies that can further put pressure on sustainability.
Some relevant characteristics of a sustainable CHIS include:
1. The CHIS must be well integrated into existing organizational routines of work
practices, budgeting, training, reporting, and infrastructure provision.
2. On one hand the CHIS has to be well institutionalized, on the other hand, it must remain
flexible, so that it can continue to evolve with the changing informational needs of the
health system. This often leads to a dilemma of ensuring both stability and change,
which designers and implementers have to constantly engage with.
3. The CHIS must be integrated with other systems like the routine facility HIS to ensure it
does not remain standalone and lead to double work for the CHWs. A standalone CHIS
is a sure recipe for unsustainability.

146 | August 29, 2017 Version
4. The outputs of the CHIS must provide real value to the key stakeholders, particularly the
CHWs and their supervisors, but also mid-level and senior system managers.
Ensuring CHIS Sustainability
To address sustainability the primary focus of CHIS design should be on strengthening the “demand
side” conditions such as how the CHIS adds value to the CHW, how it is integrated with their
everyday work practices, and their needs for ongoing technical and public health support, rather
than the dominant “supply side” approach of merely providing computers, internet and training.
To make a CHIS sustainable, planners need to address key technical, organizational and behavioral
factors. These are explained in detail in the Performance of Routine Information Systems (PRISM)
framework8 and shown schematically in Figure 6.1 below.
Figure 6.1: The PRISM framework
In this approach, CHIS inputs such as assessments, interventions and strategies need to be addressed by
technical, organizational, and behavioral determinants in order to achieve the desired outputs of a
sustainable system that produces good quality information used to improve overall health system
performance. A few aspects focused specifically on CHIS sustainability are detailed below.
8 [2] MEASURE Evaluation, “PRISM: Performance of Routine Information System Management Framework,” http://www.cpc.unc.edu/measure/tools/monitoring-evaluation-systems/prism.

147 | August 29, 2017 Version
1. Technical Design
a. Integrated CHIS: There are a number of examples of CHIS developed as an integrated
part of the overall HMIS, linked directly to other systems in the community, particularly
the routine facility information systems. Using an architectural approach, the CHIS
becomes part of the system, reducing CHW workload and adding value,
b. Increasing ICT infrastructure: MHealth projects are increasingly based on internet
connectivity, which is increasing exponentially allowing the use of android devices and
mobile phones. However, This infrastructure must be carefully assessed, ensuring that
the CHIS projects use available connectivity to its maximum while becoming fully
operational.
c. Free open Source software (FOSS) systems: Successful CHIS projects are developed
based on free open source software such as DHIS2, ensuring interoperability with other
systems. FOSS flexibility and iterative design processes allow ongoing changes required
for the application. As a result, the CHIS can evolve with changing needs, constantly
adapted to the needs of the end users.
2. Human Behavior
Human behavior is the most difficult aspect of implementing a sustainable CHIS, and this aspect
needs consistent attention. This phenomenon is increasingly being addressed by dealing with
common issues with CHIS such as:
a. Changing Facility Staff attitude to CHWs. Many health workers do not understand the
role of CHWs and look down on their work as being second class. Major effort needs to be
put into encouraging facility level workers to support the community health services, the
CHIS and providing CHWs with necessary feedback, support and supervision. Facility staff
also need to be involved in addressing sustainable remuneration of CHWs, building this
into the budgets, to increase motivation, reduce dropout, and minimize attrition.
b. Providing targeted feedback CHIS stakeholders need to see the practical value of data
and increase data use through regular, targeted feedback that demonstrates data driven
actions based on data. This further increases local demand for and use of data, stimulates
ownership and promotes a culture of information use, creating the virtuous data cycle.
(see figure 3.1)
c. CHIS provides added value to end users. For the CHIS to add value to the CHWs, the
system design must be integrated with their work practices, reduce their work burden
and add value for them to perform their work. A CHIS that is designed for local use and
program monitoring rather the surveillance needs of administrators, means that CHWs
and stakeholders are motivated to use the system.

148 | August 29, 2017 Version
d. Ongoing CHIS support and capacity strengthening. CHIS should focus on ongoing
training, and provide support to CHWs in the many challenges they face when they use
the system, providing feedback and support rather than criticism. CHIS supervision needs
to encourage CHWs to use the system and make it sustainable.
3. Organization
a. Strong Data governance: Governance is key to sustainability of any CHIS. All community
level stakeholders must agree to common data standards and high-level coordination based
on accountability, transparency and local participation. Key to these standards, are common
data collection formats that reduce the data burden of the CHW and minimise the
fragmentation of the CHIS. These in the long run contribute to systems becoming
sustainable and enduring.
b. Plan for scaling up: Many CHIS projects are initiated as pilots with a limited timeframe and
funding, known as “pilotitis”. This needs to be avoided and scaling up planned for from the
beginning with adequate resources and support. CHIS is about bringing about long term
institutional and human behavior change, and systems take a long time to mature, usually
beyond the short term “project” timeframe.
In summary, various reasons, technical, institutional, and human related, contribute to the CHIS
becoming sustainable. Many of the reasons are inter-connected, requiring a holistic design and a
health systems based approach to address sustainability.
Unsustainable systems do not scale, do not add value to the administrators who want data on the
entire catchment population and not just from pilot areas. This challenge has been called the “all or
nothing” consideration in HIS. Because the CHIS are not able to surmount these challenges, they
don’t add value, and thus do not attract the required support from the administrators. This vicious
cycle of unsustainable systems that do not scale and thus add limited or no value to users, leads to
poor support and further adds to the unsustainability of the CHIS.
CHIS Governance
Information systems are not what they used to be and are becoming more important as
interdependence among systems increases and demands for social accountability increase. Health
information systems are becoming more important as information and communication technology
spreads and have a greater impact on health workers lives, with pressures growing for more and
better quality data. This trend is occurring at the same time as other significant changes are taking
place with demands for greater transparency, participation and accountability and a reduction in
the “digital divide” between countries. The challenge to CHIS designers and implementers is to
build relationships of trust between stakeholders and to deliver effective social accountability.
The growing expectation that it is right to be involved in decisions that affect one’s future and the
increasing knowledge about what is going on in the health system are a powerful combination to
pressure health managers to improve trust between different levels of the system. Civil society,

149 | August 29, 2017 Version
health workers and other stakeholders are increasingly demanding participation in decisions that
are made about them, insisting on transparency about allocation of resources and using the internet
and social media to voice these demands. At the same time international organisations are insisting
on accountability, demanding value for money for aid projects.
These three concepts – participation, accountability and transparency – are the core principles of
good governance and need to be applied to any development of a CHIS.
Participation in CHIS governance emphasizes the broad participation of stakeholders in the
direction and operation of information systems to develop a degree of consensus around decision
making rules and capacity development processes. Participation implies increased citizen
participation and greater community representation than traditional systems, creating
opportunities for stakeholders to make meaningful contributions to decision-making, and seeks to
broaden the range of people who have access to such opportunities. Technology may provide
important forces leading to empowerment in participatory models, though face to face meetings
remain important
Transparency refers to the availability of information to the general public and clarity about
government rules, regulations, and decisions. Transparent procedures include open meetings,
financial disclosure statements, freedom of information legislation, budgetary review, and audits.
Transparent CHIS governance, therefore, means not hiding things from community stakeholders,
not engaging in shady deals and not making discretionary decisions. There should be clear
guidelines to adhere upon, based on openness.
Accountability in governance refers to the collective responsibility of officials to preserve the
public’s trust in government by delivering on policy outcomes and safeguarding public funds.
Accountable governance of a CHIS involves systems and coordinated actions through which the
MoH (with donors) ensures the effectiveness, efficiency and economy of expenditure. It relies on
tools that promote value-for-money, integrity and transparency in government, such as external
control, internal control, sanctions, and enforcement. These tools create an enabling environment
for greater accountability and improved governance.
Governance implications for donors and government
While governance is ultimately the role of government, accountable governance is not the
responsibility of one institution, but many entities and individuals across all levels, particularly
local government for the CHIS.
The donor community (development partners) has a distinct role in supporting government to
develop and implement CHIS governance guidelines around transparency, accountability and
accountability. The donors wield considerable influence over the availability of resources and need
to support the design principles, harmonize CHIS and end pilotitis.

150 | August 29, 2017 Version
Governance of Data Management
Effective data governance is the key to sustainability and is essential to all forms of routine HIS,
including CHIS.
Data management governance is at the core of all information systems and is crucial for the
sustainable functioning of a CHIS. This section is adapted from “Guidelines for Data Management
Standards in Routine Health Information Systems9” and readers are encouraged to refer to that for
further details.
This section defines CHIS governance, provides an overview of governance of CHIS, and proposes
standards for data management governance which, when applied, can strengthen CHIS
performance.
Governance in data management can be defined as: The development and implementation of
administrative policies, procedures, and processes that define workflow, program inputs
and outputs, management structure and oversight functions, and the methods and
frequency of performance evaluation.
Data management governance dictates how the different components of the CHIS, at the same or
different levels of the health system, work together to achieve a common goal - quality health data
for decision making. For the purposes of this guideline, governance is applied largely to CHIS and is
seen as a core function of high level management at all levels -that is, to monitor, assess, and
strengthen these systems to facilitate improvements in service delivery
Data management governance ensures that data is of high quality - current, correct, consistent, and
complete - as well as readily available to stakeholders (i.e., ensuring access to consumers, or those
who require health information to inform decision making). In practical terms, that means putting
personnel, policies, procedures, and organizational structures in place to ensure that data is
accurate, consistent, secure, and available.
The process of data management governance for a CHIS should foster cross-organizational
collaboration, facilitate structured policy making and balance ad hoc or narrow information needs
with the interest of the Community health system. Interventions to improve governance should
address the institutional, behavioral, and technical determinants of CHIS performance described
above and focus on improving the desired CHIS output of good-quality data that is regularly used to
improve service delivery.
Good governance requires commitment at all levels. It is not enough to have good structures,
policies and procedures at the top. They need to be implemented by a dedicated team of well-
trained stakeholders at the lower levels who have the motivation and skills to monitor and evaluate
the CHIS based on the principles of participation, accountability and transparency.
9 Heywood & Boone Guidelines for Data Management Standards in Routine Health Information Systems Measure evaluation 2013

151 | August 29, 2017 Version
Figure 6.2 Governance of Data management
This model brings together in one place a number of concepts dealt with in other places in this
guideline including:
● Formal governance structures such as SOPs and strategic planning and financial systems, as
well as oversight mechanisms such as technical working groups (TWG).
● Workforce development, training, and supervision to identify best practices pertaining to
CHIS staffing. (Chapter 5)
● Policies and procedures for data management, with particular regard to standard operating
procedures, data and metadata stewardship. (Chapter 4)
● CHIS assessment, starting with general assessment questions and then exploring the
Performance of Routine Information Systems (PRISM) model to see how CHIS converts
inputs into appropriate outputs by influencing determinants of health outputs
(organizational, behavioral, and technical) and their influence on overall health system
performance.(Chapter 2)
● Ways to promote a culture of information use is the core theme of this manual.

152 | August 29, 2017 Version
Formal Governance Structures
CHIS governance is the oversight and monitoring function necessary to ensure that the CHIS
functions as designed. Adequate governance allows the system to identify threats to performance
and make necessary corrections, as well as to find opportunities to improve the CHIS and advance
the aims of the system.
Governance structures are the formal mechanisms through which this oversight and local
management takes place, including organizational frameworks, TWG (Technical Working Groups),
and boards of directors. Governance structures oversee the management functions and inputs to
ensure optimal system functioning
Mission Statement
A mission statement is a formal expression of the purpose of the CHIS and its reason for being. A
good mission statement states the reason for the organization’s existence and includes goals, names
primary stakeholders, and articulates how the organization provides value to stakeholders.
Organizational Chart
An organizational chart is a diagram used to depict the CHIS structure and personnel. It helps
organize personnel by identifying management control within the organization.
An organizational chart is useful for planning, resolving disputes, and managing change. It can be
used as a baseline for planning, budgeting, and workforce modeling as it gives a succinct overview
of the organization.
Effective participation structures
CHIS oversight committees should be formed at each level of the system—that is, in each district
and facility, to monitor CHIS system performance. The committee should be made up of CHIS
stakeholders from health care institutions, implementing partners, local governments, and, where
possible, civil society. These committees should facilitate the CHIS mission in their area of influence
by monitoring performance, alerting CHIS management to strengths and weaknesses, and
facilitating capacity building.
Village Health Committees are crucial to spread participatory processes to the lowest levels and
these need capacity development, funding and regular feedback to become effective
The CHIS regulatory authority and data governance council (see policies and participation section)
also need to have effective representation of community stakeholders

153 | August 29, 2017 Version
Reporting Structures
In a CHIS, data and information begin at the service delivery point in the community and then flow
toward the center to be shared with stakeholders to ensure that relevant information, based on
quality data is available to those who need it in timely fashion.
Reporting structures include directives (SOPs) from CHIS management, which state who reports
what and to whom, when reports are due, in what format and by which mechanisms.
In the context of CHIS, reporting structures clearly define:
● The source document for reporting—that is, the individual client record
● The standardized, aggregate, periodic report for reporting to the next level
● Reporting deadlines—the date reports of various types are due to the next level.
● Indicator calculation guidelines and compilation, and completing the forms
● Reporting Procedures for sending the data to the next level.
● Data quality review procedures
● Sanctions (if any) for failure to meet reporting obligations.
● Responsibilities of staff members to monitor reporting of performance and compliance, and
enforcement of these standards?
Master Facilities List
A master facilities list, in DHIS2, is a complete listing of all health service delivery sites in a country,
including CHIS reporting units, with information about capacity and services available. It is dynamic
and should be kept up to date as reporting units (CHWs) are added to or subtracted from the
system.
A master facilities list improves record keeping by improving transparency and reporting
efficiency. It minimizes duplicate reporting and promotes analysis and synthesis of data to improve
decision making and health system functioning.
Planning Structures
Planning is critical to ensure that CHIS resources are targeted efficiently and according to need, so
that maximal benefit is achieved from CHIS investments. Planning structures refers to mechanisms
for planning, such as periodic program reviews and needs assessments, combined with financial
reviews and budgeting. Setting targets and situational analyses are also aspects of regular planning.

154 | August 29, 2017 Version
Policies and Procedures for Data Management Governance
The management of CHIS data should be standardized such that the steps performed in turning
data into information are the same throughout the system—from one district or CHW to another.
These policies and procedures are an integral part of governance and should be well defined,
detailed, written down, and made accessible to all staff and other stakeholders in the data
management process. Processes should be supported by policies that are well known and enforced,
so that standards are applied uniformly across the system. The following are standards and best
practices for data management policies and procedures.
CHIS Regulatory Authority
For a CHIS to function effectively, all community role-players should routinely report, using
standard mechanisms, to the CHIS. Regulatory authority often takes the form of public institutions
empowered to regulate public health practice according to government imposed standards. This is
necessary to ensure complete reporting from all sources of health service delivery including CHWs.
However, the MOH often has no formal influence over CHWs to ensure reporting, other than the
regulatory authority provided through government.
To efficiently target resources for disease control and prevention, CHIS managers need to
understand where disease is occurring in the population and where services are being utilized.
Without accurate targeting based on complete, reliable data, resources can be wasted by sending
too much to areas that do not need it or too little to areas that do.
E- Health and Information and Communication Technology Policies
ICT governance is essential to ensure that there are rules and regulations guiding use of electronic
tools for managing and transmitting data and information, such as computers (hardware and
software), networks, tablets, personal data assistants (PDAs), flash media, and communication
tools, such as cell phones, modems, e-mail, instant messaging, and social networking.
A policy framework should be developed by the MOH to manage ICT resources in the system. What
resources to acquire, how they should be used and by whom, when they should be upgraded or
replaced, and how they are maintained should all be codified into the framework to ensure efficient
stewardship of CHIS resources.
Because CHIS personnel should not be expected to have knowledge of maintenance and repair of
ICT hardware and software, outside resources can be utilized. Reputable, licensed computer
hardware and software vendors and repair firms can be contracted to maintain the ICT resources in
the CHIS, reducing the burden on HMIS personnel and allowing them to focus on data collection,
analysis, and use for planning and management.

155 | August 29, 2017 Version
CHIS Data Governance Plan Based on Best International Practices
A CHIS governance plan refers to roles and processes that serve as a guideline for fulfilling,
sustaining, and extending CHIS planning. A governance plan crosses all organizational layers,
including stakeholders, administration, maintenance, strategy, policy, and support. [1]
A CHIS governance plan should clearly state who does what, when, and how with regard to CHIS
management, to management of data and information, and to decision making. A governance plan is
useful in times of transition or change in the CHIS, since it provides a reference tool to clarify roles
and settle disputes.
Data Standardization Policies, Framework, and Procedures
Most countries still lack policies that bring together the various components of CHIS under a single
unifying framework and provide clear lines of responsibility and functionality. CHIS management
structures should be strengthened centrally and resources and authority decentralized to serve the
specific needs of the people involved in implementing CHIS, particularly at the periphery.
The CHIS framework in both national health policies and strategic plans should encapsulate an
integrated CHIS as part of overall health systems strengthening and governance reform, with buy-in
to the plan from local government, political authorities, the MOH, and donors. The framework
should recommend the pooling of CHIS expertise and resources into “one plan, one framework and
one funding mechanism.”10
Countries also need a practical CHIS operational plan wherein all CHIS activities within the MOH
are centrally guided, with clear lines of decentralized responsibilities in the spirit of administrative,
financial, and operational decentralization toward districts.
As defined in the CHIS framework, institutionalized mechanisms should be developed for
integrated CHIS data quality assurance (as measured by its completeness, accuracy, timeliness, and
consistency), with validation rules for electronic systems and a team approach to data quality. In
addition, these policies should:
1. Specify interoperability of CHIS subsystems.
2. Define human resource needs and capacity strengthening requirements.
3. Define responsibilities for data collection, information flow, and use.
National policies should provide for a balanced, limited set of national CHIS indicators, which are
regularly reviewed in a participative manner, with clearly defined numerators and denominators,
data sources, baselines, and national targets. There should be a regular indicator review process in
which program and subnational managers participate to ensure that the existing indicator set
10 Paris Declaration on Aid effectiveness 2005

156 | August 29, 2017 Version
fulfills their needs.
Most countries have policies, laws, and regulations governing health services that, if applied, would
greatly improve health system functioning. Too often inadequate resources or a lack of incentives
mean that these policies are not enforced. Their implementation could be strengthened by the
application of SOPs.
Metadata stewardship
In CHIS, stewardship of metadata, or responsible planning and management of data about data, is
needed to foster consistent use of data management resources and facilitate data mapping among
computer systems. A data steward holds responsibility for maintaining a data element in a
metadata registry. Data stewardship roles are common when organizations need to exchange data
precisely and consistently among computer systems and to reuse data-related resources.
A data steward ensures that each assigned data element:
1. Has a clear and unambiguous definition.
2. Does not conflict with other data elements in the metadata registry.
3. Is being used and is being used consistently in all interlinked computer systems; unused
data elements are removed.
4. Has adequate documentation on appropriate usage and notes.
5. Is documented with regard to its origin and sources of authority.
Assignment of data elements to an individual promotes trust in systems where users can contact a
specific staff member with questions on specific data elements.
Data Quality Assessment and Auditing
CHIS data quality should be assessed periodically to enhance confidence in data and promote use of
the data for decision making. Data quality should be assessed routinely for high-priority indicators
as a part of regular supervision, and less often for other indicators. A periodic assessment of CHIS
performance should include a data quality assessment.
Data Standards
Governance refers to a process which outlines the process and mechanisms of how decisions are
taken. In the CHIS case, the governance decisions concern how and why new systems are
introduced, and their implications. As emphasized throughout this document, the CHIS is not a
standalone system, but is linked by standards with other data collection processes and systems
based on the six WHO building blocks.

157 | August 29, 2017 Version
Data standards are multifaceted in nature, involving both technical and semantic standards:
1. Technical (syntactic) standards such as data transfer protocols.
2. Semantic (nomenclature) aspects. Important semantic standards in the context of CHIS
include metadata stewardship issues such as :
a. Meta data naming conventions for data elements, indicators, organizational units,
shape files and others.
b. Reporting periods for different elements and the formats in which they are
reported, that enable ease of compilation of data for the CHW.
A universal governance problem is that donors and NGOs want to introduce their own parallel
community systems and data collection formats without being accountable to other standards and
systems in the community setting. This lack of governance adds to the workload of the CHWs since
all data collection work converges on them, and magnifies the fragmentation.
This situation is primarily due to the absence of a higher level mechanism for governance of data
and standards. A typical governance mechanism is the establishment of a steering committee at the
MoH level, and all proposals for the introduction of new systems should be approved by them. For
example, they should need ensure that the new system being proposed is feasible, how it overlaps
with other systems, what duplications are involved, the implications on data collection burden,
compliance with laid out standards, and whether the required outputs can be met through existing
systems. Such a systematic and thorough process of governance goes a long way to control
duplications and redundancies and reducing the work burden of the CHW. However this
governance needs to be enforced at lower levels, with responsibility and authority being given to
districts and facilities to prevent parallel systems proliferating.
These guiding principles generated a community driven framework of standards, as contrasted
with those which are typically imposed from the top with most often sub-optimal results. A
framework of standards which represent everyday work, and are bottom up driven are more likely
to add value and be accepted by the CHWs.
Standard Operating Procedures (SOPs)
SOPs are the translation of policies and procedures into day to day life of the CHIS stakeholders. All
stakeholders need their roles and responsibilities clearly defined in a set of SOPs that form part of
the organizational culture of the CHIS. SOPs should describe clearly who should do what, when, and
with what resources, to manage and maintain the CHIS.
There are many ways to define SOPs, and the actual SOPs vary tremendously from country to
country and project to project. The SOPs outlined below represent some very basic, practical SOPs
that could serve as the foundation for country or program specific SOPs.

158 | August 29, 2017 Version
Overview
There are three, basic SOPs outlined in this manual:
1. Reporting Guidelines in Chapter 4
2. Training protocol in the Chapter 5
3. Supervision protocol in Chapter 5
Figure 6.3: Standard operating procedures outlined in this manual.
SOP Best Practices 1. Harmonize multiple programs into a single protocol. This is especially true for the
data capture protocol described in this chapter and the training and supervision
protocols in the training chapter.
2. Develop SOPs for each individual community project especially if multiple data
flows exist from.
3. Turn the SOP into illustrated posters and have the facility staff post them on their
walls for public viewing.
4. Print SOPs and make sure all CHWs, facility staff, and district staff have copies
5. Stakeholders to sign the SOPs at the completion of training.
6. Stakeholder participation in the creation and approval of SOPs. The SOPs must
institutionalize the best practices and workflow of the actors in the CHIS. Include
representation from all relevant stakeholders in the process of developing SOPs.
7. Ensure all data elements and indicators are captured. The project should have an
159 | August 29, 2017 Version
M&E framework (see Chapter 3) that should clearly define all data elements and
indicators. The CHWs should clearly understand the meaning, and measurement of each
data element and indicator to remove ambiguity
8. Use data capture guidelines at trainings. To build accountability, CHWs and facility
staff need to know they are part of a larger system. They need to know how their data is
used for planning at higher levels and specific actions at lower levels.
9. Have the CHWs explain the data capture guidelines. This teach-back method is an
effective adult learning practice. By explaining the data capture guidelines, this elevates
the CHW’s credibility with the health committee.
10. Produce, simple-to-use, local language guidelines. CHWs and facility staff need
guides and instructions on what to do. Consider making posters or small laminated
portable data capture guidelines for CHWs and facilities to put on the wall or carry with
them that outline their role and responsibilities based upon the data capture guidelines.
11. Have CHWs, facility, district staff and national staff sign guidelines. This is a
symbolic “commitment” measure. The aim is that they have read it, understand their
reporting responsibilities as defined in the data capture guidelines, and will carry out
these responsibilities.
12. Produce simple videos or audio and upload them to phones. Responsibilities and
actions for every event are made easier with a simple, local-language videos or audio
guides that facility staff and CHWs can refer to.
CHIS Staffing and Workforce Planning and Development
People are the lifeblood of CHIS, and even the best system would generate no information products
without the combined efforts of all CHIS staff. An entire chapter of these guidelines are dedicated to
capacity development, but the topic outline is repeated here to reinforce its importance in CHIS
governance.
● Training needs to be carefully planned and costed, with the appropriate infrastructure,
equipment and curriculum, trained teachers
● CHIS staff must have the training they need to perform the tasks expected and to
produce the data and information necessary to monitor the community health system.
● Adequate numbers of staff is also necessary. A staff that is too small risks
underperformance, while a staff that is too large wastes precious CHIS resources.
● The staff and its training should be organized, efficient and of high quality.

160 | August 29, 2017 Version
● Certain standard elements of CHIS staffing and training help ensure high quality output
from the workforce while avoiding redundancy or wastage.
Components of CHIS planning and development that should be covered by this planning and
development process include
Training Infrastructure and
staff
● Costed training plan ● Standardized training curriculum/materials ● Equipped training institutions ● Adequate numbers of competent, trained trainers
Supportive Supervision and
Mentoring:
● Guidelines for standardized, effective supervision ● Standardized supervisory checklists ● Targeted feedback mechanisms ● Standardized supervision reports—tracking results
and monitoring trends ● Schedule of supervisory visits ● Data quality checks
Table 6. 5 Requirements for CHIS capacity development
161 | August 29, 2017 Version
Monitoring and Evaluation
Monitoring and evaluation (M&E) is the final, but crucial component of Data Governance and
concerns maintaining data quality and ensuring quality of the overall CHIS as well as regular
assessments of CHIS functionality. This is in addition to the standard programmatic M&E, which is
not covered here.
Maintaining CHIS Quality
CHIS quality is essential and the determinants are similar to those already described for
sustainability -technical, organizational, and behavioral factors that convert CHIS functions into the
key outputs in the form of quality data that is regularly used so as to improve health system
performance. (PRISM framework11)
Technical Determinants
These are the specialized know-how and technology to develop, manage, and improve CHIS
processes and performance. Affecting CHIS performance both directly and via behavioral factors,
they include: CHIS design, computer software, as well as the complexity of information technology,
reporting forms and procedures.
Organizational Determinants
These relate to organizational structure, resources, procedures, support services, and work
environment that promote a “culture of information”—the capacity and control to promote values
and beliefs within the organization by collecting, analyzing, and using information to achieve the
organization’s goal and mission. Organizational factors include: governance, planning, resource
availability, training and capacity development, supervision, finances, information distribution, and
the culture of information.
Behavioral Determinants
These include: the CHIS users’ demand for data, data quality checking skills, competence and
problem-solving skills for CHIS tasks, confidence levels in their ability to perform CHIS tasks, and
motivation to perform at peak ability. These behavioral factors are influenced by both technical and
organizational determinants (above).
Assessing CHIS Functionality
Assessment has been dealt extensively in Chapter 2 and is summarised here.
11 MEASURE Evaluation, “PRISM: Performance of Routine Information System Management Framework,” http://www.cpc.unc.edu/measure/tools/monitoring-evaluation-systems/prism.

162 | August 29, 2017 Version
A major test of the effectiveness of CHIS governance is regular participatory assessment to see
whether CHIS is improving health program outputs and health impacts. Yet, surprisingly, this
aspect of performance is rarely formally evaluated.
CHIS impacts on health programs can be measured by four simple questions:
● Is the information relevant?
● Is the information of good quality? (Is it timely, consistent, complete, and accurate?)
● Is the information presented in a user-friendly way? (Is it easy to access and easy to
interpret?)
● Is there capacity to act on the information provided?
The answers to these questions need to be approached in a way that addresses the health systems
framework and should be further elaborated by asking:
● Has the CHIS been decentralized, and have lower-level program managers contributed
to decision making?
● Have the systems been integrated and contributed to broader program integration?
● Has CHIS contributed to evidence-based decision making and more effective health
outcomes?
Assessment methods
Here we provide an overview of some of the popular methodologies to assess CHIS functionality,
including:
Decentralised Self-Assessment To strengthen data management, countries should institutionalize regular self-assessment data use
meetings, particularly at facility and district levels. Self-assessment should use local data to
calculate indicators in order to review performance against targets for client, facility, and system
indicators and to compare the results to those of similar institutions, other geographic areas, and
national norms. Self-assessment meetings should be conducted at least quarterly and should be
made part of routine SOPs for work and management procedures.
Health Metrics Network Assessment Framework This comprehensive assessment framework, considered the gold standard for HIS assessment, is
the basis for the Macro-assessment described in chapter 2. The HMN framework deals with the
holistic HIS (the CHIS being just one aspect) and is not discussed further here, but constitutes a
valuable tool for evaluating overall HIS functionality, in which CHIS plays a significant role.
The full HMN assessment asks stakeholders approximately 200 questions regarding all six HIS
components—HIS resources, indicators, data sources, data management, information products, and

163 | August 29, 2017 Version
data dissemination and use —and scores the answers electronically, producing a series of graphs
for each component.
The PRISM Framework The PRISM framework and toolkit takes a holistic approach to CHIS monitoring and evaluation,
seeking to assess system performance by investigating CHIS performance determinants (the
technical, organizational, and behavioral factors described above). Performance, as assessed by the
PRISM methodology, is measured by the level of data quality, the extent of data use for decision
making, and the management capacity.
PRISM assessments can be used to establish a baseline measurement of performance and can then
be repeated after interventions to gauge their effectiveness. PRISM tools can also be used for
routine monitoring of CHIS performance (such as conducting data quality checks as part of routine
supervision).
Conclusion
Many of the governance issues dealt with above are illustrated in a case study from Zambia in
which an NGO- initiated project transitioned to government ownership while achieving remarkable
results for community sanitation.

164 | August 29, 2017 Version
Case Study: Community Led Total Sanitation from Zambia
This case study describes the development of an information system for Water and sanitation for
Health (WASH) based on the DHIS2 platform. This system was built by Akros, an NGO, and were
engaged with the challenge of sustainability after successful implementation of the system. The case
illustrates the approach they adopted in transition the system from the NGO to the government in
their bid to establish sustainability. This case is thus unique in illustrating the challenges of
transitioning systems to establish robust government ownership.
In 2013, DFID funded a Water and Sanitation for Health (WASH) program in Zambia. Community
led total sanitation (CLTS) conducted by the Zambian Ministry of Local Government and Housing
(MLGH), UNICEF, and an implementing partner. In response to concerns of poor data reporting and
targets which were not being achieved, the team layered a unique mobile-to-web application
(M2W) using DHIS2, over traditional paper based CLTS data collection methods, resulting in an
innovative service delivery and monitoring system dubbed “CLTS M2W”. CLTS M2W uses mobile
feature phones, automated data feedback loops, and engagement of traditional leaders to provide
communities with the ability to clearly see their progress towards sanitation goals.
These tools require data collection at the community level by Sanitation Action Groups in each
village, data entry onto phone by community champions, and the management of this process by
local chiefs and at district level. CLTS M2W paved the way for unprecedented CLTS uptake in
Zambia, facilitating the creation of over 1,500,000 new users of sanitation over 18 months.
Government involvement and Ownership
The leadership of the Ministry of Local Government and Housing was critical from the beginning of
the project, but most important was the leadership of the local government in the districts and the
traditional leadership of chiefs in the villages, where the intervention was ongoing. When a CLTS
program is first introduced in a district, the intervention, technology, and supervision is initially led
by the implementing partners with the goal of ultimately transitioning ownership of the program
fully to the government. Though the initiation visits were led by the governments’ partners, the
following visits and all supervision visits were led by the district government officials with each
subsequent visit involving less outside partner involvement than the prior.
Focal Point Persons (FPP) are the local or national government employees who coordinate these
activities and channel knowledge and communication for programs in the field and at the district
level. To promote their ownership and engagement of the data, FPPs receive DHIS2 data analysis
training during supervision visits. Long term sustainability requires fully trained ministry staff and
community champions, who understand and can troubleshoot the system.

165 | August 29, 2017 Version
Capacity Development
Trainings were conducted by partner staff to district staff, who then trained community champions
(CCs) and Sanitation action groups (SAGs) in a training of trainers approach. There were different
trainings at every level of data collection and regular feedback to ensure that data collection tools
were properly used and understood.
● The Sanitation Action Groups required an understanding of the paper-based data
collection tools, what was being monitored and why;
● Community Champions needed to operate feature phones for data reporting,
understand the data being collected and the feedback loops they were receiving;
● Environmental Health Technicians (EHTs) required training to understand the mobile
platform and how to troubleshoot minor problems. EHTs and other government officials
also benefited from data use trainings.
District Water Sanitation and Hygiene Education (DWASHE) committees were created in districts
with staff from all government ministries to review sanitation progress at quarterly meetings. They
are trained in the use of DHIS2, using specially developed dashboards and other visualization tools
to enable them to inspect the sanitation state of the districts and make district WASH plans based
on these data.
Feedback to Stakeholders
Custom-developed reports with DHIS2 data are sent to partners monthly, giving an overview of
“open defecation free” (ODF) status, and reporting rates. There are several iterations of these html
based reports, designed to communicate the necessary information to the receivers.
● EHTs receive information on total reports received out of the total expected within their
assigned catchment area.
● UNICEF and MLGH receive reports on sanitation progress of each data element per
district.
These reports were designed to help EHTs target their activities based on which CCs need help
reporting, and respectively can help UNICEF and MLGH in resource allocation.
Involvement of chiefs
After a few months of monitoring data and not seeing a dramatic effect on latrine construction, a
program manager proposed incorporating the power of traditional leadership into the protocol
design of CLTS. A tablet-based chiefdom widget was designed to enable chiefs to view relevant
information without logging in to DHIS2 and requiring minimal mobile data to support. This
information is presented in charts, tables, and graphics, that exist on the home screen of the tablets.

166 | August 29, 2017 Version
Figure 6.5 (left): Snapshot of the Chief’s Visualization App active on a tablet home screen.
Figure 6.6 (right): Enlarged list of sanitation performance of individual villages of the chiefdom.
Armed with this information, chiefs could compare the performance of their villages to their
neighboring chiefdoms villages’ performance, combining the power of community behavior
changes, with the traditional authority chiefs must instigate that change. Following tablet
distribution came positive change in open defecation free status, as chiefs used their influence to
encourage their headman and villages to build more latrines (see figures 6.7 & 6.8).

167 | August 29, 2017 Version
Figure 6.7: Figure illustrating the influence and process of chiefdom orientation
Figure 6.8: Sanitation Uptake over Time. Ministry of Local Government Republic of Zambia Figure 6.8:
Sanitation Uptake over Time. Ministry of Local Government Republic of Zambia

168 | August 29, 2017 Version
CHIS Development
The development process benefited from a “boots-on-the-ground” approach at district level and
below in Zambia. This local understanding combined with DHIS2 skills enabled an agile
development approach that allowed for flexible platform creation and modification as needs and
priorities shifted. This flexibility allowed the data collection process to mature as needs developed.
As the program grew and donor interest expanded, data collection was able to expand to include
monitoring of water access, face washing and environmental cleanliness.
The paper tools themselves also changed: originally, paper sheets were printed on single-sided
documents and distributed to SAGs, but as the program grew, notebooks were printed for SAGs to
collect their monthly reports and share with the CC. The notebooks included helpful tools and
guides for implementing CLTS in their communities on the front and back cover and prevented the
loss of paper records.
One key example of agility that the development approach facilitated was the selection of the most
appropriate hardware for data collection. Smart phones were piloted in the first year, but were not
working well due to the low literacy level of the CCs and the added costs associated with more
expensive and fragile phones. The pilot approach allowed procurement and training strategies to
shift to use simpler feature phones, a more fitting option for the data collection tool.
The CHIS development strategy also relied heavily on the CHIS pillar that stressed balancing the
reporting burden. Pushing against the tendency to collect more, do more, and learn more is tough
work. As stakeholders learn of a successful program, they want to be involved. Keeping the
reporting burden of village SAGs and CCs light enables reporting incentives to remain low,
reporting rates high and training costs low. Nowhere was this more evident than in the roll out of
water access monitoring. Initial requests had CCs collecting an additional 12 new data elements. It
took months of negotiation, a pilot, and subsequent data collection revisions to keep the list of new
data elements reasonable.
Historically, a paper to Excel system was used for CLTS, requiring community facilitators to collect
and aggregate hand-written reports for each village Sanitation Action Group (SAG). Environmental
Health Technicians (EHTs) collected aggregated paper records from community facilitators and
reported to the district to enter Microsoft Excel. These Excel records were submitted to the central
level for manual aggregation into one master Excel file for data analysis. This process was error
prone, extremely slow, and only offered basic analytical functions.

169 | August 29, 2017 Version
Figure 6.9: Data flow of CLTS reports. Sanitation action groups (SAGs) in each village report data to
community champions (CCs). CCs submit data to the DHIS2 via mobile phones. EHTs oversee CC cadres.
The new system depicted above in Figure 3 was designed to maintain the paper-based village SAG
forms containing 14 data elements on latrine construction. Data burden was reduced by reporting
only data for a set of indicators developed with MLGH for performance of village-level sanitation.
CC’s were given mobile feature phones with a java app to report SAG data directly onto the DHIS2
database, minimizing reporting duplication.
SOP Development
Strong protocol development and implementation also helped move the program towards
sustainable success. These protocols (e.g. Supervision Visit Protocol, Surveillance Protocol, Event
Protocol, Exit Protocol, and Final SV Checklist) were developed together with MLGH, based on
improving existing practices and are the basis for activities that Surveillance Officers,
Environmental Health Technicians, and traditional leaders undergo for successful implementation.
A key protocol that ensured government engagement throughout all parts of the reporting process
was the Event Protocol. This protocol provides a foundation for government transition support as
well as structured approach to each necessary task that delineates for each event: who is
responsible, when it should occur, why it should occur, and what the goal of that event is. Within
the WASH program, these events are Community Mobilization, Mobile Surveillance Training, SAG
Data Collection, CC Data Collection, EHT Feedback, District Monitoring, ODF Verification, Quarterly
Ward Meetings, and Quarterly DWASHE Meetings.
Two examples are given in Figures 6.10 and 6.11:

170 | August 29, 2017 Version
Community Mobilization
Responsible Person
Chief and/or Senior Headmen
Periodicity Ongoing
Purpose To continue building village-level awareness of and support for community-led total sanitation
Outcome Continued propagation of improved latrines
CLTS community mobilization includes any event that involves a SAG, CC, EHT, Headman and/or Chief pushing the CLTS agenda at the village-level. On a monthly basis, the SAG mobilizes each household in the village, fills out the CLTS Data Collection Sheet while monitoring latrine propagation and conducting sensitization.
Figure 6.10: Table illustrating community mobilization.
ODF Verification
Responsible Person District CLTS Focal Point Person
Periodicity When a village claims ODF status
Purpose To verify if villages are open defecation free
Outcome Villages that claim ODF are verified to be ODF or not
This process helps maintain data quality. When the District CLTS FPP logs into DHIS, he/she will see a notification on the Dashboard for any villages that claim ODF status. The notification will indicate the name of the village and prompt the District CLTS FPP to mobilize the verification team to conduct a field visit to the village. It is the EHT’s responsibility to coordinate a verification team, acquire funds from the District Office and verify the village. After the verification visit, the EHT reports their findings through the DHIS2 mobile application’s ODF Verification Form. Once a village has been verified for 3 months, a team of District Officers then visits the village to conduct a spot-check certification. Districts are able to monitor ODF progression through DHIS2 visualization tools.
Figure 6.11: Table illustrating ODF verification.
These protocols strengthen operations, and streamline reporting by standardizing expectations for
all roles, and providing people with needed tools to meet these expectations.

171 | August 29, 2017 Version
Lessons learned
1. Government sustainability was fostered from the very inception of the program as
program implementers worked hand-in-hand with MLGH at all levels of the hierarchy.
Surveillance visits always incorporated local government staff.
2. Visualization of data by key ‘change agents’, in this case local chiefs and traditional
leaders creates ownership and motivation. These change agents were provided a means
to understand the performance of their villages in relation to sanitation practices and
not only had the data, but the leadership authority to encourage village level
improvement.
3. Clear documentation through SOPs is essential for clear system functioning and
management of all parties.
4. Multi-ministerial collaboration is important. In this case, Ministry of Chiefs and
Traditional Affairs (MOCTA) and MLGH collaborated to ensure chiefs and traditional
leaders were engaged in sanitation at local level. This was a success.
A future goal is to better link data from MLGH with data from the Ministry of Health. Specifically,
MLGH data (CLTS intervention data) is currently captured within an instance of DHIS2, with health-
outcome data (e.g. diarrheal disease incidence) captured in a separate instance of DHIS2 (Ministry
of Health). By linking the two systems, it will be easier to understand the impact of the CLTS
program on health outcomes.

172 | August 29, 2017 Version
Case Study Liberia Community Based Information System
(CBIS)
The National Community Health policy and programs
In 2015, the national policy on Community Health Services was revised to fully reflect the community
health components of the National Health Plan. The Revised National Community Health Services Policy
aims to strengthen Liberia’s health system and health services that were lost due to the Ebola Virus
Disease (EVD) crisis, to provide health security by reducing risks due to epidemics and other health
threats’ to accelerate progress towards universal health coverage by improving access to safe and quality
health services and to narrow the equity gap for Liberia’s most vulnerable populations that live in the last
mile.
Community-based services are vital to the health and wellbeing of these communities. Additionally, the
recent Ebola epidemic in Liberia and across West Africa highlighted the critical role that communities
play in addressing their own health needs and changing their own health behaviors.
A key feature of this revised policy is the institution of a new cadre of Community Health Assistants
(CHAs), who are selected from and serve communities located more than a one-hour walk (more than
5km) from the nearest health facility. Through established criteria, CHAs are selected by their respective
communities to undergo an integrated and standardized CHA training. Upon successful completion of the
training, these individuals will be certified as CHAs. Throughout training and continuing after
certification, CHAs will be supervised to deliver an integrated and standardized service delivery
package—which includes curative, preventive, promotive, rehabilitative and palliative services as well as
epidemic surveillance services—to households in their communities.

173 | August 29, 2017 Version
Community Health Services Vision A coordinated national community health care system in which households have access to life-saving
services and are empowered to mitigate potential health risks.
Key figures in Liberia’s CHA program structure
Community The Community Health Committee (CHC) is elected by the community with guidance from the catchment Health Facility. The CHC is to oversee and assist in the selection of CHAs and provide administrative support for health activities in the community. The committee shall comprise of a total number of 5 - 9 elected members depending on the size of the community. Every attempt should be made that at least 30 % of the members are women The Health Facility Development Committee’s (HFDC) primary responsibility is to act as a
governing body for all CHCs in the facility catchment area. The CHSS, in consultation with the OIC,
shall serve as secretary to the HFDC. The HFDC is to meet monthly, providing a direct connection
between community members and the District Health Team (DHT)/County Health Team (CHT), as
well as local representatives and coordinating bodies of the Ministry of Internal Affairs
Community Health Assistant (CHA) CHAs is recruited by the community, trained and supervised the formal health system (Facility) to
deliver an integrated and standardized service delivery package, which includes preventive,
curative, promotive, rehabilitative and palliative services and epidemic surveillance to households
located more than a one-hour walk (>5km) from the nearest health facility. CHAs will be
responsible for recording information on individuals in each household during visits when
conducted and services are provided. These data are reported into an aggregated monthly service
report and sent to the facility at the end of each month.

174 | August 29, 2017 Version
Profile of CHAs
● Permanent resident in the community which s/he serves, between 18 and 50 years of age ● Involved in community project/s in the past, trustworthy and respected ● Able to read and write and to add, subtract and multiply ● A good mobilizer and communicator fluent in the village dialect
Community Health Services Supervisor (CHSS) Community Health Services Supervisor (CHSS) is a clinically trained professional assigned to the
health facility to supervise the CHAs. The CHSS shall provide field-based supervision to CHAs
working in remote catchment communities of the health facility. One CHSS shall supervise up to 10
CHAs and is responsible to manage the CBIS system and serve as first point of contact for CHAs at
facility level, provide leadership and clinical supervisions to CHAs, ensure logistics (forms,
commodities, etc.) and to aggregate data from the CHAs and submit to the relevant facility.
Officer in Charge (OIC) of the Facility The OIC is responsible for coordinating all health-related activities in all catchment communities
for each health facility. He/she is responsible to supervise the CHSS and provide feedbacks to health
facility development committee (HFDC) on which he/she serve as secretary.
Community Health Services Focal Point (CHFP) The Community Health Department of each CHT shall be responsible for integrating all community
health activities into their county operational plan. The Community Health Focal Person (CHFP),
assigned by the CHT, work under the supervision of the Community Health Department Director
(CHDD) to coordinate all community health activities in the county. He/she work with the District
Health Teams and facilities in the implementation of the community health programs.
The CBIS
During the Ebola epidemic it became clear that the fragmentation of the current health information system
made it impossible to have the “right information at the right time and in the right place”. Many HIS
subsystems were not interconnected, and stakeholders did not coordinate, contributing even further to the
fragmentation by setting up separate reporting systems. After the Ebola crisis, strengthening the National
Health Information System (HIS), and the Monitoring and Evaluation (M&E) system was recognized by
the Ministry of Health of Liberia as one of the key interventions of the Investment Plan.
In 2016 as the National Community Health Assistant (CHA) Program was created, the need for a CHIS
became apparent. With the support of development partners, the MoH developed a comprehensive
community-based information system (CBIS) as a subsystem within the HIS. These partners formed an
M&E sub-group, which informed the system and development of tools to capture information from the
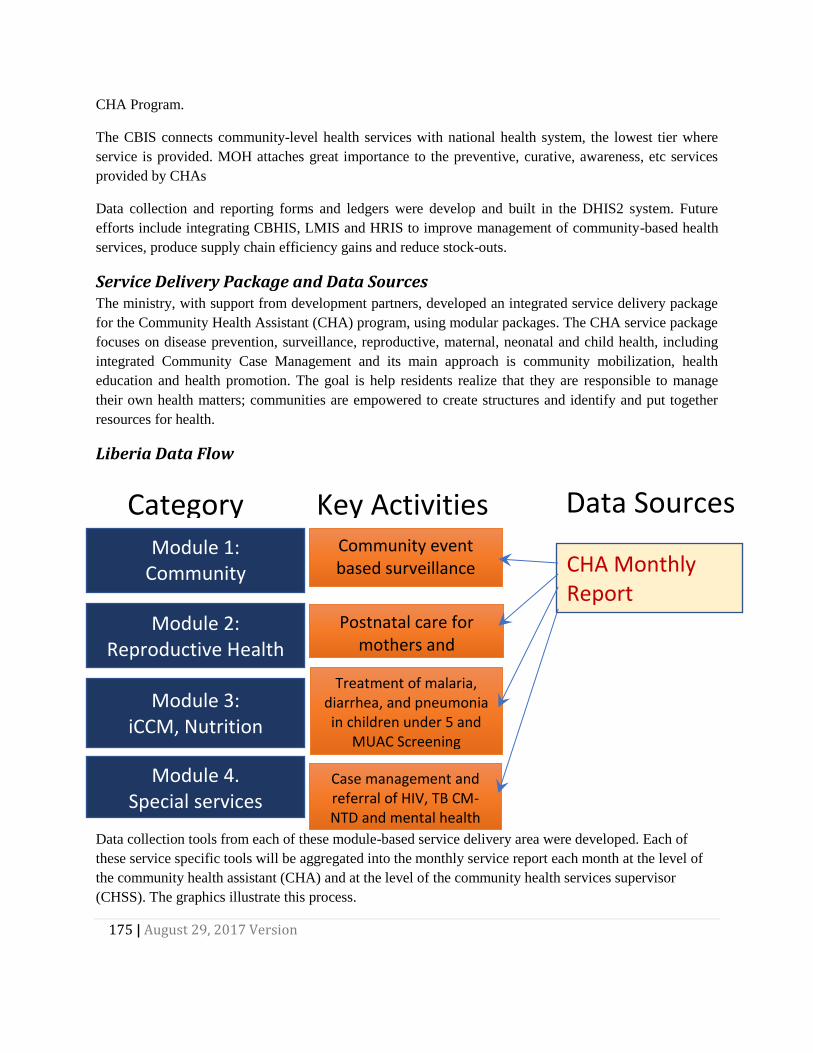
175 | August 29, 2017 Version
Module 4. Special services
Module 2: Reproductive Health
Module 3: iCCM, Nutrition
Module 1: Community engagement
Community event based surveillance
(CEBS)
Postnatal care for mothers and
newbornsTreatment of malaria,
diarrhea, and pneumonia in children under 5 and
MUAC Screening
Case management and referral of HIV, TB CM-NTD and mental health
Key Activities Category Data Sources
CHA Monthly Report
CHA Program.
The CBIS connects community-level health services with national health system, the lowest tier where
service is provided. MOH attaches great importance to the preventive, curative, awareness, etc services
provided by CHAs
Data collection and reporting forms and ledgers were develop and built in the DHIS2 system. Future
efforts include integrating CBHIS, LMIS and HRIS to improve management of community-based health
services, produce supply chain efficiency gains and reduce stock-outs.
Service Delivery Package and Data Sources The ministry, with support from development partners, developed an integrated service delivery package
for the Community Health Assistant (CHA) program, using modular packages. The CHA service package
focuses on disease prevention, surveillance, reproductive, maternal, neonatal and child health, including
integrated Community Case Management and its main approach is community mobilization, health
education and health promotion. The goal is help residents realize that they are responsible to manage
their own health matters; communities are empowered to create structures and identify and put together
resources for health.
Liberia Data Flow
Data collection tools from each of these module-based service delivery area were developed. Each of
these service specific tools will be aggregated into the monthly service report each month at the level of
the community health assistant (CHA) and at the level of the community health services supervisor
(CHSS). The graphics illustrate this process.

176 | August 29, 2017 Version
Reporting Timeline
Data Use
CBIS was designed as a streamlined flexible system to allow for decentralized data entry and local
use.
Data Use at the CHA level Data forms (ledgers) are kept in the community once completed, to keep an accurate record in the
community of the work of the CHA. The CHA aggregates the ledgers into the CHA Monthly Service
Report. This report is per community catchment area and can be entered into DHIS-2 to show
indicators at the community level. For example, The CHA Monthly Service Report can be used in
DHIS-2 to show a spike in the incidents of malaria in children under five in a given catchment area.
Data Use at the CHSS (facility) level Each CHSS is responsible for analyzing CHA Forms to make informed decisions and targeted
remedial supervision based on findings. For example: if the number of patients treated for malaria
is much lower than the number of patients treated for malaria, the CHSS can coach the CHA on the
value of routine visits and community education on malaria. Or if the number of home births is high
compared to number of facility births the CHSS can coach the CHA to encourage facility delivery.
The CHSS Monthly Service Report shows the aggregated indicators across all the CHAs, aggregated
at the Health Facility level. They use this data to see the status of the communities around health
facilities. For example, any maternal death in a CHSS catchment area is investigated.

177 | August 29, 2017 Version
Data Use at County level The M&E Officer is responsible for providing information to various line managers, program
supervisors and other stakeholders in the county. CBIS data should be analyzed and used in
coordination and other management meetings. For example, the M&E Officer can provide data or
help the stakeholders understand the data for the CHA program such as high numbers of diarrhea
in certain facilities.
Data Use at Central level The Central Level CBIS builds the capacity of the County Teams, training county level M&E staff
how to create and run reports. He / She analyzes the data to troubleshoot and strategize for the
programs. The data and reports should be accessible to the Ministry of Health and partners to use
for decision making at all levels of the health system.
[1] Technopedia, “Governance Plan,” http://www.techopedia.com/definition/2910/governance-plan.
[2] “Paris Declaration on Aid Effectiveness: Ownership Harmonization, Alignment, Results and Mutual
Accountability,” in The Paris Declaration on Aid Effectiveness and the Accra Agenda for Action (Paris:
Organization for Economic Co-operation and Development, n.d.), 4–13,
http://www.oecd.org/dac/effectiveness/34428351.pdf.

178 | August 29, 2017 Version
Appendices
Assessment at the macro level: using the CHIS assessment tool
A short example can be used to highlight how the assessment tool can be used for assessing the
macro, policy level.
A country is in the process of examining its community health services, and in that regards wants to
assess the strengths and weaknesses of the overall CHIS before planning specific interventions. The
first step they take is to form a steering committee that will oversee the assessment and analyse the
results. The steering committee conducts a stakeholder identification exercise to see who should
take part in the assessment, and aiming for a rather small group due to logistical reasons, the
identify the following.
A community health worker and a representative from a community health committee are selected
to bring in the viewpoint of the community itself. They are selected since they have experience with
how the data collection and feedback is working between the CHW and the facilities to which they
report, and how the CHW interacts with the community at large.
An information officer from a facility is included since this person handles the flow of data between
the CHWs and the wider health management information systems, as well as having knowledge of
the facilities’ challenges with medical stock distribution.
Each district has a Community Health program officer, and the participation of one of them is
secured to get the input from this level. This person will, in addition to managing the community
health services in the district, also liaise between the CHWs and the other health program managers
that are based in the district headquarters, so this is considered adequate participation from the
district level.
From the national level, the head of the community health programme, as well as the IT technician,
is joining. Finally, a representative from a large international NGO, who are supporting the CHWs in
some of the districts, is invited.
Conducting the assessment The steering committee, consisting of staff at the community health programme, then invites the
identified stakeholders to a one-day workshop in the capital. Due to logistical challenges, the
community, facility, and district representatives are selected from the same district, though the
group would ideally bring in representatives from at least two districts. However, the NGO agrees
to invite one more CHW from another district as they are piloting new processes around CHW
reporting there.
The group goes through the tool question by question in plenary, since they are not so many. This is
also a chance for those who are familiar with the issue in question to inform the others on the team.

179 | August 29, 2017 Version
An example of how they answered one of the questions now follows:
The group is discussing the question: Do traditional health providers report through the CHIS?
The scoring scheme for this question is:
Highly adequate Adequate Present but not
adequate
Not adequate at
all
Items 3 2 1 0
Do traditional health
providers report
through the CHIS?
Yes, all traditional
health providers
working at the
community level
report their activities
to the national CHIS.
Most traditional
health providers
working at the
community level
report their
activities to the
national CHIS.
Some traditional
health providers
working at the
community level
report their activities
to the national
CHIS.
Traditional health
providers are not
part of the CHIS.
First, the head of the community health program informs the team that, no, this is not taking place.
They have tried to incorporate data from traditional birth attendants (TBA) in the CHW reporting,
but due to the lack of formalized acknowledgment and collaboration, the TBAs see little incentive in
reporting neither to the CHWs or the facilities. This is something they would consider, but for now
they would need to give this question a score of 0.
However, both the attending CHWs can then attest to that, sometimes, they do collect data from the
TBAs. They know at least one TBA themselves, who is based in one of the villages they serve. They
have a good relationship, and sometimes communicate with the TBA to confirm a visit there since
there is no community health committee in this particular village. When they so do, they can inform
that they get relevant data on the TBA activities, and include in their reporting if this is appropriate.
However, one of the CHWs says that this is included, and thus part of, her report, while the other
says she is adding it on the side of the paper as performed by the TBA.
The team then decides that a score of 1 is appropriate for this question, but make a note in the
scoring sheet that how this TBA reporting is done varies and is not standardized at all.
Interpreting the results And so they go through the questions of the assessment tools. In the end, they have a list of scores
for all the questions, as well as a number of notes clarifying certain issues. The scoring will itself
highlight the strengths and weaknesses of the CHIS, but the steering committee is then charged
with further analyzing the data and deciding on the priorities. For instance, since they don’t have
electronic reporting from CHWs, they realize an improvement in score on automatic reminders

180 | August 29, 2017 Version
when reporting is slow is far away. So even if they set the score to 0 here, this is not seen as a major
weakness that needs to be addressed at the present moment.
A report with the findings and such interpretations of the results is then shared with the team who
conducted the assessment, to get feedback. They decide to use a three-level prioritization scheme
(high, medium, low priority) for all of the questions, and present it at the next executive meeting for
all health programs, as well as sharing it with health partners.

181 | August 29, 2017 Version
CHIS Assessment Tool
Highly
adequate
Adequate Present but not
adequate
Not adequate
at all
Score
Comments
Themes Items 3 2 1 0
Governm
ent
ownershi
p
1
Is there an
established CHIS
Technical Working
Group (TWG) lead
my ministry senior
staff and including
representation from
key stakeholder
groups?
Yes, There is a
CHIS TWG with
clear leadership
and active
participation
from all key
stakeholders
that manages
the
development,
implementation,
and
sustainability of
the CHIS
Yes, There is a
CHIS TWG with
clear leadership
and active
participation
from most key
stakeholder
organizations
Yes, there is a
CHIS technical
working group
but it does not
have clear
leadership or it
is not able to
manage all
CHIS
development,
implementation,
and
sustainability.
There is not a
CHIS technical
working group
or it is inactive.
2
Is there a long-term
sustainability plan
for the CHIS?
Yes, a
government
approved CHIS
policy document
and committed
resources exist
for government
ownership of the
CHIS which is
widely
distributed and
adhered to.
Yes, a CHIS
policy document
and committed
resources for
government
ownership of the
CHIS exist, but
is not widely
distributed and
not always
adhered to.
Yes, a CHIS
policy document
and committed
resources for
government
ownership of the
CHIS exist, but
is not widely
distributed and
seldom adhered
to.
No plan for
government
ownership of the
CHIS exists.
3
Is there an annual
budget for
supporting the
CHIS?
Yes, an
adequate
budget exists.
Yes, budget
exists but only
just sufficient
No the annual
budget is not
sufficient.
No budget
exists.

182 | August 29, 2017 Version
4
Is there a project
budget to develop
and launch the
CHIS?
Yes, an
adequate
budget exists.
Yes, budget
exists but only
just sufficient
No the annual
budget is not
sufficient.
No budget
exists.
5
Is there a project
budget for support
and supervision?
Yes, an
adequate
budget exists.
Yes, budget
exists but only
just sufficient
No the annual
budget is not
sufficient.
No budget
exists.
6
Is there a project
budget for training?
Yes, an
adequate
budget exists.
Yes, budget
exists but only
just sufficient
No the annual
budget is not
sufficient.
No budget
exists.
7
Are technical skills
and hosting
facilities available
within the country?
Technical skills
and hosting
facilities for a
fully electronic
CHIS, for both
aggregate and
patient-level
data, exist in the
country.
Only hosting
facilities for a
fully electronic
CHIS,
necessary for
both aggregate
and patient-level
data, exist in the
country.
Technical skills
are not
available.
Only hosting
facilities suitable
for a backup
server for a fully
electronic CHIS
exist in the
country.
Technical skills
are not
available.
All CHIS
development
and
maintenance
has to be
carried out by
external
consultants.
8
Is there a country
e-Health policy for
transmission and
storage of
community health
data?
Yes, Policy
exists covering
all aspects of
CHIS legality,
confidentiality,
and privacy.
Yes, policy
covers most
CHIS aspects of
legality,
confidentiality,
and privacy.
Yes, but
inadequate
CHIS policy
covering some
aspects of
legality,
confidentiality,
and privacy.
No e-Health
policy exists for
CHIS
9
Are roles and
responsibilities of
all community HIS
stakeholders
clearly defined?
All (100%) CHIS
stakeholders
have been
identified,
together with
their roles and
responsibilities.
Most (50-75%)
CHIS
stakeholders
have been
identified,
together with
their roles and
responsibilities.
Some (<50%)
CHIS
stakeholders
have been
identified,
together with
their roles and
responsibilities.
No overview of
CHIS
stakeholders
exists.

183 | August 29, 2017 Version
Communi
ty
engagem
ent
Highly
adequate
Adequate Present but not
adequate
Not adequate
at all
Score
Comments
10
Are relevant
stakeholders from
civil society
involved in the
development and
use of the CHIS?
Stakeholders
from civil society
are regularly
consulted on
CHIS-related
activities.
Stakeholders
from civil society
are sometimes
consulted on
CHIS-related
activities.
Stakeholders
were consulted
on CHIS-related
activities at the
beginning of the
project but have
not been
consulted since.
Civil society is
not involved in
any CHIS
activities or
decisions.
11
Are relevant
stakeholder from
civil society,
traditional
structures, and
community change
agents receiving
targeted, actionable
data feedback
mechanisms?
Yes, All
stakeholders,
traditional
leaders, and
community
change agents
receive specific,
actionable data
feedback that
prompts
community
engagement
and ownership
of community
health outcomes
Only some
stakeholders,
traditional
leaders, and
community
change agents
receive specific,
actionable data
feedback
mechanisms.
Some
stakeholders,
traditional
leaders, and
community
change agents
receive data
feedback
mechanisms but
these are not
specific or
actionable.
There are no
feedback
mechanisms
sent to
community level
stakeholders,
traditional
leaders, or
community
change agents
12
Are traditional
structures and
bodies, such as
chiefs, engaged in
the development
and use of the
CHIS?
Yes, traditional
structures are
regularly
consulted on
CHIS-related
activities.
Traditional
structures are
sometimes
consulted on
CHIS-related
activities.
Traditional
structures were
consulted on
CHIS-related
activities at the
beginning of the
project but have
not been
consulted since.
Traditional
structures and
bodies are not
involved in any
CHIS activities
or decisions.
13
Do traditional
health providers
report through the
CHIS?
Yes, all traditional
health providers
working at the
community level
report their
activities to the
national CHIS.
Most traditional
health providers
working at the
community level
report their
activities to the
national CHIS.
Some traditional
health providers
working at the
community level
report their
activities to the
national CHIS.
Traditional
health providers
are not part of
the CHIS.

184 | August 29, 2017 Version
14
Is there a public
webpage with
relevant indicators
on community
health?
Yes, a public
webpage
displaying
relevant and up-
to-date
indicators
exists. All
stakeholders
are aware of it
and have
access to it.
Yes, a public
webpage
displaying some
relevant and up-
to-date
indicators
exists. Most
stakeholders
are aware of it
and have
access to it.
Yes, a public
webpage
displaying a few
relevant, but not
up-to-date
indicators
exists. Few
stakeholders
are aware of or
have access to
it.
No information
is available for
any community
member beyond
the CHW.

185 | August 29, 2017 Version
Reporting
structure
Highly
adequate
Adequate Present but not
adequate
Not adequate
at all
Score
Comments
15
Is CHW reporting
integrated in one
system, linked to
national HMIS?
All CHW
reporting is
integrated in
one system,
linked to
national HMIS
All CHW
reporting is
integrated in
one system, but
not linked to
national HMIS
CHW reporting
is standardized
but fragmented,
using different
forms or ICT
tools
CHW reporting
does not follow
any standard
tools
16
Is data from all
community health
activities available
in one system?
All data is
available in one
system. All
stakeholders
have adequate
access
All data is
available in one
system, but not
all stakeholders
have adequate
access to it.
Data is spread
across different
systems.
Stakeholders
only have
access to some
systems.
Data from
various
programs are
not easily
available to
stakeholders.
17
Is there a list of
essential
community
indicators
available?
An essential list
is available, and
community
reporting is
done only on
these indicators.
An essential list
is available, but
community
reporting also
covers other
data.
A list is
available but is
not used to
define reporting
requirements.
No list available.
18
Are improvised
data capturing tools
(such as registers,
tally sheets,
reports) used?
No, all reporting
takes place
through
standard reports
and channels.
Standardized
reporting tools
exist, but are
not alway
available,
forcing CHW to
create their own
Some program
datasets have
standard
reporting tools
while others do
not
Most data that is
reported is done
so with
improvised
tools.
19
Is all data on
community health
activities reported
on time?
Yes, all data is
completely
reported, on
time, and to the
next level.
At least 90% of
data reports are
sent, of which at
least 90% are
on time.
Less than 90%
of data is
reported, and
timeliness is
below 90%
Reporting
and/or
timeliness is
below 70%.
20
What is the burden
of data collection
and reporting?
A CHW spends
30 minutes or
less on monthly
reporting.
A CHW spends
30 minutes to 1
hour on monthly
reporting
A CHW spends
1 to 3 hours per
month on
reporting
Time spent
reporting data
slows down
CHW from
providing care
services.

186 | August 29, 2017 Version
21
Is there a
sustainable
incentive structure
for a CHW?
A sustainable
incentive
structure exists,
is followed, and
has long-term
financial
support.
An incentive
structure exists,
is followed, but
does not have
long-term
financial support
An incentive
structure exists,
but is
infrequently
followed, and
does not have
long-term
financial support
No incentive
structure is
available.
22
Do CHWs get
automatic
reminders when
reporting is late or
lacking?
CHW gets
automatic
reminders when
reporting is late
or lacking.
CHW receives
automated
reminders when
a report is due,
but no
reminders when
a report is late
or lacking
CHW receives
manual
reminders when
a report is due
or when a report
is late of lacking
No reminders
are used.
23
Are there automatic
tools or procedures
available to ensure
high data quality
before reporting ?
There are
automatic
features in the
reporting tool to
help identify
data quality
issues when
reporting.
There are
manual
procedures to
identify data
quality issues in
the reporting
process. They
are followed.
There are
manual
procedures
available to
identify data
quality issues
within the
reporting
process , but
they are
infrequently
used.
There are no
data quality
procedures
available for the
data reporting
process .
24
Are phones,
reliable electricity
and network
coverage, available
for CHWs
reporting?
All CHWs have
phones for
reporting, and
coverage and
electricity is
reliable for all
communities,
either for SMS
or through
mobile internet
reporting
All CHWs have
phones for
reporting.
Coverage and
electricity are
not reliable but
are sufficient for
all communities
Not all CHWs
have phones for
reporting.
Coverage and
electricity are
not reliable but
are sufficient for
all communities
Not all CHWs
have phones for
reporting.
Coverage and
electricity are
not sufficient for
all communities
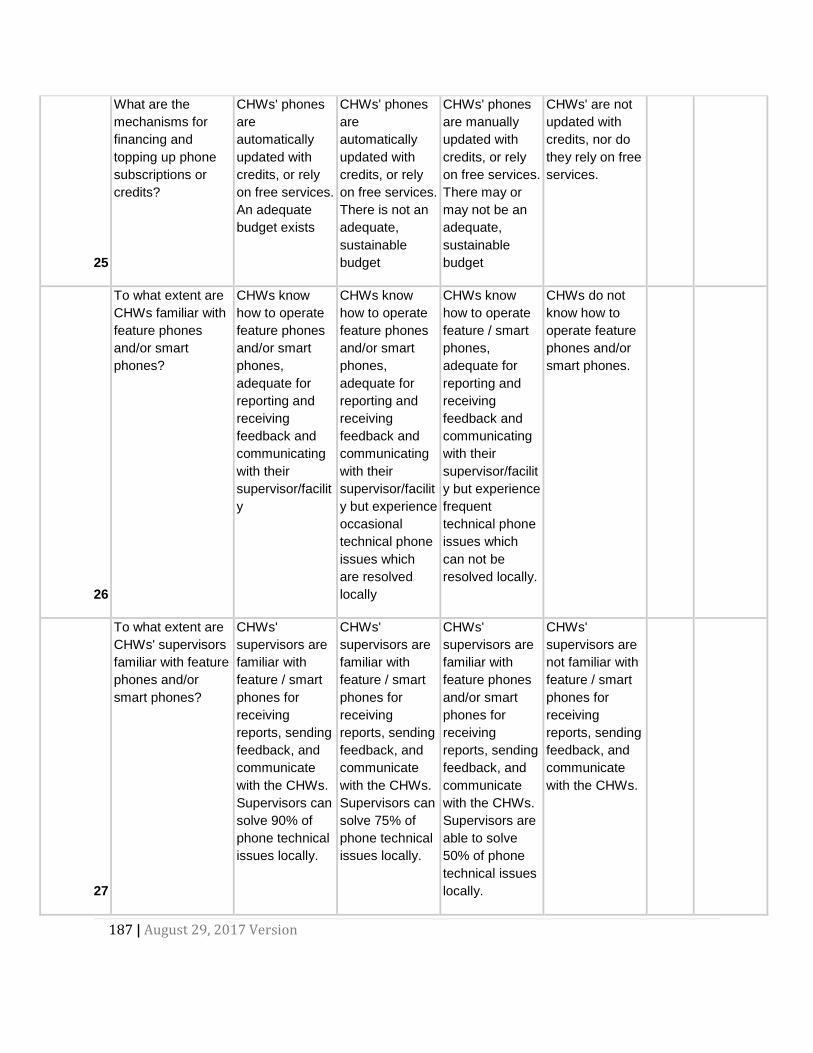
187 | August 29, 2017 Version
25
What are the
mechanisms for
financing and
topping up phone
subscriptions or
credits?
CHWs' phones
are
automatically
updated with
credits, or rely
on free services.
An adequate
budget exists
CHWs' phones
are
automatically
updated with
credits, or rely
on free services.
There is not an
adequate,
sustainable
budget
CHWs' phones
are manually
updated with
credits, or rely
on free services.
There may or
may not be an
adequate,
sustainable
budget
CHWs' are not
updated with
credits, nor do
they rely on free
services.
26
To what extent are
CHWs familiar with
feature phones
and/or smart
phones?
CHWs know
how to operate
feature phones
and/or smart
phones,
adequate for
reporting and
receiving
feedback and
communicating
with their
supervisor/facilit
y
CHWs know
how to operate
feature phones
and/or smart
phones,
adequate for
reporting and
receiving
feedback and
communicating
with their
supervisor/facilit
y but experience
occasional
technical phone
issues which
are resolved
locally
CHWs know
how to operate
feature / smart
phones,
adequate for
reporting and
receiving
feedback and
communicating
with their
supervisor/facilit
y but experience
frequent
technical phone
issues which
can not be
resolved locally.
CHWs do not
know how to
operate feature
phones and/or
smart phones.
27
To what extent are
CHWs' supervisors
familiar with feature
phones and/or
smart phones?
CHWs'
supervisors are
familiar with
feature / smart
phones for
receiving
reports, sending
feedback, and
communicate
with the CHWs.
Supervisors can
solve 90% of
phone technical
issues locally.
CHWs'
supervisors are
familiar with
feature / smart
phones for
receiving
reports, sending
feedback, and
communicate
with the CHWs.
Supervisors can
solve 75% of
phone technical
issues locally.
CHWs'
supervisors are
familiar with
feature phones
and/or smart
phones for
receiving
reports, sending
feedback, and
communicate
with the CHWs.
Supervisors are
able to solve
50% of phone
technical issues
locally.
CHWs'
supervisors are
not familiar with
feature / smart
phones for
receiving
reports, sending
feedback, and
communicate
with the CHWs.
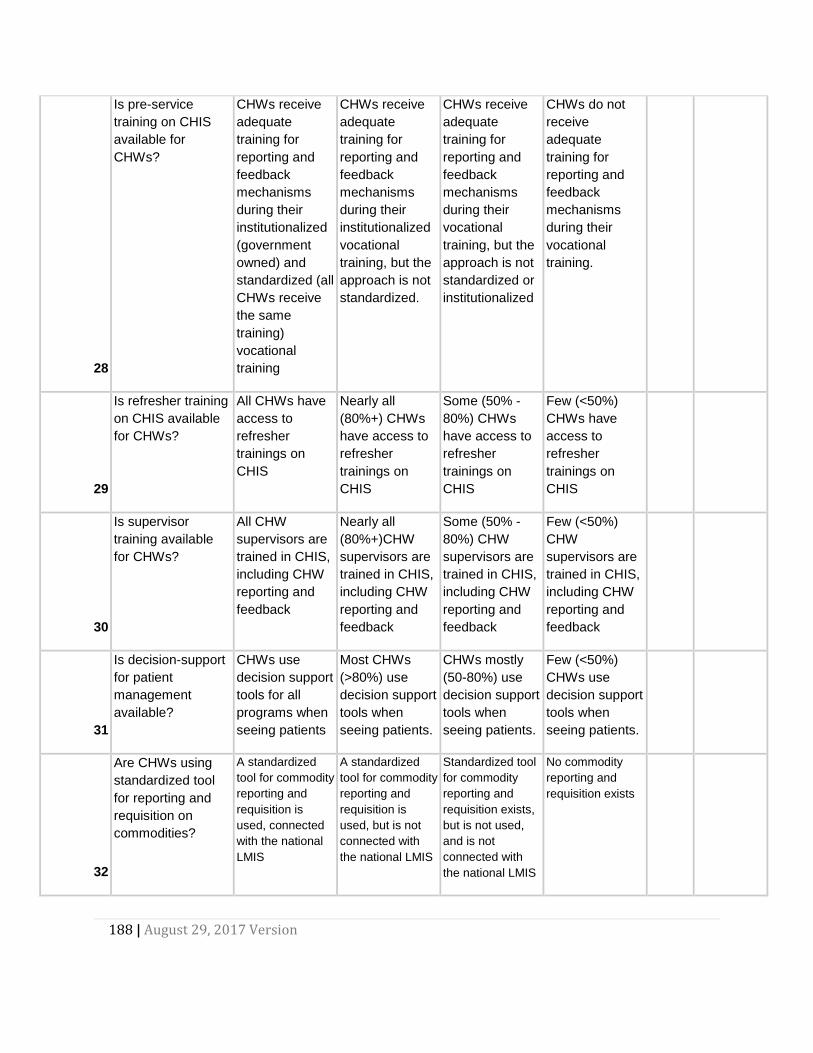
188 | August 29, 2017 Version
28
Is pre-service
training on CHIS
available for
CHWs?
CHWs receive
adequate
training for
reporting and
feedback
mechanisms
during their
institutionalized
(government
owned) and
standardized (all
CHWs receive
the same
training)
vocational
training
CHWs receive
adequate
training for
reporting and
feedback
mechanisms
during their
institutionalized
vocational
training, but the
approach is not
standardized.
CHWs receive
adequate
training for
reporting and
feedback
mechanisms
during their
vocational
training, but the
approach is not
standardized or
institutionalized
CHWs do not
receive
adequate
training for
reporting and
feedback
mechanisms
during their
vocational
training.
29
Is refresher training
on CHIS available
for CHWs?
All CHWs have
access to
refresher
trainings on
CHIS
Nearly all
(80%+) CHWs
have access to
refresher
trainings on
CHIS
Some (50% -
80%) CHWs
have access to
refresher
trainings on
CHIS
Few (<50%)
CHWs have
access to
refresher
trainings on
CHIS
30
Is supervisor
training available
for CHWs?
All CHW
supervisors are
trained in CHIS,
including CHW
reporting and
feedback
Nearly all
(80%+)CHW
supervisors are
trained in CHIS,
including CHW
reporting and
feedback
Some (50% -
80%) CHW
supervisors are
trained in CHIS,
including CHW
reporting and
feedback
Few (<50%)
CHW
supervisors are
trained in CHIS,
including CHW
reporting and
feedback
31
Is decision-support
for patient
management
available?
CHWs use
decision support
tools for all
programs when
seeing patients
Most CHWs
(>80%) use
decision support
tools when
seeing patients.
CHWs mostly
(50-80%) use
decision support
tools when
seeing patients.
Few (<50%)
CHWs use
decision support
tools when
seeing patients.
32
Are CHWs using
standardized tool
for reporting and
requisition on
commodities?
A standardized
tool for commodity
reporting and
requisition is
used, connected
with the national
LMIS
A standardized
tool for commodity
reporting and
requisition is
used, but is not
connected with
the national LMIS
Standardized tool
for commodity
reporting and
requisition exists,
but is not used,
and is not
connected with
the national LMIS
No commodity
reporting and
requisition exists

189 | August 29, 2017 Version
Standard
operating
procedure
s (SOP)
Highly
adequate
Adequate Present but not
adequate
Not adequate
at all
Score
Comments
33
Are SOPs for
community
reporting available?
SOPs for
community
reporting are
available, up to
date, and
followed.
SOPs for
community
reporting are
available, but
are out of date
or not fully
adhered to.
SOP is available
but isn't used.
No SOP
available.
34
Are there SOPs for
community
Monitoring and
Evaluation (M&E)
available?
SOP for
community M&E
is available, is
up to date, and
is followed
SOP for
community M&E
is available but
is out of data or
not fully
adhered to
SOP for
community
Monitoring and
Evaluation
(M&E) is
available but is
not used.
No SOP
available.
35
Are there SOPs for
making action
plans at community
level available?
SOPs exist and
are followed by
CHW,
community
stakeholders,
and their
supervisors
SOPs exist and
are mostly
followed by
CHW,
community
stakeholders,
and their
supervisors
SOPs exist but
are seldom
followed by
CHW,
community
stakeholders,
and their
supervisors
No SOP
available.
36
Are there SOPs for
making action
plans at facility and
district level for
community
intervention
available?
SOPs exist and
are followed by
CHW program
managers at
facility and/or
district level.
SOPs exist and
are mostly
always followed
by CHW
program
managers at
facility and/or
district level.
SOPs exist but
are seldom
followed by
CHW program
managers at
facility and/or
district level.
No SOP
available.

190 | August 29, 2017 Version
37
Are there SOPs for
data quality
assurance, with
clear
responsibilities and
procedures for
handling data
quality issues?
SOPs exist and
are followed for
data quality
assurance at all
levels, outlining
responsibilities
and procedures
for handling
data quality
issues
SOPs exist and
are mostly
followed for data
quality
assurance at all
levels, outlining
responsibilities
and procedures
for handling
data quality
issues
SOPs exist and
are seldom
followed for data
quality
assurance at all
levels, outlining
responsibilities
and procedures
for handling
data quality
issues
No SOP
available.
38
Are there SOPs for
sharing of data
among
stakeholders?
SOP exists
outlining
information
needs of
stakeholders
and how they
will access it
SOP exists
outlining
information
needs of some
stakeholders
and how they
will access it
SOP exists
outlining
information
needs of most
stakeholders
and how they
will access it
No SOP
available.
39
Are there SOPs for
managing users
and stakeholder
access to the
CHIS?
SOPs in place
and mostly
adhered to for
managing CHIS
user access,
including
CHWs, civil
society, and
other
stakeholders
SOP is in place
and is seldom
adhered to for
managing all
CHIS user
access,
including
CHWs, civil
society, and
other
stakeholders
SOP is in place
and is adhered
to for managing
all CHIS user
access,
including
CHWs, civil
society, and
other
stakeholders
No SOP
available.
40
Are there SOPs for
commodity
reporting and
requisitioning
available to CHWs?
SOP is
available, is
followed, and is
tied to the
national
Logistics
Management
Information
System (LMIS)
and the National
Supply Chain.
SOPs available,
mostly followed,
and tied to the
national
Logistics
Management
Information
System (LMIS)
and the National
Supply Chain.
SOPs available,
but seldom
followed, tied to
the national
Logistics
Management
Information
System (LMIS)
and the National
Supply Chain.
No SOP
available.

191 | August 29, 2017 Version
System
design
and
developm
ent
Highly
adequate
Adequate Present but not
adequate
Not adequate
at all
Score
Comments
41
Is sufficient
capacity available
for maintaining and
developing the
CHIS?
A core,
permanent
CHIS technical
support team
with adequate
capacity on
information
system design,
software
solutions and
customization,
and training is in
place
A core,
permanent
CHIS technical
support team is
in place but has
limited capacity
on information
system design,
software
solutions and
customization,
and training
A core CHIS
technical
support team is
in place, but
does not have
necessary skills,
permanent
positions or
funding
There is not a
core CHIS
technical
support team.
42
There is a SOP for
conducting routine
CHIS functionality
audits to identify
additionally needed
features.
A SOP for
routine CHIS
functionality
audits is in
place and
followed.
Finding are
translated into
new system
features.
A SOP for
routine CHIS
functionality
audits is in
place and
followed.
Finding are very
often translated
into new system
features.
A SOP for
routine CHIS
functionality
audits is in
place and
followed.
Finding are
rarely translated
into new system
features.
No SOP for
routine CHIS
functionality
audits is in
place or it is
never followed.
43
A multi-tiered
technical support
system exists that
is able to capture,
catalogue, and
resolve user issues
and system bugs.
All users are
able to report
issues and bugs
which are
resolved in a
timely manner.
Users are able
to track the
status of their
issues at any
given time.
All users are
able to report
issues and bugs
which are
resolved in a
timely manner.
Users are not
able to track the
status of their
issues.
All users are
able to report
issues and bugs
which are not
resolved in a
timely manner.
Users are not
able to track the
status of their
issues.
All users are not
able to report
issues and
bugs.
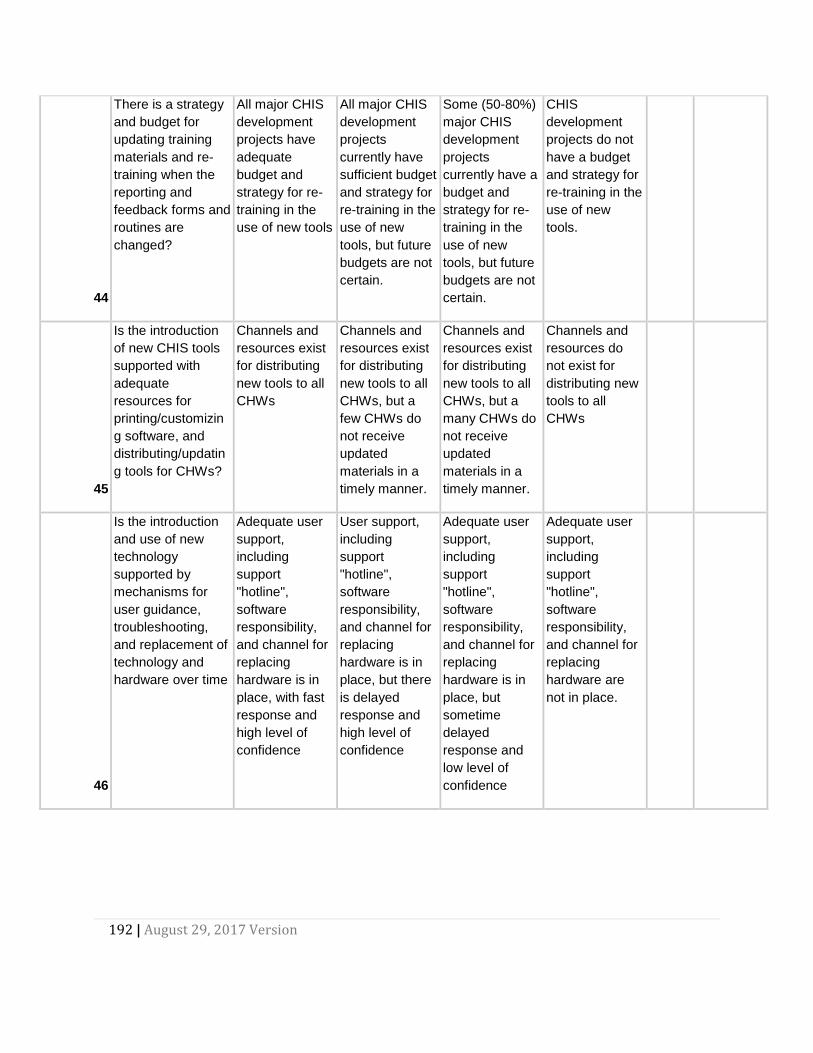
192 | August 29, 2017 Version
44
There is a strategy
and budget for
updating training
materials and re-
training when the
reporting and
feedback forms and
routines are
changed?
All major CHIS
development
projects have
adequate
budget and
strategy for re-
training in the
use of new tools
All major CHIS
development
projects
currently have
sufficient budget
and strategy for
re-training in the
use of new
tools, but future
budgets are not
certain.
Some (50-80%)
major CHIS
development
projects
currently have a
budget and
strategy for re-
training in the
use of new
tools, but future
budgets are not
certain.
CHIS
development
projects do not
have a budget
and strategy for
re-training in the
use of new
tools.
45
Is the introduction
of new CHIS tools
supported with
adequate
resources for
printing/customizin
g software, and
distributing/updatin
g tools for CHWs?
Channels and
resources exist
for distributing
new tools to all
CHWs
Channels and
resources exist
for distributing
new tools to all
CHWs, but a
few CHWs do
not receive
updated
materials in a
timely manner.
Channels and
resources exist
for distributing
new tools to all
CHWs, but a
many CHWs do
not receive
updated
materials in a
timely manner.
Channels and
resources do
not exist for
distributing new
tools to all
CHWs
46
Is the introduction
and use of new
technology
supported by
mechanisms for
user guidance,
troubleshooting,
and replacement of
technology and
hardware over time
Adequate user
support,
including
support
"hotline",
software
responsibility,
and channel for
replacing
hardware is in
place, with fast
response and
high level of
confidence
User support,
including
support
"hotline",
software
responsibility,
and channel for
replacing
hardware is in
place, but there
is delayed
response and
high level of
confidence
Adequate user
support,
including
support
"hotline",
software
responsibility,
and channel for
replacing
hardware is in
place, but
sometime
delayed
response and
low level of
confidence
Adequate user
support,
including
support
"hotline",
software
responsibility,
and channel for
replacing
hardware are
not in place.

193 | August 29, 2017 Version
47
Is a reliable and
robust server in
place to support
CHIS online data
reporting and
feedback?
A nationally
owned CHIS
server, adhering
to security and
confidentiality
regulations, is in
place, with
minimal
downtime
A partner owned
CHIS server,
adhering to
security and
confidentiality
regulations, is in
place, with
minimal
downtime
A CHIS server,
adhering to
security and
confidentiality
regulations, is in
place, but with
frequent
downtime
No adequate
server, adhering
to security and
confidentiality
regulations, is in
place.
48
Is there a channel
for CHWs to give
input to CHIS
development and
improvement?
CHWs were
consulted when
developing
CHIS, and a
channel for
subsequent
feedback on the
CHIS is
available
CHWs were
consulted when
developing
CHIS, a channel
for subsequent
feedback on the
CHIS is
available, but it
is seldom used.
CHWs were
consulted when
developing
CHIS, but no
channel for
subsequent
feedback on the
CHIS is
available.
CHW do not
have the
opportunity to
inform CHIS
development
49
Are the target
populations for
CHWs clearly
defined?
All CHWs have
clear target
populations,
which are
routinely
updated
CHWs have
target
populations,
which are
seldomly
updated
CHWs have
vague target
populations,
which are
seldomly
updated
No target
population
figures are
available for
communities
50
Are the baseline
indicator values
known?
Relevant
baseline values
exist for all
CHIS indicators
at all levels.
Relevant
baseline values
exist for most
(80%+) CHIS
indicators at
most levels.
Relevant
baseline values
exist for 50-80%
of CHIS
indicators at
most relevant
levels.
Less than 50%
of CHIS
indicators have
baseline values.
51
Do goals and
targets exist for all
CHIS indicators?
Targets and
goals cover all
CHIS indicators
Targets and
goals cover
most indicators,
but may be out
of date
Targets and
goals are set for
few indicators,
and are out-of-
date or not
evaluated
No goals or
targets exist for
CHIS indicators

194 | August 29, 2017 Version
52
Are targets for
CHIS indicators
SMART (specific,
measurable,
appropriate,
relevant, and time-
bound)?
All indicators
adhere to the
SMART
principles.
Some indicators
are SMART,
most indicators
adhere to at
least four of the
SMART
principles.
Few indicators
are SMART,
most indicators
adhere to only
three or less of
the SMART
principles.
None of the
indicators
adhere to the
SMART
principles.

195 | August 29, 2017 Version
Feedback
Highly
adequate
Adequate Present but not
adequate
Not adequate
at all
Score
Comments
53
Do CHW get
automatic feedback
when reporting
data?
Yes, automatic
replies inform
the CHWs that
their data pass
validation rules
and that reports
have been
submitted.
CHWs know if
their data has
been received.
Yes, automatic
replies inform
the CHWs that
their data pass
validation rules
and that reports
have been
submitted.
Some CHWs
report issues
knowing if data
has been
submitted.
Manual replies
inform the
CHWs that their
data pass
validation rules
and that reports
have been
submitted. Many
CHWs report
issues or
confusion in
knowing if data
has been
submitted.
Manual replies
inform the
CHWs that their
data pass
validation rules
and that reports
have been
submitted. Most
CHWs report
some issues or
confusion in
knowing if data
has been
submitted.
54
Do CHW registers
provide supporting
for intervention or
service delivery
(automatic decision
support)?
Decision
support is
incorporated in
both registers
and data
capture
application,
aiding the CHW
in service
delivery
Decision
support is
incorporated in
the registers but
not in the data
capture
application.
Decision
support is
incorporated in
the registers but
not in the data
capture
application and
it does not aid
the CHW in
service delivery
No, decision
support is not
incorporated in
the registers or
the data capture
application.
55
Are referrals by
CHW notified to the
referral
facility/hospital?
The CHIS
supports
referrals,
sharing
information with
the referral
facility/ hospital
and notifying
stakeholders.
CHWs are
notified of
outcome of
referred
patients.
The CHIS
shares
information with
the referral
facility/hospital
and notifies
stakeholders.
CHWs are not
notified of
outcome of
referred
patients.
The CHIS
supports
referrals,
sharing
information with
the referral
facility/ hospital.
No feedback is
provided to any
other
stakeholders.
The CHIS does
not supports
referrals.

196 | August 29, 2017 Version
56
Do CHW
supervisors provide
regular feedback
on reporting and
data quality to the
CHWs?
CHW
supervisors
provide monthly
feedback
related to
reporting and
data quality to
all CHWs
CHW
supervisors
provide
quarterly
feedback
related to
reporting and
data quality to
all CHWs
CHW
supervisors
provide
intermittent
(less-than
quarterly)
feedback
related to
reporting and
data quality to
all CHWs
CHW
supervisors do
not provide
feedback
related to
reporting and
data quality to
all CHWs
57
Do CHW
supervisors provide
regular feedback
on indicator values,
achievement
towards goals and
targets, to the
CHWs?
CHW
supervisors
provide monthly
feedback on
indicator values,
achievement
towards goals
and targets, to
all CHWs
CHW
supervisors
provide
quarterly
feedback on
indicator values,
achievement
towards goals
and targets, to
all CHWs
CHW
supervisors
provide less-
than quarterly
feedback on
indicator values,
achievement
towards goals
and targets, to
all CHWs
CHW
supervisors do
not provide
feedback on
indicator values,
achievement
towards goals
and targets, to
all CHWs
58
Are dashboards on
community
indicators defined
and available to all
stakeholders?
Dashboards
have been
created for
relevant
stakeholders
based on their
information
needs, and are
regularly used
by the
stakeholders
Dashboards
have been
created for all
relevant
stakeholders
based on their
information
needs, and are
used by the
stakeholders
Dashboards
have been
created for
stakeholders,
but are rarely
used by the
stakeholders
Dashboards
have not been
created for all
relevant
stakeholders.