1. Arvonluontia kasvun kautta - kesko.fi · •Kespro is the leading foodservice provider in...
44
Jukka Erlund, CFO 4 June 2019 Transforming Kesko 1
Transcript of 1. Arvonluontia kasvun kautta - kesko.fi · •Kespro is the leading foodservice provider in...

Jukka Erlund, CFO4 June 2019
Transforming Kesko
1

K Group and Kesko Today
2
#1Biggest in Finland,#3 in Northern Europe with retail sales of nearly €13bn
World’s most sustainable trading sector company
Market cap approx. €4.6bn with over 41,000 shareholders
Profitable growth strategy in 3 core divisions
Strong financial position with good dividend capacity
41,000 employees, approx. 1,800 stores and comprehensive digitalservices in 8 countries
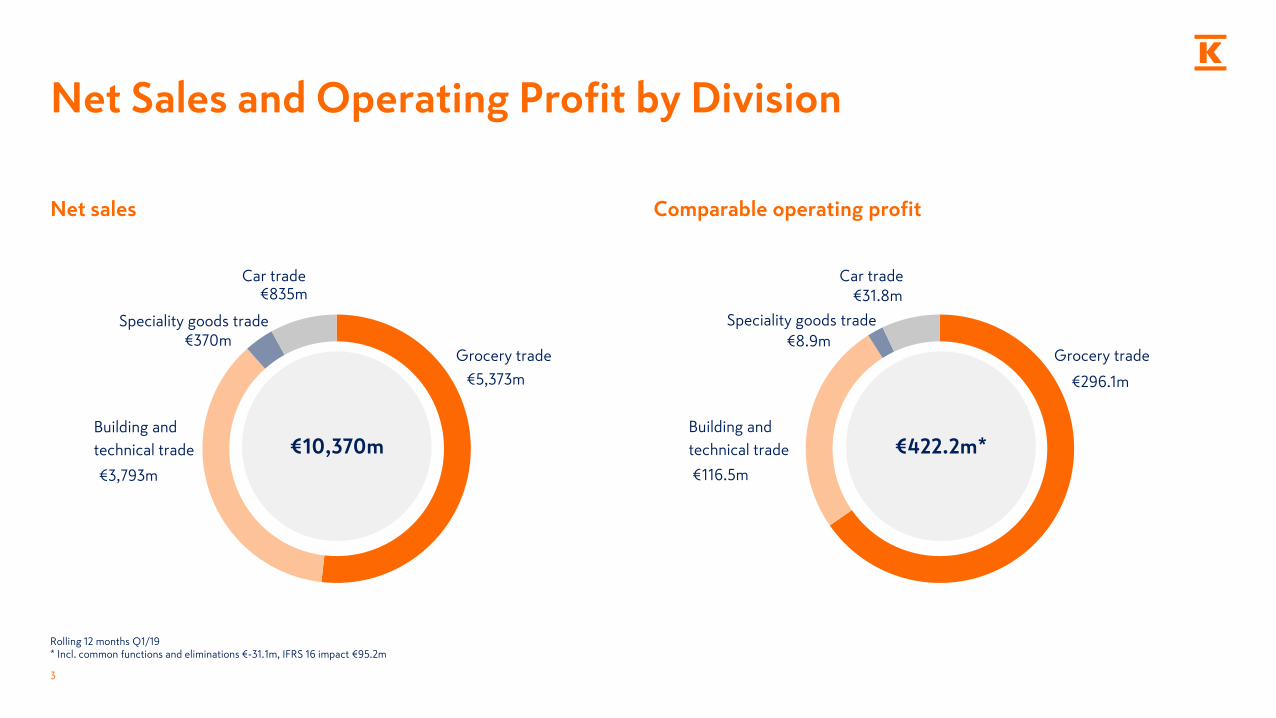
Net sales
€5,373m
€3,793m
€370m
€835m
Comparable operating profit
€296.1m
€116.5m
€8.9m
€31.8m
3
Net Sales and Operating Profit by Division
€10,370m €422.2m*
Grocery trade
Speciality goods trade
Car trade
Grocery trade
Speciality goods trade
Car trade
Building and
technical trade
Building and
technical trade
Rolling 12 months Q1/19* Incl. common functions and eliminations €-31.1m, IFRS 16 impact €95.2m

4
1. Creating Value Through Growth
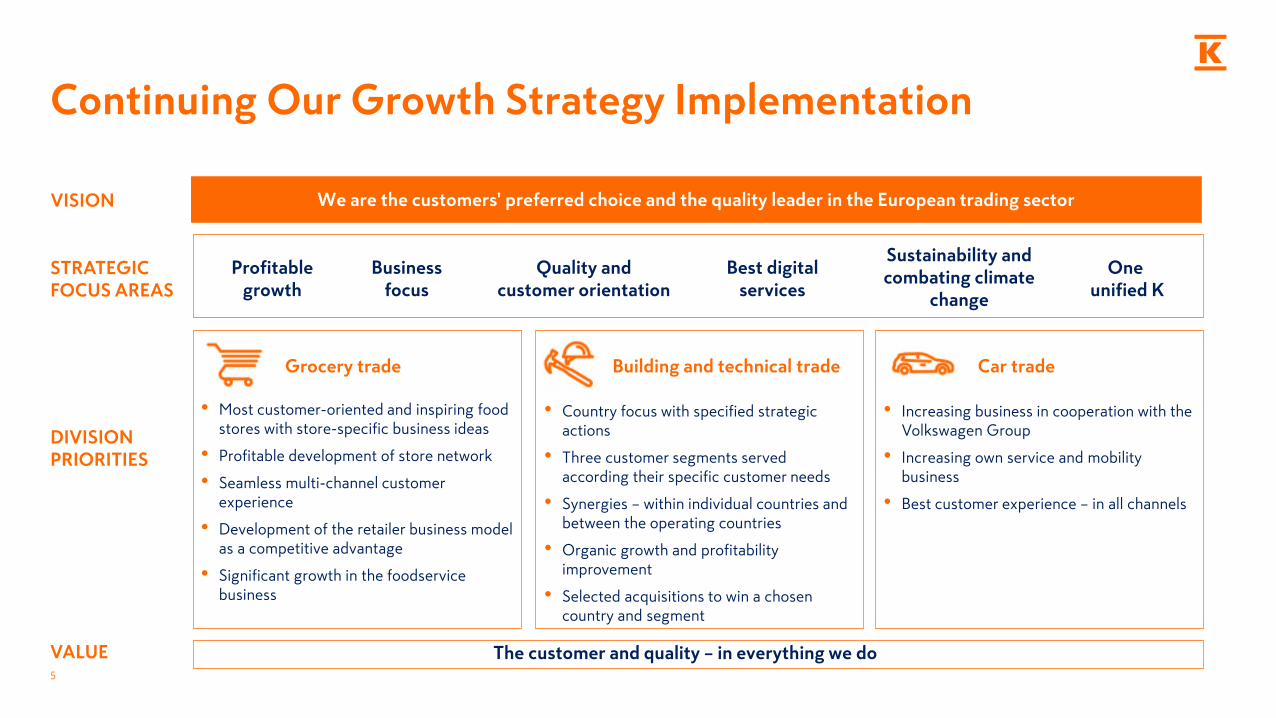
• Most customer-oriented and inspiring food stores with store-specific business ideas
• Profitable development of store network
• Seamless multi-channel customer experience
• Development of the retailer business model as a competitive advantage
• Significant growth in the foodservice business
Continuing Our Growth Strategy Implementation
We are the customers' preferred choice and the quality leader in the European trading sectorVISION
STRATEGIC FOCUS AREAS
Profitablegrowth
Businessfocus
Quality andcustomer orientation
Best digitalservices
One unified K
Grocery trade Building and technical trade Car trade
• Country focus with specified strategic actions
• Three customer segments served according their specific customer needs
• Synergies – within individual countries and between the operating countries
• Organic growth and profitability improvement
• Selected acquisitions to win a chosen country and segment
• Increasing business in cooperation with the Volkswagen Group
• Increasing own service and mobility business
• Best customer experience – in all channels
5
DIVISION PRIORITIES
VALUE The customer and quality – in everything we do
Sustainability andcombating climate
change

Acquisitions
6
A Strong and More Focused Company Through Successful Portfolio Transformation
*Transaction announced, waiting for closing
Suomen Lähikauppa
04/2016
Onninen06/201 6
03/2015Anttila
AutoCarrera12/2016
11/2016Russian
grocery trade
06/2017Asko and Sotka,
K-maatalous, Yamaha
02/2018Russian building
and home improvement trade
07/2018Remainingshares of
KonekeskoBaltics*
1 A Group10/201 8
Kalatukku E. Eriksson, Gipling, Skattum
Handel07/201 8
LänsiAutoSEAT business
06/2017
Reinin Liha06/201 8
Sørbø01/2019
Divestments
Huittisten Laatuauto and
LänsiAutobusinesses03/2019
Autotalo Laakkonen business*04/2019
05/2019Onninen Sweden HEPAC business
02/2017Minority of
machinery trade
Fresks, Heinon Tukku*
05/2019
Kesko’s New Financial Targets
7
5.0Operating margin
New target level
4.1
2018
<2.5Interest-bearing net debt/EBITDA (excl. IFRS 16 impact) 0.4
11.0Return on capital employed, % 9.8
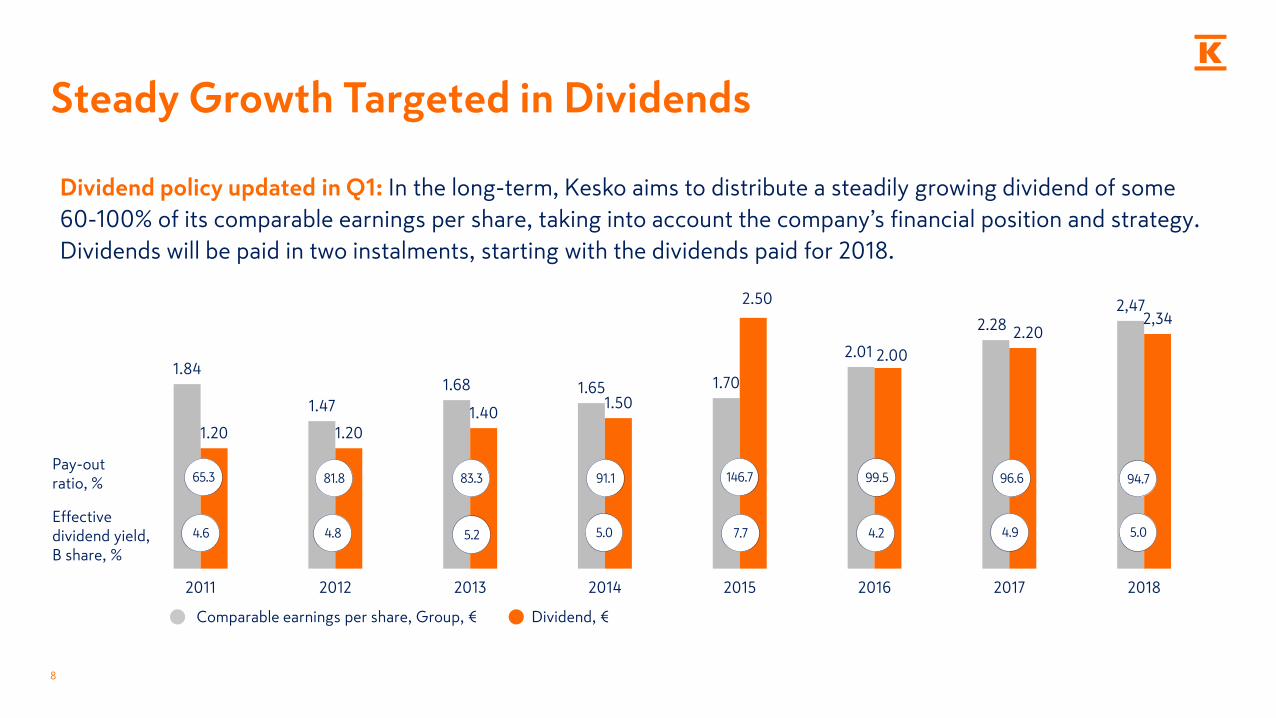
Steady Growth Targeted in Dividends
1.84
1.47
1.68 1.65 1.70
2.01
2.282,47
1.20 1.20
1.401.50
2.50
2.00
2.202,34
2011 2012 2013 2014 2015 2016 2017 2018
8
Comparable earnings per share, Group, € Dividend, €
Pay-out ratio, %
Effective dividend yield, B share, %
5.0 4.2 4.97.7 5.0
146.765.3 99.5 96.6 94.791.181.8 83.3
5.24.84.6
Dividend policy updated in Q1: In the long-term, Kesko aims to distribute a steadily growing dividend of some
60-100% of its comparable earnings per share, taking into account the company’s financial position and strategy.
Dividends will be paid in two instalments, starting with the dividends paid for 2018.
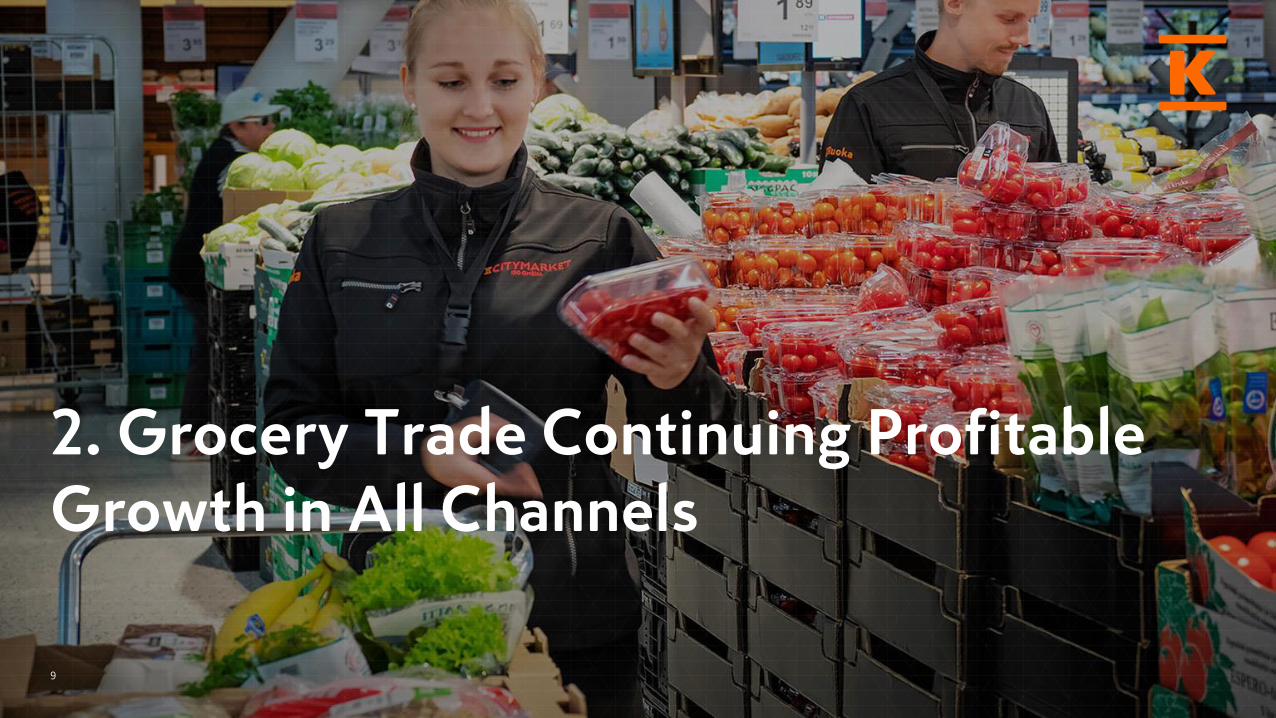
2. Grocery Trade Continuing Profitable Growth in All Channels
9
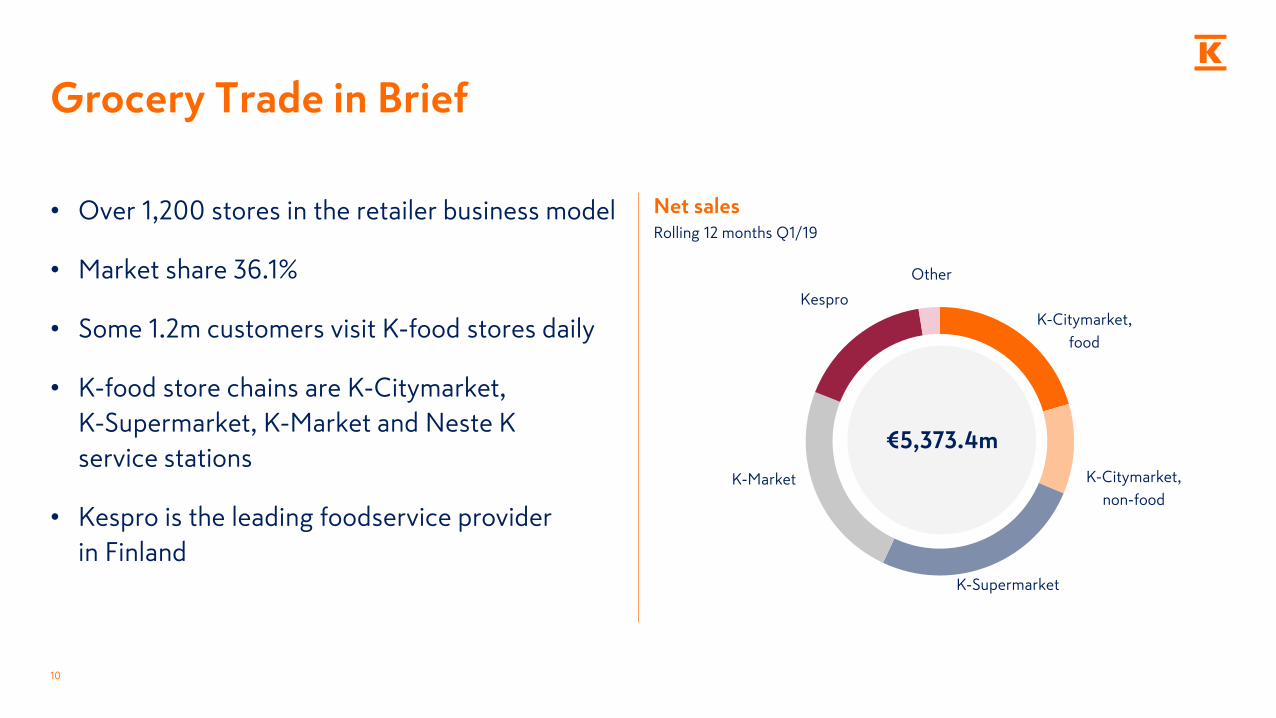
Net salesRolling 12 months Q1/19
Liukuva 12 kk
• Over 1,200 stores in the retailer business model
• Market share 36.1%
• Some 1.2m customers visit K-food stores daily
• K-food store chains are K-Citymarket,
K-Supermarket, K-Market and Neste K
service stations
• Kespro is the leading foodservice provider
in Finland
K-Citymarket,
food
K-Citymarket,
non-food
K-Supermarket
K-Market
Kespro
Other
10
Grocery Trade in Brief
€5,373.4m
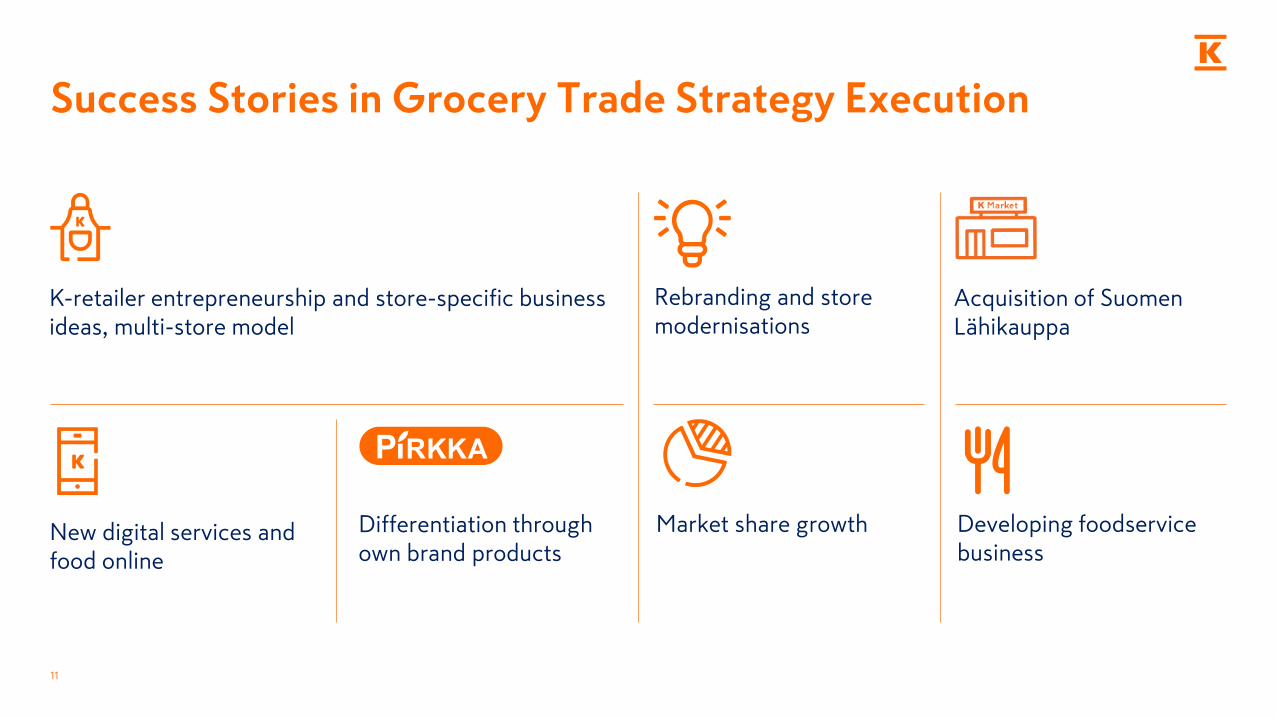
Success Stories in Grocery Trade Strategy Execution
K-retailer entrepreneurship and store-specific business ideas, multi-store model
Differentiation throughown brand products
Acquisition of Suomen Lähikauppa
Rebranding and storemodernisations
Developing foodservicebusiness
Market share growthNew digital services and food online
11
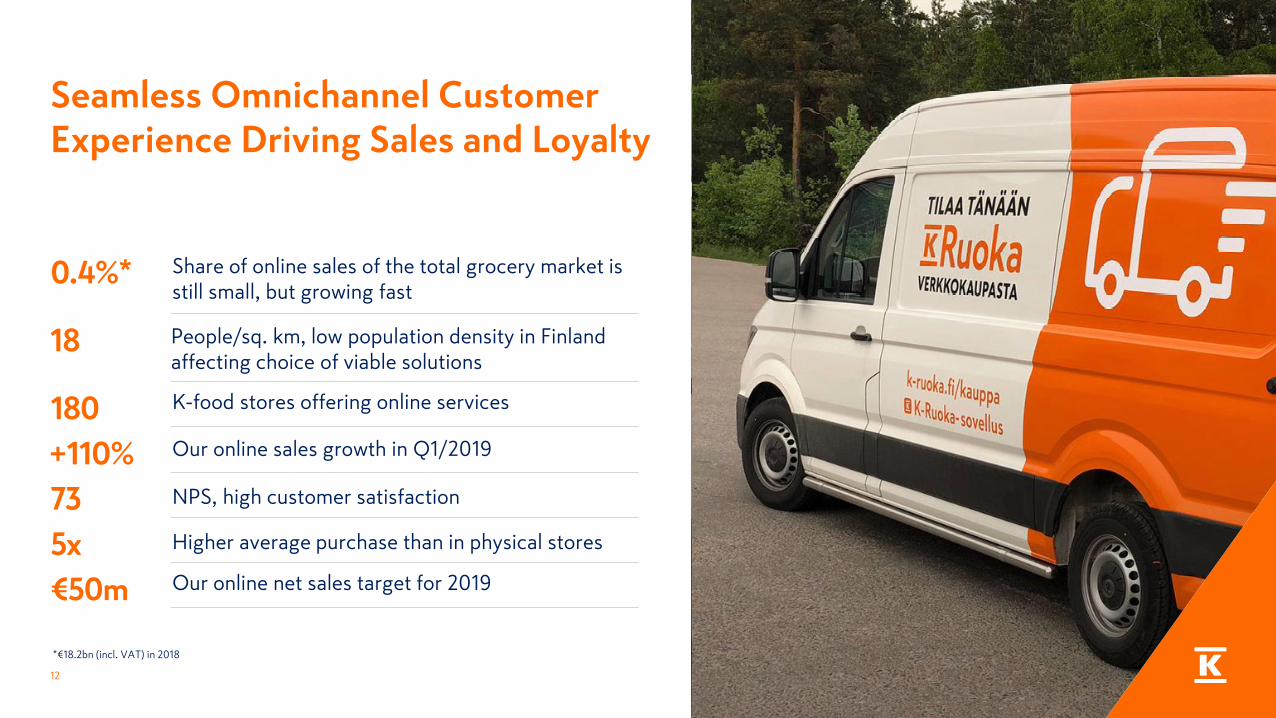
Seamless Omnichannel Customer Experience Driving Sales and Loyalty
12
Share of online sales of the total grocery market is still small, but growing fast
Our online sales growth in Q1/2019
Higher average purchase than in physical stores
Our online net sales target for 2019
K-food stores offering online services
NPS, high customer satisfaction
People/sq. km, low population density in Finland affecting choice of viable solutions
0.4%*
€50m
+110%
5x
180
73
18
*€18.2bn (incl. VAT) in 2018

Kespro to acquirefoodservice wholesaler
Heinon Tukku, whichcomplements our service
offering and network

3. Building and Technical Trade To the Next Level With Sharper Country Focus
14

Building and Technical Trade in Brief
• #1 operator in building and technical trade in Northern Europe
• Net sales pro forma €3.9bn*
• Approx. 70% of sales from B2B trade and 30% from B2C
• 440 stores in 8 countries
• Comprehensive digital services
• Additionally, speciality goods trade business
15
Norway€658m
Poland€239m
Finland€1,750m
Sweden€457m
Balticsand Belarus
€843m
*2018 pro forma net sales, current portfolio and excl. speciality goods trade
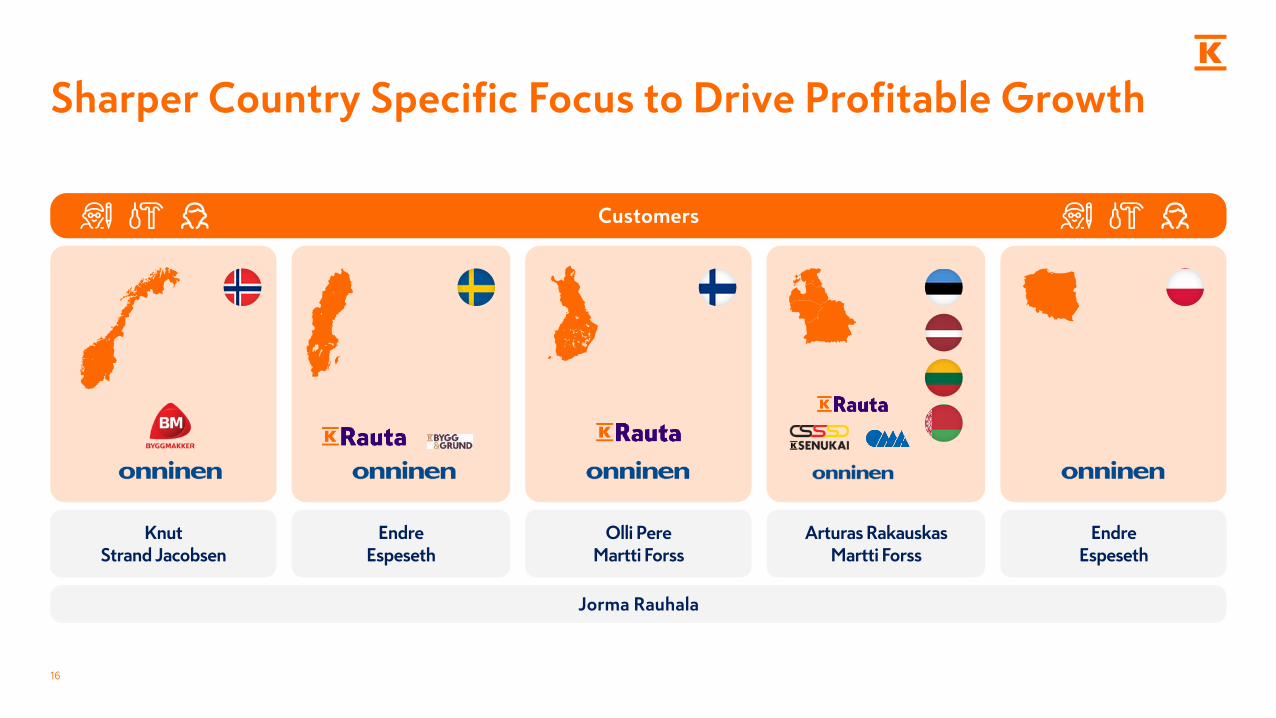
Sharper Country Specific Focus to Drive Profitable Growth
16
Jorma Rauhala
Customers
EndreEspeseth
Olli PereMartti Forss
KnutStrand Jacobsen
Arturas RakauskasMartti Forss
EndreEspeseth

Technicalprofessionals
• Technical contractors• Infrastructure• Industry• Retailers
Consumers
• Renovators• Home and garden builders• Decorators• Gardeners
17
Three Customer Segments Served According Their Specific Customer Needs
Professionalbuilders
• Construction companies• Renovation contractors• Decoration contractors
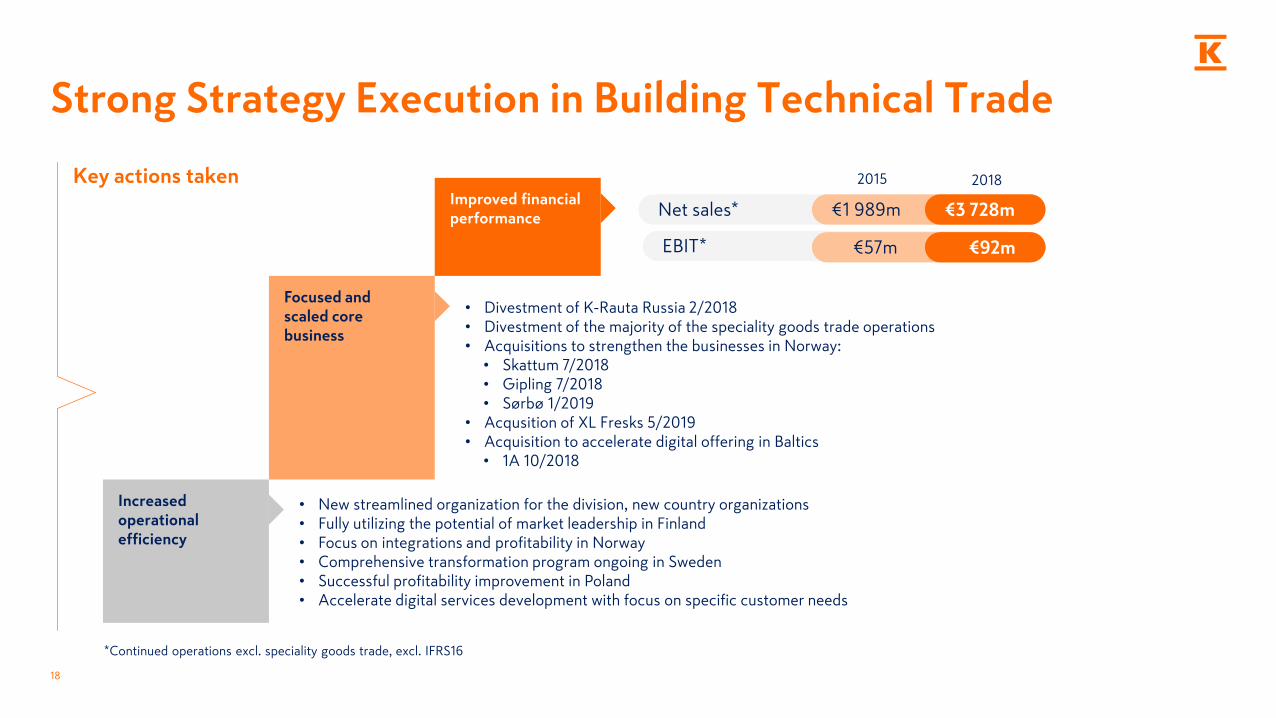
Strong Strategy Execution in Building Technical Trade
18
• Divestment of K-Rauta Russia 2/2018• Divestment of the majority of the speciality goods trade operations• Acquisitions to strengthen the businesses in Norway:
• Skattum 7/2018• Gipling 7/2018• Sørbø 1/2019
• Acqusition of XL Fresks 5/2019• Acquisition to accelerate digital offering in Baltics
• 1A 10/2018
• New streamlined organization for the division, new country organizations• Fully utilizing the potential of market leadership in Finland • Focus on integrations and profitability in Norway• Comprehensive transformation program ongoing in Sweden • Successful profitability improvement in Poland• Accelerate digital services development with focus on specific customer needs
Improved financial performance
Increased operational efficiency
Focused andscaled core business
2015Net sales*
EBIT*
€1 989m €3 728m
€57m €92m
2015 2018
*Continued operations excl. speciality goods trade, excl. IFRS16
Key actions taken

Fresks acquisitionis a game changer
for us in Sweden – and highly complementaryto our current K-Rauta
operations

4. Fast Developing Car Trade
20
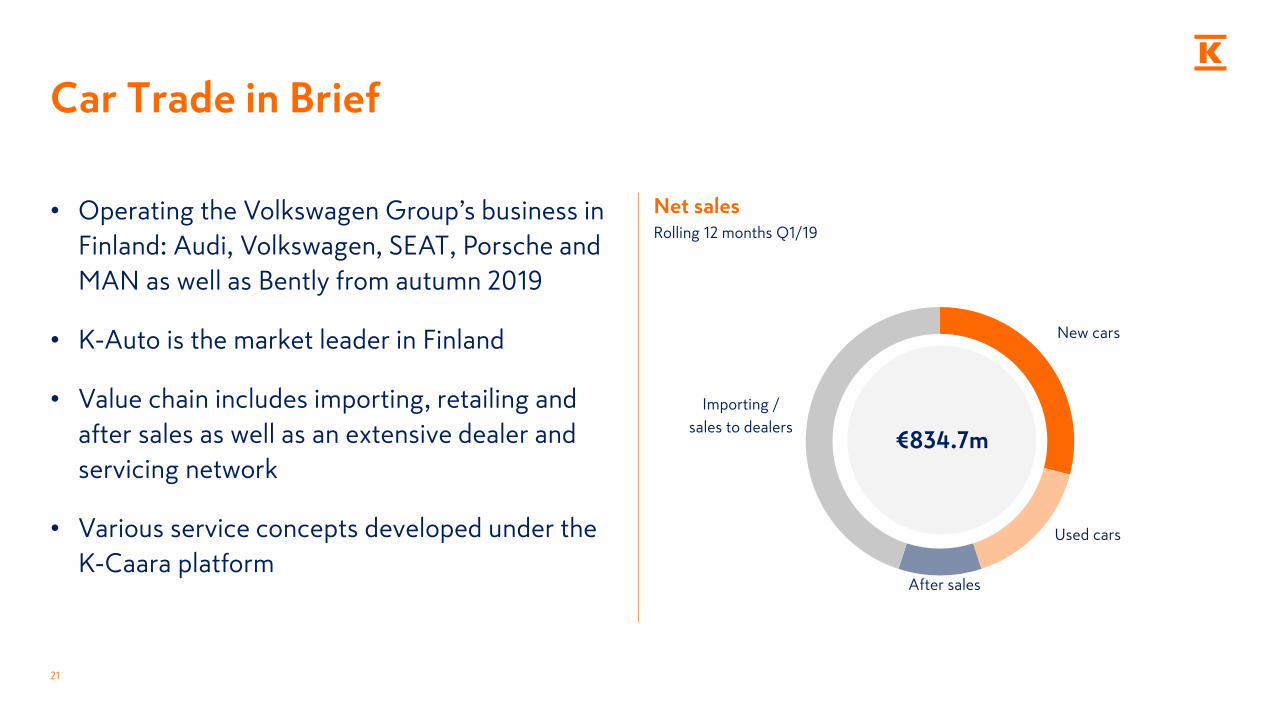
• Operating the Volkswagen Group’s business in
Finland: Audi, Volkswagen, SEAT, Porsche and
MAN as well as Bently from autumn 2019
• K-Auto is the market leader in Finland
• Value chain includes importing, retailing and
after sales as well as an extensive dealer and
servicing network
• Various service concepts developed under the
K-Caara platform
New cars
31 %
Used cars
16 %
After sales
9 %
Importing /
sales to dealers
44 %
21
Car Trade in Brief
€834.7m
Net salesRolling 12 months Q1/19
Liukuva 12 kk

22
Growing Our Volume with VW Group – Focus On Electric Cars
Volkswagen Group Invests Heavily in Future Mobility
Targets 2025
Over €34bn investments in e-mobility, digitalisation,
autonomous driving and mobility services
Over 80 new electrified models to customers
~3 million units of e-cars sold annually
Every 4th new Volkswagen Group vehicle battery powered

New business services off to a good
start: K-Caara leasing, car sharing, nationwideK-Charge network for
electric cars

Six Reasons to Invest in Kesko
24
1 Growth strategy
3 Long-term profitability improvement
5 Ability to increase shareholder value2 Strong market positions
6 Responsibility
4 Attractive dividend yield

5. Appendix: Q1/2019
25
26
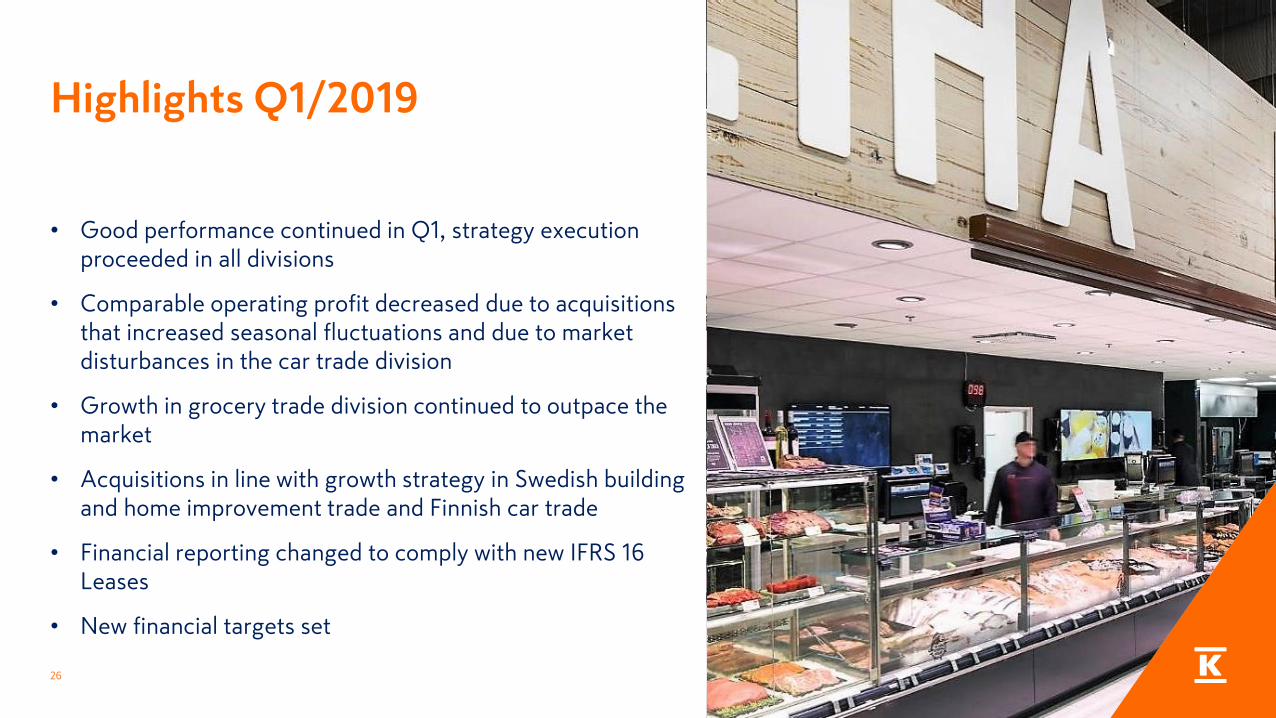
• Good performance continued in Q1, strategy execution proceeded in all divisions
• Comparable operating profit decreased due to acquisitions that increased seasonal fluctuations and due to market disturbances in the car trade division
• Growth in grocery trade division continued to outpace the market
• Acquisitions in line with growth strategy in Swedish building and home improvement trade and Finnish car trade
• Financial reporting changed to comply with new IFRS 16 Leases
• New financial targets set
Highlights Q1/2019
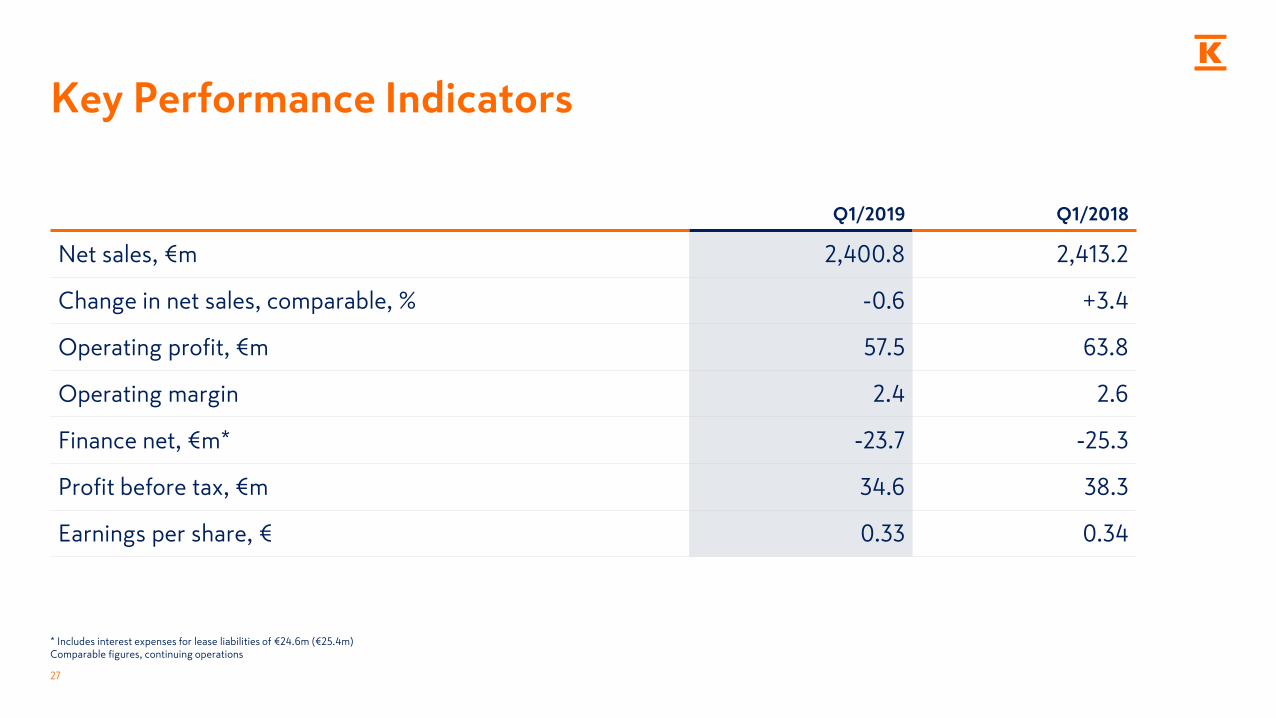
Key Performance Indicators
Q1/2019 Q1/2018
Net sales, €m 2,400.8 2,413.2
Change in net sales, comparable, % -0.6 +3.4
Operating profit, €m 57.5 63.8
Operating margin 2.4 2.6
Finance net, €m* -23.7 -25.3
Profit before tax, €m 34.6 38.3
Earnings per share, € 0.33 0.34
27
* Includes interest expenses for lease liabilities of €24.6m (€25.4m)Comparable figures, continuing operations
28
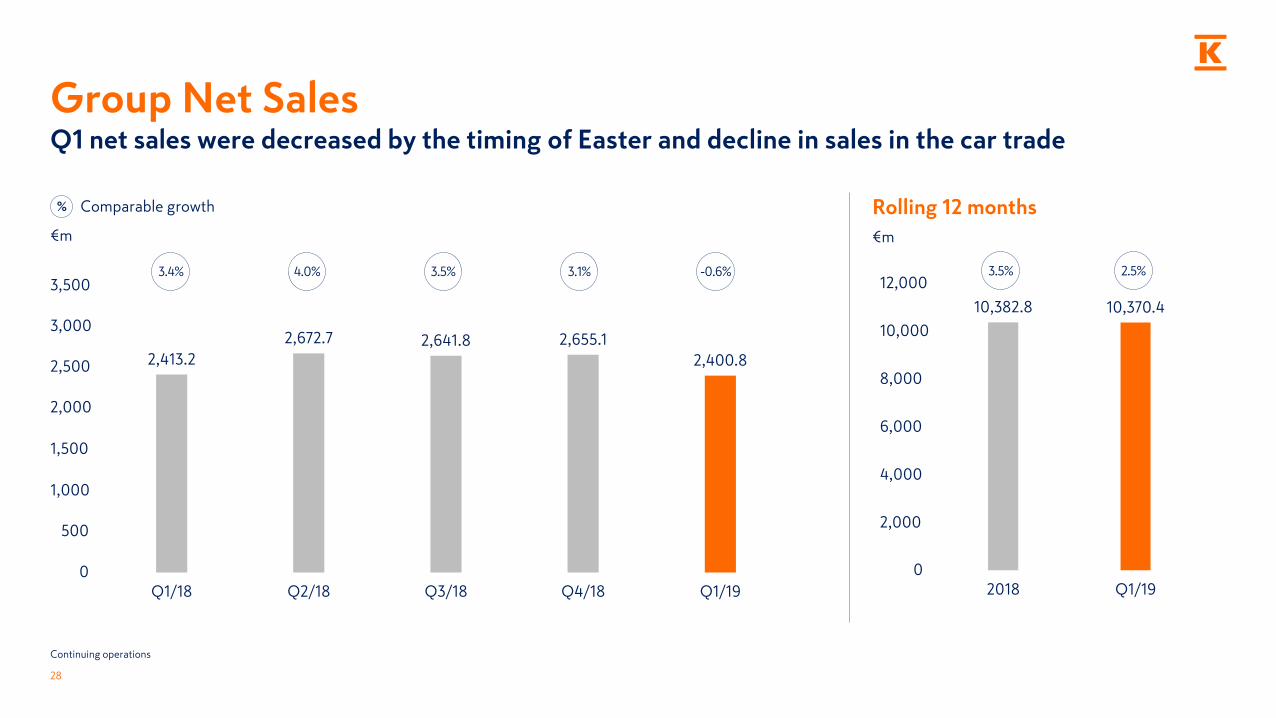
Group Net SalesQ1 net sales were decreased by the timing of Easter and decline in sales in the car trade
€m
2,413.2
2,672.7 2,641.8 2,655.1
2,400.8
0
500
1 000
1 500
2 000
2 500
3 000
3 500
Q1/18 Q2/18 Q3/18 Q4/18 Q1/19
Rolling 12 months
€m
10,382.8 10,370.4
0
2 000
4 000
6 000
8 000
10 000
12 000
2018 Q1/19
Continuing operations
% Comparable growth
3.4% 4.0% 3.1%3.5% -0.6% 3.5% 2.5%3,500
3,000
2,500
2,000
1,500
1,000
12,000
10,000
8,000
6,000
4,000
2,000
40.0
89.0
112.6
90.5
34.9
23.8
24.2
24.4
24.0
22.5
0
20
40
60
80
100
120
140
160
Q1/18 Q2/18 Q3/18 Q4/18 Q1/19
29
€m
Rolling 12 months
€m
2.6% 4.2% 5.2% 2.4%4.3%
332.2 327.1
96.4 95.2
0
50
100
150
200
250
300
350
400
450
2018 Q1/19
Comparable operating profit, continuing operations
Operating profit excl. IFRS 16 Impact of IFRS 16
Operating margin
4.1% 4.1%
63.8
113.2
137.0
114.5
57.5
428.5 422.2
Group Operating Profit Q1 performance affected by acquisitions increasing seasonality and decline in car trade sales

Strong Financial Position
31.3.2019 31.3.2018
Liquid assets, €m 237.6 599.2
Interest-bearing net debt excl. lease liabilities, €m 174.6 -59.0
Interest-bearing net debt/EBITDA (excl. IFRS 16 impact) 0.4 -0.1
Lease liabilities, €m 2,287.1 2,233.9
Continuing operations Q1:
Cash flow from operating activities, €m* 157.0 116.0
Cash flow from operating activities (excl. IFRS 16 impact), €m 77.9 39.3
Capital expenditure, €m **97.3 54.5
30
*Return of surplus assets paid by Kesko Pension Fund €48.3m (€57.8m) **Acquisitions €37.7m

Return on Capital EmployedReturn on capital remained good in grocery trade, return in car trade still at a good level despite the decline in sales
13.1
7.9
20.8
9.8
13.2
7.5
18.1
9.5
0
5
10
15
20
25
Grocery trade Building and technical trade Car trade Group, continuing operations
2018 Q1/19
31
%
Comparable, rolling 12 months

Grocery Trade
Market
• Grocery market growth 0.4%*
• Market growth weakened by the timing of Easter
season, which fell on April this year
• Grocery prices up by approx. 2%
• Continued increased emphasis on quality and
selections, price also important
Q1
• K Group's grocery sales grew by 1.5%
• Retail sales grew in all chains despite the timing
of Easter
• Customer numbers and market share up
• Growth in online grocery sales 110%
• Operating profit boosted by good development
in all chains and increased operational efficiency
32
* Source: The Finnish Grocery Trade Association PTY

33
Grocery Trade Net SalesComparable Q1 net sales growth 0.4%, retail sales growth 1.5%
€m
1,276.2 1,327.3 1,352.41,429.8
1,263.9
0
500
1 000
1 500
2 000
Q1/18 Q2/18 Q3/18 Q4/18 Q1/19
Rolling 12 months
€m
5,385.7 5,373.4
4 000
4 500
5 000
5 500
2018 Q1/19
% Comparable growth
7.4% 2.9% 4.2%6.2% 0.4% 3.4%5.1%2,000
1,500
1,000
5,500
5,000
4,500
4,000

38.7
52.864.7
71.8
41.3
16.5
16.6
16.7
16.8
15.4
0
10
20
30
40
50
60
70
80
90
100
Q1/18 Q2/18 Q3/18 Q4/18 Q1/19
34
€m
Rolling 12 months
€m
4.3% 5.2% 6.0% 4.5%6.2%
228.0 230.6
66.6 65.5
0
50
100
150
200
250
300
2018 Q1/19
Comparable operating profit, continuing operations
Operating profit excl. IFRS 16 Impact of IFRS 16
Operating margin
5.5% 5.5%
55.2
69.5
81.388.6
56.8
294.5 296.1
Grocery Trade Operating ProfitQ1 operating profit improved despite the timing of Easter
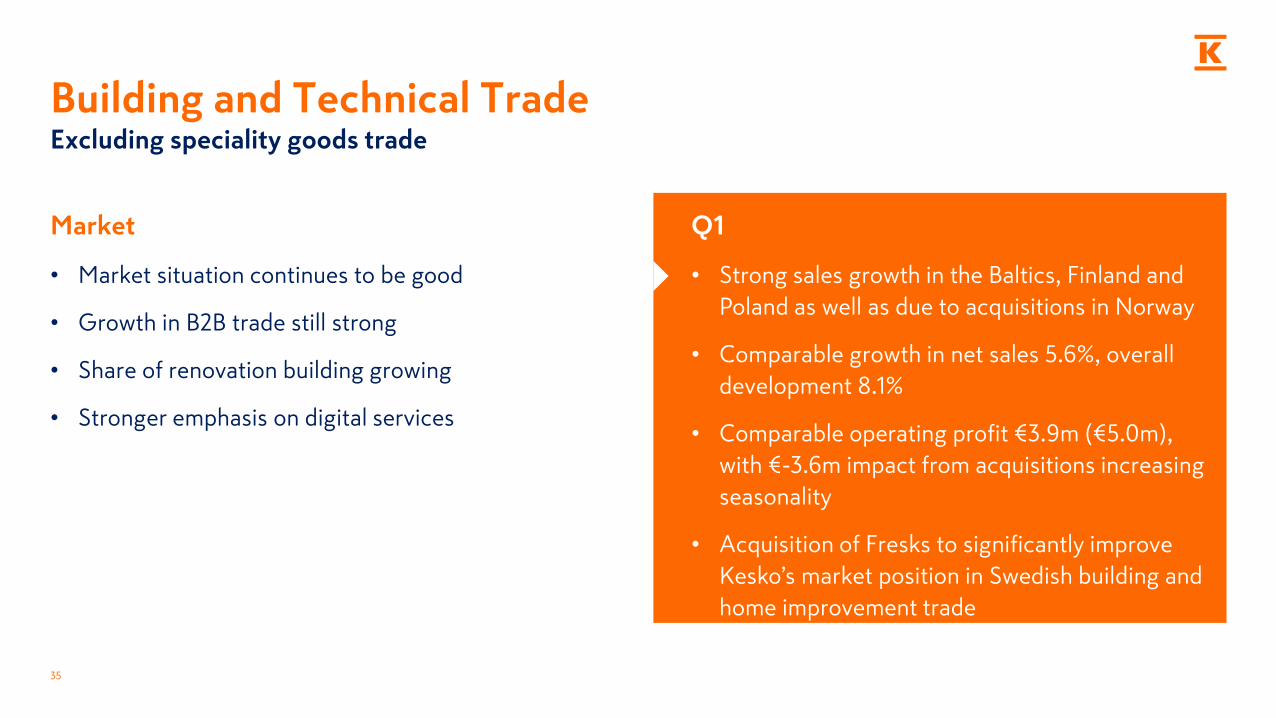
Market
• Market situation continues to be good
• Growth in B2B trade still strong
• Share of renovation building growing
• Stronger emphasis on digital services
Q1
• Strong sales growth in the Baltics, Finland and
Poland as well as due to acquisitions in Norway
• Comparable growth in net sales 5.6%, overall
development 8.1%
• Comparable operating profit €3.9m (€5.0m),
with €-3.6m impact from acquisitions increasing
seasonality
• Acquisition of Fresks to significantly improve
Kesko’s market position in Swedish building and
home improvement trade
35
Building and Technical TradeExcluding speciality goods trade

36
Building and Technical Trade Net SalesComparable Q1 growth 5.6%, figures excluding speciality goods trade
€m
802.3
995.3 977.8 952.5867.5
0
200
400
600
800
1 000
1 200
1 400
Q1/18 Q2/18 Q3/18 Q4/18 Q1/19
Rolling 12 months
€m
3,728.0 3,793.2
0
1 000
2 000
3 000
4 000
2018 Q1/19
% Comparable growth
-2.3% 4.7% 5.1%2.5% 5.6% 2.6% 4.4%1,400
1,200
1,000
4,000
3,000
2,000
1,000

-1.0
31.2
41.6
20.7
-2.1
6.0
6.3
6.6
6.3
6.0
-5
0
5
10
15
20
25
30
35
40
45
50
55
Q1/18 Q2/18 Q3/18 Q4/18 Q1/19
37
€m
Rolling 12 months
€m
0.6% 3.8% 4.9% 0.5%2.8%
92.4 91.3
25.2 25.2
0
20
40
60
80
100
120
2018 Q1/19
Comparable operating profit, continuing operations
Operating profit excl. IFRS 16 Impact of IFRS 16
Operating margin
3.2% 3.1%
5.0
37.5
48.1
26.9
3.9
117.5 116.5
Building and Technical Trade Operating ProfitAcquisitions have increased seasonality, €-3.6m impact in Q1, figures excluding speciality goods trade

-2
-1
0
1
2
3
Q1/18 Q1/19
38
Speciality Goods Trade Net Sales and Operating ProfitSales and profitability remained at a good level in leisure trade
Net sales, €m Operating profit, comparable, €m Leisure trade
• Net sales €49.2m, -1.2%
• Development in line with
expectations, does well in the market
Machinery trade
• Net sales €20.9m, -17.3%
• Divestment of Baltic machinery trade
and Finnish agricultural machinery
trade operations ongoing
% Comparable growth
75.170.1
0
10
20
30
40
50
60
70
80
Q1/18 Q1/19
-3.4% -6.6% -0.4% -1.0%Operating margin
-0.3 -0.7
Operating profit excl. IFRS 16
Impact of IFRS 16
-1.2 -1.4+0.9
+0.7

Car Trade
Market
• First registrations of passenger cars and vans -14.6%
• Uncertainties regarding car taxation and choice of
motive power have resulted in weakened consumer
demand
• Disturbances caused by the implementation of
WLTP testing decreasing
• Market expected to normalise in H2
Q1
• Profitability good despite the temporary decline
in net sales due to the implementation of WLTP
• Problems in car availability temporarily reduced
our market share in passenger cars
• Dealer network strengthened by acquiring
businesses from Huittisten Laatuauto and
LänsiAuto
39

40
Car Trade Net SalesNew emissions testing and uncertainties regarding taxation and choice of motive power have led to a temporary decline in net sales
€m
258.9243.6
200.3190.2
200.5
0
50
100
150
200
250
300
350
Q1/18 Q2/18 Q3/18 Q4/18 Q1/19
Rolling 12 months
€m
893,1834,7
0
250
500
750
1 000
2018 Q1/19
% Comparable growth
5.8% 4.0% -12.9%-5.6% -21.9% -1.8% -9.5%
1,000

11.0
8.77.8
7.0 7.5
0.2
0.20.2
0.20.2
0
2
4
6
8
10
12
14
Q1/18 Q2/18 Q3/18 Q4/18 Q1/19
41
€m
Rolling 12 months
€m
4.3% 3.7% 4.0% 3.8%3.8%
34.531.1
0.7
0.7
0
5
10
15
20
25
30
35
40
2018 Q1/19
Comparable operating profit, continuing operations
Operating profit excl. IFRS 16 Impact of IFRS 16
Operating margin
3.9% 3.8%
11.1
8.98.0
7.2 7.7
35.231.8
Car Trade Operating ProfitQ1 profitability at a good level despite temporary market disturbances
Group Outlook
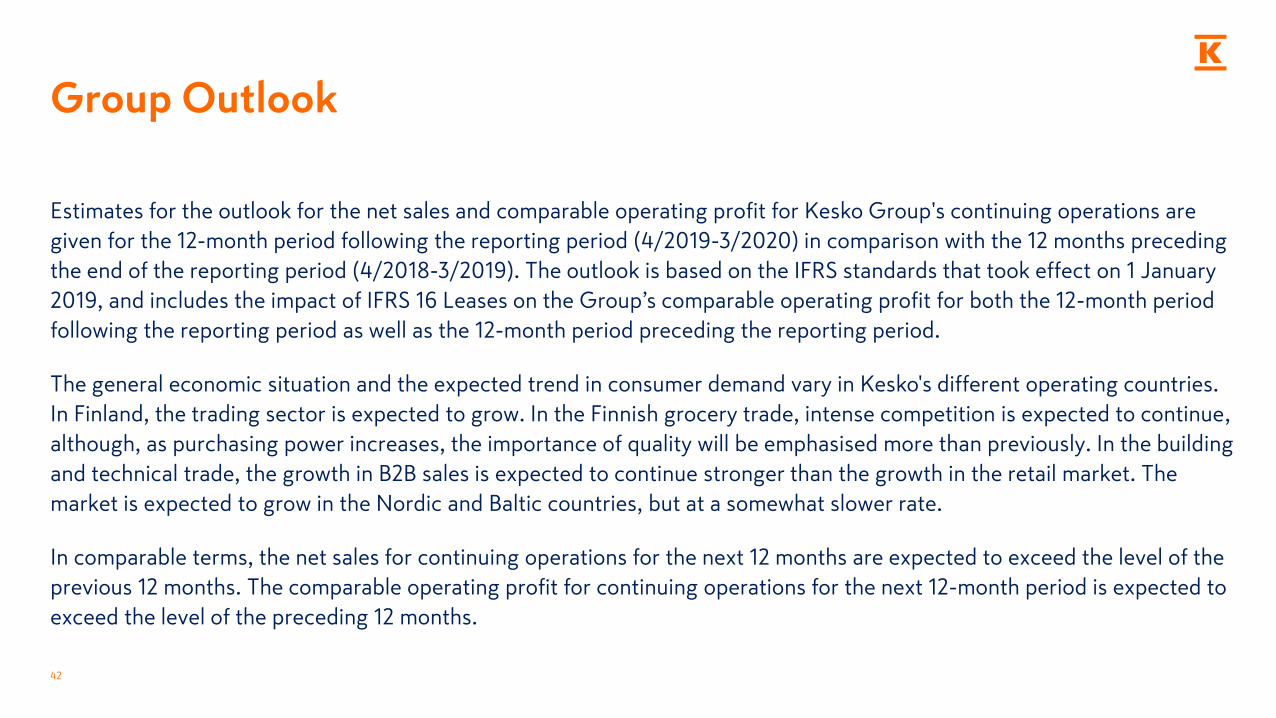
Estimates for the outlook for the net sales and comparable operating profit for Kesko Group's continuing operations are
given for the 12-month period following the reporting period (4/2019-3/2020) in comparison with the 12 months preceding
the end of the reporting period (4/2018-3/2019). The outlook is based on the IFRS standards that took effect on 1 January
2019, and includes the impact of IFRS 16 Leases on the Group’s comparable operating profit for both the 12-month period
following the reporting period as well as the 12-month period preceding the reporting period.
The general economic situation and the expected trend in consumer demand vary in Kesko's different operating countries.
In Finland, the trading sector is expected to grow. In the Finnish grocery trade, intense competition is expected to continue,
although, as purchasing power increases, the importance of quality will be emphasised more than previously. In the building
and technical trade, the growth in B2B sales is expected to continue stronger than the growth in the retail market. The
market is expected to grow in the Nordic and Baltic countries, but at a somewhat slower rate.
In comparable terms, the net sales for continuing operations for the next 12 months are expected to exceed the level of the
previous 12 months. The comparable operating profit for continuing operations for the next 12-month period is expected to
exceed the level of the preceding 12 months.
42

Contact
Kia Aejmelaeus
VP, Investor Relations
Tel: +358 40 765 4616
Email: [email protected]
43
Additional Information
Kesko observes a 30-day silent period
Materials and events: www.kesko.fi/en/investor
Follow us at: twitter.com/Kesko_IR
Q2/2019 half year report
24 July 2019
Q3/2019 interim report
24 October 2019
In addition, the Group's sales figures are published
monthly and K Group's retail sales quarterly