
1 Analysis of Worst-case Delay Bounds for Best-effort Communication in Wormhole Networks on Chip Yue...
33
1 Analysis of Worst-case Delay Bounds for Best-effort Communication in Wormhole Networks on Chip Yue Qian 1 , Zhonghai Lu 2 , Wenhua Dou 1 1 School of Computer Science, National University of Defense Technology, China 2 Dept. of Electronic, Computer and Software Systems, Royal Institute of Technology (KTH), Sweden The 3rd ACM/IEEE International Symposium on Networks-on- Chip May 10-13, 2009, San Diego, CA
-
Upload
cassidy-bullock -
Category
Documents
-
view
213 -
download
0
Transcript of 1 Analysis of Worst-case Delay Bounds for Best-effort Communication in Wormhole Networks on Chip Yue...

1
Analysis of Worst-case Delay Bounds for Best-effort Communication in Wormhole Networks on Chip
Yue Qian1, Zhonghai Lu2, Wenhua Dou1
1 School of Computer Science, National University of Defense Technology, China2 Dept. of Electronic, Computer and Software Systems, Royal Institute of Technology (KTH), Sweden
The 3rd ACM/IEEE International Symposium on Networks-on-ChipMay 10-13, 2009, San Diego, CA
2
Outline
Introduction Resource Sharing in Wormhole Networks Analysis of Resource Sharing The Delay Bound Analysis Technique A Delay-Bound Analysis Example Experimental Results Conclusions

3
Outline
Introduction Resource Sharing in Wormhole Networks Analysis of Resource Sharing The Delay Bound Analysis Technique A Delay-Bound Analysis Example Experimental Results Conclusions

4
Introduction (1/4)
The provision of Quality-of-Service (QoS) has been a major concern for Networks-on-Chip (NoC). Routing packets in resource-sharing networks creates
contention and thus brings about unpredictable performance.
A packet-switched networks may provide best-effort (BE) and guaranteed services to satisfy the requirements of different QoS provisions.
Compared to guaranteed service, BE networks make a good utilization of the shared network resources and achieve good average performance.

5
Introduction (2/4) The worst-case performance is extremely hard to
predict in BE networks. Network contention for shared resources (buffers and
links) includes not only direct but also indirect contention; Identifying the worst case is nontrivial; The existence of cyclic dependency between flit delivery
and credit generation in wormhole networks with credit-based flow control further complicates the problem.
The simulation based approach can offer the highest accuracy but can be very time-consuming. In contrast, a formal-analysis-based method is much more efficient.

6
Introduction (3/4) In general queuing networks, network calculus
provides the means to deterministically reason about timing properties of traffic flows.
[1] C. Chang, “Performance Guarantees in Communication Networks,” Springer-Verlag, 2000.[2] J.-Y. Le Boudec and P. Thiran, “Network Calculus-A Theory of Deterministic Queuing Systems for the Internet,” Springer-Verlag, vol. 2050, 2004.
data
time
b
T
r
RDelay bound
Backlog bound
Arrival curve
Service curve
Traffic flow
Based on the powerful abstraction of arrival curve for traffic flows and service curve for network elements (routers, servers), it allows computing the worst-case delay and backlog bounds.
Systematic accounts of network calculus can be found in books [1][2].
Figure 1. Arrival curve and service curve

7
Introduction (4/4) In this paper, based on network calculus, we aim for
deriving the worst-case delay bounds for individual flows in on-chip networks. We first analyze the resource sharing in routers, and then
build analysis models for different resource sharing components. Based on these models, we can derive the equivalent service curve a router provides to an individual flow.
To consider the contention a flow may experience along its routing path, we classify and analyze flow interference patterns. Such interferences can be captured in a contention tree model. Based on this model, we can derive the equivalent service curve the tandem of routers provides to an individual flow.
With a flow’s arrival curve known and its equivalent service curve obtained, we can compute the flow’s delay bound.

8
Outline
Introduction Resource Sharing in Wormhole Networks Analysis of Resource Sharing The Delay Bound Analysis Technique A Delay-Bound Analysis Example Experimental Results Conclusions

9
The Wormhole Network Portion of a wormhole network with two nodes.
A node contains a core and a router, which are connected via a network interface (NI);
The router contains one crossbar switch, one buffer per inport, and a credit counter for flow control;
At the link level, the routers perform credit-based flow control; There exists an one-to-one correspondence between flits and
credits, meaning that delivering one flit requires one credit, and forwarding one flit generates one credit.
Switch
Credit
Credit
FlitFlit
Credit
Credit
FlitFlit
Cre
dit
Cre
dit
Fli
tF
lit
Cre
dit
Cre
dit
Fli
tF
lit
FlitFlit
Remote Buffer Space(Space)
Credits to Report(Credit)
Input Buffer
NI
Local IP
North Port
South Port
East PortWest Port
Local Port
(b) An Input-buffering Wormhole Router
IP Core
NI
CreditFlit
FlitCredit
(a) Two Connected Routers
Router
IP Core
NI
Router
Figure 2. Portion of a wormhole network
10
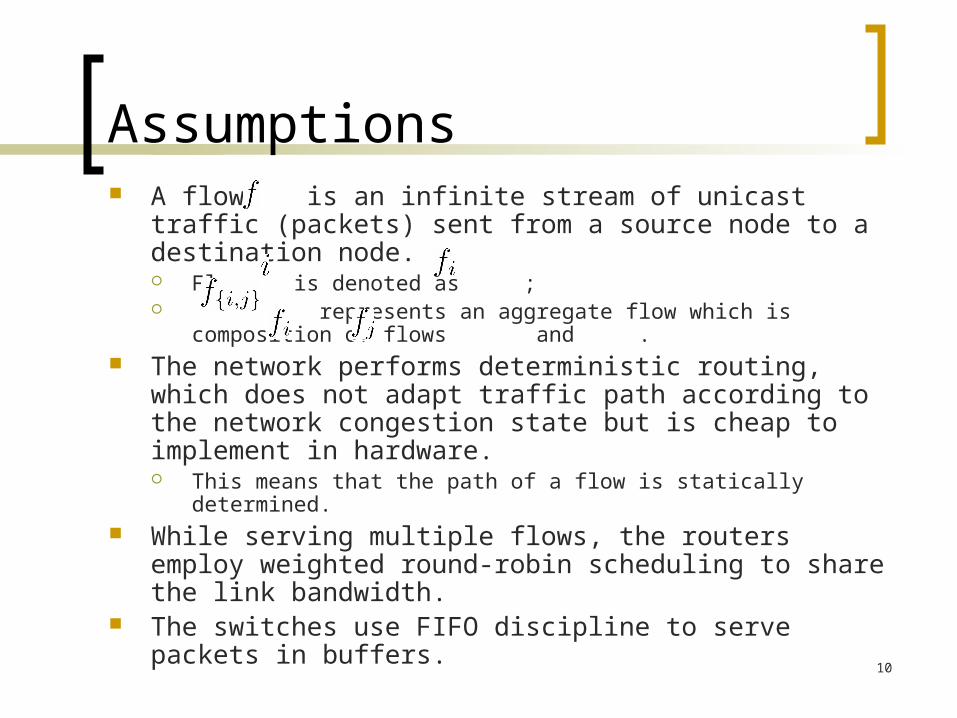
Assumptions A flow is an infinite stream of unicast traffic (packets)
sent from a source node to a destination node. Flow is denoted as ; represents an aggregate flow which is composition of flows
and . The network performs deterministic routing, which does
not adapt traffic path according to the network congestion state but is cheap to implement in hardware. This means that the path of a flow is statically determined.
While serving multiple flows, the routers employ weighted round-robin scheduling to share the link bandwidth.
The switches use FIFO discipline to serve packets in buffers.

11
Three Types of Resource Sharing Control sharing (flow control sharing)
Routers share and use the status of buffers in the downstream routers to determine when packets are allowed to be forwarded.
Link sharing Multiple flows from different buffers share the same
outport and thus the output link bandwidth. Buffer sharing
An aggregate flow, which are to be split, share a buffer.
Switch
FlitFlit
North Port
South Port
East PortWest Port
Local Port
Figure 3. (a) Link sharing
Switch
FlitFlit
North Port
South Port
East PortWest Port
Local Port
(b) Buffer sharing

12
Outline
Introduction Resource Sharing in Wormhole Networks Analysis of Resource Sharing The Delay Bound Analysis Technique A Delay-Bound Analysis Example Experimental Results Conclusions

13
We virtualize the functionality of flow control as a network element, flow controller , which provides service to traffic flows. Due to the existence of cyclic dependency between flit delivery
and credit generation, we can not directly apply network calculus analysis techniques because they are generally applicable to forward networks (networks without feedback control).
This enables us to derive its service curve and transform the closed-loop network into an open-loop one.
Analysis of Credit-based Flow Control (1/2) We consider a traffic flow f passing through adjacent routers
and construct an analytical model with the network elements depicted in Figure 4(a).
Figure 4. The flow control analytical model for flow f traversing adjacent routers.

14
Analysis of Credit-based Flow Control (2/2) We give a theorem to derive the service curve for the flow
controller 1 and router 1.
After obtaining the service curves of flow controller 1 and router1, we can transform the closed-loop model to the forward one depicted in Figure 4(b), where the cyclic dependency caused by the feedback control is resolved (“eliminated”).
Figure 4. The flow control analytical model

15
Without losing generality we consider two flows f1 and f2 share one output link. The router they traverse is abstracted as the combination of a switch plus a flow controller depicted in Figure 5(a) and guarantees the service curve .
Since the router performs the weighted round-robin scheduling, the flows are served according to their configured weight, for flow .
The equivalent service curves both flows receive are illustrated in Figure 5(b).
Analysis of Link Sharing
Figure 5. (a) Two flows f1 and f2 share one output link; (b) The equivalent service curve for guaranteed by the router.
16
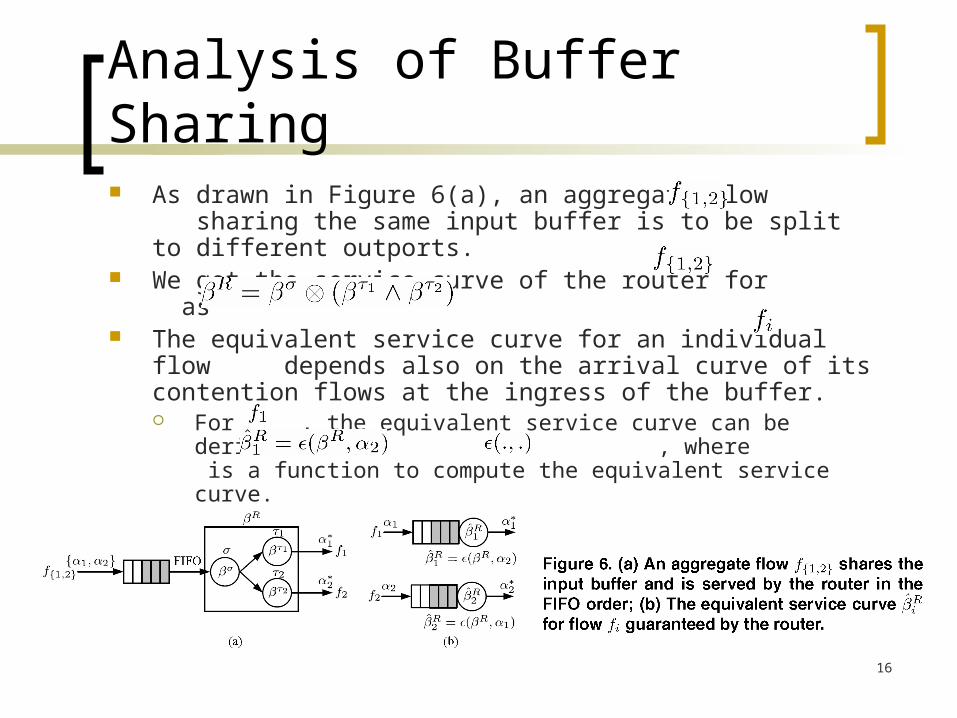
As drawn in Figure 6(a), an aggregate flow sharing the same input buffer is to be split to different outports.
We get the service curve of the router for as .
The equivalent service curve for an individual flow depends also on the arrival curve of its contention flows at the ingress of the buffer. For , the equivalent service curve can be derived as
, where is a function to compute the equivalent service curve.
Analysis of Buffer Sharing

17
Outline
Introduction Resource Sharing in Wormhole Networks Analysis of Resource Sharing The Delay Bound Analysis Technique A Delay-Bound Analysis Example Experimental Results Conclusions
18
The Buffer-Sharing Analysis Model A router serves flows performing the three sharings
concurrently. Combining the three models, we can obtain a simplified analysis model, which “eliminates” the feedback and link contention and keeps only the buffer sharing. This model is called buffer-sharing analysis model/network. For the buffer sharing, the equivalent service curve for each
individual flow depends also on the arrival curve of its contention flows, and can not be separated in general.
This simplification procedure can be viewed as a transformation procedure.
The transformation steps can be generalized as four steps: (1) Build an initial analysis model taking into account of flow
control, link sharing and buffer sharing; (2) Based on the model in step (1), “eliminate” (resolve) flow
control; (3) Based on the model in step (2), “eliminate” link sharing; (4) Based on the model in step (3), derive a buffer-sharing
analysis model.
19
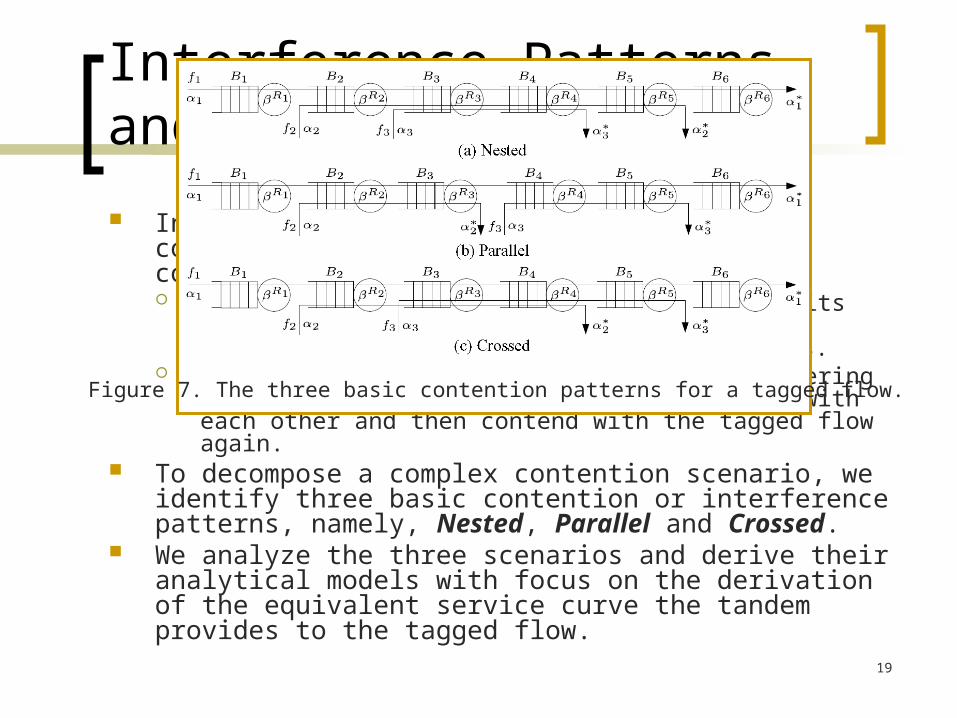
Interference Patterns and Analytical Models
In a buffer-sharing analysis network, flow contention scenarios are diverse and complicated. We call the flow for which we shall derive its delay bound tagged
flow, other flows sharing resources with it contention or interfering flows.
A tagged flow directly contends with interfering flows. Also, interfering flows may contend with each other and then contend with the tagged flow again.
To decompose a complex contention scenario, we identify three basic contention or interference patterns, namely, Nested, Parallel and Crossed.
We analyze the three scenarios and derive their analytical models with focus on the derivation of the equivalent service curve the tandem provides to the tagged flow.
Figure 7. The three basic contention patterns for a tagged flow.
20
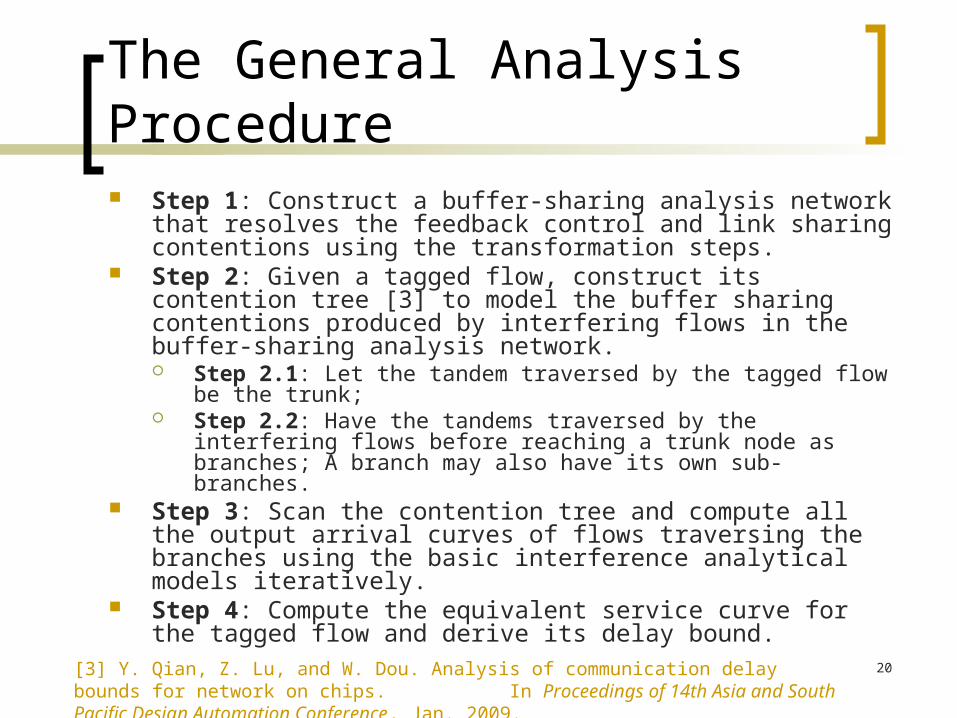
The General Analysis Procedure Step 1: Construct a buffer-sharing analysis network that
resolves the feedback control and link sharing contentions using the transformation steps.
Step 2: Given a tagged flow, construct its contention tree [3] to model the buffer sharing contentions produced by interfering flows in the buffer-sharing analysis network. Step 2.1: Let the tandem traversed by the tagged flow be the
trunk; Step 2.2: Have the tandems traversed by the interfering flows
before reaching a trunk node as branches; A branch may also have its own sub-branches.
Step 3: Scan the contention tree and compute all the output arrival curves of flows traversing the branches using the basic interference analytical models iteratively.
Step 4: Compute the equivalent service curve for the tagged flow and derive its delay bound.
[3] Y. Qian, Z. Lu, and W. Dou. Analysis of communication delay bounds for network on chips. In Proceedings of 14th Asia and South Pacific Design Automation Conference, Jan. 2009.

21
Outline
Introduction Resource Sharing in Wormhole Networks Analysis of Resource Sharing The Delay Bound Analysis Technique A Delay-Bound Analysis Example Experimental Results Conclusions
22
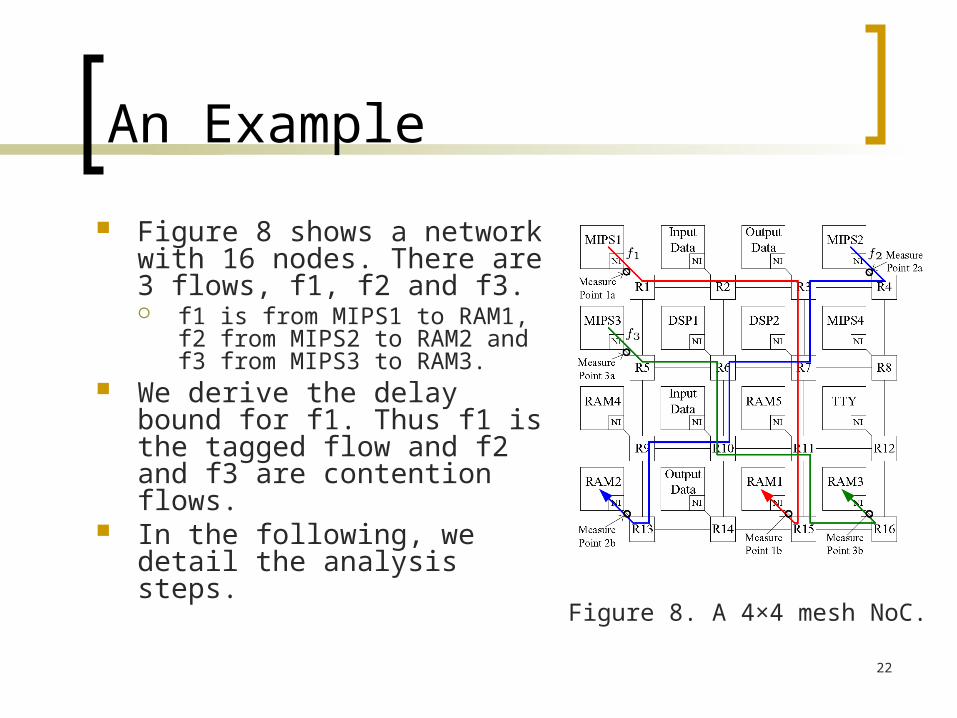
An Example
Figure 8 shows a network with 16 nodes. There are 3 flows, f1, f2 and f3. f1 is from MIPS1 to RAM1, f2
from MIPS2 to RAM2 and f3 from MIPS3 to RAM3.
We derive the delay bound for f1. Thus f1 is the tagged flow and f2 and f3 are contention flows.
In the following, we detail the analysis steps.
Figure 8. A 4×4 mesh NoC.

23
Step 1: Build a buffer-sharing analysis network The initial closed-loop analysis network is shown in Figure
9(a). This network can be simplified into a forward buffer-sharing analysis network, as depicted in Figure 9(b).
Figure 9. (a) An initial closed-loop analysis network; (b) A buffer-sharing analysis network.

24
Step 2: Construct a contention tree
We build a contention tree for f1 as drawn in Figure 10. It shows how flows pass routers, and how they contend for shared buffers. At router R7, f1 and f2 share
buffer B7; At router R15, f1 shares
buffer B15 with f3; At router R10, two contention
flows f2 and f3 share buffer B10.
Figure 10. Contention tree for tagged flow f1.
25
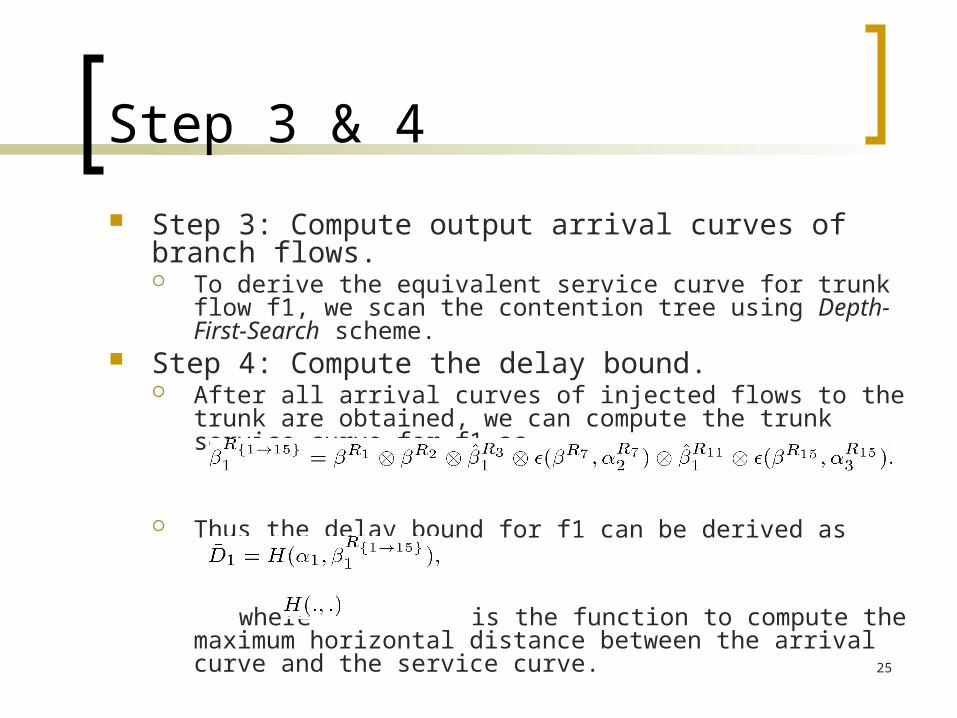
Step 3: Compute output arrival curves of branch flows. To derive the equivalent service curve for trunk flow f1, we
scan the contention tree using Depth-First-Search scheme. Step 4: Compute the delay bound.
After all arrival curves of injected flows to the trunk are obtained, we can compute the trunk service curve for f1 as
Thus the delay bound for f1 can be derived as
where is the function to compute the maximum horizontal distance between the arrival curve and the service curve.
Step 3 & 4

26
Assuming the affine arrival curve for flows and latency-rate service curve for routers, we can obtain closed-form formulas for the delay bound calculation. The arrival curve of is ; The switch service curve ; The buffer size of each router equals to ; Each flow has an equal weight for link sharing, i.e.,
Case 1: When , the least upper delay bound for flow f1 is
Case 2: Analogously, we can compute the delay bound for flow f1 when
Closed-Form Formulas

27
Outline
Introduction Resource Sharing in Wormhole Networks Analysis of Resource Sharing The Delay Bound Analysis Technique A Delay-Bound Analysis Example Experimental Results Conclusions

28
We run three embedded multimedia programs simultaneously on the platform, specifically, an MP3 audio decoder on MIPS1, a JPEG decoder on MIPS2 and an MPEG2 video decoder on MIPS3, generating three flows, f1, f2 and f3, respectively.
We analyzed all the three application traces and derived their affine arrival curves.
Routers are uniform with a per-link service rate C of 1flit/cycle, delaying 5 cycles to process head flits (T=5) and switching flits in one cycle.
The routers use a fair weight for each flow, i.e., flit (i=1,2,3) for the round-robin link scheduling.
The buffer size varies from 3 to 6 flits. We also synthesize three traffic flows according to
the affine arrival curves derived by real traces and run them in the same experimental platform. We shall compare the simulated results of the real traces and their corresponding synthetic traffic flows.
Simulation Setup We use a simulation platform in an open source simulation
environment SoCLib [4] as shown in Figure 11 to collect application traces and to simulate their delays in on-chip networks.
Figure 11. The simulation platform.
[4] SoCLib simulation environment. On-line, available at https://www.soclib.fr/.
29
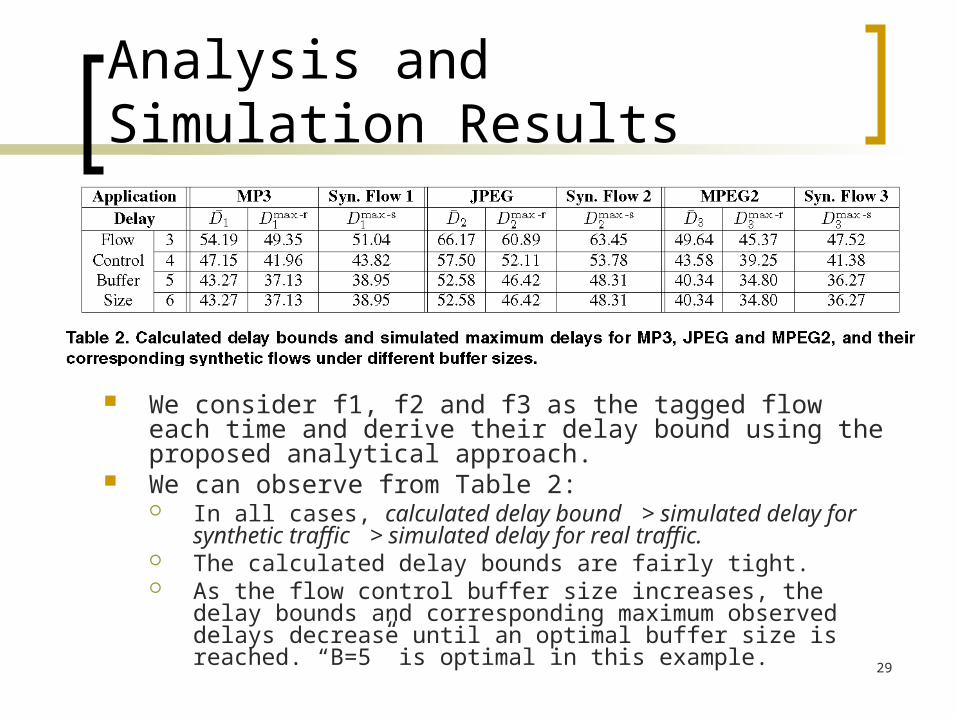
Analysis and Simulation Results
We consider f1, f2 and f3 as the tagged flow each time and derive their delay bound using the proposed analytical approach.
We can observe from Table 2: In all cases, calculated delay bound > simulated delay for
synthetic traffic > simulated delay for real traffic. The calculated delay bounds are fairly tight. As the flow control buffer size increases, the delay bounds and
corresponding maximum observed delays decrease until an optimal buffer size is reached. “B=5” is optimal in this example.
30
Outline
Introduction Resource Sharing in Wormhole Networks Analysis of Resource Sharing The Delay Bound Analysis Technique A Delay-Bound Analysis Example Experimental Results Conclusions
31
Conclusions In this work, we present a network-calculus based
analysis method to compute the worst-case delay bounds for individual flows in best-effort wormhole networks with the credit-based flow control.
Our simulation results with both real on-chip multimedia traces and synthetic traffic validate the correctness and tightness of analysis results.
We conclude that our technique can be used to efficiently compute per-flow worst-case delay bound, which is extremely difficult to cover even by exhaustive simulations.
Our method is topology independent, and thus can be applied to various networks with a regular or irregular topology.
32
Future Work
We have considered wormhole networks where a router contains only one virtual channel per port. We shall extend our analysis to general wormhole networks where a router has multiple virtual channels per port. The analysis technique remains the same. However, we
need to take into account the allocation of virtual channels in our analysis due to the existence of multiple virtual channels.
We will also extend our framework to consider other link sharing algorithms.
Furthermore, we will automate the analysis procedure.
33
Any Questions?
Thank you very much!


![Detecting wormhole attacks in 3D wireless ad hoc …19 Wormhole...Recently proposed wormhole detection algorithms focus on wireless network coding system [1], delay tolerant net- works](https://static.fdocuments.in/doc/165x107/5fd567e514077f0a20239b9e/detecting-wormhole-attacks-in-3d-wireless-ad-hoc-19-wormhole-recently-proposed.jpg)
