Using color in complex visualizations Greg Trafton Naval Research Laboratory.
Upload
dayana-fritterCategory
view
213download
0
1
Aerodynamics PDR 2Aerodynamics PDR 2
Ashley Brawner
Neelam Datta
Xing Huang
Jesse Jones
Team 2: Balsa to the Wall
Matt NegilskiMike Palumbo
Chris SelbyTara Trafton

2
OverviewOverview
Design Point Airfoil Selection Component Drag Buildup Drag Polar AR trade study (CL)max Approximation
(Cl)max method
(CL)max Raymer method Flap analysis

3
The Design PointThe Design Point
Weight 5.5 [lbs]
Dihedral Angle 0°
Speed 110 [ft/sec]
Horizontal Tail Span
1.5 [ft]
Planform area based on approximated (CL)max and weight estimate
Dihedral angle of 0° taken from Roskam
Design speed decreased from 150 ft/sec
Designed to high speed mission
4
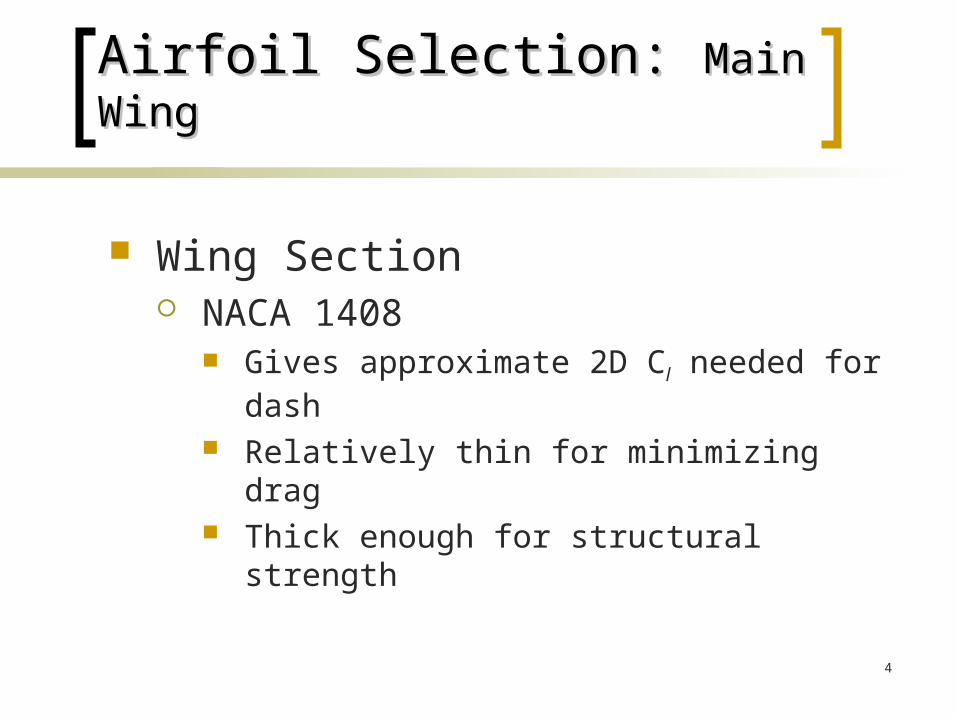
Airfoil Selection: Airfoil Selection: Main WingMain Wing
Wing Section NACA 1408
Gives approximate 2D Cl needed for dash Relatively thin for minimizing drag Thick enough for structural strength

5
XFOIL: Drag Polar
-0.6
-0.5
-0.4
-0.3
-0.2
-0.1
0
0.1
0.2
0.3
0.4
0.5
0.6
0.7
0.8
0.9
1
1.1
1.2
0 0.005 0.01 0.015 0.02 0.025 0.03
Cd
Cl
Jones_main1
NACA 1408
MH 30
MH 64

6
Airfoil Selection: Airfoil Selection: TailTail
Tail Sections Horizontal Stabilizer
Symmetric with low Cd over a wider range of a.o.a. compared to other similar airfoils
Symmetric Jones airfoil (≈8% t/c) Vertical Stabilizer
NACA 0006

7
Various airfoils Cd vs. alpha
0.004
0.005
0.006
0.007
0.008
0.009
0.01
0.011
0.012
0.013
0 0.5 1 1.5 2 2.5 3 3.5 4 4.5 5
alpha [deg]
Cd
Symmetric Jones (7% t/c)
NACA 0006
NACA 0007
NACA 0008
Symmetric Jones (6% t/c)
Symmetric Jones (8% t/c)

8
Drag Build-up Method (Raymer)Drag Build-up Method (Raymer)
Cfc = Component skin friction coefficient
FFc = Component form factor
Qc = Component interference effects
Swet,c = Component wetted area
Sref = Wing planform
ref
c cwetccfcD S
SQFFCC
,0

9
Component Coefficient of frictionComponent Coefficient of friction
10
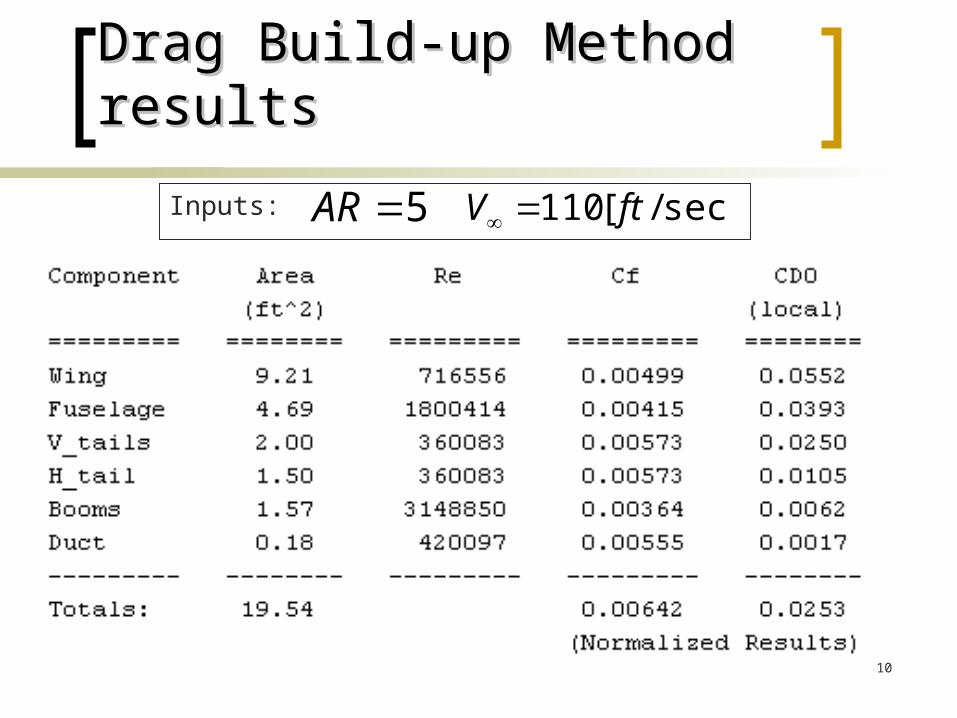
Drag Build-up Method resultsDrag Build-up Method results
5AR 5AR
5AR
5AR sec]/[110 ftV Inputs:

11-1 -0.8 -0.6 -0.4 -0.2 0 0.2 0.4 0.6 0.8 1
0.2
0.3
0.4
0.5
0.6
0.7
0.8
0.9Drag Polar
CD
CL
Drag PolarDrag Polar
20707.0253. LD CC
iDDD CCC ,0
eARk
1
20 LDD kCCC

12
AR Trade studyAR Trade study
elseallARfC
RaymerARfeeAR
k
kCC
CCC
D
LiD
iDDD
,
)(
1
0
2,
,0
LD
D
CARfC
ARfC
constelseall
,
.
0

13
AR Trade studyAR Trade studyLines of constant C
D (An AR trade study)
AR
CL
0.02550.026 0.0265
0.027 0.0275 0.0280.029
0.03
0.035
0.04
0.05
0.06
0.08
0.10.12
3 4 5 6 7 8 9 10 11 120
0.2
0.4
0.6
0.8
1
1.2

14
(C(Cll))maxmax Approximation Approximation
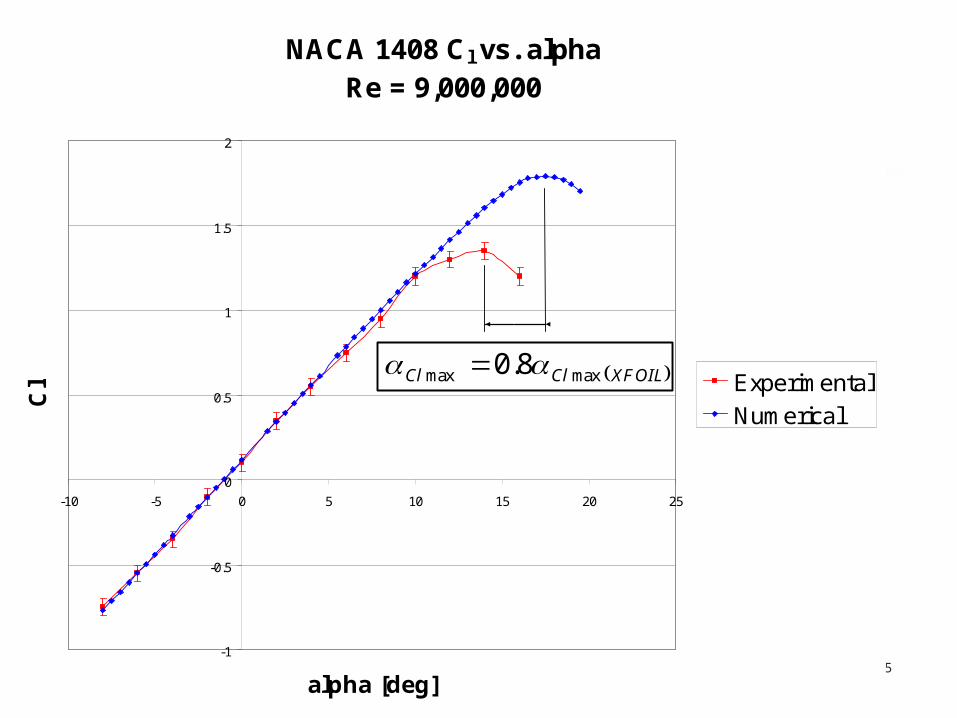
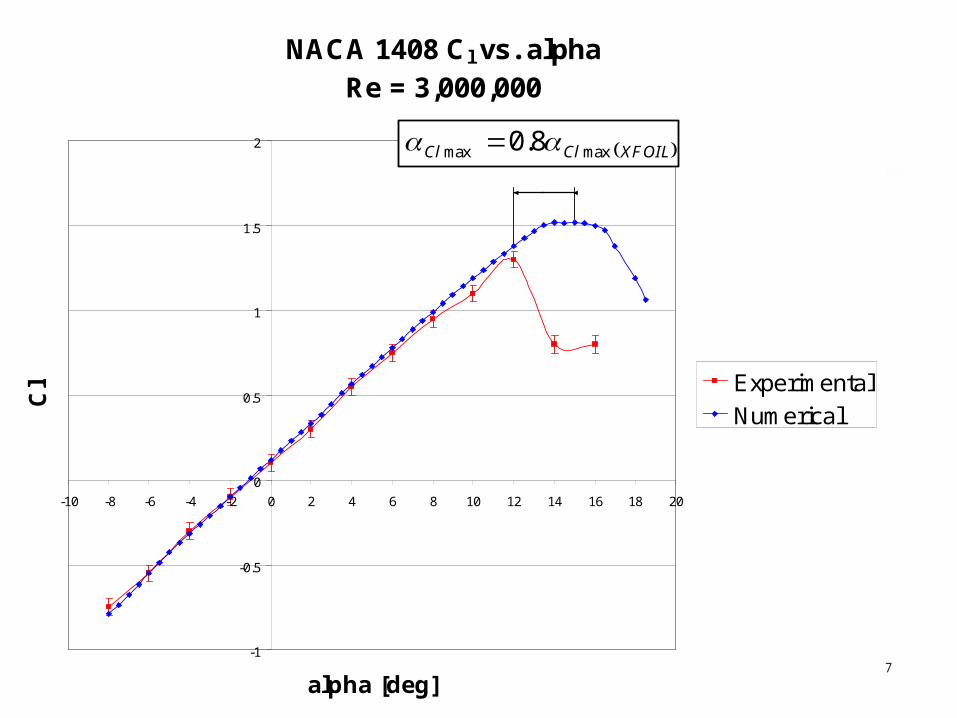
Compare XFOIL with Abbott & Doenhoff wind tunnel data
Conclusion αClmax ≈ 0.8αClmax(XFOIL)
15
NACA 1408 Cl vs. alphaRe = 9,000,000
-1
-0.5
0
0.5
1
1.5
2
-10 -5 0 5 10 15 20 25
alpha [deg]
Cl Experimental
Numerical
XFOILClCl maxmax 8.0
16
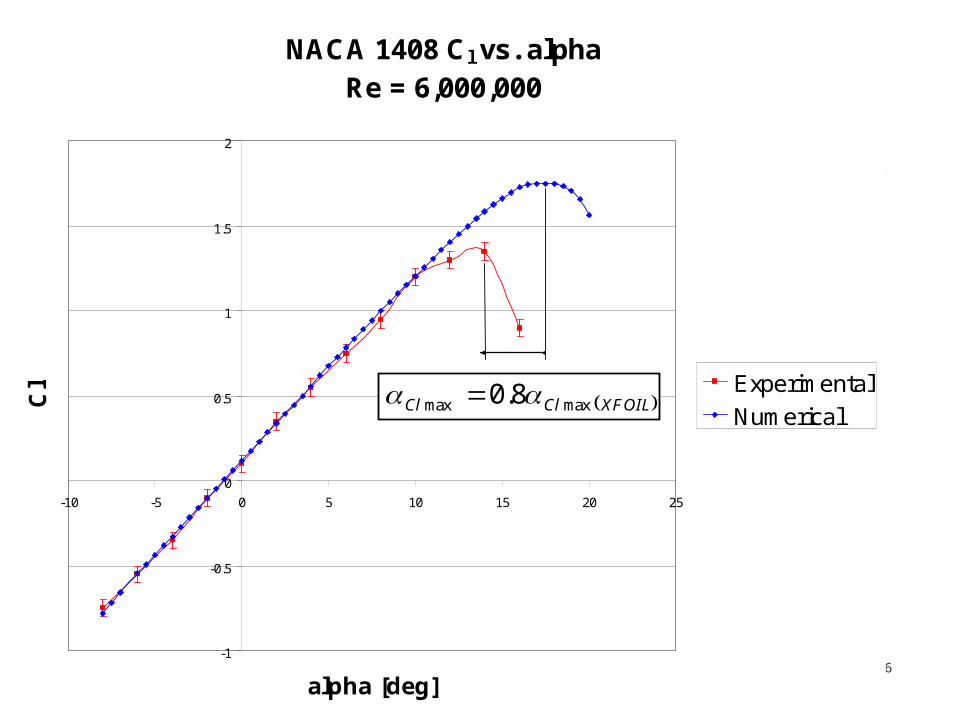
NACA 1408 Cl vs. alphaRe = 6,000,000
-1
-0.5
0
0.5
1
1.5
2
-10 -5 0 5 10 15 20 25
alpha [deg]
Cl Experimental
Numerical XFOILClCl maxmax 8.0
17
NACA 1408 Cl vs. alphaRe = 3,000,000
-1
-0.5
0
0.5
1
1.5
2
-10 -8 -6 -4 -2 0 2 4 6 8 10 12 14 16 18 20
alpha [deg]
Cl Experimental
Numerical
XFOILClCl maxmax 8.0

18
NACA 1408 Cl vs. alphaRe = 500,000
0
0.2
0.4
0.6
0.8
1
1.2
0 2 4 6 8 10 12
alpha [deg]
Cl
XFOILClCl maxmax 8.0
Clmax = .9412 (clean)

19
Flap analysisFlap analysis
Use (CL)max approximation from Raymer Ads
Use XFOIL to find (Cl)max with flaps Observation -
Flapped (Cl)max follows linear trend Determine maximum achievable (CL)max Find flap configuration that acheives optimal
(CL)max
max,max_max, Ll
LflappedlL C
C
CCC

20
XFOIL: NACA 1408 Cl vs. alphaRe= 500,000
0
0.2
0.4
0.6
0.8
1
1.2
1.4
1.6
1.8
0 2 4 6 8 10 12
alpha [deg]
Cl
Clean
Flap: x/c=0.8, 20 degrees
Flap: x/c=0.8, 30 degrees
Flap: x/c=0.75, 20 degrees
Flap: x/c=0.75, 30 degrees
Flap: x/c=0.85, 20 degrees
Flap: x/c=0.85, 30 degrees

21
NACA 1408 Clmax vs. alphaRe = 500,000
y = -0.1113x + 1.8911
R2 = 0.997
y = 0.0975x + 0.1765
R2 = 0.9998
0
0.2
0.4
0.6
0.8
1
1.2
1.4
1.6
1.8
0 1 2 3 4 5 6 7 8 9
alpha [deg]
Clm
ax
Clmax with flaps
Naca 1408 (clean)
Linear (Clmax with flaps)
Linear (Naca 1408 (clean))

22
Flap analysis: (continued)Flap analysis: (continued)
Use linear fit lines to find a Δ(Cl)max and then find Δ(CL)max with the following equation from Raymer: ads
The ratio blank is based on the intial sizing of the wing area and tail span and is assumed to remain constant
HLflapped
ll
LL S
SC
C
CC
cosmax,max,
S
S flapped

23
Flap Geometry:Flap Geometry:
flap hinge location (x/c) = 0.8 maximum flap deflection = 35° constant (cf/c) flap
(CL)max (w/ flaps) = 1.06
(Cl)max (w/o flaps) = 0.85

24
Summary TableSummary Table
(CL)max (w/ flaps) 1.06
(CL)max (w/o flaps) 0.84
CD0 0.0253
AR 6
b 5 [ft]
croot 16.24 [in]
ctip 7.35 [in]
troot 1.3 [in]
ttip 0.6 [in]
Flap location (x/c) 0.8
Maximum flap deflection 35°

25
Questions?Questions?