
1 AEIC Annual Load Research Conference September 12, 2006 - Reno, NV ERCOT Residential Profile ID...
44
1 AEIC Annual Load Research Conference September 12, 2006 - Reno, NV ERCOT Residential Profile ID Assignments – Dealing with Assignment Accuracy and Migration Presented By: Diana Ott Carl Raish
-
Upload
samson-lyons -
Category
Documents
-
view
213 -
download
0
Transcript of 1 AEIC Annual Load Research Conference September 12, 2006 - Reno, NV ERCOT Residential Profile ID...
1
AEIC Annual Load Research Conference September 12, 2006 - Reno, NV
ERCOT
Residential Profile ID Assignments – Dealing with Assignment
Accuracy and Migration
Presented By: Diana Ott
Carl Raish

2
Overview• ERCOT Settlement highlights
• Residential Annual Validation
• Heating Fuel Type Residential Survey
• Impact of Miss-Assignment of Residential Load Profile ID Assignment
• New Residential Algorithm
• Q & A
3
Settlement• ERCOT requires a fifteen (15) minute settlement interval
• Vast majority of Customers do not have this level of granularity.
• Profiles are created using adjusted static models• Models are dependent on season, day of week, time of
day and weather• Backcasted Profiles are generated the day following a
trade day and used for all settlements (initial, final and true-up)
• Load Profiling:• Converts monthly NIDR reads to fifteen (15) minute
intervals• Enables the accounting of energy usage in settlements• Allows the participation of these Customers in the retail
market (reduces barrier to entry)
4
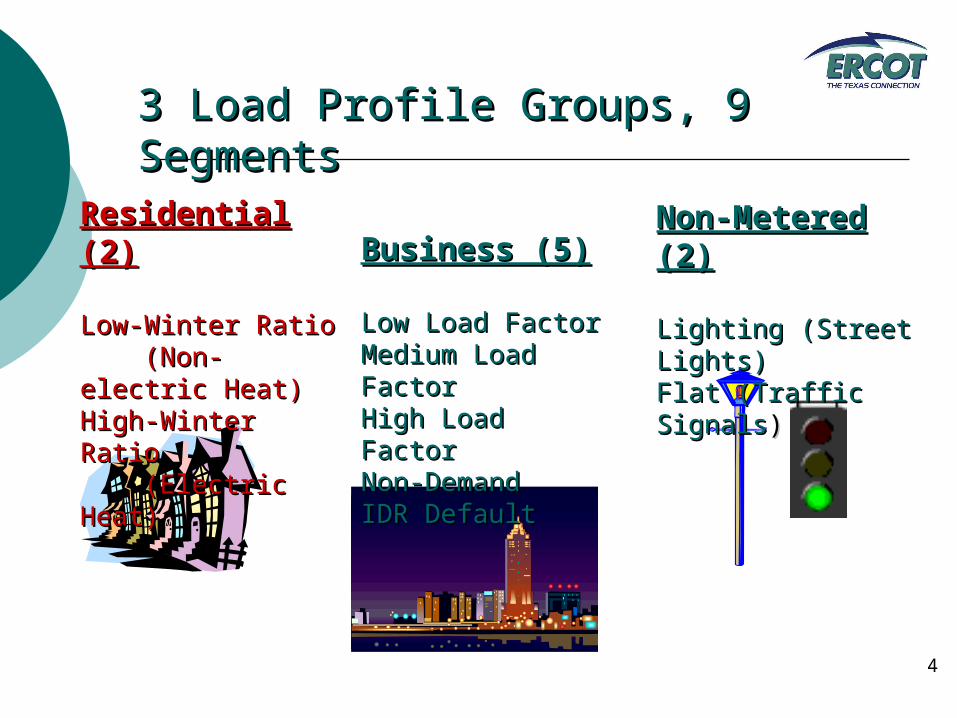
3 Load Profile Groups, 9 Segments3 Load Profile Groups, 9 Segments
Residential (2)Residential (2)
Low-Winter RatioLow-Winter Ratio (Non-electric Heat)(Non-electric Heat)High-Winter RatioHigh-Winter Ratio (Electric Heat)(Electric Heat)
Business (5)Business (5)
Low Load FactorLow Load FactorMedium Load FactorMedium Load FactorHigh Load FactorHigh Load FactorNon-DemandNon-DemandIDR DefaultIDR Default
Non-Metered (2)Non-Metered (2)
Lighting (Street Lights)Lighting (Street Lights)Flat (Traffic SignalsFlat (Traffic Signals))
5
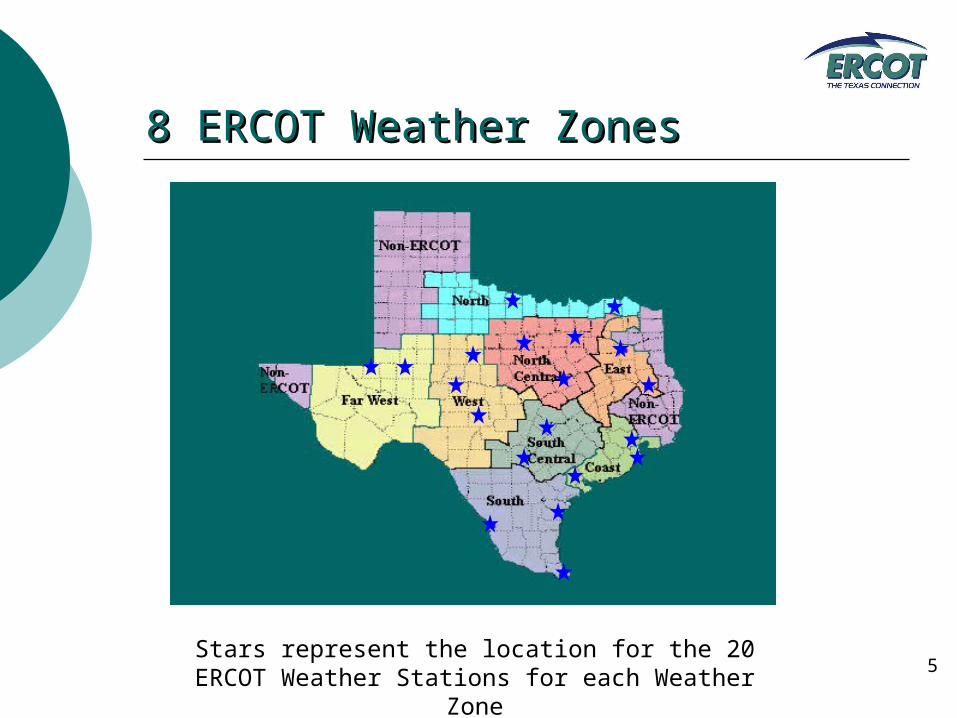
8 ERCOT Weather Zones8 ERCOT Weather Zones
Stars represent the location for the 20 ERCOT Weather Stations for each Weather Zone
6
• ERCOT in conjunction with Profiling Working Group establishes the rules for Profile ID assignment and publishes in the form of a Decision Tree on the ERCOT website
• Annual Validation is a process established by the Market to annually review and update Profile ID assignments based on the rules defined in the Decision Tree
• Historically, May 1 thru April 31 meter reads were used to determine the Annual Validation assignment. The process normally began in June and completed in January.
Annual Validation of Profile Assignments
7
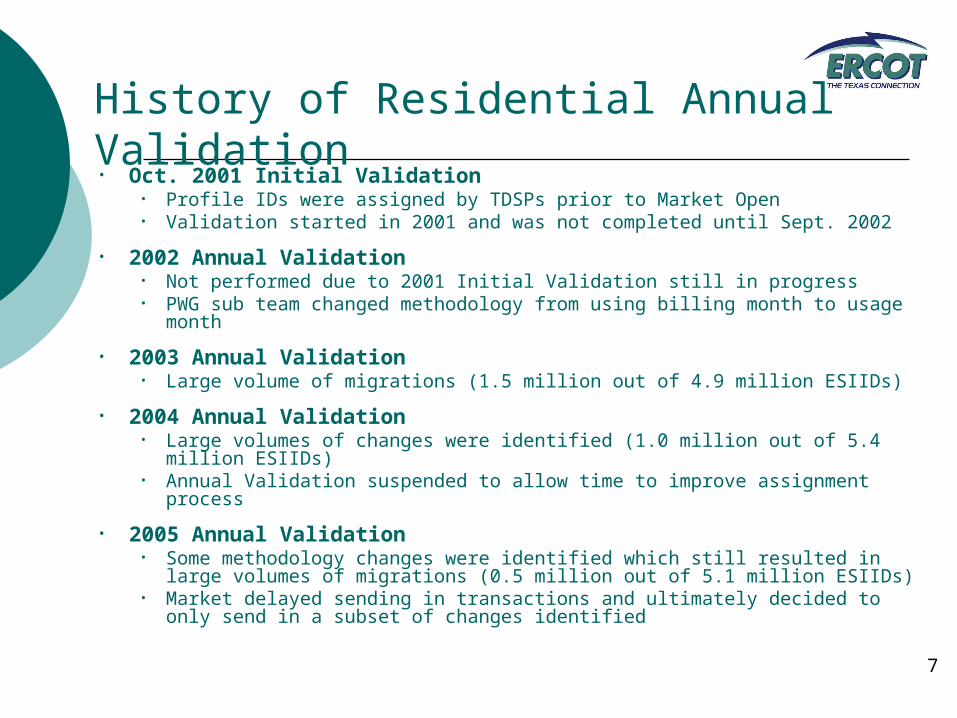
• Oct. 2001 Initial Validation• Profile IDs were assigned by TDSPs prior to Market Open• Validation started in 2001 and was not completed until Sept. 2002
• 2002 Annual Validation• Not performed due to 2001 Initial Validation still in progress • PWG sub team changed methodology from using billing month to usage month
• 2003 Annual Validation• Large volume of migrations (1.5 million out of 4.9 million ESIIDs)
• 2004 Annual Validation• Large volumes of changes were identified (1.0 million out of 5.4 million ESIIDs)• Annual Validation suspended to allow time to improve assignment process
• 2005 Annual Validation • Some methodology changes were identified which still resulted in large volumes
of migrations (0.5 million out of 5.1 million ESIIDs)• Market delayed sending in transactions and ultimately decided to only send in a
subset of changes identified
History of Residential Annual Validation
8
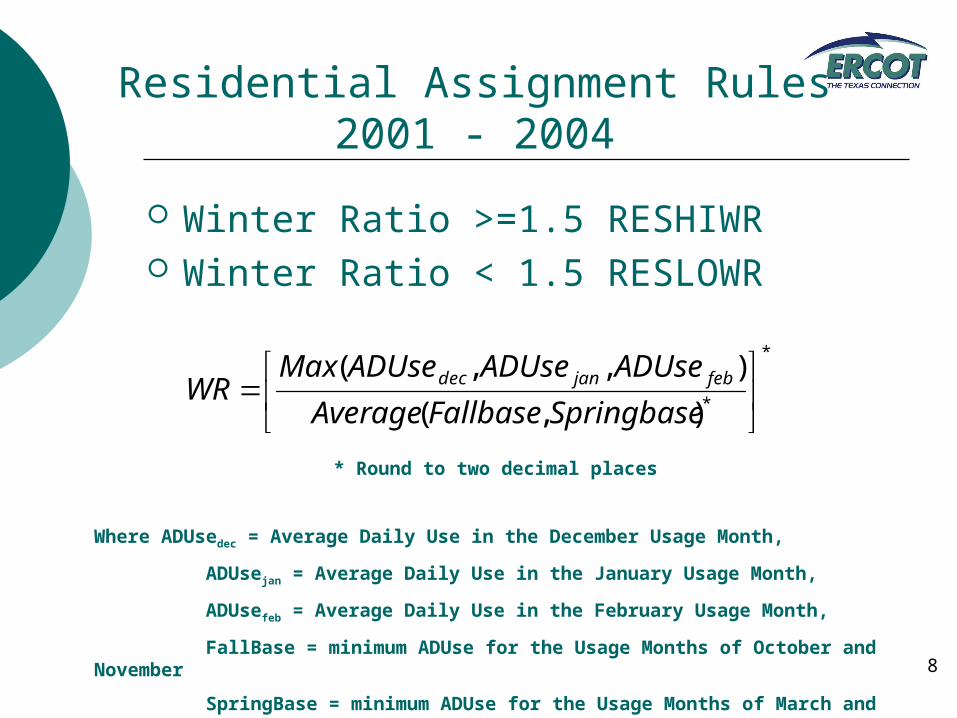
Residential Assignment Rules2001 - 2004
Winter Ratio >=1.5 RESHIWR Winter Ratio < 1.5 RESLOWR
* Round to two decimal places
Where ADUsedec = Average Daily Use in the December Usage Month,
ADUsejan = Average Daily Use in the January Usage Month,
ADUsefeb = Average Daily Use in the February Usage Month,
FallBase = minimum ADUse for the Usage Months of October and November
SpringBase = minimum ADUse for the Usage Months of March and April.
*
*),(
),,(
SpringbaseFallbaseAverage
ADUseADUseADUseMaxWR febjandec
9
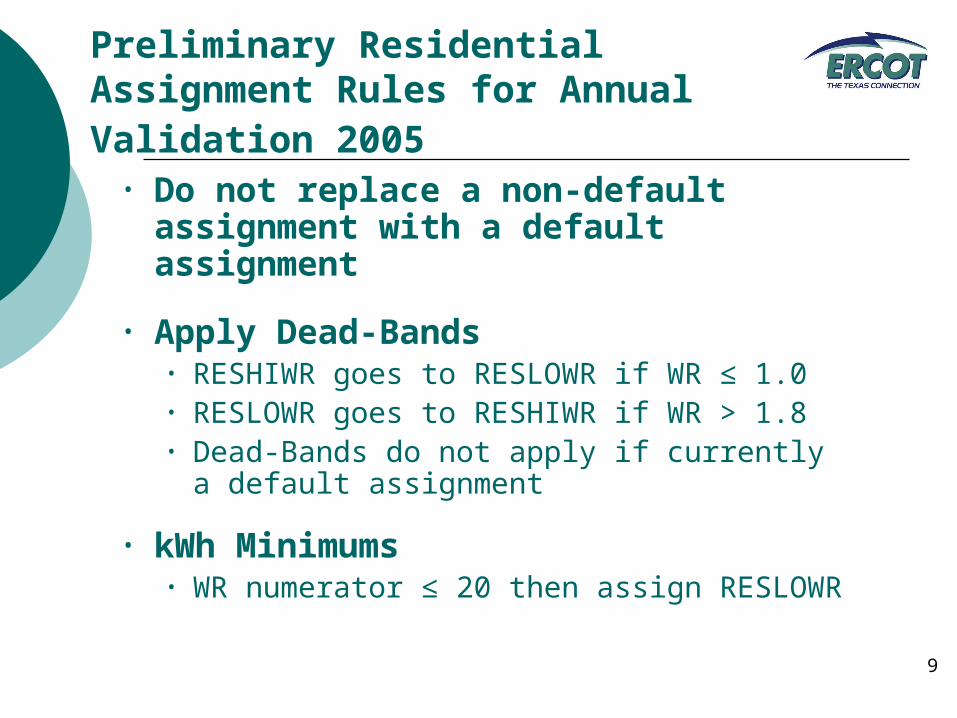
Preliminary Residential Assignment Rules for Annual Validation 2005
• Do not replace a non-default assignment with a default assignment
• Apply Dead-Bands• RESHIWR goes to RESLOWR if WR ≤ 1.0• RESLOWR goes to RESHIWR if WR > 1.8• Dead-Bands do not apply if currently a
default assignment
• kWh Minimums• WR numerator ≤ 20 then assign RESLOWR
10
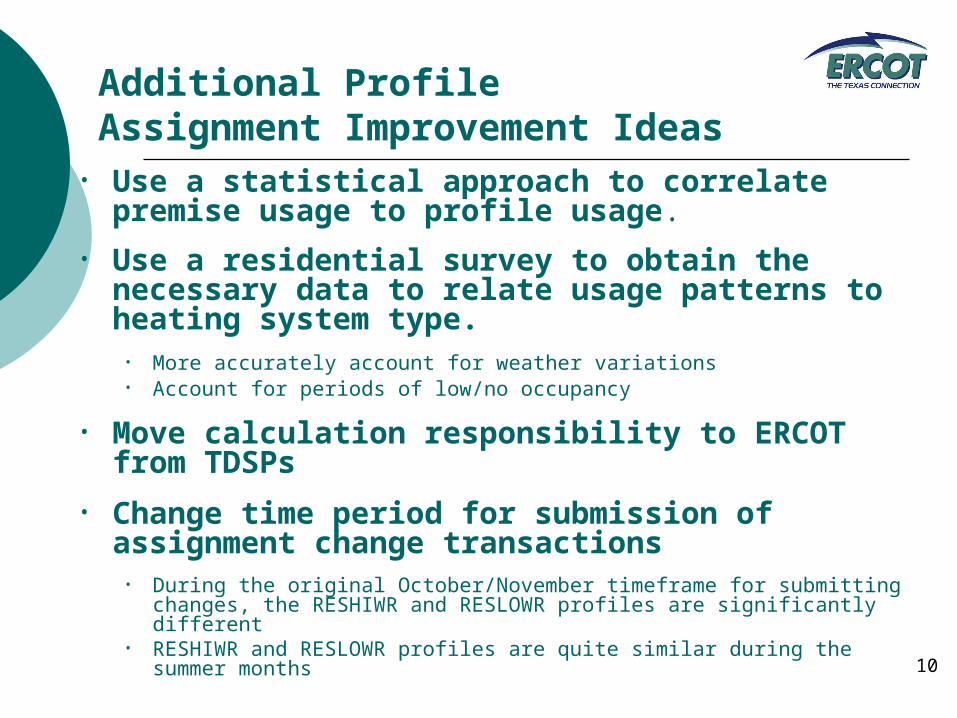
Additional Profile Assignment Improvement Ideas
• Use a statistical approach to correlate premise usage to profile usage.
• Use a residential survey to obtain the necessary data to relate usage patterns to heating system type.
• More accurately account for weather variations• Account for periods of low/no occupancy
• Move calculation responsibility to ERCOT from TDSPs
• Change time period for submission of assignment change transactions
• During the original October/November timeframe for submitting changes, the RESHIWR and RESLOWR profiles are significantly different
• RESHIWR and RESLOWR profiles are quite similar during the summer months
11
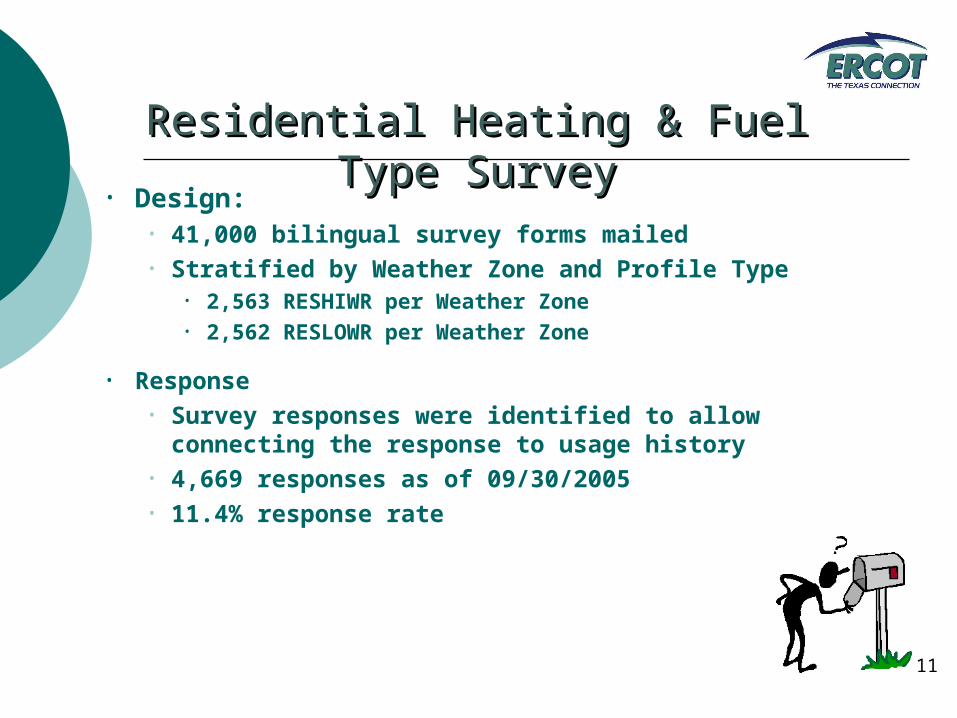
Residential Heating & Fuel Type SurveyResidential Heating & Fuel Type Survey
• Design:• 41,000 bilingual survey forms mailed• Stratified by Weather Zone and Profile Type
• 2,563 RESHIWR per Weather Zone• 2,562 RESLOWR per Weather Zone
• Response• Survey responses were identified to allow connecting the
response to usage history• 4,669 responses as of 09/30/2005• 11.4% response rate
12
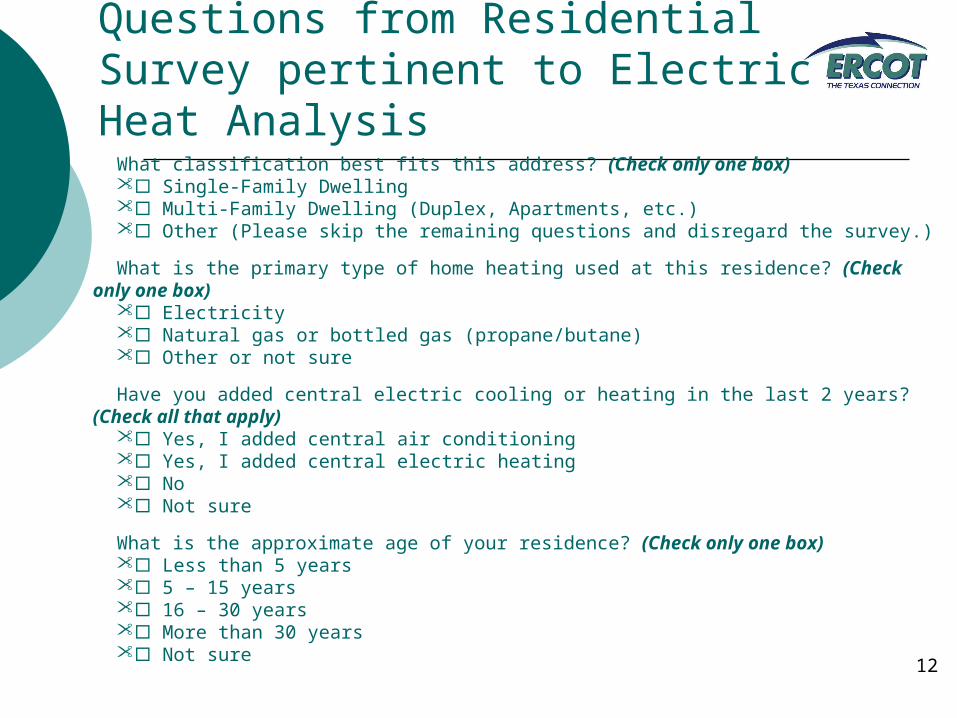
Questions from Residential Survey pertinent to Electric Heat Analysis
What classification best fits this address? (Check only one box) Single-Family Dwelling Multi-Family Dwelling (Duplex, Apartments, etc.) Other (Please skip the remaining questions and disregard the survey.)
What is the primary type of home heating used at this residence? (Check only one box) Electricity Natural gas or bottled gas (propane/butane) Other or not sure
Have you added central electric cooling or heating in the last 2 years? (Check all that apply) Yes, I added central air conditioning Yes, I added central electric heating No Not sure
What is the approximate age of your residence? (Check only one box) Less than 5 years 5 – 15 years 16 – 30 years More than 30 years Not sure
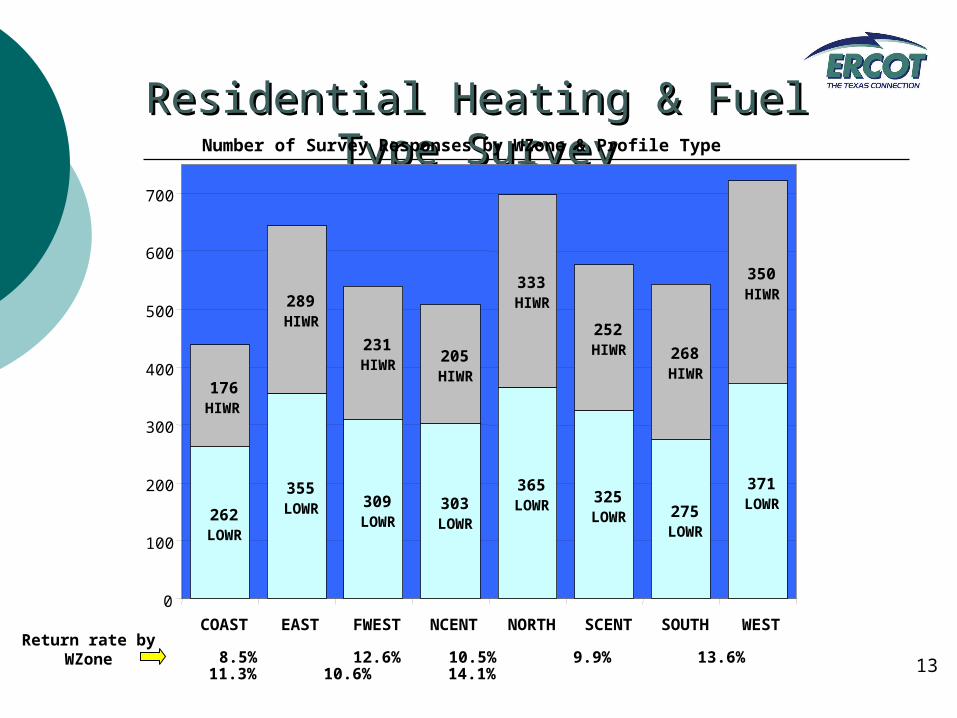
13 8.5% 12.6% 10.5% 9.9% 13.6% 11.3% 10.6% 14.1%Return rate by
WZone
Residential Heating & Fuel Type SurveyResidential Heating & Fuel Type SurveyNumber of Survey Responses by WZone & Profile Type
371LOWR275
LOWR
325LOWR
365LOWR303
LOWR
309LOWR
355LOWR262
LOWR
350HIWR
268HIWR
252HIWR
333HIWR
205HIWR
231HIWR
289HIWR
176HIWR
0
100
200
300
400
500
600
700
COAST EAST FWEST NCENT NORTH SCENT SOUTH WEST
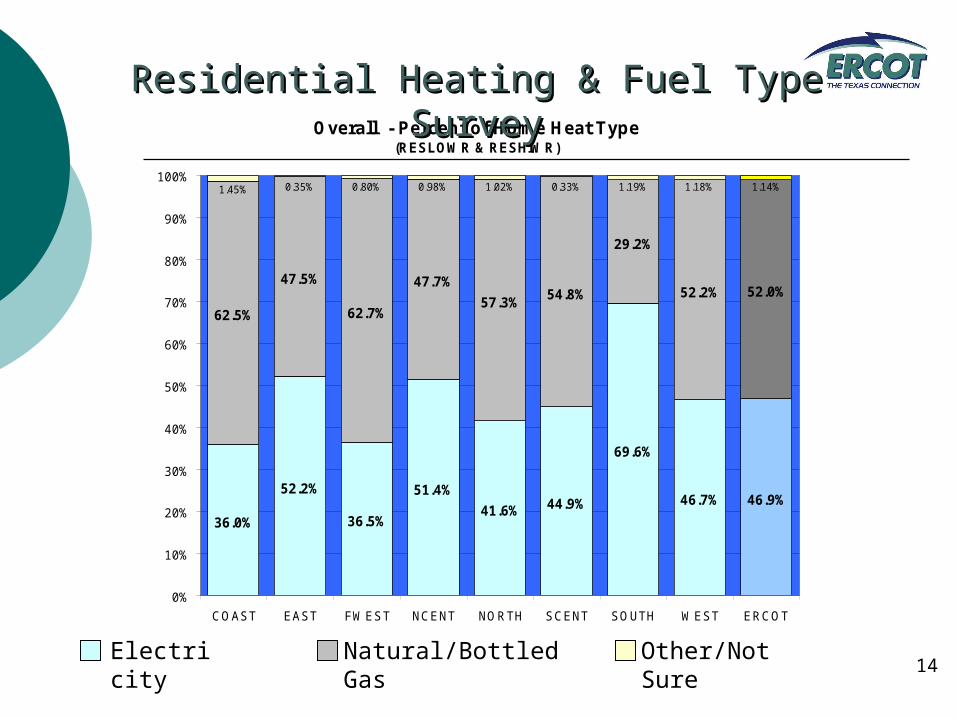
14Electricity Natural/Bottled Gas Other/Not Sure
Overall - Percent of Home Heat Type(RESLOWR & RESHIWR)
36.0%
52.2%
36.5%
51.4%
41.6% 44.9%
69.6%
46.7% 46.9%
62.5%
47.5%
62.7%
47.7%
57.3%54.8%
29.2%
52.2% 52.0%
0.35% 0.80% 0.98% 1.02% 0.33% 1.19% 1.18% 1.14%1.45%
0%
10%
20%
30%
40%
50%
60%
70%
80%
90%
100%
COAST EAST FWEST NCENT NORTH SCENT SOUTH WEST ERCOT
Residential Heating & Fuel Type SurveyResidential Heating & Fuel Type Survey
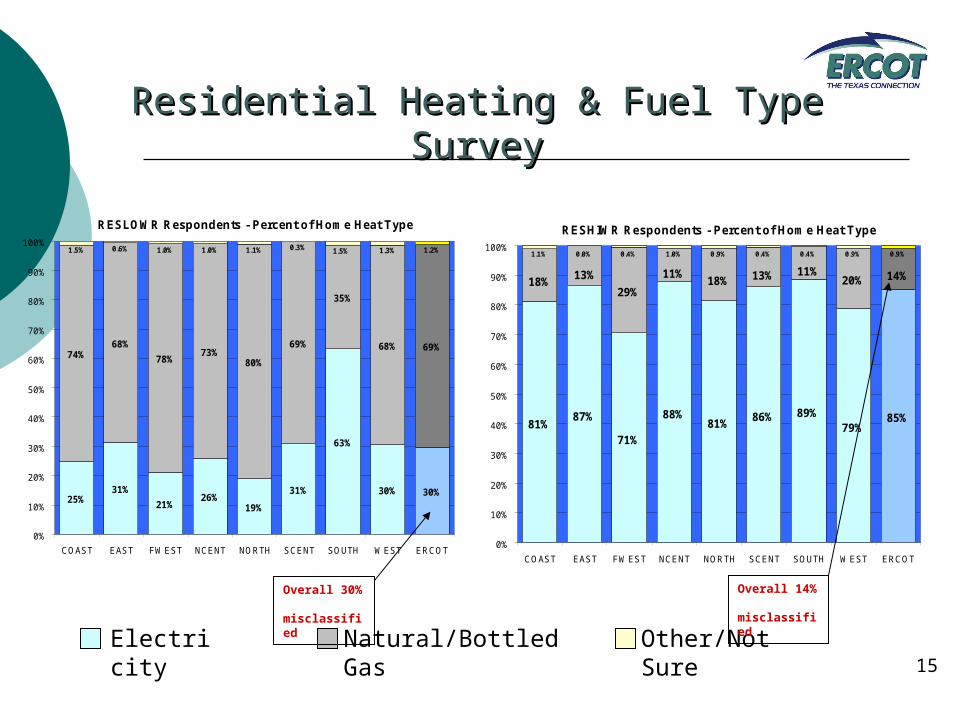
15Electricity Natural/Bottled Gas Other/Not Sure
RESLOWR Respondents - Percent of Home Heat Type
25%31%
21%26%
19%
31%
63%
30% 30%
74%68%
78%73%
80%
69%
35%
68% 69%
1.0% 1.0% 1.1% 1.2%0.6% 0.3% 1.3%1.5%1.5%
0%
10%
20%
30%
40%
50%
60%
70%
80%
90%
100%
COAST EAST FWEST NCENT NORTH SCENT SOUTH WEST ERCOT
RESHIWR Respondents - Percent of Home Heat Type
81%87%
71%
88%81%
86% 89%79%
85%
29%20%
1.1% 0.0% 0.4% 1.0% 0.9% 0.4% 0.4% 0.9% 0.9%
14%11%13%18%11%13%
18%
0%
10%
20%
30%
40%
50%
60%
70%
80%
90%
100%
COAST EAST FWEST NCENT NORTH SCENT SOUTH WEST ERCOT
Residential Heating & Fuel Type SurveyResidential Heating & Fuel Type Survey
Overall 14% misclassified
Overall 30% misclassified
16
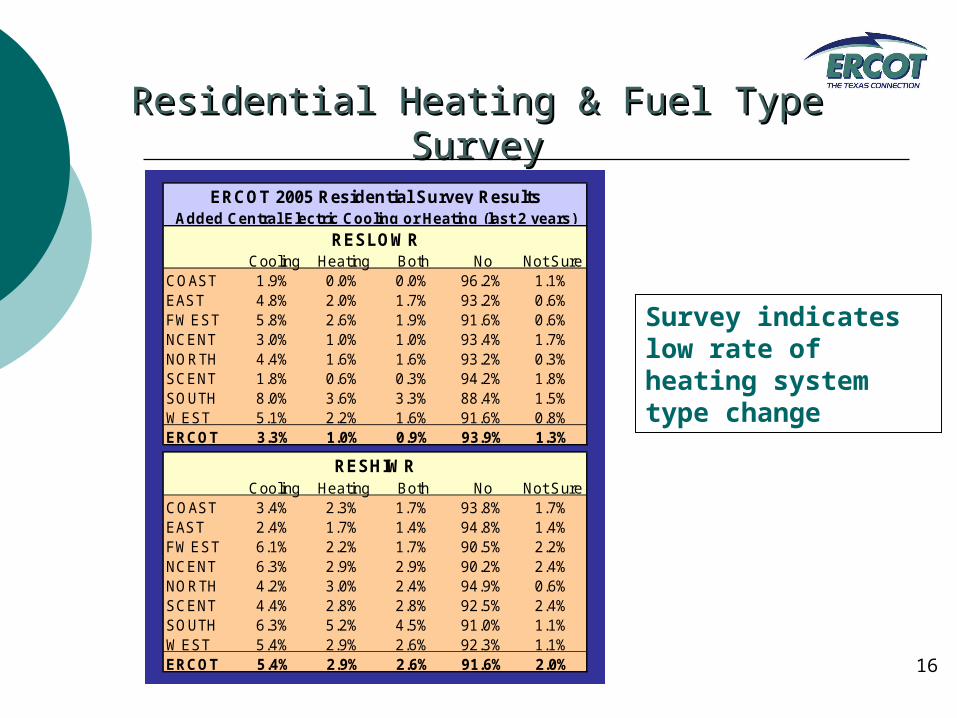
Cooling Heating Both No Not SureCOAST 1.9% 0.0% 0.0% 96.2% 1.1%EAST 4.8% 2.0% 1.7% 93.2% 0.6%FWEST 5.8% 2.6% 1.9% 91.6% 0.6%NCENT 3.0% 1.0% 1.0% 93.4% 1.7%NORTH 4.4% 1.6% 1.6% 93.2% 0.3%SCENT 1.8% 0.6% 0.3% 94.2% 1.8%SOUTH 8.0% 3.6% 3.3% 88.4% 1.5%WEST 5.1% 2.2% 1.6% 91.6% 0.8%ERCOT 3.3% 1.0% 0.9% 93.9% 1.3%
Cooling Heating Both No Not SureCOAST 3.4% 2.3% 1.7% 93.8% 1.7%EAST 2.4% 1.7% 1.4% 94.8% 1.4%FWEST 6.1% 2.2% 1.7% 90.5% 2.2%NCENT 6.3% 2.9% 2.9% 90.2% 2.4%NORTH 4.2% 3.0% 2.4% 94.9% 0.6%SCENT 4.4% 2.8% 2.8% 92.5% 2.4%SOUTH 6.3% 5.2% 4.5% 91.0% 1.1%WEST 5.4% 2.9% 2.6% 92.3% 1.1%ERCOT 5.4% 2.9% 2.6% 91.6% 2.0%
ERCOT 2005 Residential Survey ResultsAdded Central Electric Cooling or Heating (last 2 years)
RESLOWR
RESHIWR
Residential Heating & Fuel Type SurveyResidential Heating & Fuel Type Survey
Survey indicates low rate of heating system type change
17
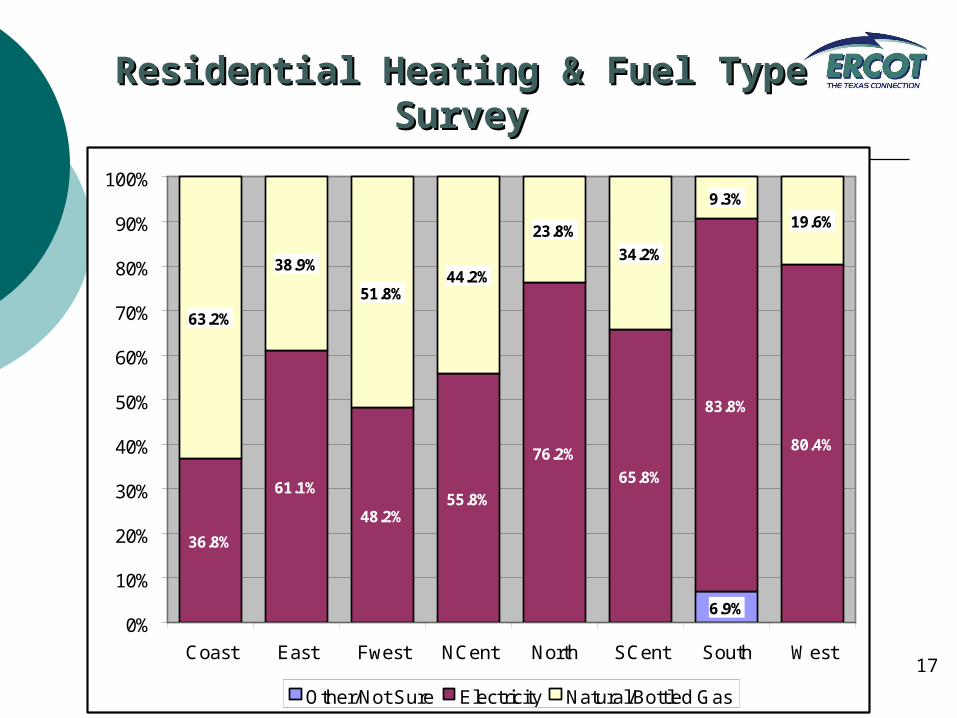
Residential Heating & Fuel Type SurveyResidential Heating & Fuel Type Survey
Primary Home Heat % for Homes Less than 5 yearsPrimary Home Heat % for Homes Less than 5 years
6.9%
36.8%
61.1%
48.2%55.8%
76.2%
65.8%
83.8%
80.4%
63.2%
38.9%
51.8%44.2%
23.8%
34.2%
9.3%
19.6%
0%
10%
20%
30%
40%
50%
60%
70%
80%
90%
100%
Coast East Fwest NCent North SCent South West
Other/Not Sure Electricity Natural/Bottled Gas
18
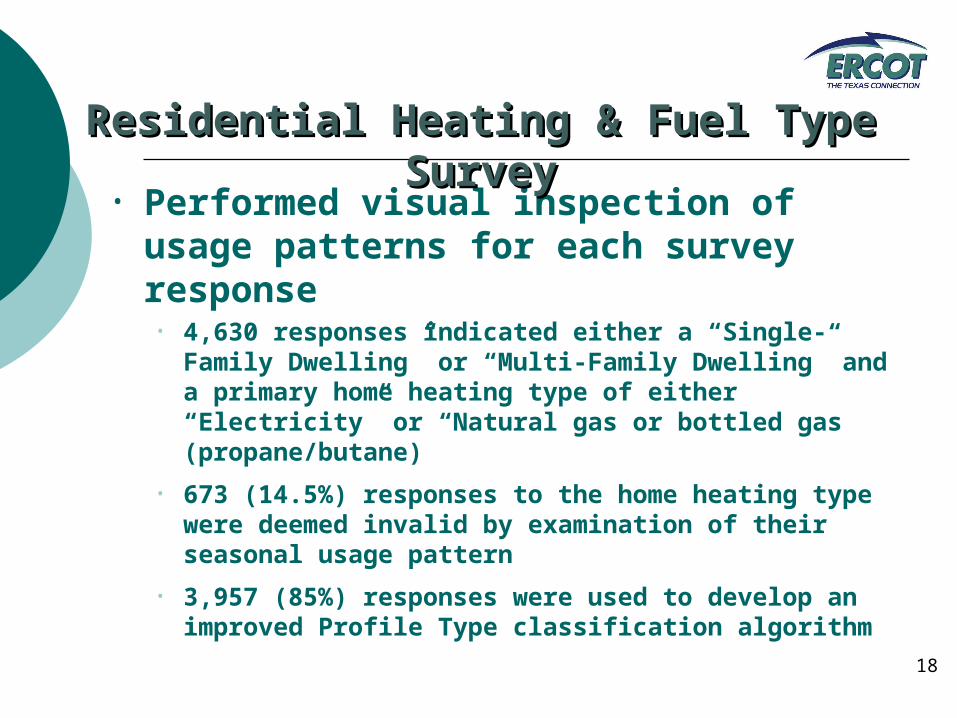
• Performed visual inspection of usage patterns for each survey response
• 4,630 responses indicated either a “Single-Family Dwelling” or “Multi-Family Dwelling” and a primary home heating type of either “Electricity” or “Natural gas or bottled gas (propane/butane)
• 673 (14.5%) responses to the home heating type were deemed invalid by examination of their seasonal usage pattern
• 3,957 (85%) responses were used to develop an improved Profile Type classification algorithm
Residential Heating & Fuel Type SurveyResidential Heating & Fuel Type Survey
19
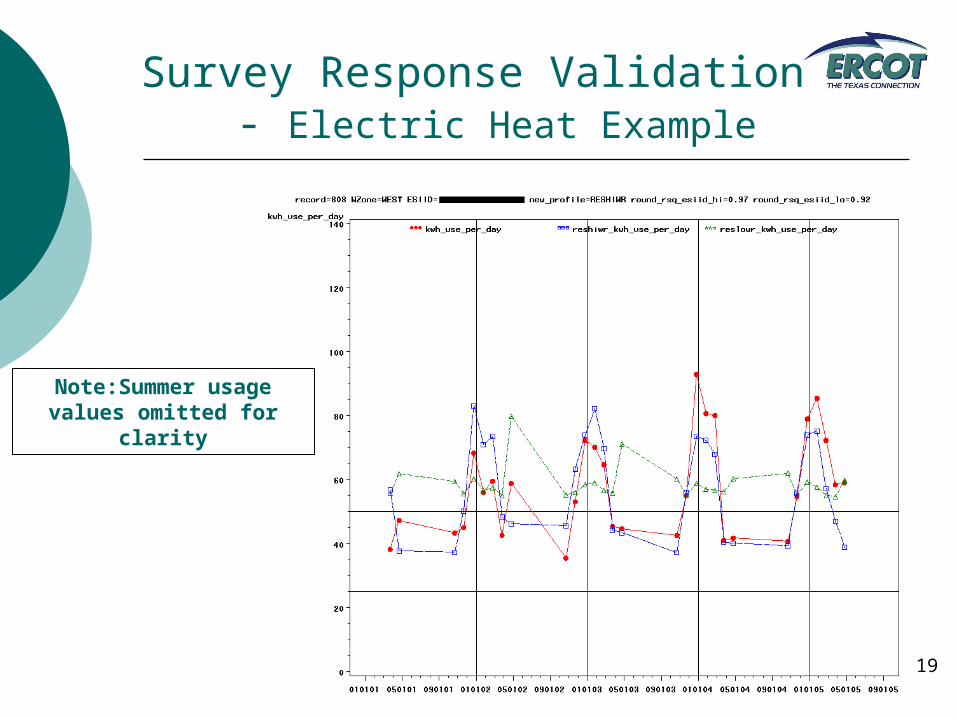
Survey Response Validation- Electric Heat Example
Note:Summer usage values omitted for clarity
20
What we found out from the Survey • Saturation of Electric Heat varied considerably across weather
zones
• Saturation of Electric Heat was inconsistent with breakdown between RESHIWR and RESLOWR
• 30% of Survey responders reporting Electric Heat were assigned to RESLOWR
• 14% of Survey responders reporting No Electric Heat were assigned to RESHIWR
• There is very little year-to-year change in heating system fuel actually occurring
• The percent of newer homes using electric heat varies considerably across weather zones
(37% Coast – 84 South %)
21
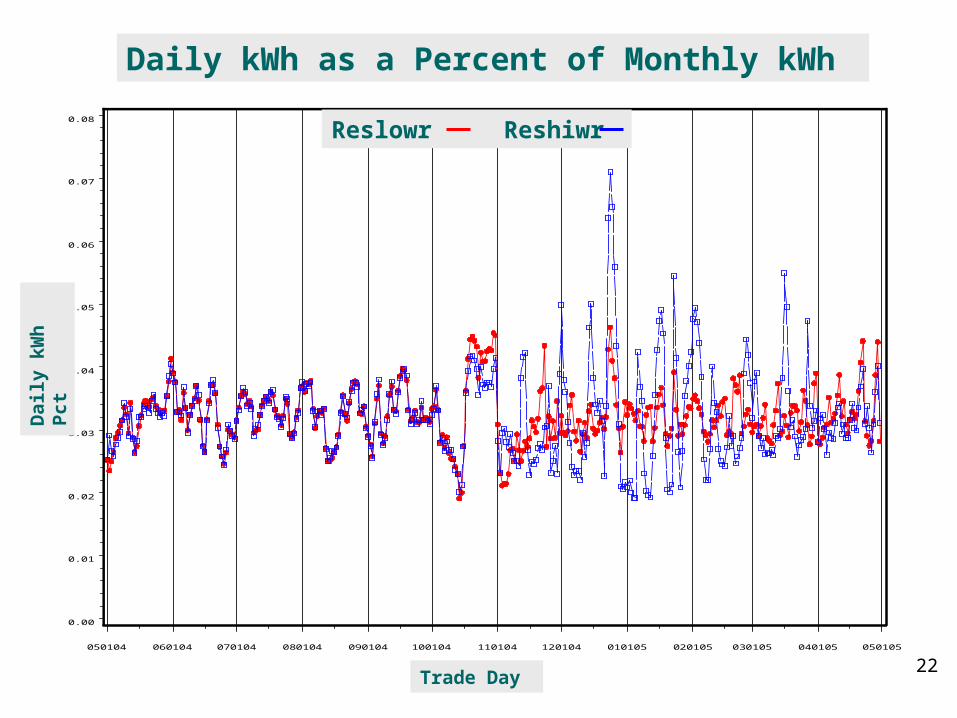
Why Does Assignment Accuracy Matter?
• Profile assignment errors create two types of load profile estimation errors
• Assignment of billing kWh to the days within the billing period
• (RESHIWR assigns more kWh than RESLOWR to cold days)
• Assignment of daily kWh to the intervals within the day
• (RESHIWR assigns more kWh to morning intervals)
22
wzone=COAST gr oup=2004/ 05
mon_ pct _ l o mon_ pct _ hi
Dai l y Per cent
0. 00
0. 01
0. 02
0. 03
0. 04
0. 05
0. 06
0. 07
0. 08
usedat e
050104 060104 070104 080104 090104 100104 110104 120104 010105 020105 030105 040105 050105
Daily kWh as a Percent of Monthly kWh
Reslowr Reshiwr
Trade Day
Dai
ly k
Wh
Pc
t
23
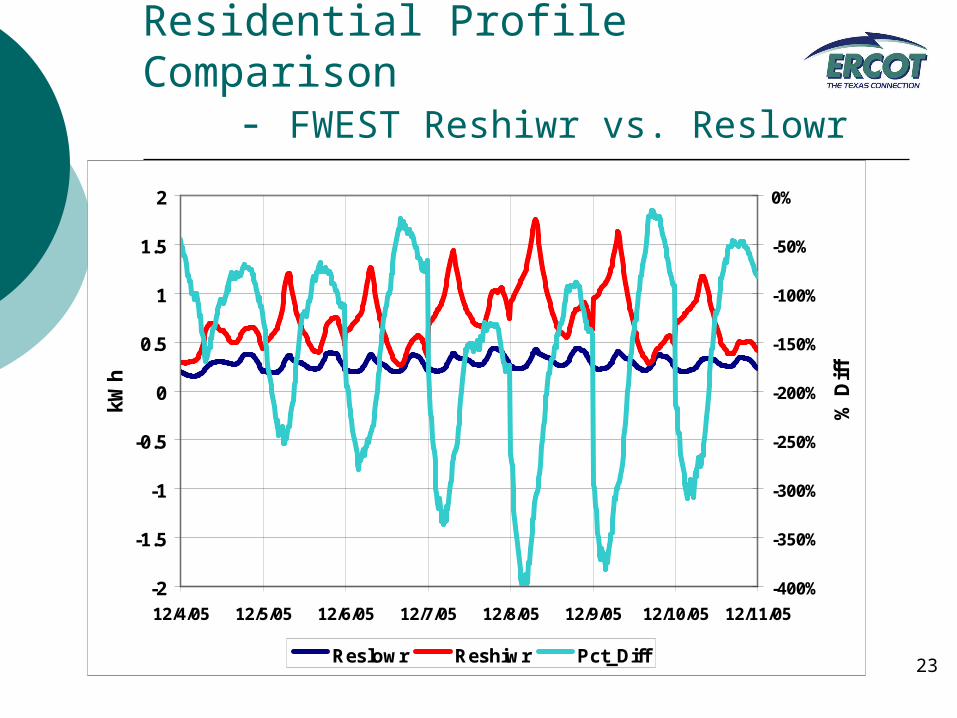
Residential Profile Comparison- FWEST Reshiwr vs. Reslowr
-2
-1.5
-1
-0.5
0
0.5
1
1.5
2
12/4/05 12/5/05 12/6/05 12/7/05 12/8/05 12/9/05 12/10/05 12/11/05
kW
h
-400%
-350%
-300%
-250%
-200%
-150%
-100%
-50%
0%
% D
iff
Reslowr Reshiwr Pct_Diff
24
Findings and Next Steps• ERCOT’s Profile ID Assignment process has resulted in
unacceptably high migration rates
• Dead - bands would reduce migration but could do more harm than good in terms of assignment accuracy
• The impact of Profile ID miss-assignment is significant at the ESIID level
• Undertake an effort to develop a new and improved assignment process with a goal of reducing migration and improving accuracy
• More improvements are needed
25
Classification Algorithm Overview• Use Residential Survey response data in conjunction with
responder usage data to build an algorithm to predict heating fuel
• Use regression between actual meter readings for a premise and the RESHIWR and RESLOWR profile kWh for the same time periods
• Use reads during shoulder and winter months for several (4.5) years
• Omit reads during periods of very low use (no/low occupancy)
• Omit outlier reads and require some reads to exceed a minimum kWh/day threshold in order to assign RESHIWR
• Assign the better fitting profile to the ESIID
26
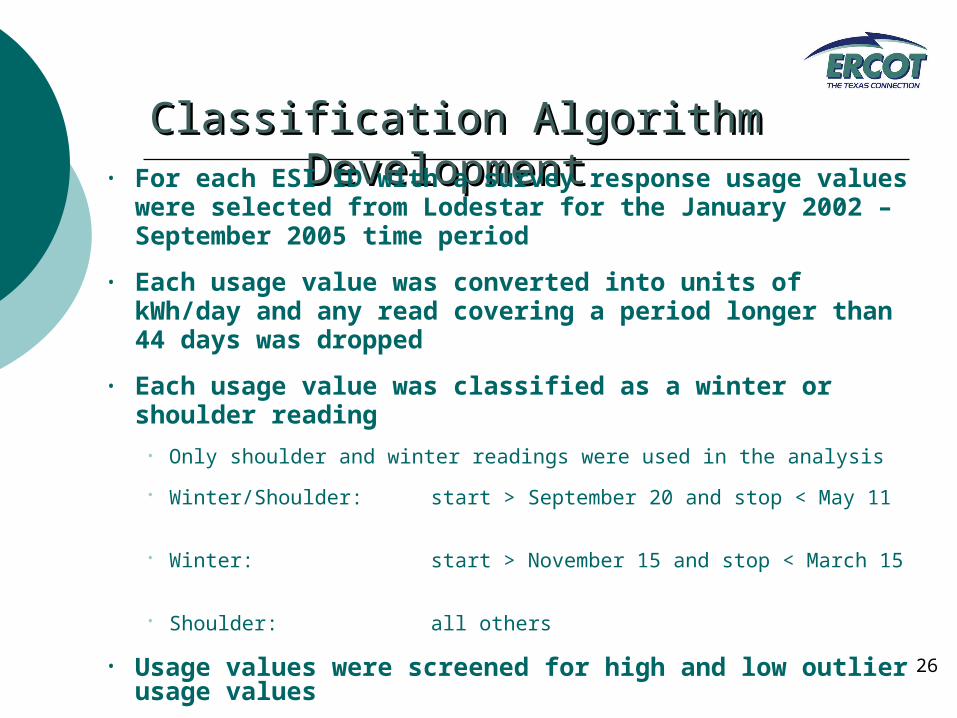
Classification Algorithm DevelopmentClassification Algorithm Development • For each ESI ID with a survey response usage values were
selected from Lodestar for the January 2002 – September 2005 time period
• Each usage value was converted into units of kWh/day and any read covering a period longer than 44 days was dropped
• Each usage value was classified as a winter or shoulder reading
• Only shoulder and winter readings were used in the analysis
• Winter/Shoulder: start > September 20 and stop < May 11
• Winter: start > November 15 and stop < March 15
• Shoulder: all others
• Usage values were screened for high and low outlier usage values
27
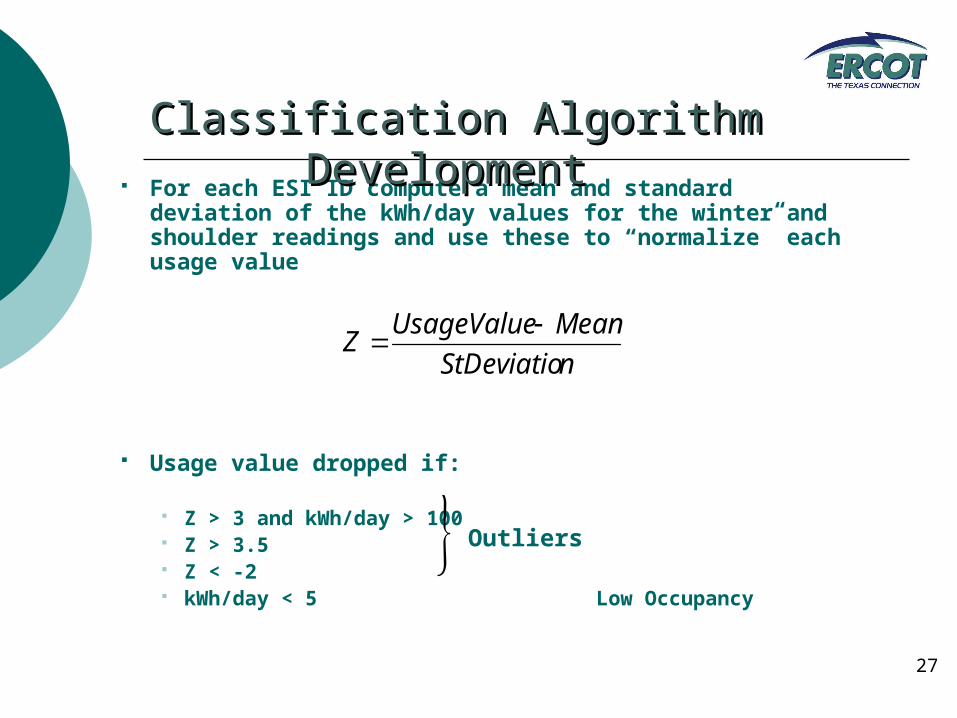
For each ESI ID compute a mean and standard deviation of the kWh/day values for the winter and shoulder readings and use these to “normalize” each usage value
Usage value dropped if:
Z > 3 and kWh/day > 100 Z > 3.5 Z < -2 kWh/day < 5 Low Occupancy
nStDeviatio
MeanUsageValueZ
Outliers
Classification Algorithm DevelopmentClassification Algorithm Development
28
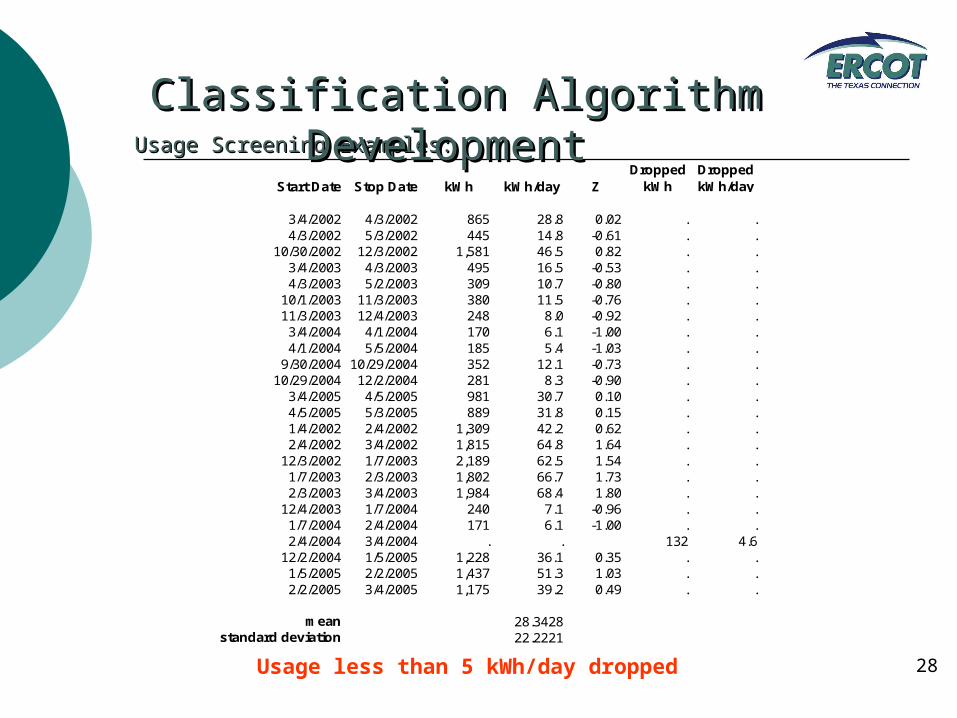
Usage Screening Examples:Usage Screening Examples:
Start Date Stop Date kWh kWh/day ZDropped
kWhDropped kWh/day
3/4/2002 4/3/2002 865 28.8 0.02 . .4/3/2002 5/3/2002 445 14.8 -0.61 . .
10/30/2002 12/3/2002 1,581 46.5 0.82 . .3/4/2003 4/3/2003 495 16.5 -0.53 . .4/3/2003 5/2/2003 309 10.7 -0.80 . .
10/1/2003 11/3/2003 380 11.5 -0.76 . .11/3/2003 12/4/2003 248 8.0 -0.92 . .
3/4/2004 4/1/2004 170 6.1 -1.00 . .4/1/2004 5/5/2004 185 5.4 -1.03 . .
9/30/2004 10/29/2004 352 12.1 -0.73 . .10/29/2004 12/2/2004 281 8.3 -0.90 . .
3/4/2005 4/5/2005 981 30.7 0.10 . .4/5/2005 5/3/2005 889 31.8 0.15 . .1/4/2002 2/4/2002 1,309 42.2 0.62 . .2/4/2002 3/4/2002 1,815 64.8 1.64 . .
12/3/2002 1/7/2003 2,189 62.5 1.54 . .1/7/2003 2/3/2003 1,802 66.7 1.73 . .2/3/2003 3/4/2003 1,984 68.4 1.80 . .
12/4/2003 1/7/2004 240 7.1 -0.96 . .1/7/2004 2/4/2004 171 6.1 -1.00 . .2/4/2004 3/4/2004 . . 132 4.6
12/2/2004 1/5/2005 1,228 36.1 0.35 . .1/5/2005 2/2/2005 1,437 51.3 1.03 . .2/2/2005 3/4/2005 1,175 39.2 0.49 . .
mean 28.3428standard deviation 22.2221
Usage less than 5 kWh/day dropped
Classification Algorithm DevelopmentClassification Algorithm Development
29
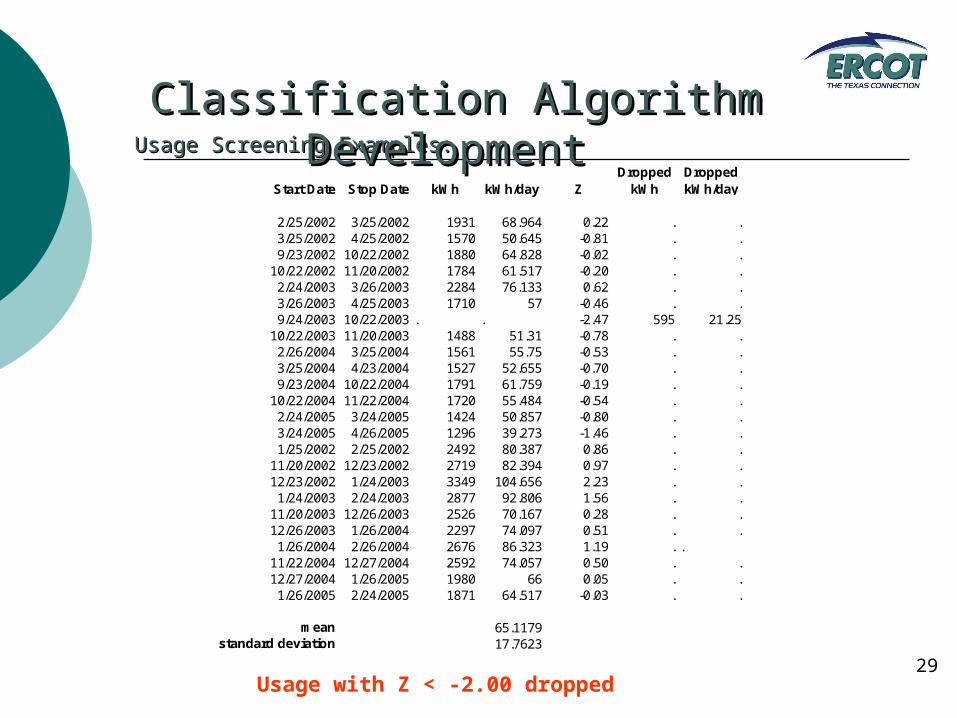
Usage Screening Examples:Usage Screening Examples:
Start Date Stop Date kWh kWh/day ZDropped
kWhDropped kWh/day
2/25/2002 3/25/2002 1931 68.964 0.22 . .3/25/2002 4/25/2002 1570 50.645 -0.81 . .9/23/2002 10/22/2002 1880 64.828 -0.02 . .
10/22/2002 11/20/2002 1784 61.517 -0.20 . .2/24/2003 3/26/2003 2284 76.133 0.62 . .3/26/2003 4/25/2003 1710 57 -0.46 . .9/24/2003 10/22/2003 . . -2.47 595 21.25
10/22/2003 11/20/2003 1488 51.31 -0.78 . .2/26/2004 3/25/2004 1561 55.75 -0.53 . .3/25/2004 4/23/2004 1527 52.655 -0.70 . .9/23/2004 10/22/2004 1791 61.759 -0.19 . .
10/22/2004 11/22/2004 1720 55.484 -0.54 . .2/24/2005 3/24/2005 1424 50.857 -0.80 . .3/24/2005 4/26/2005 1296 39.273 -1.46 . .1/25/2002 2/25/2002 2492 80.387 0.86 . .
11/20/2002 12/23/2002 2719 82.394 0.97 . .12/23/2002 1/24/2003 3349 104.656 2.23 . .
1/24/2003 2/24/2003 2877 92.806 1.56 . .11/20/2003 12/26/2003 2526 70.167 0.28 . .12/26/2003 1/26/2004 2297 74.097 0.51 . .
1/26/2004 2/26/2004 2676 86.323 1.19 . .11/22/2004 12/27/2004 2592 74.057 0.50 . .12/27/2004 1/26/2005 1980 66 0.05 . .
1/26/2005 2/24/2005 1871 64.517 -0.03 . .
mean 65.1179standard deviation 17.7623
Usage with Z < -2.00 dropped
Classification Algorithm DevelopmentClassification Algorithm Development
30
Usage Screening ResultsUsage Screening Results
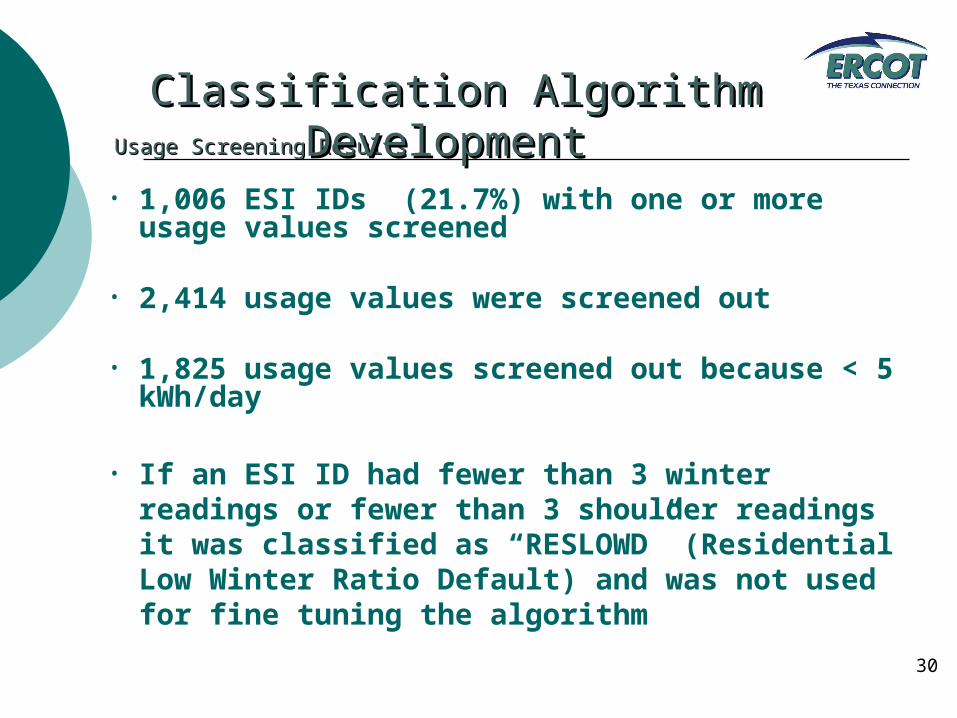
• 1,006 ESI IDs (21.7%) with one or more usage values screened
• 2,414 usage values were screened out
• 1,825 usage values screened out because < 5 kWh/day
• If an ESI ID had fewer than 3 winter readings or fewer than 3 shoulder readings it was classified as “RESLOWD” (Residential Low Winter Ratio Default) and was not used for fine tuning the algorithm
Classification Algorithm DevelopmentClassification Algorithm Development
31
Algorithm BasicsAlgorithm Basics
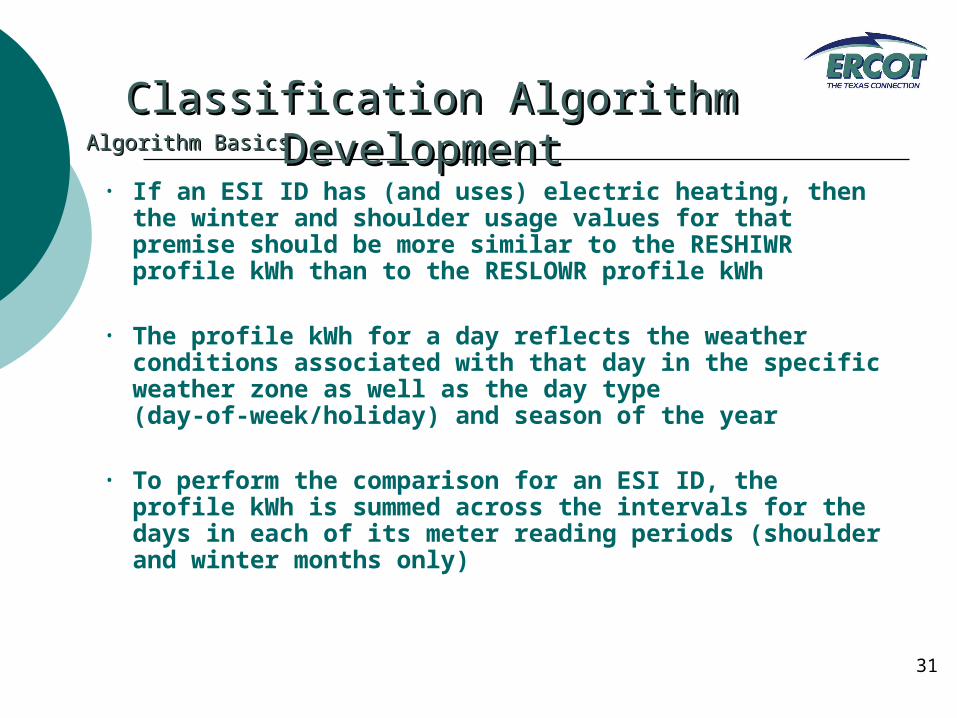
• If an ESI ID has (and uses) electric heating, then the winter and shoulder usage values for that premise should be more similar to the RESHIWR profile kWh than to the RESLOWR profile kWh
• The profile kWh for a day reflects the weather conditions associated with that day in the specific weather zone as well as the day type (day-of-week/holiday) and season of the year
• To perform the comparison for an ESI ID, the profile kWh is summed across the intervals for the days in each of its meter reading periods (shoulder and winter months only)
Classification Algorithm DevelopmentClassification Algorithm Development
32
Algorithm BasicsAlgorithm Basics
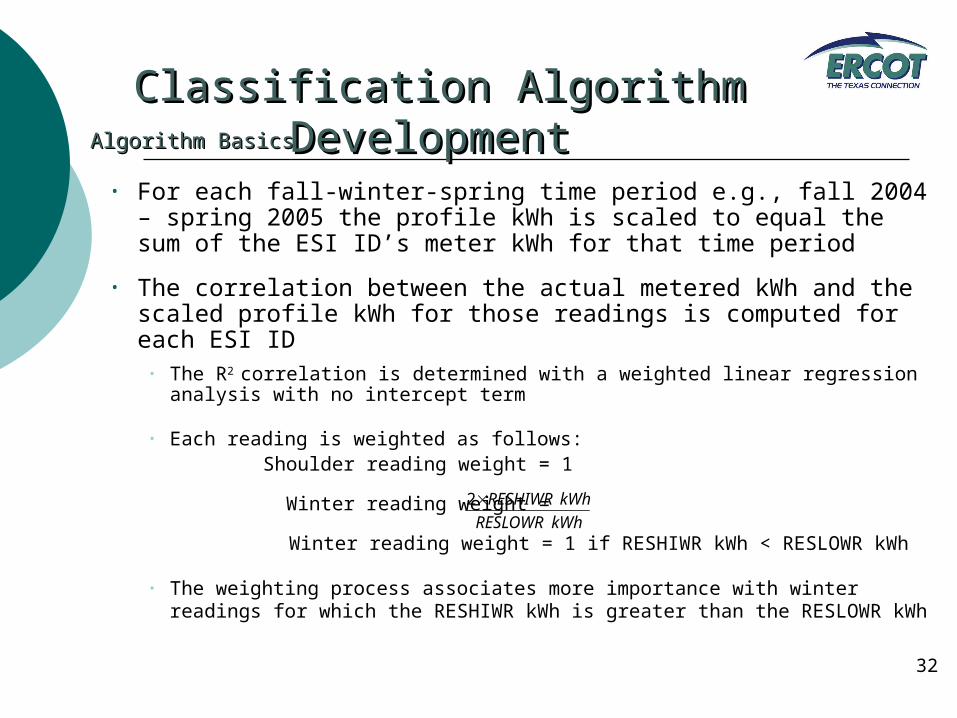
• For each fall-winter-spring time period e.g., fall 2004 – spring 2005 the profile kWh is scaled to equal the sum of the ESI ID’s meter kWh for that time period
• The correlation between the actual metered kWh and the scaled profile kWh for those readings is computed for each ESI ID
• The R2 correlation is determined with a weighted linear regression analysis with no intercept term
• Each reading is weighted as follows: Shoulder reading weight = 1
Winter reading weight =
Winter reading weight = 1 if RESHIWR kWh < RESLOWR kWh
• The weighting process associates more importance with winter readings for which the RESHIWR kWh is greater than the RESLOWR kWh
kWhRESLOWR
kWhRESHIWR2
Classification Algorithm DevelopmentClassification Algorithm Development
33
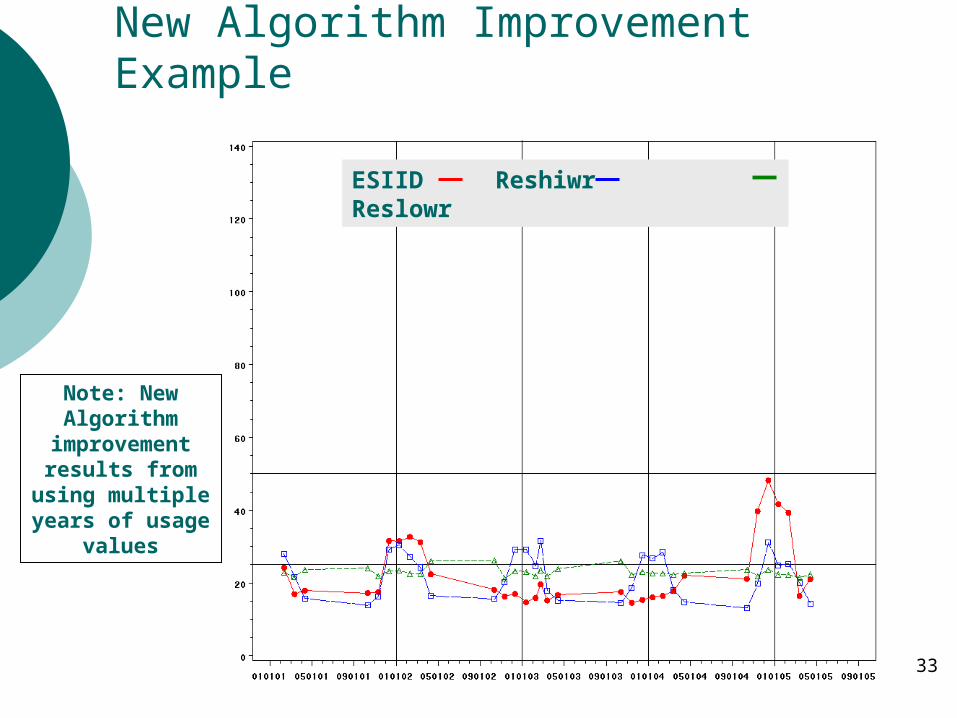
New Algorithm Improvement Example
Note: New Algorithm
improvement results from
using multiple years of usage
values
ESIID Reshiwr Reslowr
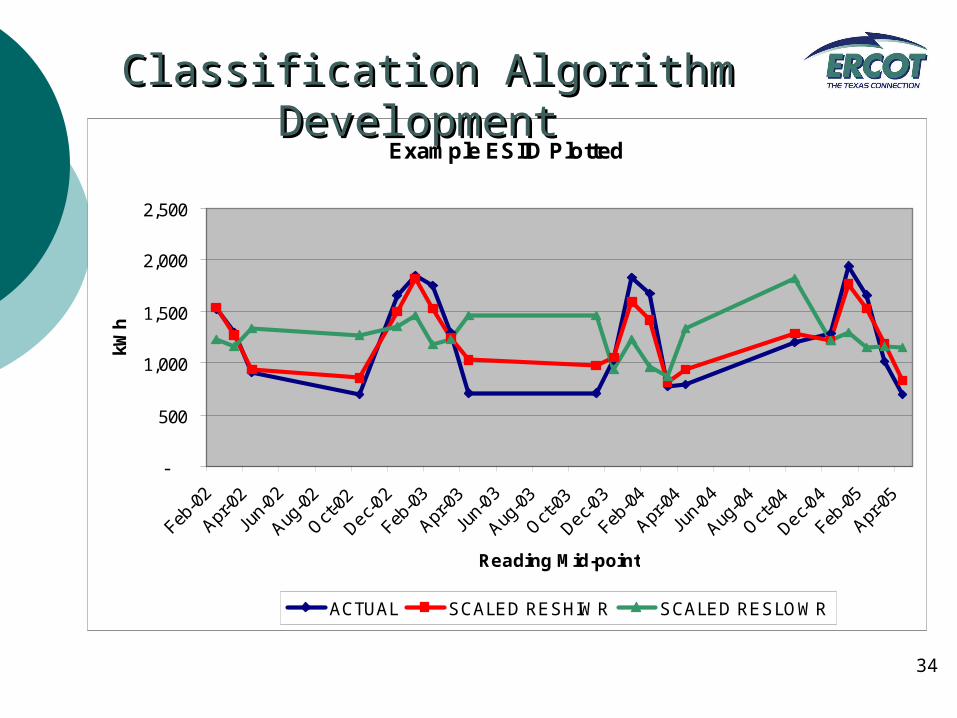
34
Example ESIID Plotted
-
500
1,000
1,500
2,000
2,500
Feb-0
2
Apr-0
2
Jun-
02
Aug-0
2
Oct-02
Dec-02
Feb-0
3
Apr-0
3
Jun-
03
Aug-0
3
Oct-03
Dec-03
Feb-0
4
Apr-0
4
Jun-
04
Aug-0
4
Oct-04
Dec-04
Feb-0
5
Apr-0
5
Reading Mid-point
kWh
ACTUAL SCALED RESHIWR SCALED RESLOWR
Classification Algorithm DevelopmentClassification Algorithm Development
35
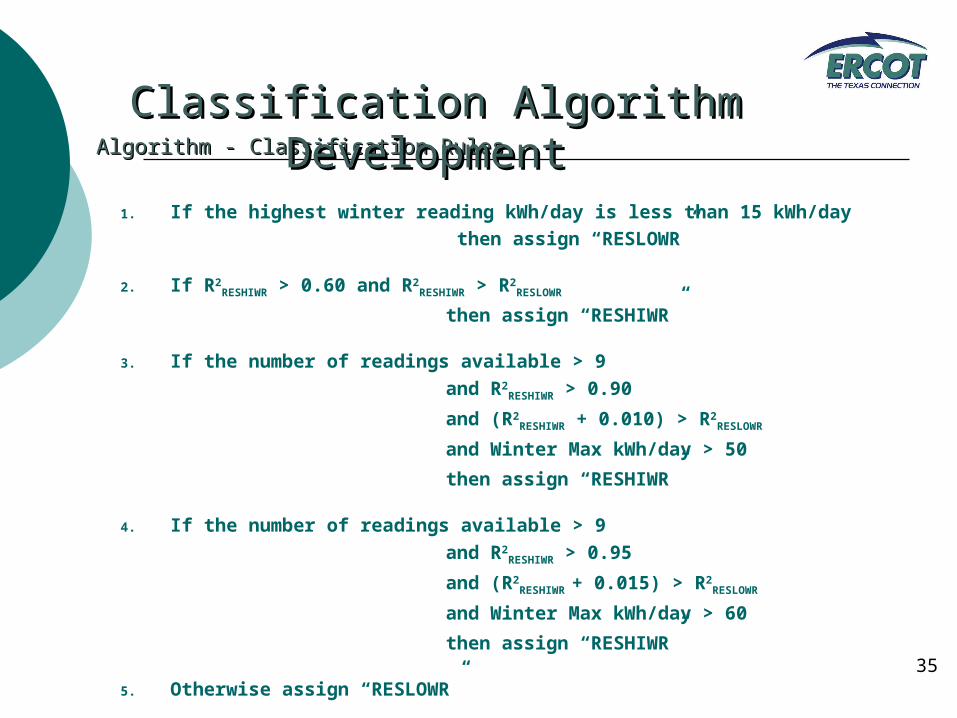
Algorithm - Classification RulesAlgorithm - Classification Rules
1. If the highest winter reading kWh/day is less than 15 kWh/day
then assign “RESLOWR”
2. If R2RESHIWR > 0.60 and R2
RESHIWR > R2RESLOWR
then assign “RESHIWR”
3. If the number of readings available > 9
and R2RESHIWR > 0.90
and (R2RESHIWR + 0.010) > R2
RESLOWR
and Winter Max kWh/day > 50
then assign “RESHIWR”
4. If the number of readings available > 9
and R2RESHIWR > 0.95
and (R2RESHIWR + 0.015) > R2
RESLOWR
and Winter Max kWh/day > 60
then assign “RESHIWR”
5. Otherwise assign “RESLOWR”
Classification Algorithm DevelopmentClassification Algorithm Development
36
Algorithm – Rules Fine TuningAlgorithm – Rules Fine Tuning
Algorithm fine tuning was an iterative process to tune each classification criterion on the previous slide individually
Each classification criterion was adjusted to minimize misclassification error based on validated survey responses
For each iteration, misclassified ESI IDs were examined graphically to assess the accuracy of the Profile Type assignment and to establish new criteria
When the fine tuning was complete 184 (4.6%) validated survey responses regarding heating system type were different than the algorithm classification … most had usage patterns which were ambiguous
Classification Algorithm DevelopmentClassification Algorithm Development
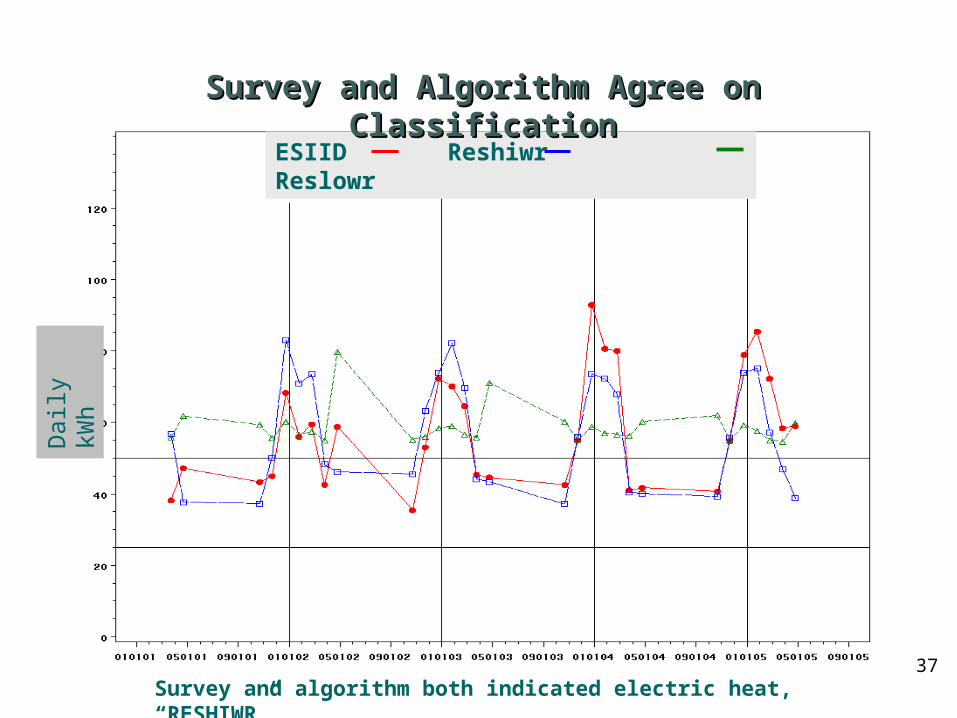
37
Survey and algorithm both indicated electric heat, “RESHIWR”
ESIID Reshiwr Reslowr
Dai
ly k
Wh
Survey and Algorithm Agree on ClassificationSurvey and Algorithm Agree on Classification
38
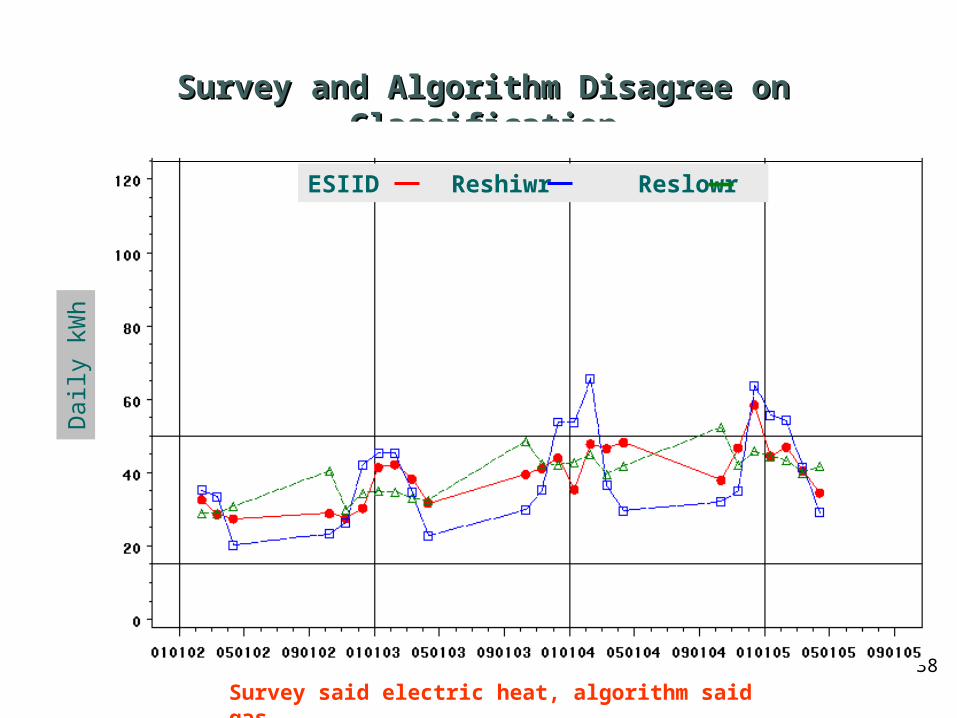
Survey and Algorithm Disagree on ClassificationSurvey and Algorithm Disagree on Classification
Survey said electric heat, algorithm said gas
ESIID Reshiwr Reslowr
Dai
ly k
Wh
39
For the final version of the algorithm 3,773 (95.4%) validated survey responses regarding heating system type agreed with the algorithm classification
Definitely not electric heat!
Classification Algorithm ResultsClassification Algorithm Results
40
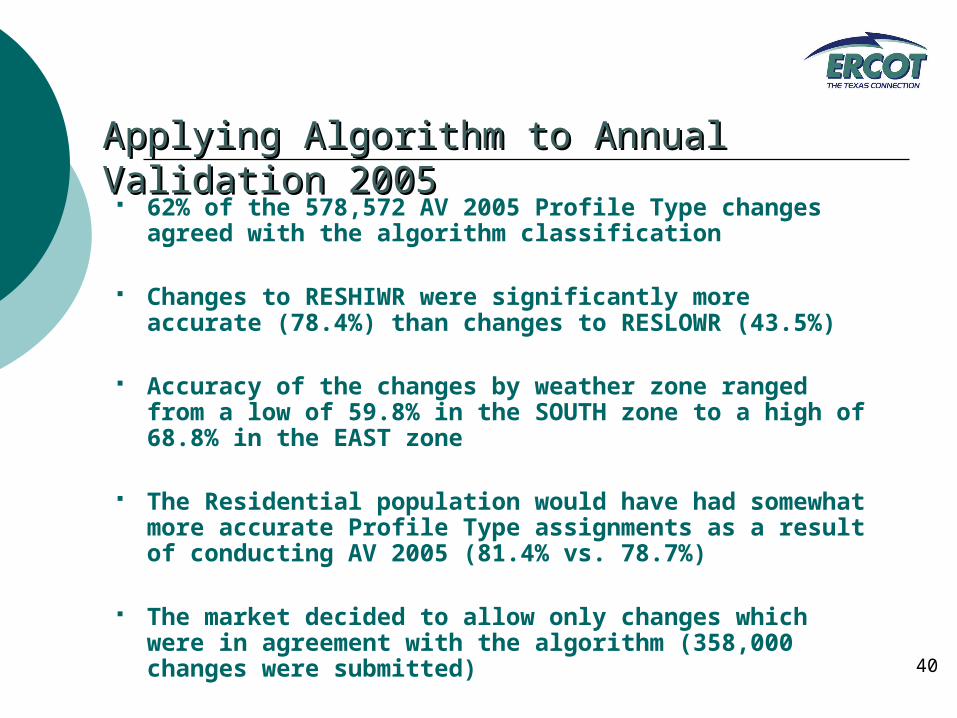
Applying Algorithm to Annual Validation 2005Applying Algorithm to Annual Validation 2005
62% of the 578,572 AV 2005 Profile Type changes agreed with the algorithm classification
Changes to RESHIWR were significantly more accurate (78.4%) than changes to RESLOWR (43.5%)
Accuracy of the changes by weather zone ranged from a low of 59.8% in the SOUTH zone to a high of 68.8% in the EAST zone
The Residential population would have had somewhat more accurate Profile Type assignments as a result of conducting AV 2005 (81.4% vs. 78.7%)
The market decided to allow only changes which were in agreement with the algorithm (358,000 changes were submitted)
41
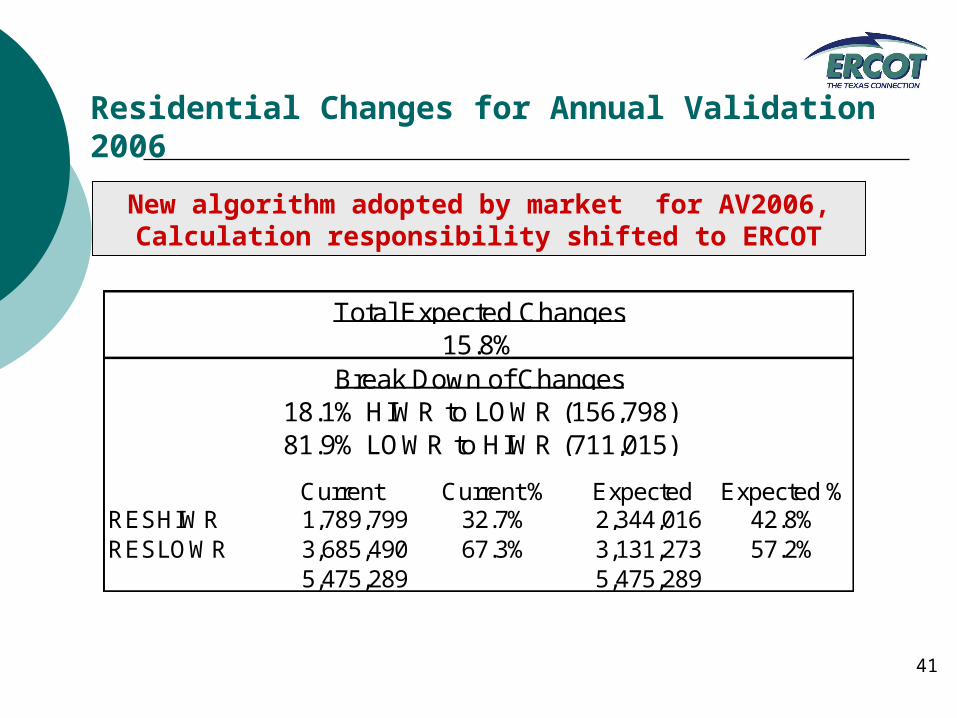
Residential Changes for Annual Validation 2006
New algorithm adopted by market for AV2006, Calculation responsibility shifted to ERCOT
Current Current % Expected Expected %RESHIWR 1,789,799 32.7% 2,344,016 42.8%RESLOWR 3,685,490 67.3% 3,131,273 57.2%
5,475,289 5,475,289
18.1% HIWR to LOWR (156,798)81.9% LOWR to HIWR (711,015)
Total Expected Changes15.8%
Break Down of Changes
42
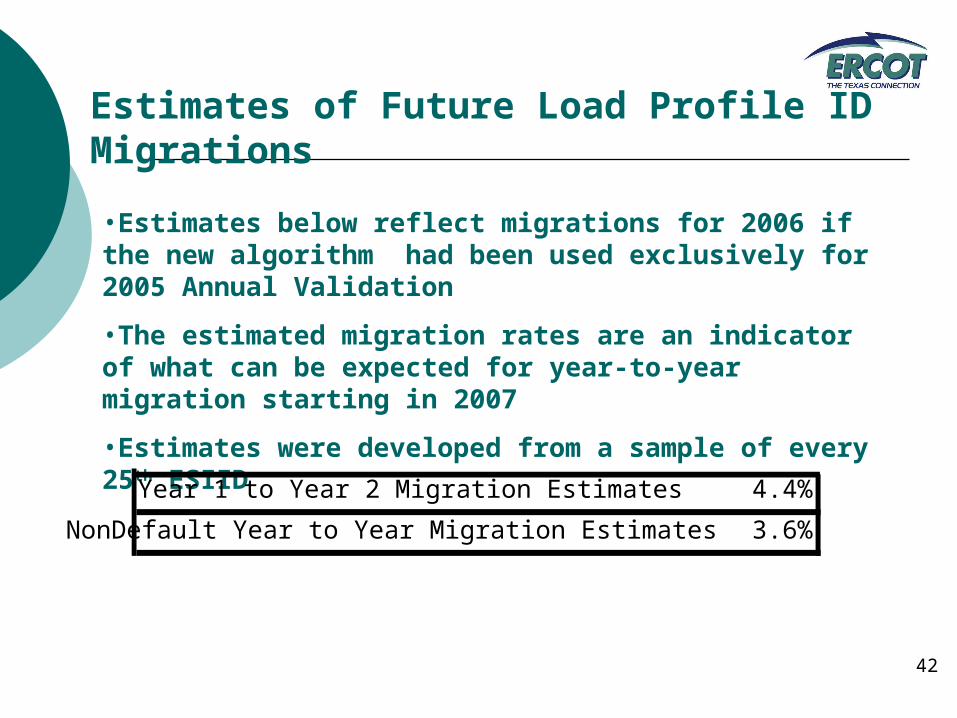
Estimates of Future Load Profile ID Migrations
•Estimates below reflect migrations for 2006 if the new algorithm had been used exclusively for 2005 Annual Validation
•The estimated migration rates are an indicator of what can be expected for year-to-year migration starting in 2007
•Estimates were developed from a sample of every 25th ESIID
4.4%
NonDefault Year to Year Migration Estimates 3.6%
Year 1 to Year 2 Migration Estimates
43
Conclusions The survey successfully provided data necessary to build a
classification algorithm for electric heating and establish its accuracy.
The classification algorithm at 96% accuracy was a significant improvement over the winter ratio method
The improved accuracy will lead to assignment stability
Profile assignments and shapes are in a feedback loop and improve each other
The new algorithm uses load profile shapes to make profile assignments
With updated load research analysis based on the new assignments, more accurate load profile shapes will be developed as a result of a more homogeneous population
The more accurate load profile shapes should lead to better assignments
ERCOT has completed load research analysis using the new profile assignments and is developing new profile models based on those latest estimates

44