1 A HIGH RESOLUTION SPATIALLY EXPLICIT CONTINENTAL SCALE MULTIMEDIA MODEL OF FATE AND TRANSPORT OF...
36
1 A HIGH RESOLUTION SPATIALLY EXPLICIT CONTINENTAL SCALE MULTIMEDIA MODEL OF FATE AND TRANSPORT OF CHEMICALS A.Pistocchi D.Pennington
-
Upload
nicole-cahill -
Category
Documents
-
view
215 -
download
0
Transcript of 1 A HIGH RESOLUTION SPATIALLY EXPLICIT CONTINENTAL SCALE MULTIMEDIA MODEL OF FATE AND TRANSPORT OF...

1
A HIGH RESOLUTION SPATIALLY EXPLICIT CONTINENTAL SCALE MULTIMEDIA MODEL OF FATE AND TRANSPORT OF CHEMICALS
A.Pistocchi
D.Pennington

2
Novel Methods for Integrated Risk Assessment of Cumulative
Stressors in Europe
FP6
In the context of EC Environment and Health Strategy
http://nomiracle.jrc.it

3
NoMiracle Project Commitment of DG-JRC for model development
• a novel multimedia fate and exposure model with regionalised spatial resolutions at the European level
• focus on improvements to the soil module by using spatial data from the European Soils Database
• various resolutions
• account for different temperate zones and periods.

4
FATE MAPPE• FATE is an initiative aimed at providing cross-cutting
insights into the FAte of Chemicals in Terrestrial and coastal ecosystems in Europe, developed at the RWER Unit of EC- DG JRC, Institute for Environment and Sustainability
• The acronym MAPPE stands for Multimedia Assessment of Pollutant Pathways in Europe, and is the Italian word to denote “maps”
• A GIS-based strategy for screening level modeling of the fate and transport of chemicals over large regions

5
Coupling of environmental media
Soil water budgetErosion
Soil contaminant budget
Stream network + lakesloading
Stream network + lakes
Routing:
Removal + advection
Atmosphere Contaminant
Budget
AdvectionRemoval
Volatilization
Oceans
sources
sources
sources
Gas Abs+Deposition
Presentation at SETAC Europe 2005 - Lille

6
FATE MAPPE
• The model accounts for the partitioning of chemicals between phases, degradation, advection through the different environmental media (soil, inland water bodies, oceans, and the atmosphere) and exchanges between media due to atmospheric deposition, volatilization and the contribution of soil washoff to water discharges.

7
FATE MAPPE
• The model is built in a geographic information system (GIS) shell to manage data and to perform simplified modeling through map-algebraic and context analysis operators, such as local drainage delineation, weighted distance and zonal aggregation.

8
FATE MAPPE
• This provides a spatially resolved multimedia model suitable for the detailed simulation of chemical concentrations from point and diffuse sources of emissions for Europe.
• an efficient tool to compute concentrations from emissions over large domains
• simplified conceptualization with limitations (e.g. site-specific exposures to local sources).

9
FATE MAPPE• Spatial resolution is currently 1 km. The model
provides time dependent insights according generally to monthly climatology. Landscape and climate parameters required to perform calculations are included as maps for model application. Among distributed landscape and climate parameters, inland water retention times, atmospheric advection and deposition terms, soil properties and ocean circulation have been defined based on specific analyses.

10
Algorithms• Thanks to source receptor relations in space and time,
atmospheric modeling is performed through map-overlaying of standard plumes generated within the ADEPT model (Roemer et al., 2005)
• Soil: 1D approach• Water-column processes in oceans: 1D approach• Input to oceans from the river network: penetration
depth approach (exponential decay following a weighted distance from the coast, no directional modeling of plumes; calculations at the level of ocean compartments individuated on the basis of hydrodynamic patterns

11
Emissions and receptors
• Emissions data that can be associated with – e.g. agro-chemical use, – population distribution, – emission inventories such as the EEA’s EPER.
• Spatially resolved insights of ecosystem and human exposure at a pan-European scale.

12
Example 1 : 1,2-Dichloroethane• Example fact sheet:
http://www.epa.gov/OGWDW/dwh/t-voc/12-dichl.html
Assumptions: Half life in air: 1 monthHalf life in water: 10 hrs, mainly due to
volatilizationDegradation is negligible in water Main multimedia mechanisms: volatilization,
advection

13
Emissions to water
(EPER points)

14
The WATER_GIS model (Pistocchi et al., 2004) computes concentrations along the stream network and lakes; volatilization is included as a mechanism of removal from water and loading to air.

15
The results are spatially resolved to the detail of 1 km along the stream network

16
The MAPPE_ADEPT model computes concentration in the atmosphere depending on volatilization from surface waters.

17
Example 2 - PCBs
• Degradation rates:
• Kair-water = 0.0153
• Kow = 2.E+6• MW = 292
• Emissions:
EMEP data

18
Koverall, atmo., hr-1
(excluding
degradation)

19

20
21

22
removal rates from the atmosphere, hr-14.
15E-
03
6.63
E-06
4.21
E-03
1.68
E-04
4.15
E-03
4.21
E-03
4.16
E-03
3.45
E-03
6.63
E-06
3.51
E-03
1.68
E-04
3.45
E-03
3.51
E-03
3.46
E-03
3.01
E-02
6.63
E-06
3.02
E-02
1.68
E-04
3.01
E-02
3.01
E-02
3.01
E-02
2.31
E-02
6.63
E-06
2.31
E-02
1.68
E-04
2.31
E-02
2.31
E-02
2.31
E-02
6.31
E-03
6.63
E-06
6.37
E-03
1.68
E-04
6.30
E-03
6.36
E-03
6.31
E-03
3.99
E-05
6.63
E-06
9.95
E-05
1.68
E-04
3.99
E-05 9.
96E-
05
5.18
E-05
1.00E-06
1.00E-05
1.00E-04
1.00E-03
1.00E-02
1.00E-01
1.00E+00
kdry, diff kdry, dep kw et, diff kw et, dep kdry, tot kw et, tot ktot
lakes river, min river, max river, avg soil, MQ soil, SIMPLEBOX
?

23
Ksoil, hr-1

24
Kerosion, hr-1

25
Kvolat., hr-1

26
Soil concentration

27
The soil rates
?

28
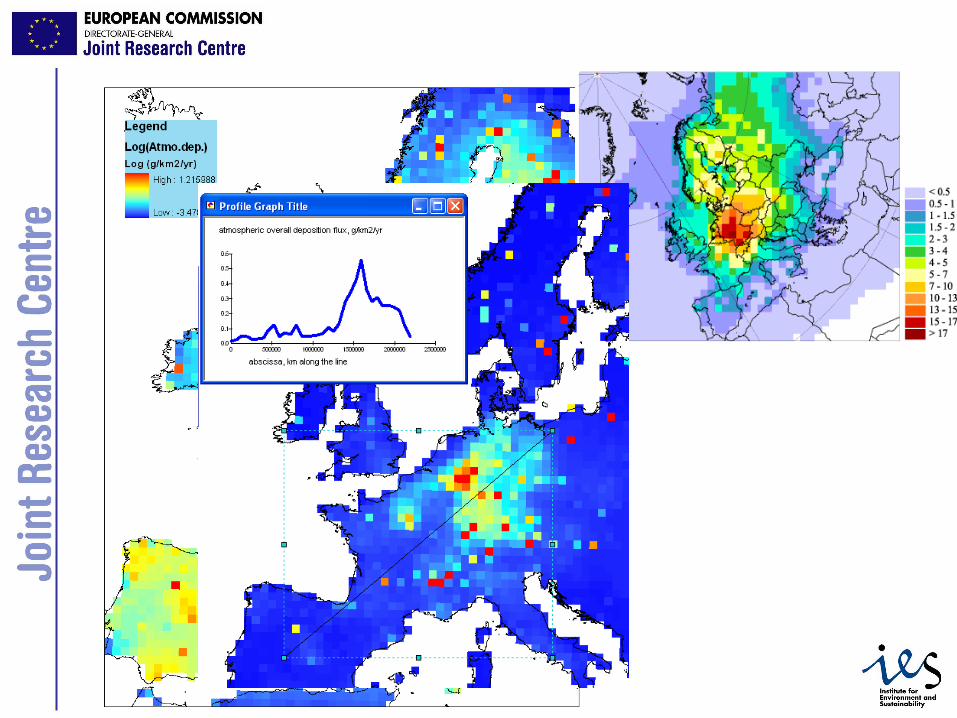
Deposition to ocean, g/km2/yr

29
removal rates from the ocean, hr-1: july

30
Comparison with MSCE-POP

31
Ocean concentration

32
Comparison with MSCE-POP highlights that:
• Gas phase exchange plays a relevant role and should be better parameterised for soil-air interface
• Orders of magnitude are correct apart from the soil compartment – this is a common problem seen in many model
comparison exercises
• Patterns in ocean concentration are wrong: – Importance of removal rate patterns over emissions

33
Concentration to (potential) risk is a trivial GIS overlay operation
Example: air C + pop. density

34
Forthcoming Applications
• Generic fate and transport modeling of widely dispersed chemicals such as – Pharmaceuticals and biocides (following pop.
Density) – Pesticides (following agriculture)
• To obtain Indicators of “Chemical Density” of Europe– large-scale average trends – hot spots

35
Conclusions• A screening-level tool that compares reasonably
with detailed, distributed model MSCE-POP, and supports more detailed assessment (1km grid, freshwater)
• Suitable for soft-computational applications (concept of “chemical density” from given pressure factors)
• Needs tuning with experimental evidence – suitable for dialoguing btw. lab- and math-people

36
Info
Info and this presentation on our web sites:dr Alberto Pistocchi European CommissionJoint Research Centre,Institute for Environment and Sustainability (IES)Rural, Water and Ecosystem Resources (RWER) UnitVia E. Fermi 1, TP 460I-21020 Ispra (VA), Italy Tel.: +39 0332 785591e-mail [email protected]://ensure.jrc.it/http://nomiracle.jrc.it