1-70 Cover Design Fire Tech Note Rev 1 17092015...2016/06/03 · 1-70 Cover Design Fire Tech Note...
21
1-70 Cover Design Fire Tech Note Rev 1 17092015 1 Technical note Project: I-70 East Project, Denver CO. To: Dan Liddle (Atkins NA) Subject: Partial Covered Lowered Alternative - Design Fire Size (Rev 1) From: Gary Clark (Atkins UK) Date: 17 September 2015 cc: Keith Meeks, Yenny Gomez; Ken DePinto Contents 1. Introduction............................................................................................................................................... 2 2. I-70 Cover Characteristics ....................................................................................................................... 2 2.1. Systems and facilities.......................................................................................................................... 2 2.2. Traffic .................................................................................................................................................. 4 3. Standards and Good Practice for Road Tunnel Design Fires ............................................................. 5 3.1. Introduction.......................................................................................................................................... 5 3.2. Key standards and guidance............................................................................................................... 5 3.3. Current practice ................................................................................................................................... 6 4. Incident Scenarios and Risk Analysis ................................................................................................... 8 5. Influence of Geometry on Design Fire Size ......................................................................................... 11 6. Influence of Timelines on Design Fire Size ......................................................................................... 12 6.1. Fire growth characteristics ................................................................................................................ 12 6.2. Evacuation characteristics ................................................................................................................ 14 7. Influence of Fixed Fire Fighting Systems (FFFS) on Design Fire Size ............................................. 16 8. Summary, Conclusions and Recommendations................................................................................. 18 9. References .............................................................................................................................................. 21
Transcript of 1-70 Cover Design Fire Tech Note Rev 1 17092015...2016/06/03 · 1-70 Cover Design Fire Tech Note...

1-70 Cover Design Fire Tech Note Rev 1 17092015 1
Technical note
Project: I-70 East Project, Denver CO. To: Dan Liddle (Atkins NA)
Subject: Partial Covered Lowered Alternative - Design Fire Size (Rev 1)
From: Gary Clark (Atkins UK)
Date: 17 September 2015 cc: Keith Meeks, Yenny Gomez; Ken DePinto
Contents
1. Introduction ............................................................................................................................................... 2
2. I-70 Cover Characteristics ....................................................................................................................... 2
2.1. Systems and facilities .......................................................................................................................... 2
2.2. Traffic .................................................................................................................................................. 4
3. Standards and Good Practice for Road Tunnel Design Fires ............................................................. 5
3.1. Introduction .......................................................................................................................................... 5
3.2. Key standards and guidance ............................................................................................................... 5
3.3. Current practice ................................................................................................................................... 6
4. Incident Scenarios and Risk Analysis ................................................................................................... 8
5. Influence of Geometry on Design Fire Size ......................................................................................... 11
6. Influence of Timelines on Design Fire Size ......................................................................................... 12
6.1. Fire growth characteristics ................................................................................................................ 12
6.2. Evacuation characteristics ................................................................................................................ 14
7. Influence of Fixed Fire Fighting Systems (FFFS) on Design Fire Size ............................................. 16
8. Summary, Conclusions and Recommendations ................................................................................. 18
9. References .............................................................................................................................................. 21

1-70 Cover Design Fire Tech Note Rev 1 17092015 2
Technical note
1. Introduction The design fire size (the peak heat release rate in MW) provides the fire characteristic used to inform the design sizing and configuration of the I-70 Cover fire safety equipment and facilities. Design fire criteria are also required for the protection of the I-70 Cover structure; although these considerations are outside of the scope of this document.
The design fire criteria may be informed by performance (risk) based assessment to evaluate the I-70 Cover fire safety as a whole. It should be emphasised that the design fire for the I-70 Cover is not the worst possible fire that could occur but is a basis for design that provides an acceptable level of risk in the Cover.
At the previous stage of the project, at Draft EIS stage, the design fire load for the I-70 Cover ventilation system was proposed as 30MW, under guidance and requirements defined by NFPA 502 (2010). At this stage of design, the traffic and tunnel characteristics have been further defined/revised (affecting the estimated risk profile for the I-70 Cover) and the prevailing standard has been updated to NFPA 502 (2014); with additional requirements for fire safety, in particular the requirement for a fixed fire fighting system (as a conditionally mandatory requirement).
The purpose of this Technical Note is to assess the design fire requirements for the I-70 Cover systems and make recommendations on criteria for fixed fire fighting and ventilation systems for the approval of ANA and the Authorities Having Jurisdiction (AHJ). A summary, conclusions and recommendations section is included at the end of this Technical Note. Design and development of specifications is to proceed on the basis of the recommendations in this Technical Note, pending approval of the ANA and the AHJ.
2. I-70 Cover Characteristics
2.1. Systems and facilities The I-70 Cover is classified as a Category C tunnel (see Figure 1) under NFPA 502 (2014). In summary NFPA requires the systems and facilities listed in table 1.
Figure 1 Urban and Rural Tunnel Categories (Based on NFPA 502 2014 edition, figure A.7.2)1
1 Based on provided traffic data by ANA for the worst case scenario (full built, westbound bore AM peak hour). Current understanding is that the cover section will operate with 5 lanes when opened for the first time (around 2020’s), the scheme is then to add one additional managed lane by halving the hard shoulder (currently proposed 24’ in the center wall) at a later phase after opening (estimated year 2035)

1-70 Cover Design Fire Tech Note Rev 1 17092015 3
Technical note
Table 1 – NFPA 502 requirements
Item /requirement Comments / reference standards
Engineering analysis NFPA 502 – an analysis that evaluates all the factors that affect the fire safety
Structural elements protection2
NFPA 502 and ASTM E 136-ASTM E 2652 or equivalent accepted by the AHJ for non-combustible material if structural fire protection material is provided [note that structural design fire load is not addressed in this Memo]
Manual fire alarm boxes NFPA 502 and installation, inspection and maintenance shall follow NFPA 72
CCTV NFPA 502, shall be permitted as a fire detection means in tunnels with 24-hour supervision
Automatic fire detection. NFPA 502 required if tunnel is not 24-hour supervised. It is also required when water based fire-fighting systems are installed and for ancillary spaces (e.g. pumps/ utility rooms). Installation shall follow NFPA 72 and approval from AHJ.
Fire alarm control panel NFPA 502 and installation, inspection and maintenance shall follow NFPA 72.
Emergency communication systems
NFPA 502. Two-way radio communication enhancement systems. Installation, inspection and maintenance shall follow NFPA 72
Closure and traffic control NFPA 502.
Standpipe, fire hydrants, and water supply.
NFPA 502, NFPA 14, NFPA 25, NFPA 22, NFPA 24. Fire department connections are mandatory. For hose connections follow NFPA 502, NFPA 1963 and the AHJ. Fire pumps are ‘conditionally’ mandatory and for Installation, inspection and maintenance shall follow NFPA 20.
Portable fire extinguishers NFPA 502, NFPA 10.
Fixed water-based fire fighting systems
NFPA 502. ‘Conditionally’ mandatory and shall be installed, inspected and maintained in accordance with NFPA 11, NFPA 13, NFPA 15, NFPA 16, NFPA 18, NFPA 25, NFPA 750 or other equivalent international standards acceptable to the AHJ.
Emergency ventilation NFPA 502, ’conditionally’ mandatory
Drainage NFPA 502.
Hazardous locations NFPA 502 and classification to follow NFPA 70, NFPA 820.
Hydrocarbon detector NFPA 502.
Flammable and combustible environmental hazards
NFPA 502, ’conditionally’ mandatory.
Means of egress NFPA 502, NFPA 101 and Maintenance in accordance with NFPA 1.
Exit identification NFPA 502.
Tenable environment NFPA 502.
Walking surfaces NFPA 502, NFPA 101 (Chapter 7)
Emergency exits doors NFPA 502, and installed in accordance NFPA 80. Spacing between exits shall not exceed 300 m (1000ft) according to NFPA 502. It is proposed that given the number of traffic lanes and the potential for large numbers of people to be in the tunnel (and given that cross-connections may be made with relative ease) two cross-connecting egress paths will be appropriate, subject to approval of AHJ.
2 Structural fire protection is outside the scope of this document

1-70 Cover Design Fire Tech Note Rev 1 17092015 4
Technical note Item /requirement Comments / reference standards
Egress pathway NFPA 502. The tunnel roadway surface when supported by traffic management system is considered as a part of egress pathway according to the standard. Emergency exits to be separated from the tunnel by construction enclosure having a class A interior finish following NFPA 101 and for pressurization to follow NFPA 92.
Electrical systems general, wiring and installation methods, emergency power, reliability and security plan.
NFPA 502 for all aspects except as follows: Fire resistive cables tested by the ASTM E 119 and functionality as per ANSI / UL 2196. For installed circuits embedded in concrete to follow UL 1724. For wiring methods NFPA 70, cables and conductors within cover to have reduced smoke emissions by methods suggested in NFPA 502 and tested by FT4 IEEE 1202 No. 0.3 or NFPA 262 or CSA FT6 or equivalent international standards accepted by AHJ. Cables, conductors, raceways, equipment and supports tested in accordance with MIL-C-24643. The installation methods to follow NFPA 502 or approved by the AHJ. Emergency power in accordance article 700 of NFPA 70, and for emergency and standby power systems other than separate service refer to NFPA 110.
Emergency lighting NFPA 502, NFPA 70, NFPA 110, NFPA 111.
Exit signs NFPA 502.
Lighting for natural conditions FHWA document section 4-11[13], CIE 88-2004.
Emergency Response NFPA 502 for most aspects, and for the Operations Control Center (where applicable) to be a proprietary supervising station to meet NFPA 72. Emergency incidents to be managed in accordance with NFPA 1561.
It is of note that this current NFPA 502 edition (2014) has introduced new requirements and modified some existing requirements for a category C tunnel. Amongst the new mandatory requirements for a category C tunnel are engineering analysis, protection of structural elements, walking surface requirements and emergency exit requirements. The new ‘conditionally mandatory’ elements are: emergency communications systems (previously mandatory), fixed fire suppression, flammable and combustible environmental hazards analysis.
2.2. Traffic Traffic data show an annual average daily traffic (AADT) of 225,415 (115,964 westbound; 109,451 eastbound) and an estimated HGV proportion of 3.3%.
The volume of Hazardous Materials (HazMat) traffic expected in the I-70 Cover is not known; it is assumed for the purposes of Reference Design that the proportion of HGVs that are carrying HazMat is as the national average, being assumed similar to the European road network at approximately 0.7% of traffic; the majority of which is bulk fuel transport. US statistics suggest that approximately 70% of trucks would be loaded whereas the remainder are empty.
Traffic is proposed to be unidirectional. Contraflow (bi-directional traffic in a single bore) has been assumed to be not required in the I70 Cover on the basis that closure of one side (bore) of the tunnel for maintenance will result in traffic being diverted to above-ground roads rather than via contraflow in the other bore.

1-70 Cover Design Fire Tech Note Rev 1 17092015 5
Technical note
3. Standards and Good Practice for Road Tunnel Design Fires
3.1. Introduction During the mid-90’s design fires for HGVs were typically taken as 20MW3. The tunnel fire events in European tunnels4 during the mid-1990’s and early 2000’s led to a series of research and development projects (including a number of full-scale fire tests). These have resulted in modified guidance and changes to the measures used to manage and mitigate the hazards from fire and smoke in tunnels. In particular; there are two important areas of improved understanding: the potential magnitude of peak heat release rates and enhanced technologies for fire protection and safety such as fire detection, fire suppression and evacuation systems. In the context of this document the design fire refers to the configuration of the I-70 Cover fire safety equipment and facilities for life safety purposes. Structural fire protection is outside the scope of this Technical Note.
3.2. Key standards and guidance
3.2.1. USA Standard NFPA 502 NFPA 502 (2014) is not prescriptive in its specification of design fire but states that the defined fire scenario for emergency ventilation will be based on the operational risk associated with the type of vehicles expected to use the tunnel. The Standard refers to test data from heavy goods vehicle fire tests [13] reaching average peak heat release rates of up to 200MW. NFPA 502 states that the design fire is not necessarily the worst fire that may occur but that engineering judgement is required to be used to establish the probability of occurrence and the ability to achieve practical solutions.
3.2.2. International guidance of PIARC (World Road Association) In 1999 [5] PIARC recommended a tunnel design fire size of 30 MW. However, that report acknowledged that significantly higher heat release rates from heavy goods vehicles and vehicles with dangerous goods are possible based on the experimental measurements undertaken during the EUREKA fire tests (up to 120MW). The heat release rates from fires arising from petrol tanker fuel spills were considered to be in the range of 200 to 300 MW.
As yet unpublished PIARC work [6] explores design fire criteria in some depth, concluding that events and tests in recent years have shown fire sizes in excess of those generally found in codes and standards. The report notes that solid fuel fires can potentially be even more severe than liquid pool fires resulting from a single tanker incident, depending on the drainage provisions; and that a fire will become difficult for the fire service to approach once it reaches between 50MW and 100MW.
3.2.3. UK HA Standard BD78/99 This standard was published in 1999. It suggests a minimum ventilation design load for tunnels of 20MW, allowing sufficient time for evacuation before the fire reaches the maximum heat release rate (up to 100MW for fully laden HGV –not carrying petrol).
Subsequent HA research published in 2006 [10] - the outcome of which is informing currently proposed amendments to BD78 (expected to be published in 2015) – we anticipate will outline a risk-based approach to design fire size selection, including assessment of the likelihood and consequences of fires; and evaluation against acceptance criteria.
3 For example, as required by drafts of HA Standard BD78 and the US Standard NFPA502 applicable at the time.
4 Channel Tunnel (1996), Isola delle Femmine motorway (1996), Mont Blanc (1999), St Gotthard (2001) among others.

1-70 Cover Design Fire Tech Note Rev 1 17092015 6
Technical note 3.2.4. NCHRP 2011 In 2011, the National Cooperative Highway Research Program in the USA published a report on Design Fires in Road Tunnels; reflecting the state of knowledge and practice. No prescriptive way of defining fire size is proposed, but it highlights that the fire growth rate is more important than the peak of Heat Release Rate (HRR) when investigating the safety of people in road tunnels. This is true where people may reasonably be expected to have evacuated before the fire reaches its peak heat release rate. The report also highlights that the design peak heat release rate may be influenced by the effects of tunnel geometry and the presence of FFFS.
3.3. Current practice A selection of international and national practices are shown in the tables below. These data provide a view of fire sizes internationally, as adopted in projects and standards in the 2000s. Data may not be a full reflection of current practice following more recent fire tests, incidents, data and industry knowledge but nevertheless serve as a useful reflection of practices worldwide:
Table 2 – Guidance on fire sizes adopted internationally [5]
Country Design Fire [MW] Additional information
Australia 50 With FFFS (deluge system), for ventilation
Austria 30 High risk category: 50 MW
France 30 – 200 200 MW when transport of dangerous goods allowed but only applied for longitudinal ventilation
Germany 30 – 100 Depending on length and HGV in tunnel
Greece 100 Longitudinal ventilation
Italy 20 – 200
Japan 30
Netherlands 100 – 200 100 MW if tankers are not allowed, otherwise 200 MW. For ventilation system
Norway 20 – 100 Depending on risk class, always longitudinal ventilation
Portugal 10 – 100 Based on traffic type
Russia 50 – 100
Singapore 30 – 200 Depends on vehicle types allowed
Spain >or =30
Sweden 100 Longitudinal ventilation (50MW with FFFS under some circumstances)
Switzerland 30 Smoke extraction equals 3.3-4 m/s times cross section
Table 3 – Fire sizes recently adopted in the UK and USA [as understood by Atkins]
Tunnel Design Fire [MW] Additional information
Holmesdale, Bell Common and Hatfield Tunnels, UK
30MW to 100MW (depending on portal pressure assumption)
Holmesdale & Bell Common tunnel ventilation systems comprise Saccardo fan stations for longitudinal ventilation.

1-70 Cover Design Fire Tech Note Rev 1 17092015 7
Technical note Tunnel Design Fire [MW] Additional information
with adverse portal pressure from 30Pa to 0Pa
Hatfield Tunnel has a longitudinal jet-fan ventilation system
Dartford West and East Tunnels, UK
100MW Longitudinal ventilation (jet fans)
Hindhead, UK 30MW to 100MW (depending on portal pressure assumption)
Longitudinal ventilation (jet fans)
Blackwall Tunnel Northbound, UK
100MW Longitudinal ventilation (shaft axial fans)
Heathrow Main Tunnel refurbishment, UK
30MW (convective heat load) with FFFS and 15Pa adverse portal pressure
100MW potential assumed reduced to 30MW by action of FFFS.
Reference design specification for longitudinal ventilation (jet fans)
Tyne Tunnels, UK 67MW (convective heat load) with FFFS
100MW potential assumed reduced to 67MW by action of FFFS. Longitudinal ventilation (jet fans)
Woodal Rodgers tunnel cover under Klyde Warren Park, Texas, USA.
100MW FFFS understood to have been added at a later stage in design
Mercer Island tunnel, Seattle, USA
40-MW Fire grows at a rate of 20 MW/min to a maximum fire size of 40MW. The peak size is determined by the fire suppression performance of the overhead fixed sprinkler foam system. Assume that all heat is transmitted convectively [14]
In terms of international practice, it is evident that the choice of a design fire varies widely, from 30 to 300 MW depending on the type of traffic in the tunnel and in some cases the nature of the ventilation system. It is clear that higher design fire loads are possible than those previously prescribed by codes and standards; and that FFFS is a potential measure to limit the fire size to a more manageable level for the ventilation system to deal with.

1-70 Cover Design Fire Tech Note Rev 1 17092015 8
Technical note
4. Incident Scenarios and Risk Analysis The assessment method for the likelihood of tunnel fire incidents used within this Technical Note is based on that presented in the output of the major research programme Durable and Reliable Tunnel Structures (DARTS [11]) by the European Thematic Network programme.
The base data for the DARTS study is derived from an analysis of tunnel fire events described by the World Road Association-PIARC to provide the best possible up-to-date information in terms of real fire scenarios in tunnels. This method takes into consideration registered real fire scenarios rather than trying to derive a range of possible theoretical causes and effects as considered by other methods.
The DARTS method uses the information above in a detailed analysis to determine frequencies for a range of vehicle fires. The methodology acknowledges that only a small proportion of fires develop into serious fires. Most serious fires start in trucks with only a small percentage starting in cars. Of these serious fires a proportion can go out of control, which is defined by DARTS as an event with duration of more than 5 hours (i.e. fire spread to other vehicles).
The approach taken for this I70 East study is to derive a likelihood ‘event tree’ for a representative range of scenarios that are defined considering:
I-70 Cover traffic characteristics and volumes; Fire probability; Severity of fire (small, moderate, large (serious fire)); Whether fires are in or out of control (for serious fires).
For the I70 covered section the fire size categories have been aligned with the representative fire data for typical vehicles given in NFPA 502 (2014 edition). Estimated fire return periods and fire frequencies are shown in table 4 below.
Table 4 – I-70 Fire frequency based on DARTS methodology
Peak HRR (MW)
TOTAL (fires/year)
Car fires (fires/year)
Bus fires (fires/year)
Unladen HGV fires (fires/year)
Laden HGV fires (fires/year)
DGV fires (fires/year)
Fire return Period for all fires (years)
% of fires Cumulative % of fires
5MW 3.47E-01 3.35E-01 1.12E-02 0.00E+00 0.00E+00 0.00E+00 3 77.74% 77.74%
15MW 9.51E-02 8.37E-02 2.44E-03 2.49E-03 6.41E-03 0.00E+00 10 21.32% 99.06%
30MW 2.43E-03 9.64E-05 3.14E-04 5.45E-04 1.40E-03 6.77E-05 419 0.53% 99.59%
150MW 1.80E-03 9.64E-05 3.49E-05 7.01E-05 1.58E-03 1.67E-05 558 0.40% 99.99%
300MW 3.54E-05 0.00E+00 0.00E+00 7.79E-06 2.00E-05 7.57E-06 32328 0.01% 100.00%
1-70 Cover Design Fire Tech Note Rev 1 17092015 9
Technical note
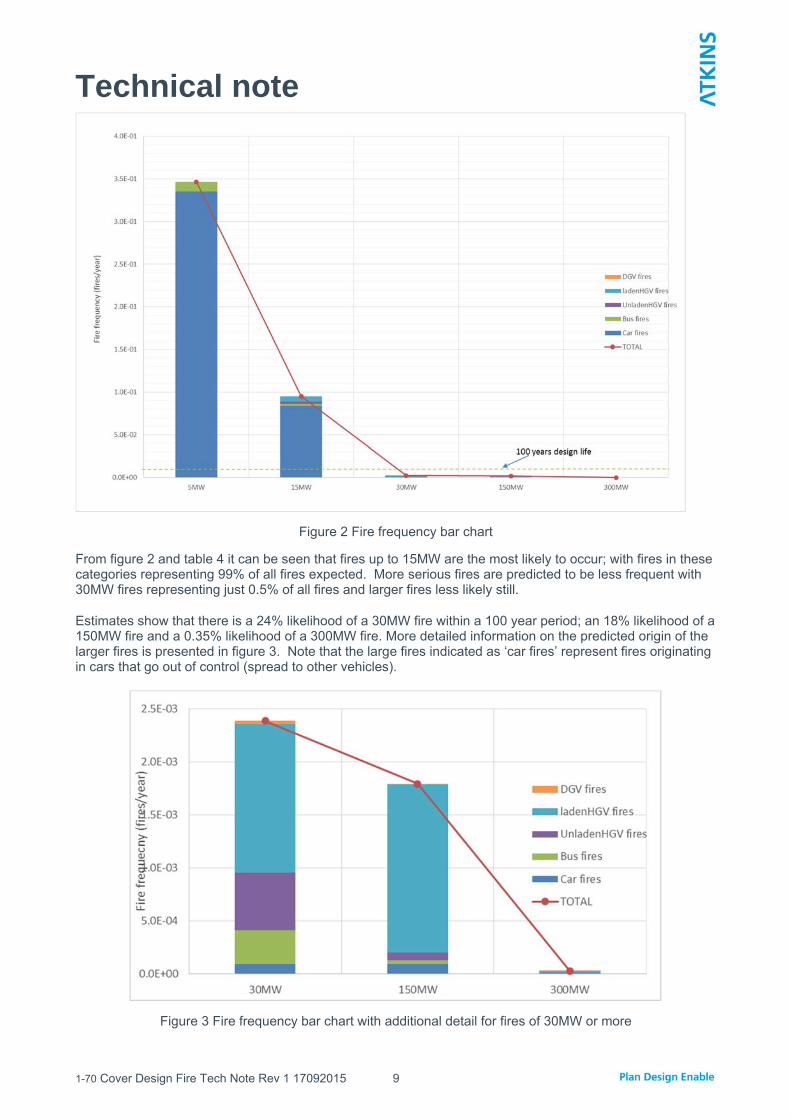
Figure 2 Fire frequency bar chart
From figure 2 and table 4 it can be seen that fires up to 15MW are the most likely to occur; with fires in these categories representing 99% of all fires expected. More serious fires are predicted to be less frequent with 30MW fires representing just 0.5% of all fires and larger fires less likely still.
Estimates show that there is a 24% likelihood of a 30MW fire within a 100 year period; an 18% likelihood of a 150MW fire and a 0.35% likelihood of a 300MW fire. More detailed information on the predicted origin of the larger fires is presented in figure 3. Note that the large fires indicated as ‘car fires’ represent fires originating in cars that go out of control (spread to other vehicles).
Figure 3 Fire frequency bar chart with additional detail for fires of 30MW or more

1-70 Cover Design Fire Tech Note Rev 1 17092015 10
Technical note In this figure, as expected, it can be seen that the largest contribution for fires of 30MW+ comes from laden HGVs whereas for the less serious fires (up to 15MW) the largest contribution comes from car fires which is the principal vehicle category of the traffic mix. Predictions of fire frequencies are subject to necessary simplifications and are intended only to represent the potential frequency of fires over a long period of 100s of years. Of course there may be a number of fires over a shorter period than the predicted fire return period and then no fires for longer stretches of time. The fire return period is estimated only to support and inform the decision making process in deriving an appropriate ‘design’ fire. NFPA 502 states that the design fire for the tunnel is not the worst possible fire that could occur and that engineering judgement should be used to establish the probability of occurrence and the ability to achieve practical solutions. Based on a statistical approach proposed by the DARTS method, a 300MW fire event is predicted to have a sufficiently long return period (in the order of once every 30,000 years) to fall outside of what is considered a reasonable design case for this project. A design fire load of 150MW sets a baseline design maximum HRR from which the impacts of I-70 Cover geometry, FFFS and/or the duration of the evacuation and intervention phases can be assessed.

1-70 Cover Design Fire Tech Note Rev 1 17092015 11
Technical note
5. Influence of Geometry on Design Fire Size
Research (as referenced in the NCHRP report [12]) shows that tunnel geometry, particularly the tunnel width, can have an influence on the potential peak fire size for a given scenario. Carvel (2004) [15] in his PhD Thesis demonstrates the enhancing influence of the confining tunnel geometry on HRR, for tunnel fires compared with open air fires, based on experimental work. Carvel concludes that tunnel width is the most significant geometric parameter to influence HRR; the HRR expected in a tunnel reduces with increasing tunnel width. Carvel suggests an empirical relation (also given in the NCHRP Report [12]). More recently, Ingason (2015) [16] refers to Carvel’s work and supplements with reference to further work by Lonnermark and Ingason that also acknowledges the effects of geometry and concludes that the effect is probably a combination of radiation, influence of air flow patterns, flame characteristics and temperature distribution.
HRR data quoted in NFPA 502 (2014) are based on work reported by Ingason and Lonnermark regarding experimental tests in tunnels. These tests have all been conducted in tunnels with significantly narrower width than the I70 covered highway. The Runehamar fire tests [1, 3, 6, 13] are indirectly referred to in the NFPA 502 (2014) guidance on fire data through reference to [3]. These tests are often referred to for the high HRR of up to 200MW observed. Tests were conducted in a tunnel of 7.3m in width, whereas the I70 Cover has a width of 30m at its narrowest. On the basis of the available research and current thinking with regards the influence of tunnel geometry on HRR, we believe there is engineering justification for taking into account the reducing effects of the greater width of the I70 Cover on the baseline HRR figures given in NFPA 502 (2014) in the derivation of an appropriate design fire load for the I70.
The NCHRP report presents an equation that describes the relationship between HRR and tunnel width (Wtunnel) and fire width (Wfire) as:
HRRtunnel=(Btunnel/BRunehamar)HRRRunehamar
Where
B=24(Wfire/Wtunnel)3+1
The Runehamar data are as follows:
HRRRunehamar=203MW, WfireR=2.9m and WtunnelR=7.3 m
When considering the I-70 narrowest width (most conservative scenario) of 30 m in one bore, and assuming that the fire would be approximately the same width as that in the truck fire tests in Runehamar, a 200MW peak heat release rate as observed at the Runehamar test (which NFPA 502 Table A.11.4.1 presents as 150MW representative load) could be potentially reduced to approximately 82MW5 if it occurred in the I-70 Cover due to the greater width of the I-70 Cover.
Results are sensitive to the assumed width of the test tunnels which informed the NFPA guidance. In the calculation above, a test tunnel width of 7.3m is assumed, reflecting the Runehamar tunnel width. A sensitivity calculation has been conducted using the same calculation procedure but for assumed wider test tunnels. Test tunnels of assumed greater widths of 8m, 9m and 10m show HRR reductions from the 200MW figure to what would be 95MW, 110MW and 130MW respectively in a 30m wide I-70 Cover; as compared to the 82MW derived from Runehamar test tunnel width of 7.3m.
Although there are clear influences of tunnel geometry, research and understanding in this field of fire engineering is emerging. At this stage, it is proposed that the NFPA 502 HRR figure of 150MW be reduced due to the effects of geometry to a design maximum HRR of 120MW, which is towards the higher end of the scale for appropriate conservatism; subject to consideration of the impacts of FFFS.
5 BRunehamar=24x(2.9/7.3)3+1=2.505, BI70=24x(2.9/30)3+1=1.022, HRRI70=(1.022/2.505)x200=81.6MW
1-70 Cover Design Fire Tech Note Rev 1 17092015 12
Technical note
6. Influence of Timelines on Design Fire Size
As discussed in 3.2.4, as well as maximum HRR, the fire growth rate is important when investigating the safety of people in road tunnels in order that a perspective may be gained on the conditions in the tunnel in relation to an evacuation timeline.
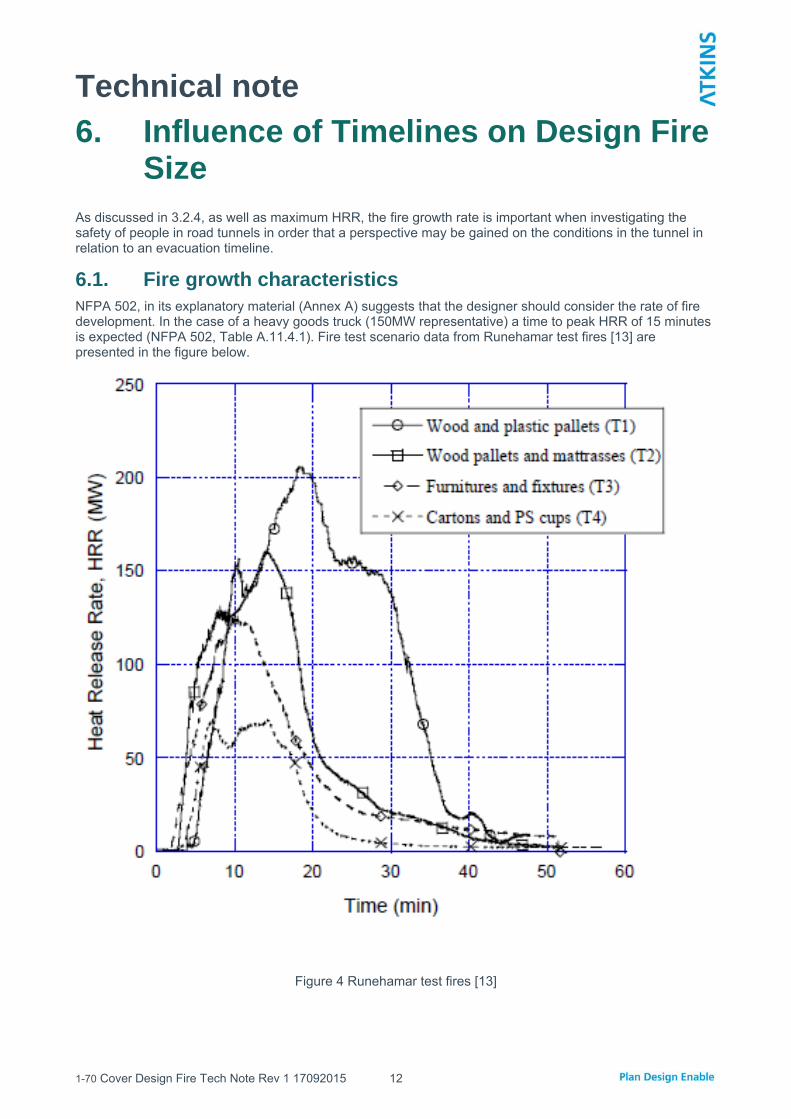
6.1. Fire growth characteristics NFPA 502, in its explanatory material (Annex A) suggests that the designer should consider the rate of fire development. In the case of a heavy goods truck (150MW representative) a time to peak HRR of 15 minutes is expected (NFPA 502, Table A.11.4.1). Fire test scenario data from Runehamar test fires [13] are presented in the figure below.
Figure 4 Runehamar test fires [13]

1-70 Cover Design Fire Tech Note Rev 1 17092015 13
Technical note
Figure 4 above shows large fire development at a low growth rate during the first few minutes (2 to 5 minutes) and then a subsequent period of higher growth rate.
A standard fire curve has been added to the fire test data in the Figure below to illustrate the effect of the geometry correction explained in Section 5 above. This fire curve (red, dashed line) represents an ultrafast fire growth at a rate described by HRR=αxt2, where α is the growth coefficient (0.188kW/s2, which potentially could reach 150MW within 15 minutes) but with the peak HRR capped at 120MW as described in Section 5 above.
Figure 5 HRR data from Runehamar up to 20mins with supperimposed coloured line for corrected fire size by geometry assumptions for the I-70
Ultrafast fire curve imposed (fire starting at t=0) and
capped at 120MW

1-70 Cover Design Fire Tech Note Rev 1 17092015 14
Technical note 6.2. Evacuation characteristics As defined by PIARC [19], the fundamental principle to be followed with regards tunnel safety is that in the event of an emergency in a tunnel, tunnel users will self-rescue. After the self-rescue phase of an emergency, the fire and rescue services will intervene to fight the fire and assist any remaining tunnel users that are unable to self-rescue.
Self-rescue evacuation pre-movement time (time between fire ignition and leaving the vehicle; comprising a recognition time and a response time) is highly influenced by aspects of occupant behaviour and can often comprise the longest part of the total escape time. Pre-move time comprises the sum of the time to receive a cue (either from seeing the incident or from receiving a communication – sometimes called the ‘recognition’ time) and the time between the cue and actually leaving the vehicle – sometimes called the ‘response’ time.
The PIARC QRA Model [17] uses an occupant response model to calculate pre-movement times for different scenarios. The QRA Model references [17] state that the principal parameters affecting occupant pre-movement times in tunnels are the alarm system or cue, the occupant characteristics (alertness, mobility etc) and the nature of the vehicle (multi or single occupants etc). For those near the fire, pre-movement can be reduced because the ‘cue’ is received early in the form of seeing the incident. The movement time may be longer because the nearest exit may not be accessible due to the incident effects. For those further from the fire, the pre-move may be longer but movement time shorter.
The QRA Model refers to pre-movement times of as short as 80s for those near the incident in situations with rapid fire detection and alarm; or as long as 8mins for those remote from the incident, closer to a point of safety and in a scenario with no tunnel fire detection and alarm system. Of course, these are broad-based estimates developed for the purposes of assessing risk but are nevertheless useful to inform the potential range of pre-movement time estimates for the I70.
The following scenario is considered:
Evacuation of a bus from near the fire incident with the nearest exit blocked.
a. At this stage, pre-movement time is taken as 5 minutes, being approximately mid-way between the 80 second and 8 minute range discussed above. In reality, for a potentially severe fire, the pre-movement time for those in the most hazardous areas near the fire would be expected to be less, depending on the tunnel detection and alarm systems
b. Bus evacuation time (40 people6 at approximately 1 second per person7 to abandon the bus) = 40 seconds, after the pre-move time.
c. Movement time to the nearest exit for those nearest to the fire location would be 200 seconds8.
This equates to a total maximum evacuation time of 9 minutes (300+40+200 seconds), as illustrated in the Figure below. Fire service response time in Denver has been advised by Denver Fire Department9 as following the NFPA 1710 standard of 4 minutes from being on route to site (to which the alarm and mobilisation time would need to be added). Taking account of fire growth periods, the heat release rate is around 55MW at 9minutes, the time at which all Cover occupants are predicted to have evacuated. The fire would then continue to grow, in the absence of a fixed fire fighting system affecting fire fighting operations but not affecting evacuation.
6 On the basis that a typical 12-metre (40-foot) urban transit bus can normally seat 43 passengers and can carry up to 37 additional standees if all of the aisle circulation space is filled [20]; totalling 80 passengers at maximum occupancy; and assuming, conservatively, the bus may be expected to be running at half-capacity [21].
7 See for example http://www.firesafetysearch.com/news/successful-evacuation-from-a-burning-bus/ where research indicates 74 people can evacuate in 1min 25s; just over 1 person per second
8 Assuming two doors equally spaced every 100 meters and a walking speed of 0.5m/s, equating to a movement time of 200 seconds. For the case of mobility impaired users, studies have been conducted as referenced in [12] and concluded that an assumption of 0.5m/s can be considered as a reasonable estimate.
9 Communication between Atkins and the Division Chief of Technical Services [18]

1-70 Cover Design Fire Tech Note Rev 1 17092015 15
Technical note
Figure 6 HRR data from Runehamar up to 20mins with supperimposed coloured lines for different fire growth rates and evacuation assumptions for the I-70.
Pre-movement time
Movement time
Evacuation time assumed for users nearer to the fire site (t=9mins) others assumed to evacuate in less time

1-70 Cover Design Fire Tech Note Rev 1 17092015 16
Technical note
7. Influence of Fixed Fire Fighting Systems (FFFS) on Design Fire Size
FFFS provides benefits by way of three key mechanisms: cooling to limit fire growth; screening radiant heat transmission; and water heating and phase change to limit the residual convective heat release.
NFPA 502 states in note (6) in table A.11.4.1 titled “fire data for typical vehicles” that if a FFFS is installed in accordance with chapter 9 (water based fixed fire-fighting systems) the AHJ can reduce values for HRR for design purposes based on an engineering analysis considering the system activation time, resilience and reliability.
Non-DG fires would be expected to grow slowly initially, a period during which FFFS activation would be expected to be very effective at controlling further fire growth; and then if uncontrolled, fire growth would accelerate to a fast growth period where FFFS is less effective.
A DG scenario of a major tanker rupture and rapidly developing pool fire, potentially resulting in explosion, is beyond what is considered a reasonable design scenario for the I-70 Cover for which a practical solution could be developed. We note, from the analysis undertaken and reported previously in this TN that such incidents would be extremely rare (300MW fires estimated to be of the order of one in 30,000 years) and given their speed of development could not be controlled effectively by any practicable tunnel FFFS response. However, for incidents where the tanker vehicle is secondary to a fire source, the FFFS will act to cool the DG vehicle’s surfaces and reduce the likelihood of involving the DG in the fire incident.
Tests on solid fuel and liquid pan-fires [e.g. 7,8,9,10] have shown that FFFS is capable, if activated appropriately, to control fire heat release rate to levels that are more manageable with regards ventilation and fire service intervention (see Figure 7 below).
Figure 7 HRR characteristics: comparison between suppressed and unsuppressed fires (from SOLIT final report, 2007 [23])

1-70 Cover Design Fire Tech Note Rev 1 17092015 17
Technical note The extent of fire growth control depends on the type of system (pressure, water flow rates), the fire growth rate and the delay before activation of the FFFS. Early activation would be expected to limit heat release rate to low MW values of perhaps single-figures depending on activation time and growth rates.
In addition to heat release rate control, further heat will be lost to the tunnel walls through radiation and to the FFFS water through water heating and phase change (see illustration in Figure 8). Upon fire suppression deployment, the ventilation system will operate to control smoke and prevent backlayering. The ventilation need only be designed to control the convective heat release rate (HRRconv) which is lower than the total chemical heat release rate (HRRchem.) because some of the HRRchem is radiant (HRRrad) and some is absorbed by the suppression water (HRRsupp) – see Figure 8 below.
Figure 8 Illustration of heat release rate components
The proportion of heat release absorbed by the suppression system is dependent on system detailed design and could only be estimated through fire tests and subsequent analysis. However, research based on tests carried out by the Land Transport Authority in Singapore [9] has indicated that up to 50% of the residual fire heat release (HRRchem) may be lost to radiation and water effects, leaving 50% convective heat load (HRRconv) to be managed by the longitudinal ventilation system.
For the I70 case, assuming the ultrafast fire growth to 120MW as described in Section 5, with ‘late’ activation of FFFS when the fire has already reached a significant size, it should be expected that fire would continue to grow but may be limited to a lower peak of 60 MW total HRR by the action of appropriately designed FFFS. Such performance is illustrated in Figure 7 taken from results of full scale fire tests with a water mist system [23]. More recent tests and subsequent analysis, as reported from the Singapore LTA tests [9, 22] and the SOLIT2 tests [7] have provided further evidence of potential performance of appropriately designed and operated FFFS. This 60MW figure is considered a reasonable Reference Design value based on the I70 tunnel characteristics and the current industry knowledge for tunnel fire and FFFS.
This fire size is reduced further for the purposes of longitudinal ventilation system design, given that relevant research [9] indicates that only 50% of this residual total HRR is the convective load to be managed by a longitudinal ventilation system. Assuming that the residual total HRR is at 60MW, the residual convective load to be managed by the longitudinal ventilation system is taken to be 30MW.
.

1-70 Cover Design Fire Tech Note Rev 1 17092015 18
Technical note
8. Summary, Conclusions and Recommendations
1. The design fire size (the design peak heat release rate in MW) provides the fire characteristic used to inform the design sizing and configuration of the tunnel fire safety equipment and facilities (the scope of this Technical Note does not cover structural fire protection). The design fire size is not prescribed in standards. A judgement on design fire size is informed by assessment of the probability of fire return periods in the I-70 Cover (derived from the traffic and tunnel characteristics) and influenced by an understanding of prevailing good practice. The design fire for safety systems may be informed by performance (risk) based assessment to evaluate the I-70 Cover fire safety as a whole. It should be emphasised that the design fire is not the worst possible fire that could occur but is a basis for design that provides an acceptable level of risk in the I-70 Cover.
2. The length of the covered lid section at less than 1000ft may be considered short but given the number of traffic lanes and high traffic flow flows (AADT of >225,000), the I70 Cover is classified under NFPA 502 (2014) as a Category C Tunnel, requiring commensurate fire safety provisions including consideration of fixed fire fighting systems and mechanical ventilation.
3. NFPA 502 suggests a fire size of 300MW when a flammable/combustible liquid tankers are considered. Based on engineering analysis, a 300MW fire event is predicted to have a sufficiently long return period (in the order of once every 30,000 years) to fall outside of what is considered a reasonable design case for this project.
4. Standards and good practice alone would indicate a representative design fire load of 150 MW is appropriate, in general, for the ventilation design for a road tunnel in the US. UK and US practice for new and recently refurbished tunnels have adopted 100MW as a design fire load in the absence of a fixed fire fighting system (FFFS). Good practice is indicating an upwards trend in fire sizes that tunnel systems are required to be designed to deal with. It is understood by Atkins that the ventilation for the Woodall Rodgers freeway covered section in Dallas Texas, which is a similar concept as the I-70 Cover with similar length and traffic arrangements10, has been designed for 100MW fires. It is also understood that the fire safety design did not consider the use of FFFS at the early stages but ventilation only. However FFFS in the form of a sprinkler system may have been considered at a later stage11.
5. Fire frequency analysis for the I-70 Cover indicates that a design fire load of 150MW is appropriate, subject to consideration of the impacts of tunnel geometry, FFFS and the duration of the evacuation phase on design peak heat release rates. Analysis shows that a design for fires of up to 150MW is shown to be sufficient to cover 99.9% of fires predicted to occur in the I-70 Cover.
6. Research has shown that tunnel geometry and particularly width would have an influence on the potential peak heat release rate of a severe fire. A potential 150MW fire is shown to be more likely to be limited to a peak heat release rate of 120MW when considering the specific geometry of the I-70 Cover.
7. Fire growth characteristics and evacuation timelines are shown to be as critical as overall fire peak heat release rate. Given appropriately conservative assumptions for parameters affecting these aspects, for the potential 120MW fire at an ultra-fast growth rate, the I-70 Cover would be expected to have been evacuated within 9-minutes, when the fire is at a HRR of 55MW. By this time it is expected that the fire department would be on-site at the covered section.
8. FFFS has the potential to limit fire growth and reduce the convective heat load to be managed by the ventilation system. NFPA 502 states that if a FFFS is installed the AHJ can reduce values for HRR for design purposes based on an engineering analysis considering the system activation time, resilience and reliability.
10 1200ft and 8 lanes per bound so therefore carrying slightly less traffic than the I-70 Cover
11 http://www.dmagazine.com/publications/d-magazine/2012/special-report-the-park/how-klyde-warren-park-was-built

1-70 Cover Design Fire Tech Note Rev 1 17092015 19
Technical note 9. Although ventilation design for 55MW convective load is possible within the constraints of the I-70
Cover project, such design would require larger and/or more jet fans with commensurate additional noise and power requirements. With the implementation of a FFFS there is potential to reduce the design fire load for the ventilation. For a potential 120MW fire, appropriately designed FFFS will be expected to limit fire growth to a total HRR of 60MW. The convective proportion of this residual HRR that is required to be managed by the longitudinal ventilation system is estimated to be 50% of this value, 30MW (see summary flow chart below in Figure 9).
10. FFFS is recommended for the I-70 Cover to limit fire growth to a peak of 60MW; and to further limit the residual convective heat release rate seen by the ventilation system to 30MW. Design and development of specifications is to proceed on this basis pending approval of the AHJ. FFFS offers the additional benefits associated with the support of fire fighting, protection of the structure and equipment of the I-70 Cover during a fire and enabling the more rapid re-opening of the tunnel; limiting associated traffic delays and maximising availability.
11. The ventilation design fire load is recommended to be 30MW convective heat load with implementation of a FFFS; design and development of specifications is to proceed on this basis pending approval of the AHJ

1-70 Cover Design Fire Tech Note Rev 1 17092015 20
Technical note
Figure 9 Flow chart sumarising the aspects considered for the I-70 Cover design fire
FFFSNo
FFFS
30MW
55 MW
300 MW
150 MW
120 MW
60 MW
NFPA 502 (2014 edition) suggests a representative
HRR for flammable/combustible liquid tankers
(HazMat) of 300MW based on experimental data. An event that involves a 300MW
fire is predicted to be very rare (return period in the order of 30,000 years).Based on an engineering analysis a design fire of 150MW is shown to be sufficient to account for 99.9% of the fires predicted to occur in the tunnel.
In accordance with NFPA 502, considering the geometry of the I70 Cover compared to that
of test case fires, the peak HRR in the I70
would be expected to be lower than that in
narrower tunnels. Peak HRR baseline of
150MW is argued to be reduced to 120MW.
With no FFFS, the 120MW fire would be expected to be reached in 13.3 minutes. Considering a reasonable evacuation scenario, the tunnel would be expected to be clear of evacuees by 9mins; with the fire department on site by this time. Given particular fire growth assumptions, the peak fire HRR would be expected to be at 55MW at 9 minutes.
If FFFS is applied, it should be expected that
fire would continue to grow but may be limited to 60 MW by the action
of appropriately designed and timely activation of FFFS.
Recent research indicates that only
50% of this residual HRR is the
convective load to be managed by a
longitudinal ventilation system.
Therefore the design fire load for the
ventilation should be 30MW convective fire
load.
1-70 Cover Design Fire Tech Note Rev 1 17092015 21
Technical note
9. References 1. UPTUN (2003). Summary of large scale fire tests in the Runehamar Tunnel 2. Silvertown tunnel, Fire safety report; Atkins (June 2014) - STWTN-ATK-GEN-TUXX-RP-Y-0006 3. Handbook of Tunnel Fire Safety, 2nd edition (2012). 4. Fire and smoke control in road tunnels (1999). PIARC Committee on Road Tunnels (C5). 5. Design fire characteristics for road tunnels (Unpublished, September 2011). PIARC Technical Committee
C4, Road Tunnels Operation. 6. UPTUN 2008. Workpackage 2 Fire development and mitigation measures D213. Runehamar Tunnel fire
tests. 7. Guidance for a Comprehensive Evaluation of Tunnels with Fixed Fire Fighting Systems. Scientific Final
Report of the SOLIT² Re-search Project Prepared by the SOLIT² Re-search Consortium. Annex 2. Selected Results of Full Scale Fire Tests.
8. Second Benelux tests. 9. Tarada et al (2013). The energy budget in suppressed tunnel fires. BHRG group. 10. PPR140 Ventilation During Road Tunnel Emergencies, TRL Report 2006 11. DARTS Work Package 4. Report 4.4. Identification and Quantification of Fire Hazards –Fire and smoke.
2004. 12. National Cooperative Highway Research Program (2011). Design fire characteristics for road tunnels. 13. Ingason, H. and Lonnermark, A. (2005). Heat release rates from heavy goods vehicle trailer fires in
tunnels. Fire Safety Journal 40 (2005) 646–668. 14. Alston, J. Kandra D., Potter R., 2013. Upgrade of an existing transverse ventilation system to a
longitudinal system using a Saccardo nozzle. BHRG conference paper. 15. Carvel, R (2004) FIRE SIZE IN TUNNELS, Thesis submitted for the degree of Doctor of Philosophy Heriot-Watt University, School of the Built Environment, Edinburgh, September 2004 16. Ingason H, Y Li and A Lonnermark (2015) Tunnel Fire Dynamics 17. OECD / PIARC QRAM www.piarc.org 18. Email Denver Fire Department From Garrod, Steven ([email protected]). To Yenny Gomez.
Email titled: Response Times. Sent on 27/02/2015 22:15 (GMT time). 19. PIARC Road Tunnels Manual – Chapter 2.0 - Safety, Section 2.1 – General Principles
http://tunnels.piarc.org/en/ 20. US Transportation Research Board, Transit Capacity and Quality of Service Manual Part 2/ Bus Transit
Capacity 21. European Data on average bus occupancy - http://www.eea.europa.eu/data-and-
maps/indicators/occupancy-rates-of-passenger-vehicles/occupancy-rates-of-passenger-vehicles-1 22. Performance-Based Design Using Tunnel Fire Suppression. Tarada & Bertwistle; North American
Tunnelling Conference 2010, Portland, Oregon, USA 23. SOLIT, 2010. http://www.solit.info/safety_tunnels_en/testprogram_results.htm.