1 3 , Raquel Vega , Alejandro Toscano , and Xabier Arroyo · 1 1 Revision 1. Correction date: 8...
51
1 Revision 1. Correction date: 8 October 2013 1 Kaolinite transformation into dickite during burial diagenesis 2 3 Javier Cuadros 1* , Raquel Vega 1 , Alejandro Toscano 1 , and Xabier Arroyo 2 4 5 1 Department of Earth Sciences, Natural History Museum, Cromwell Road, London SW7 5BD, UK 6 7 2 Faculty of Geological Sciences, Complutense University of Madrid, C/ José Antonio Novais n. 2, 8 Ciudad Universitaria, 28040 Madrid, Spain 9 10 11
Transcript of 1 3 , Raquel Vega , Alejandro Toscano , and Xabier Arroyo · 1 1 Revision 1. Correction date: 8...
1
Revision 1. Correction date: 8 October 2013 1
Kaolinite transformation into dickite during burial diagenesis 2
3
Javier Cuadros1*, Raquel Vega1, Alejandro Toscano1, and Xabier Arroyo2 4
5
1Department of Earth Sciences, Natural History Museum, Cromwell Road, London SW7 5BD, UK 6
7
2Faculty of Geological Sciences, Complutense University of Madrid, C/ José Antonio Novais n. 2, 8
Ciudad Universitaria, 28040 Madrid, Spain 9
10
11
kristi
Typewritten Text
kristi
Typewritten Text
kristi
Typewritten Text
kristi
Typewritten Text
kristi
Typewritten Text
kristi
Typewritten Text
kristi
Typewritten Text
kristi
Typewritten Text
kristi
Typewritten Text
kristi
Typewritten Text
kristi
Typewritten Text
kristi
Typewritten Text
kristi
Typewritten Text
kristi
Typewritten Text
kristi
Typewritten Text
kristi
Typewritten Text
kristi
Typewritten Text
kristi
Typewritten Text
2
ABSTRACT 17
The mechanism of kaolinite transformation into dickite has been investigating using 13 samples 18
from the Frøy and Rind oil fields (Broad Fourteens basin, North Sea), 3 kaolinite specimens with 19
different crystal order (KGa-2, Kaolinite API 17, Keokuk kaolinite), and 2 dickite-rich samples 20
(Natural History Museum collection). Detailed analysis of XRD, thermal analysis and SEM data 21
show that: (1) as dickite content increases, there is also an increase of the crystal order of kaolinite; 22
(2) in dickite-rich specimens kaolinite and dickite have crystals (or XRD-coherent domains) of the 23
same size; (3) there is no specific dehydroxylation temperature for each polytype, rather particle 24
size and crystal order control dehydroxylation temperature independently of polytype; (4) with 25
progressive dickite content, the development of both particle size and the size of the coherent 26
crystal domains within particles is greater in the c direction than in the ab plane; (5) the growth of 27
defect-free segments in the c direction is not connected with the growth in the a and b directions, as 28
would be expected in crystallization from solution; (6) textural features indicate coalescence of 29
kaolin plates with burial; (7) there is a very weak positive correlation between particle dimensions 30
and relative kaolinite-dickite content. These results are interpreted as resulting from a double 31
reaction taking place in the solid state with burial. Some kaolinite domains grow in size and crystal 32
order while other domains are transformed into dickite. Presumably, also the dickite domains 33
formed early in the transformation grow in crystal order. The transformation into dickite stops at 34
90-95% dickite because the remaining kaolinite domains are so large and stable that the stability 35
increase produced by the polytype transformation would be negligible. 36
37
Keywords: POLYTYPISM: Dickite and Kaolinite, TGA, XRD DATA. 38
39
40

3
INTRODUCTION 41
Kaolinite transformation into dickite takes place as a response to increasing temperature in a variety 42
of environments. In the early literature, dickite was related to hydrothermal processes. Zimmerle 43
and Rösch (1990) analyzed dickite occurrences in Europe and concluded that “most of the dickite 44
Phanerozoic sediments of Europe occurs in porous and permeable rocks and is associated with a 45
high degree of coalification, hydrothermal mineralization, and a high present heat flow”. According 46
to them, the specific analysis of a large number of sedimentary rock samples within the former 47
German Democratic Republic indicated that increasing age and burial depth alone do not cause 48
kaolinite transformation into dickite. These observations are interesting and helpful to clarify the 49
conditions that trigger or accelerate the transformation, although sufficient evidence has gathered to 50
show that kaolinite-to-dickite transformation takes place frequently in diagenetic conditions. The 51
reaction has been mainly documented in sandstone diagenesis (Shutov et al. 1970; Ehrenberg et al. 52
1993; McAulay et al. 1994; Lanson et al. 1996; Beaufort et al. 1998; Hassouta et al. 1999; Martin-53
Martin et al. 2007; De Bona et al. 2008) but also in diagenesis of shale (Ruiz Cruz and Reyes 1998), 54
both sandstone and mudstone (Ruiz Cruz and Moreno Real 1993), and sandstone, siltstone and 55
shale (Marfil et al. 2003). From these studies, it transpires that besides the temperature increment, 56
other factors play a role in facilitating the progress of the reaction. The most important of such 57
factors is water accessibility, which includes porosity and the actual presence of water, as oil in 58
reservoirs appears to stop the transformation (Ruiz Cruz and Moreno Real 1993; Hassouta et al. 59
1999; Lanson et al. 2002; Marfil et al. 2003; De Bona et al. 2008). Low pH fluids and faulting are 60
also mentioned as favorable factors (Martin-Martin et al. 2007; De Bona et al. 2008). 61
62
The present contribution deals with the kaolinite-to-dickite transformation reaction and not with any 63
possible origin of dickite, and thus the focus is on previous literature where kaolinite dickitization is 64
documented by a transformation series. Kaolinite transformation into dicke due to hydrothermal 65
processes is expected and reported occasionally (Parnell et al. 2000), but frequent reports of 66

4 hydrothermal dickite do not establish a necessary genetic link between kaolinite and dickite. Choo 67
and Kim (2004) find predominant dickite with mixtures of kaolinite (and also nacrite) that may 68
indicate a kaolinite precursor. Simeone et al. (2005) describe supergene kaolinite and hydrothermal 69
dickite in successive hydrothermal alteration haloes, but without implying a genetic connection 70
between them. Parnell et al. (2004) indicate that two pulses of hot fluids precipitated kaolinite (50-71
80 ºC) and dickite (maximum 100-120ºC) independently. Dickite of hydrothermal origin is 72
described by Palinkas et al. (2009) as precipitated from fluids (290-330 ºC) possibly derived from 73
K-feldspar and muscovite dissolution. Similarly, dickite of diagenetic origin has been interpreted to 74
form as a result of precipitation from porous solutions in clay-shales (Veniale et al. 2002) 75
mudstones near coal seams (Goemaere 2004) and following partial illite dissolution caused by 76
stress in marls (Buatier et al. 1997). 77
78
There is a consistent agreement in the fact that dickite replaces kaolinite, or dickite precipitates 79
preferentially over kaolinite, at a temperature threshold of 80-160 ºC, depending on individual 80
studies. However, studies about the relative stability of the two polytypes do not agree and some of 81
them are at odds with the higher stability of dickite at higher temperatures inferred from natural 82
sequences. Zotov et al. (1998) concluded that kaolinite is metastable with respect to dickite at least 83
up to 350 ºC, and that pressure had a negligible stabilization effect. According to them, the 84
observed prevalence of kaolinite in surface environments and the timing of kaolinite dickitization 85
are due to kinetic effects. De Ligny and Navrotsky (1999), Fialips et al. (2001), and Fialips et al. 86
(2003) determined standard free energies of formation (25 ºC, 1 bar) that were 2-26, 3-8, and 12-25 87
kJ/mol more stable for kaolinite, respectively. They argued that pressure or temperature would not 88
alter their relative stability. These values would explain that kaolinite is much more abundant than 89
dickite but make kaolinite dickitization problematic. For the latter, they suggest possible 90
explanations such as kinetic factors that affect reaction paths in the polytype precipitation from 91
solution or transformation, and differences in hydration state or minor element chemistry between 92

5 kaolinite and dickite that affect their relative stabilities. Calculations of the ΔG of formation at 93
standard conditions (298.15 K and 1 bar) by Anovitz el al. (1991) indicated that kaolinite is more 94
stable than dickite at such conditions by 1.38 kJ/mol, and they argued that the smaller molar volume 95
of dickite may reverse the stability relation at high pressure. Thus, kaolinite dickitization would be 96
driven by pressure. First principle calculations by Sato et al. (2004) produced differences between 97
dickite and kaolinite in the range 0.07-0.3 kJ/mol. Thus, the driving force for dickite replacing 98
kaolinite with increasing temperature remains unknown. 99
100
The mechanism of kaolinite dickitization is an essential piece of information to understand the 101
process. It has implications in terms of the driving force, kinetics, and environmental factors 102
promoting or hindering the reaction. The mechanism has been interpreted both as dissolution-103
precipitation and as a solid-state transformation. A dissolution-precipitation process can possibly 104
have a greater effect on the surrounding sediment by the transient alteration of the fabric during 105
grain dissolution, which would facilitate fluid mobility and Si mobilization. 106
107
Support for a solid-state transformation process has been found in several features of the kaolinite-108
dickite series. The displacement in the frequency of the infrared (IR) OH stretching bands was 109
interpreted by Brindley et al. (1986) to indicate a transition from kaolinite to disordered kaolinite, 110
then to disordered dickite and finally to well-crystallized dickite, consistent with a model of crystal 111
disorder based on displacement of the octahedral vacancies in the layer sequence (all kaolinite 112
layers have the octahedral vacancy in the same position, whereas in dickite the vacancy alternates 113
between the two octahedra at both sides of the crystallographic mirror plane; Bailey 1980). In other 114
words, they suggested that the polytype transition takes place by the displacement of the octahedral 115
occupancy within the crystals as such a mechanism would generate the above-mentioned sequence. 116
Interestingly, Shutov et al. (1970) also found that disordering of kaolinite crystals is a previous step 117
for dickitization. They proposed a model in which kaolinite layers first slide to generate a dickite-118

6 like two-layer sequence and then the cation vacancy is displaced, resulting in a true dickite 119
structure. Such changes would generate dickite domains that then would spread in opposite 120
directions within the kaolinite crystals. Ruiz Cruz and Moreno Real (1993) interpreted the existence 121
of an intermediate structure (perhaps mixed-layer kaolinite-dickite) as indicated by band 122
displacements in their IR spectra, a dehydroxylation event at intermediate position between those 123
typical of the two polytypes (differential thermal analysis, DTA), XRD peak shifts, and possible 124
XRD superlattice peaks. Lanson et al. (1996) interpreted their thermal analysis results and the lack 125
of relation between kaolin grain morphology and polytype also as the transformation via some 126
intermediate structure. Parnell et al. (2000) found that isotope analysis of dickite yields an 127
unrealistically low formation temperature, that suggests transformation from a kaolinite precursor 128
where oxygen is preserved and hydrogen partially exchanged with interstitial water. Franks et al. 129
(1997) found no resetting of the original kaolinite O isotope signature during the transformation to 130
dickite in Algerian sandstone. Among the above features supporting a solid-state transformation, the 131
dehydroxylation event at intermediate temperature between kaolinite (typically ~550 ºC) and dickite 132
(typically ~650 ºC) is inconclusive because (1) highly crystalline kaolinite dehydroxylates at 133
temperatures similar to dickite (Stoch and Wacławska 1981; Suitch 1986), (2) dickite intercalation 134
followed by expulsion of the intercalate reduced dickite dehydroxylation temperature from 660 to 135
562 ºC, suggesting that dehydroxylation temperature in this range is a function of crystal order and 136
not an intrinsic feature of the polytype structure (Wada 1965), and (3) kaolin particle size has been 137
reported to have some control on dehydroxylation temperature (Beaufort et al. 1998). 138
139
It can be expected that solid-state transformation would generate domains of both kaolinite and 140
dickite within mineral grains and crystals and, in principle, the existence of such domains would 141
support this mechanism. Intracrystalline domains of both polytypes were not found in a HRTEM 142
study of sedimentary kaolinite-dickite (Kogure and Inoue 2005a) but were found in a similar study 143
of hydrothermal kaolin (mainly dickite; Kogure and Inoue 2005b), where both kaolinite and dickite 144

7 domains were present within dickite and kaolinite crystals, respectively. However, the authors 145
interpreted these intracrystal domains as defects in crystal spiral growth from solution. Dickite- and 146
nacrite-like fragments have also been found by HRTEM, selected area electron diffraction, and IR 147
spectroscopy in a sedimentary kaolinite (Johnston et al. 2008; Kogure et al. 2010), where no 148
polytype transformation is likely, which strongly suggests that such fragments are the result of 149
stacking faults. Thus, domains of a different polytype may be frequent in the minerals of the kaolin 150
group simply due to “errors” in the crystal growth, with no connection to a polytype transformation 151
history. Polytype identification of kaolin minerals with electron microscopy techniques is difficult 152
due to fast damage from the electron beam, which delays accumulation of this type of information. 153
Also, these techniques are likely to produce biased results towards highly perfect crystals, more 154
resistant to the ion beam, where domain intercalation might be less abundant or of a different nature 155
than in less perfect crystals. 156
157
The dissolution-precipitation mechanism is most frequently concluded on the basis of the 158
morphological change from vermicular structures, where kaolinite dominates, to blocky crystals 159
where the major component is dickite (Ehrenberg et al. 1993; Beaufort et al. 1998; Hassouta et al. 160
1999; Martin-Martin et al. 2007). However, there is ample evidence that these morphological types 161
are not univocally related to the polytypes, and there exist both vermicular dickite (Lanson et al. 162
1996; Ruiz Cruz and Reyes 1998; Choo and Kim 2004; De Bona et al. 2008) and blocky kaolinite 163
(Ehrenberg et al. 1993; Kumeda et al. 2007). Beaufort et al. (1998) proposed a dissolution-164
precipitation model including precipitation on large kaolinite grains acting as templates, which 165
would explain the existence of polytypes with both morphologies. 166
167
This contribution is an investigation of the mechanism of kaolinite dickitization in a sandstone 168
sedimentary series from the North Sea by a detailed structural and morphological analysis of the 169
kaolinite-dickite series together with kaolinite end-members and dickite-rich specimens of various 170

8 characteristics, used for comparison. Crystal growth patterns and textural features are interpreted to 171
indicate a solid-state transformation mechanism. 172
173
MATERIALS AND METHODS 174
Samples 175
A series of kaolinite-dickite core specimens of diagenetic origin from sandstones in the Frøy and 176
Rind oil fields, Broad Fourteens basin, Brent Formation of the Norwegian Continental Shelf, North 177
Sea, was analyzed (ELK series; Cassagnabere 1998). They were made available by C. Fialips 178
(Total, Pau, France) and D. Beaufort (HydrASA Laboratory, University of Poitiers, France), and 179
were studied as received. They are the 5-10 μm size fraction of specimens from depths 3,036-4,520 180
m. The original samples had been gently dry-ground to less than 2 mm grain size, dispersed in a 181
water suspension by ultrasonic treatment, separated by sedimentation, and hydrocarbons were 182
removed by Soxlhet extraction using chloroform (Cassagnabere 1998). The locality, geological 183
conditions and possibly some of these samples have been described by Lanson et al. (1996) and 184
Beaufort et al. (1998) and the reader is referred to these publications. Specimens from the same 185
locality have been studied by Kogure and Inoue (2005) and Kogure et al. (2005) using several 186
electron microscopy techniques. The original sediments are of aeolian origin. Kaolinite formed after 187
K-feldspar dissolution and then transformed to dickite with increasing burial depth. Maximum 188
burial temperatures experienced by the sediments range from ~110 to <160 ºC (Lanson et al. 1996; 189
Beaufort et al. 1998). 190
191
Three kaolinite and two dickite samples were also studied as a reference for the structural 192
parameters determined in this investigation. 1) The kaolinite KGa-2, from Warren County, Georgia, 193
USA, is of supergenic origin, product of a complex alteration history and has low crystallinity. Its 194
geological context is described by Moll (2001). It was provided by the Source Clays Repository of 195
the Clay Minerals Society. The sample was simply ground as provided. 2) The kaolinite API 17 196
9 (labeled here as Kaol 17) from Lewistown, Montana, USA, is one of the reference materials from 197
the American Petroleum Institute Project 49. It originated by hydrothermal alteration of feldspar in 198
a syenite porphyry. The geological description can be found in Kerr and Kulp (1949), where this 199
specimen was originally described as dickite, although it was later demonstrated to be kaolinite 200
(Lindberg and Smith 1974). This kaolinite is of intermediate crystallinity. The kaolinite provided by 201
the American Project Institute, which has the appearance of white, soft grains of 0.5-1 cm size, was 202
gently ground, without any further treatment. 3) The Keokuk kaolinite (here labeled as Keokuk) is a 203
very high crystallinity specimen from geodes originated in Keokuk, Iowa, USA. The processes that 204
produced the Keokuk geodes are described by Hayes (1936) as far as they are understood. The 205
accepted interpretation is that kaolinite precipitated in voids produced by carbonate dissolution, 206
from fluids generated after silicate mineral dissolution. There is no reference in this interpretation to 207
hydrothermal activity. Kaolinite from some of the snow-white patches in one of the geodes was 208
scratched with a needle and then gently ground. No further treatment was applied. 209
210
The two dickites are from the collection in the Natural History Museum (London). 1) Dickite BM 211
1927, 60 (here labeled BM 1927) is from a massive slate collected in Kolno, Nowa Ruda, Silesia, 212
Poland. The sample was collected in the first quarter of the XXth century, when this region was part 213
of the Prussian Silesia. Zimmerle and Rösch (1990) indicate that dickite in this area is connected to 214
hydrothermal activity. Some material from the slate was scratched with a needle and gently ground, 215
without any further treatment. 2) Dickite BM 1923, 393 (henceforth BM 1923) is from Red 216
Mountain, San Juan County, Colorado, USA. No more information is available. The specimen 217
consisted of sub-millimeter crystals, of which an aliquot was collected and gently ground. 218
219
X-ray diffraction 220
The samples were analyzed using XRD on random powders. To avoid orientation of the crystals, 221
the samples were side-loaded. Two types of holders were used depending on the amount of sample 222
10 available. The larger holders produced a more random orientation as observed by the intensity ratio 223
of basal to non-basal reflections. However, only two samples were analyzed in the larger holders, 224
Keokuk and Kaol 17. The analyses were carried out using a Philips PW 1830 diffractometer at 42 225
kV and 42 mA, with Cu Kα radiation, graphite secondary monochromator, 1º divergent slit and 0.1 226
mm receiving slit. The scans were performed between 5 and 80 º2θ, with 0.02 º2θ steps and 8 s of 227
count time per step. 228
229
Several types of analysis were performed using the XRD data. First, mineral phases were identified, 230
including kaolin polytypes (kaolinite, dickite) and non-kaolin phases. The identification of the 231
kaolin polytypes was carried out using the data from Bailey (1980). Second, intensity ratios of non-232
basal to basal reflections were carried out measuring the height of the 00l peaks at 7.15 and 3.57 Å, 233
and hkl peaks at 4.45, 2.56 and 1.488 Å, and using the formula 234
100 × hnon-basal / [(h7.15Å + h3.57Å)/2] (Eq. 1) 235
where h represents peak height. Heights were measured from the line of zero counts, which is a 236
good approximation as the peak heights ranged from 1,000 to 85,000 counts (only two peaks had 237
500 and 600 counts) and the background had 150-250 counts. 238
239
The relative proportion of kaolinite and dickite in the specimens was calculated measuring the 240
intensity of kaolinite and dickite peaks, or groups of peaks, in near proximity. Eleven groups were 241
used (figures in Å and polytype indicated in parenthesis): 1) 3.954 (d), 3.841 (k), 3.791 (d), 3.741 242
(k); 2) 3.428 (d), 3.372 (k); 3) 2.794 (d), 2.753 (k); 4) 2.526 (k), 2.505 (d); 5) 2.386 (d), 2.379 (k); 243
6) 2.340 (k), 2.324 (d), 2.290 (k); 7) 1.989 (k), 1.974 (d); 8) 1.790 (d), 1.781 (k); 9) 1.557 (d), 1.542 244
(k); 10) 1.375 (d), 1.338 (k); 11) 1.318 (d), 1.305 (k). Not all peaks or groups could be used in every 245
specimen due to interference with other mineral phases or because the peak resolution was not 246
sufficient. Particularly, group 5) above could only be used in the BM 1923 and 1927 specimens. 247
The intensities were measured as peak areas by curve-fitting assuming Gaussian shapes, using the 248

11 package GRAMS/AI from Thermo Galactic. Only curve-fitting calculations that could be 249
reproduced were used. The peak areas within each group were corrected using the experimental 250
peak intensities provided by Bailey (1980) and transformed into polytype percents. In two cases 251
(2.340 and 1.989 Å, both kaolinite) the peaks contain two unresolved reflections which, however, 252
result in an evident widening of the peaks. We assumed that the intensities in Bailey (1980) are 253
heights rather than areas. The overlapping peaks described above would result in a compound peak 254
whose area is the sum of both areas of the two peaks, but with a height that is not the sum of both 255
heights, which would make the peak intensities by Bailey (1980) not applicable to our data. This 256
problem was “corrected” by using half of the measured area in these two cases. The approximation 257
improved the similarity of the calculated polytype percents with those from other peak groups. The 258
polytype percents calculated for each sample were then compared, spurious values were eliminated 259
(one or two values outside the standard deviation of, at least, 4 other values), and the selected values 260
were averaged. 261
262
The XRD patterns were also used to analyze the size of the coherent scattering domains (CSDS) in 263
several directions of the crystals by means of measuring the width at half height of peaks 264
corresponding to different crystal indexes. It was intended to make measurements on peaks 265
corresponding to several 00l, 0k0, h00, 0kl, h0l, hk0, and hkl indexes (where h, k, l ≠ 0), however it 266
was not possible in many cases due to large peak overlap. If the peaks were entirely free from 267
overlapping, the measurements were carried out using the integration function of the package 268
GRAMS/AI from Thermo Galactic, in which the background is automatically selected and the 269
measurement performed on the experimental trace. Tests of manual measurements of several peaks 270
confirmed that the background subtraction was correct. If there was moderate overlap between 271
peaks, they were modeled by peak-fitting using the same computer package. Some measurements 272
correspond to composite peaks of both kaolinite and dickite, because they are almost coincident and 273
cannot be resolved. At intermediate and high º2θ values the Kα1 and Kα2 components were resolved 274

12 and the Kα2 component was subtracted before the width measurement. The CSDS values were 275
calculated from the measured widths using the Scherrer equation. Similar measurements were 276
carried out on the 00l peaks at ¼ and ¾ of the peak height to analyze the existence of two CSDS 277
populations. Small CSDS generate low, wide peaks, whereas large CSDS generate sharp, high 278
peaks. Thus, the lower part of a peak is mainly influenced by the small domains and the higher part 279
by the large domains. 280
281
Thermogravimetry 282
The specimens were thermogravimetrically (TG) analyzed using a TA SDT Q600 apparatus. Ten to 283
20 mg of sample were analysed on Pt crucibles, using an empty Pt crucible as a reference, between 284
room temperature and 1000 ºC, at a 10 ºC/min rate, and with a nitrogen flow of 10 ml/min. The 285
derivative of the TG curve (DTG) was used for the analysis as results are visually more clear and 286
can be studied with greater resolution. In the temperature range of kaolinite/dickite dehydroxylation 287
(400-800 ºC), the DTG curves consisted of complex systems with several maxima and shoulders. 288
They were decomposed into individual components using the package GRAMS/AI from Thermo 289
Galactic. DTG curves of dehydroxylation events are frequently not symmetric due to kinetic effects, 290
even in perfectly homogeneous samples. However, we assumed Gaussian peaks for the individual 291
components, with the goal of calculating and comparing the area under the DTG curve in several 292
ranges of temperature. The DTG curves of the kaolinite-dickite series from the North Sea displayed 293
similar characteristics and their components were centered roughly at the same temperature. The 294
other samples had very different DTG curves and in most cases the components had their centre at 295
temperatures other than those of the North Sea specimens. 296
297
Scanning electron miscroscopy 298
Five selected samples covering the range of kaolinite-dickite in the ELK series, as well as Keokuk, 299
Kaol 17 and BM 1927 were studied by scanning electron microscopy (SEM), using a JEOL JSM-300

13 820 electron microscope working at 20 kV, with a resolution of 35 Å. Secondary electron and 301
backscattering detectors were used. EDX chemical analysis was used to ascertain the nature of the 302
investigated particles. SEM observations were carried out on powder placed on conductive carbon 303
tape that was attached to the sample holders. The samples were sputter-coated with gold. 304
305
The dimensions of 4,638 particles were measured to investigate changes in the particle size during 306
the kaolinite-to-dickite transformation. The number of particles measured for individual samples 307
ranged from 376 (ELK 33) to 1,033 (Keokuk) and was 437-672 particles for the other samples. 308
Measurements were carried out only on particles were the ab plane was discernible from the c 309
direction. Measurements correspond to the c direction, or thickness of the particles, and to two 310
perpendicular dimensions in the ab plane. The largest dimension in the ab plane was labeled long a-311
b dimension, and the dimension perpendicular to it was labeled short a-b dimension. Typically only 312
two dimensions could be measured in a particle. In very few cases the particle was so placed that 313
the three dimensions could be measured without great error due to perspective. On many occasions 314
only one dimension could be measured. 315
316
RESULTS 317
Kaolinite-dickite quantification using XRD 318
The studied samples consisted mainly of kaolinite and dickite, with other phases present only in 319
minor amounts. The two XRD patterns where non-kaolin phases were more abundant are shown in 320
Figure 1a,b. All the other samples had a lower level of contamination. Kaolin polytype 321
quantification in samples from the North Sea shows a progressive dickite increase with depth up to 322
a maximum of 94 % dickite (Figure 2). The trend of increasing dickite is in agreement with some 323
previously reported data. For example, Ehrenberg et al. (1993) locate the transition from kaolinite- 324
to dickite-dominated specimens at 2,800-3,200 m in sandstones from the Norwegian continental 325
shelf, similar to our samples. Beaufort et al. (1998) report a change of dickite proportion from 20 to 326
14 100 % between 3,000 and 5,000 m in samples from the same Broad Fourteens basin based on IR 327
rather than XRD analysis. However, Lanson et al. (2002) show that the relative proportion of kaolin 328
polytype in sandstones at similar depth is very variable from well to well and not only dependent on 329
the experienced temperature, but also of rock porosity and, possibly, the nature of the interstitial 330
fluid (water or oil). Also based on IR methods, Cassagnabere (1998) and Lanson et al. (2002) show 331
that a few samples were completely transformed into kaolinite at depths ~2,100 m (Frøy reservoir) 332
and ~3,500 m (Rind reservoir). 333
334
Our study shows also variability of kaolinite-dickite proportion (Fig. 2) at 3,200-3,500 m depth, 335
where most of the samples come from. However, the data support a reaction path which progresses 336
much between 2,800 and 3,300 m, then the progress is reduced up to 3,600 m where it stops, not 337
reaching completion. The reaction progress was modeled using the equation: 338
)(max
1%% cdbe
DD −+= (Eq. 2) 339
where %D is the dickite percent, %Dmax (92.59% in the fitted equation) is the maximum dickite 340
content found, b (-0.0097) is the slope, d is depth, and c (3,055.11 m) is the depth at which the 341
inflexion point occurs in the equation, or the centre in the steep part of the curve. This equation 342
assumes the shape of the transformation progress at shallow depths, and the results is reasonable 343
because the reaction is expected to progress slowly at the beginning, due to the low temperature, 344
and to accelerate as the temperature increases. The model indicates that the transformation begins at 345
2,500 m. There are no detailed temperature data available for this well and the specific onset 346
temperature can only be roughly assessed. Considering the maximum temperature of ~110 to <160 347
ºC (Lanson et al. 1996; Beaufort et al. 1998) for the well, assuming that the maximum temperature 348
and burial of 20 ºC and 670 m from the Aquitan Basin (France; Beaufort et al. 1998) is applicable to 349
the studied well, and assuming also a linear temperature gradient, the maximum temperature at 350
2,500 m would range between 76 and 104 ºC. It is quite interesting that the deepest sample, from 351
almost 1,000 m below the next above it, shows no further development of the transformation 352

15 reaction. A number of reasons related to environmental factors in the sandstone reservoir may be 353
the cause for this, as indicated above. However, two samples of completely different origin selected 354
as dickite end-members for comparison (BM specimens, Table 1) have in fact a kaolinite 355
component and their composition is similar to the deepest ELK samples. Further to this, two other 356
samples from the Natural History Museum collection, of completely unrelated origin, also 357
considered originally as dickite end-members, are in fact kaolinite-dickite-nacrite, with respective 358
relative proportions 3-70-27 and 6-48-46%. In all cases some proportion of kaolinite exists, even in 359
those samples that experienced conditions that generated a substantial proportion of nacrite. The 360
existence of kaolinite in all cases may indicate that it is intrinsically related to the transformation or 361
formation process rather than to environmental factors, as discussed below. The samples containing 362
nacrite were investigated using XRD as indicated above for the kaolinite-dickite samples, but were 363
not used for the present study because of their significant nacrite content. 364
365
Measurement of the size of XRD coherent scattering domains 366
The relative intensity (measured as peak height) of the non-basal to basal peaks decreased with 367
increasing dickite in all the samples studied, as shown in Figure 3a for three different non-basal 368
diffraction peaks. The kaolinite samples show a large dispersion of the relative intensity data. The 369
reason for this dispersion is the large range of crystal order covered by the three kaolinite samples. 370
This was corroborated by plotting the non-basal to basal intensity ratios versus the CSDS of the 001 371
peak (Fig. 3b). It becomes evident that the relative intensity of non-basal to basal diffraction peaks 372
correlates negatively with the CSDS of the basal 001 reflection. The interpretation to this fact is 373
that, across all samples with different origin, from kaolinite to 94 % dickite, the CSDS in the c 374
direction is always larger than in the other crystallographic directions, and progressively so as the 375
crystal order increases. Such fact is not uniquely related to kaolinite-dickite proportion. It is related 376
to the crystal perfection of the kaolin, whether it is kaolinite or dickite (Fig. 3b). The possibility of a 377
preferred orientation effect is discarded because the side-loading procedure produces good random 378

16 preparations and because it was tested loading the samples in different wells. Deeper wells 379
produced a more random orientation of the particles (see methods), however, this effect was much 380
smaller than the differences of non-basal to basal ratios observed between samples. As the CSDS 381
grows, the diffracted intensity is gathered in a narrower 2θ angle and thus the peak intensity is 382
higher. Because the CSDS in the c direction is progressively larger than those in the other 383
directions, the relative intensity of hkl to 00l peaks decreases progressively. We checked whether 384
Fig. 3b introduces a forced correlation because the dependent and independent variables are linked 385
through proportionality between the intensity (height) of the peaks 001 and 002, and their CSDS. 386
However, although some broad positive link between them exists, the correlation is very low (R2 = 387
0.3, not shown), indicating that the correlation in Fig. 3b is genuine. 388
389
The above result, although not uniquely related to the process of kaolinite transformation into 390
dickite, is relevant to the mechanism of this process, because there is an increase of CSDS during 391
the transformation reaction. It is of interest, then, to examine the progression of the growth of 392
CSDS’s in several crystallographic directions. CSDS’s were measured for multiple peaks in all 393
samples. For those peaks for which CSDS measurements could be done in the entire range of 394
kaolinite-dickite composition, a small majority displayed a broad positive correlation between 395
dickite content and CSDS (not shown). The others did not show any clear relationship between 396
these two variables. The scatter of CSDS at the kaolinite end was mainly due to the very different 397
crystal order of the samples used. In any case, there was evident scatter in all samples, which was 398
generated by the error involved in the measurement of peak widths. The CSDS of BM samples 399
appeared always within the ranges for the ELK samples with similar dickite content. Given this 400
situation, the analysis of CSDS values was simplified to analyze only the two ends of the kaolinite-401
dickite series. Only one kaolinite sample was selected as representative of the possible crystal order 402
of the original kaolinite in the North Sea series. The selected kaolinite was Kaol 17 for the 403
following reasons. Keokuk kaolinite is an extraordinary specimen with the highest degree of crystal 404

17 perfection ever reported and thus was discarded. KGa-2 is at the other end of the spectrum of crystal 405
perfection and thus possibly not appropriate. Plots of CSDS values versus dickite content showed 406
that Kaol 17 was typically more within the trend (assumed approximately linear) generated by the 407
samples with 42-94% dickite (not shown). Keokuk and KGa-2 appeared above and below this trend, 408
respectively, whether clearly off or near it. For the dickite-rich end, we used those samples with 409
>80% kaolinite. As the two BM samples were indistinguishable from the ELK samples, we used the 410
BM samples also, in order to increase the number of available measurements and improve the 411
statistics. 412
413
The results of the analysis are displayed in the experimental section of Table 2. Some of the 414
selected peaks are affected by other coincident reflections, what is probably reflected in the 415
standard deviations of the measurements. Overall, however, the results are meaningful and 416
consistent, which indicates that the peak intensities are dominated by the reflections indicated on 417
Table 2. Each individual value is the average of the number of data indicated in the fourth column. 418
Additionally, the CSDS of the 00l and 0k0 reflections were also averaged from the results shown 419
above the corresponding averaged values in Table 2. These values were averaged because they 420
included reflections contained within the same plane and thus directly comparable. The CSDS 421
values obtained from the 001 peaks, where kaolinite and dickite reflections could not be 422
deconvolved (K+D) is significantly smaller than CSDS values measured on 00l deconvolved peaks 423
(K and D values), indicating that there is a widening of the 001 peak due to the overlap of the 424
kaolinite and dickite peaks. Thus the K+D measurement is not accurate. 425
426
A very important result of this analysis is that both kaolinite and dickite CSDS’s increase with 427
burial. Kaolinite is not merely being transformed into dickite but it also recrystallizes into crystals 428
with fewer defects. The second piece of information that can be extracted from Table 2 is that the 429
growth in crystal perfection is larger in the c direction than in any other direction, and this confirms 430

18 the results from Figure 3. The growth measured for the 00l peaks is 148-163% (the K+D 431
measurement is not considered for the reason given above), approximately twice as much as the 432
growth measured from 0k0 peaks (67-89%) and several times larger than the growth measured from 433
0kl and hkl peaks (30-51%). In the latter group, there are two values outside the general range, 434
corresponding to growths of 137 and 8%. Most probably, there is an error in the CSDS 435
measurement of Kinitial in both cases, as there is only one measurement available and the 436
corresponding values are clearly below and above similar CSDS Kinitial values in the table. 437
438
Calculations were performed in order to investigate further the mode of growth of the CSDS in 439
several crystallographic directions. The question asked was: do the measured CSDS’s correspond to 440
a homogeneous growth of the coherent structure in every direction? We used the experimental 441
CSDS corresponding to individual dimensions a, b and c to calculate the corresponding dimension 442
of the vectors ab, bc, and abc. This calculation assumes that the CSDS grows homogeneously in 443
every direction. We simplified the data to facilitate the trigonometric calculations. The ab angle (γ), 444
89.9º in kaolinite and dickite, was made 90º. The bc angle (α), 91.6º in both polytypes, was made 445
also 90º. The ac angle (β), 104.8º in kaolinite and 103.6º in dickite, was made 104º. The results 446
show that the calculated ab dimension (512 Å) is similar to the experimental values (results from 447
peaks 110 and 130). However, the calculated bc and abc dimensions are roughly twice those 448
measured (results from 0kl and hkl peaks). This means that the development of the CSDS is 449
homogeneous in the ab plane, but not in any plane including c. In other words, there exist 450
crystallographic defects within the volume contained by the average experimental defect-free 451
distances measured separately in the a, b and c directions. 452
453
Thermogravimetry 454
The TG and DTG diagrams were entirely dominated by the dehydroxylation features of the kaolin 455
polytypes (Fig. 4) although some other phases were apparent in some of the samples. The North Sea 456

19 series show a broad dehydroxylation event covering the temperature range 450-800 ºC. There is a 457
first event with a broader maximum followed by two other sharp maxima (Fig. 4e-h). The kaolinite 458
samples displayed dehydroxylation events with maxima that were displaced towards higher 459
temperature as the crystal order of the sample increased. For KGa-2 and Kaol 17, the DTG curves 460
were approximately symmetric and their maxima were located in the recognized region for kaolinite 461
(500-550 ºC; Fig. 4a-b). For Keokuk, the DTG shape was complex, starting at 500 ºC and having 462
the main component within the range 600-700 ºC (Fig. 4c), which is typical of dickite. In fact, the 463
Keokuk TG-DTG patterns are similar to those of BM 1927, which contains 89% dickite (Fig. 4d). 464
According to these results, there is not a characteristic dehydroxylation temperature for kaolinite 465
and dickite as such. Rather, the dehydroxylation temperature depends on the crystalline order of the 466
specific specimen. The three kaolinite samples show a progressive widening of the dehydroxylation 467
event and displacement of its center of gravity towards higher temperature as the crystallinity 468
increases. This behavior is consistent with an increasing proportion of well-crystallized particles or 469
domains within particles, although low-crystallinity domains remain (low-temperature side of the 470
dehydroxylation event; Fig. 4a-c). BM 1927 behaves similarly, although it consists mainly of 471
dickite. 472
473
The results from the North Sea series should be interpreted in the same way. With increasing depth, 474
the crystal order of the samples increases and generates crystal domains in which dehydroxylation 475
takes place at increasingly higher temperature, whether these domains correspond to one or the 476
other polytype. This result is in agreement with the XRD data indicating that the crystal order of 477
kaolinite increases with depth, at the same time that it is transformed into dickite. 478
479
The DTG diagrams were decomposed into individual Gaussians to locate approximately the 480
position of the dehydroxylation events of the several crystallographic domains (Fig. 5). The 481
decomposition also allows quantification of the hydroxyl loss within different temperature ranges 482

20 (sum of area under the individual components in this range). We investigated the connection of the 483
dehydroxylation temperature with the crystal perfection of the samples. For this, we considered that, 484
approximately, the individual components with their maximum < 550 ºC would correspond to “low 485
crystallinity” kaolin (whether kaolinite of dickite), and those with their maximum > 550 ºC to well 486
crystallized kaolin. There is a good correlation between the sum of the normalized areas of peaks > 487
550 ºC and the CSDS along the c direction as measured from the 001 peaks (Fig. 6a), which 488
confirms that high-temperature dehydroxylation corresponds to higher crystal order. Keokuk 489
kaolinite plots marginally away from this correlation (Fig. 6a). This analysis correlates the average 490
crystal order as determined by XRD and the portion of sample with high crystal order as indicated 491
by TG. A slightly different approach is to investigate the specific contribution of the well-(or 492
poorly-) crystallized domains to the shape of XRD peaks. The existence of large and small coherent 493
scattering domains in a phase generates peaks which are wide at the base and sharp at the top, 494
because the small domains contribute mainly to the bottom of the peak and thus the large domains 495
have a greater influence in shaping the top of the peaks. We measured the width of the 001 peaks at 496
the lower quarter of their height, where the influence of the small crystal domains would be greatest 497
and then calculated the corresponding CSDS. The correlation of the measured sizes with the area of 498
the DTG dehydroxylation peaks below 550 ºC is good (Fig. 6b), and in this case Keokuk plots 499
closer to the general trend. 500
501
SEM 502
The SEM study of the several samples showed similar morphology for all of them, dominated by 503
plates that had either irregular shape or a regular shape with well defined hexagonal symmetry (Fig. 504
7). BM 1927 was most different, with large, thick particles of irregular shape consisting of many 505
smaller particles in which it was sometimes impossible to identify the c direction because all 506
dimensions were similar (Fig. 7f). Booklets of plates were frequent in all samples. We searched for 507
possible evidence of growth from solution or particle coalescence. Signs of coalescence were most 508

21 frequent. Some of the plates forming booklets appeared to coalesce into one at certain points, 509
mainly at the contact of their basal surfaces (Fig. 7a,b,d,e,f,g) but also laterally (Fig. 7b,e). The 510
sequence of photographs in Figure 7 shows a possible path of plate coalescence in which the 511
particles become thicker and their edges smoother, perhaps tending towards a particle morphology 512
like that in Figure 7g. This path would not be homogeneous because all samples showed very 513
variable particle arrangements and plate thickness. There were also particle aggregates that 514
suggested growth from solution because of the continuity between the sides of the several particles, 515
perhaps indicating growth steps (Fig. 7c), but they were not frequent. Some particles had blocky, 516
rather than plate, morphology (some instances in Fig. 7b, left, and Fig.7g, right). The abundance of 517
these particles did not appear to be related to dickite content. 518
519
The quantitative analysis of the evolution of particle dimensions with dickite content is a more 520
robust method to investigate possible transformation mechanisms than the simple observation. This 521
analysis showed that there is no correlation or a very week positive correlation between particle 522
dimensions and dickite content in the North Sea samples (Fig. 8). Keokuk and BM 1927 have 523
dimensions that are within the range of the ELK series, except the average thickness in BM 1927, 524
and only Kaol 17 has dimensions which are consitently smaller. The shape of the particle size 525
diagrams (frequency versus size; not shown) did not progress consistently with average particle 526
size. One would expect that the samples with smaller average size would have sharp distributions, 527
with a great concentration of the frequent sizes, and that larger average sizes would correspond to 528
broader distributions. Such a transition is only apparent between Kaol 17 and the rest (vertical bars 529
in Fig. 8). Samples containing progressively more dickite do not show any consistent change in the 530
shape of their particle dimension distribution (vertical bars in Fig. 8). The comparison of the 531
average sizes of Kaol 17 with the final values of the correlations for the North Sea samples (Fig. 8) 532
indicates that the average thickness increases ~5 times, whereas the two measured dimensions in the 533
ab plane increase ~3 times. 534

22 535
DISCUSSION 536
Changes of kaolin crystal order and polytype with burial 537
The present study does not include the whole range of kaolinite-dickite content in the North Sea 538
samples, but it is documented from previous work that these samples correspond to a series of 539
kaolinite-to-dickite transformation from pure kaolinite (Cassagnabere 1998). Our data show that 540
two reactions take place with burial. One is the transformation of kaolinite into dickite. In this 541
transformation, the contour of the reaction progress up to ~3,500 m (Fig. 2) is consistent with an 542
increased reaction rate due to increased temperature with burial. The other reaction taking place is 543
the increase of crystal order of kaolinite (and possibly also dickite). Lanson et al. (1996) noticed this 544
reaction taking place at the first stages of the transformation and Marfil et al. (2003) observed 545
kaolinite of high crystal order at burial depths where dickite was the dominant polytype. We argue 546
here that the increase of kaolinite crystal order takes place throughout the whole burial sequence in 547
parallel with transformation into dickite. This reaction is not totally evident from the North Sea 548
samples alone in our study because they have a relatively narrow range of crystal order (Fig. 6). It is 549
necessary to establish a comparison with some “typical” kaolinite that may represent the original 550
kaolinite in the North Sea. In our opinion, Kaol 17 is appropriate for such purpose. The differential 551
thermal analysis (DTA) diagram of pure kaolinite from sandstone in the French Aquitan Basin 552
(Beaufort et al. 1998) is similar to the DTG diagram of Kaol 17, although showing an intermediate 553
character between Kaol 17 and KGa-2, where the latter has a lower crystal order. Comparing the 554
CSDS calculated from kaolinite peaks of Kaol 17 (as representing the original kaolinite in the North 555
Sea sandstones) and the ELK series indicates that kaolinite crystal order increases with burial 556
(Table 2). Thus, both kaolinite transformation into dickite and kaolinite recrystallization take place 557
in parallel, and the latter reaction progresses so much that the CSDS of kaolinite domains at the 558
final stages of the kaolinite-to-dickite transformation is similar to that of dickite. 559
560

23 It is of great interest that the only sample at 4,500 m does not show any progress in dickite content 561
from the samples ~1,000 m above. The reason for this may be the heterogeneous environment that 562
the samples encountered in terms of rock porosity (Lanson et al. 2002), interstitial fluid (oil versus 563
water; Lanson et al. 2002), or other variables affecting kaolinite reactivity. It is logical that porosity 564
should enhance reactions by facilitating solute transport (Hassouta et al. 1999), and Lanson et al. 565
(2002) show a broad positive correlation between rock porosity and dickite content in samples from 566
the Frøy reservoir, where our samples are from. Oil invasion has been considered as a possible 567
cause for the stop or slow-down of the kaolinite-to-dickite reaction (Lanson et al. 2002). In our 568
view, however, the fluid type (oil versus water) does not appear to control the dickite content shown 569
by Lanson et al. (2002) for the Frøy reservoir. Other variables may be relevant to the reaction. 570
However, the fact that we did not observe any progress of the transformation beyond 95% dickite in 571
any of the studied samples (Table 1), where the ELK series and the two BM samples have different 572
origin, together with the fact that two samples not included in this study showed development of 573
dickite and nacrite without disappearance of kaolinite (see results), suggests that there is an intrinsic 574
limit to the kaolinite-to-dickite transformation that corresponds to 90-95% dickite. If kaolinite 575
crystal order develops in certain grains, or domains within grains, at the same time that other 576
domains transform into dickite, towards the end of the transformation series the kaolinite domains 577
still present may be so large and stable that the transformation to dickite may not be feasible. 578
579
Cassagnabere (1998) and Lanson et al. (2002) display a few samples with 100% dickite. However, 580
these results are based on IR methods, using the overall shape of infrared features in the OH 581
stretching region (Cassagnabere 1998). Our quantification is based on XRD and uses the relative 582
intensity of several specific diagnostic kaolinite and dickite peaks. The existence of diagnostic 583
kaolinite peaks is positive proof of the presence of kaolinite. Our investigation using mid-IR 584
spectroscopy (described in another paper), which includes the analysis of features at several 585
wavelengths, showed that quantification of dickite-kaolinite becomes difficult at the dickite end, 586

24 where the composition curve bends and loses resolution, so that the exact composition cannot be 587
ascertained. 588
589
Our suggestion that total transformation to dickite is prevented by the development of large and 590
well-ordered kaolinite crystals is consistent with the fact that the relative stability of the pure 591
polytype phases is very similar. First principle calculations by Sato et al. (2004) indicate differences 592
of only 0.07-0.3 kJ/mol. Calculations of the ΔG of formation at standard conditions by Anovitz el 593
al. (1991) indicated a difference of 1.38 kJ/mol in favor of kaolinite. Experimental determination of 594
ΔG in the same conditions by De Ligny and Navrotsky (1999), Fialips et al. (2001), and Fialips et 595
al. (2003) indicated stability differences between 2 and 25 kJ/mol only, also favourable to kaolinite. 596
Whatever the driving force for kaolinite dickitization with burial (increasing temperature and/or 597
pressure), the thermodynamic stability of both minerals is very similar. This would explain that 598
kaolinite recrystallization takes place with burial at the same time as kaolinite transformation into 599
dickite. As typical with clay minerals, the fact that one or the other reaction takes place depends 600
probably of kinetic factors. In the deepest samples, the transformation of large kaolinite crystal 601
domains into dickite does not take place, because the kaolinite domains are very stable. There is a 602
negligible stability gain in the recrystallization of such large, stable kaolinite domains into dickite 603
domains with similar stability. 604
605
Mechanism of kaolinite transformation into dickite in burial diagenesis 606
Our SEM study indicates that individual kaolin plates in booklets coalesce to generate thicker plates 607
(Fig. 7). Other authors have found the same or similar sequence of particle morphological 608
transformation and some or all of the textural details described here (Eherenberg et al. 1993; Ruiz 609
Cruz and Moreno Real 1993; Hassouta et al. 1999; Lanson et al. 2002; Martin-Martin et al. 2007; 610
De Bona et al. 2008), including different geologic settings such as diagenesis in shales (Ruiz Cruz 611
and Reyes 1998) and hydrothermally altered volcanic tuff (Choo and Kim 2004). Many of the 612

25 kaolin plates appeared to be joined to other plates at one or several points whereas they had 613
individual edges in large sections of their contour (Fig. 7). Thick grains were frequently seen to 614
consist of thinner plates that were imperfectly joined (similar to Fig. 7f, although this specific 615
photograph corresponds to a sample connected to hydrothermal rather than burial origin). These 616
observations and the increased average thickness of the kaolin particles are coherent with particle 617
coalescence as the mechanism of grain growth. In some instances, booklets were observed to come 618
together laterally (Fig. 7b,e) making also possible that they coalesce in this direction. This process 619
is dominated by solid-state transformation because the particles are preserved as they coalesce. 620
Dissolution of original particles, perhaps the smallest ones, and precipitation of new ones with 621
greater crystal order is seemingly occurring (Fig. 7c), although at small scale. Very likely, 622
dissolution-precipitation of particle edges generating smooth, more stable surfaces is also taking 623
place. For example, the smoothness of particle faces parallel to c increases from Figure 7a,b to 624
Figure 7d,g. Our results show that the particle morphology is not related to specific polytype, as 625
indicated by previous authors (see introduction), because thin platelets, thick plates and blocky 626
habits were found in the entire range of kaolinite-dickite composition (Fig. 7). 627
628
The investigation of the size of XRD coherent scattering domains is a more reliable tool than 629
particle morphology and dimensions to assess the mechanism of kaolinite reaction because the 630
number of domains sampled is far greater and because the SEM study can be biased by the manner 631
of particle aggregation, image contrast, etc, which variables can alter the visibility of particles of 632
different size and the dimensions that can be measured in specific particles. The XRD study 633
indicates that kaolinite domains grow at the same time that kaolinite is transformed into dickite. 634
Considering the SEM observations above, the most direct interpretation of this fact invokes a 635
mechanism in the solid state by which (1) crystal defects are eliminated and (2) the change of 636
polytype takes place gradually. Given the similar stability of kaolinite and dickite structures, the 637
two processes progress in parallel, although the transformation into dickite is the most favorable 638

26 reaction as indicated by the fact that it reaches 90-95% of the kaolin mass. This mechanism in the 639
solid state can also explain the fact that CSDS in the c direction grows at a greater extent than 640
CSDS in the ab plane (Table 2). How this takes place can be visualized schematically. Figure 9a 641
represents a two-dimensional view of a crystal of the original kaolinite, where the lines indicate 642
defects within the crystal, and thus the rectangles correspond to coherent scattering domains. The 643
dimensions of the domains are not proportional to those measured experimentally and the sketch is 644
only intended for illustration. Figure 9b represents the crystal at a later stage, where more crystal 645
defects in the c direction have been removed than in the ab plane, generating greater CSDS growth 646
in the c direction. 647
648
Our results show that analysis of thermal dehydroxylation of kaolinite-dickite detects the 649
progressive growth of kaolin particles and not their polytype, as indicated by Wada (1965), Stoch 650
and Wacławska (1981) and Suitch (1986). The “intermediate” dehydroxylation events (~600 °C), 651
recorded between those typical for kaolinite (~550 °C) and dickite (650 °C and above), correspond 652
to progressively growing particles (Fig. 4). Beaufort et al. (1998) assigned this “intermediate” 653
dehydroxylation event to dickite of intermediate-to-low crystal order, although, they pointed out, 654
they could not detect such low-order dickite with XRD. Our results indicate that dehydroxylation at 655
intermediate temperature must include kaolinite of increasing crystal order, and it is probable that it 656
also includes dickite of intermediate crystal order. The particle size must be one of the determining 657
factors of the dehydroxylation temperature, but also the size of well ordered crystal domains within 658
particles, because crystal defects allow water molecules to travel more easily towards the particle 659
edge and decrease the dehydroxylation temperature. Thus the displacement of dehydroxylation 660
temperature to higher values is due to both, growth of particles and coherent crystal domains within 661
them. Suitch (1986) proposed that dehydroxylation of kaolin polytypes takes place instantaneously 662
for each layer. Such is the conclusion of Drits et al. (2011) for pyrophyllite also, and they indicate 663
that pressure of the water molecules separate two layers and then water escapes through this 664
27 interlayer. Drits et al. (2011) argue that the greater the crystals or their crystal order the more energy 665
is required to separate the layers and dehydroxylation occurs at higher temperature. Recently, 666
Zhang et al. (2010) studied in-situ dehydroxylation of several 2:1 phyllosilicates using IR and found 667
that OH- rather than H2O is the species that diffuses away during dehydroxylation, and that 668
molecular water only forms close to the grain surface. The diffusion of a charged species through a 669
crystal lattice is expected to be different from that of a neutral species but, whatever the species and 670
diffusion mechanism, low crystal order and small crystal size are favorable conditions for 671
dehydroxylation. 672
673
For a thorough discussion, we can examine how a mechanism of dissolution-precipitation would 674
explain the results of our study. First of all, how can kaolinite crystal order increase at the same 675
time as kaolinite is transformed (via dissolution and precipitation) into dickite? We assume that the 676
particle size and crystal order of the original kaolinite is relatively homogeneous and lower than that 677
of dickite. This is indicated by the low dehydroxylation temperature (below 600 °C) in most 678
kaolinites in sandstone and other settings (Figure 4a,b; Beaufort et al.1998; Dudek et al. 2007; 679
Brindley and Lemaitre 1987). Keokuk kaolinite is the exception (Fig. 4c). The increase of kaolinite 680
crystal order with burial would then result from dissolution of small kaolinite particles and 681
precipitation of larger particles of both kaolinite and dickite. Considering that the relative stability 682
of kaolinite and dickite is similar, this is a coherent scenario. If kaolinite dissolution was followed 683
by dickite precipitation only, it would be necessary to assume (in order to explain the increase of 684
kaolinite CSDS) that the original particle size and CSDS distribution of kaolinite involved large 685
values, so that as the smaller particles dissolved and generated dickite only the larger kaolinite 686
particles remained. However, this would require the presence of very large particles and crystal 687
domains in the original kaolinite, such as in Keokuk kaolinite (Figs. 4c, 8), which is not apparent 688
from the thermal analysis of most kaolinites. 689
690
28 If dickite and increasingly ordered kaolinite precipitate from solution during burial it would be 691
expected that the crystal growth of both phases is coherent in all crystallographic directions, i.e., if 692
the average defect-free distance in each direction in the growing crystals is da, db and dc, the volume 693
within these defect-free vectors should also be defect-free. The calculations of the dimensions of 694
coherent scattering domains involving ab, bc and abc crystallographic directions indicate that there 695
is homogeneous growth in the a and b directions, but not in directions involving both c and the ab 696
plane (Table 2). This fact indicates that crystal domains are not perfect within the volume defined 697
by the average experimental dimensions in the individual a, b and c directions. Rather, there are 698
crystal defects within this volume that decrease the size of CSDS in directions that include both the 699
c direction and the ab plane. In other words, there is no correspondence between the crystal domains 700
in the c direction and the ab plane. This is not likely to occur in crystals growing from solution, but 701
suggests that the growth of the crystal domains in the c direction and the ab plane are taking place 702
independently. Such an independent growth can be easily explained in a mechanism of 703
recrystallization in the solid state. The progressive orientation of layers in a perfectly parallel 704
position (increase of CSDS in the c direction) may occur independently, and thus in different 705
places, from the healing of crystal defects across the ab plane in existing layers. Thus the a, b and c 706
dimensions all grow, but not coherently as it would be expected from crystallization from solution. 707
708
The comparison of Kaol 17 with the deepest samples in the North Sea series shows that the relative 709
growth of the particle thickness and the X-ray CSDS in the c direction are both larger than the 710
corresponding values in the ab plane. The growth of c relative to ab for particle dimension is ~5/3 711
(Fig. 8) and that for CSDS is ~150% / 40% (Table 2). These two are phenomena occurring at very 712
different scale but if they are produced by the coalescence of both layers and particles in the basal 713
and lateral dimensions driven by the same mechanism, it can be expected that the two phenomena 714
have similar manifestations in the several spatial dimensions. 715
716

29 Our interpretation is in good agreement with that of Ruiz Cruz and Moreno Real (1993) from their 717
XRD analysis of mudstone and sandstone in the Spanish Betic Cordilleras. They concluded that (1) 718
both kaolinite and dickite have both high crystal order and (2) they coexist within crystals in some 719
sort of interstratified structure. The recrystallization of kaolinite and its transformation into dickite 720
in the solid state that we describe is likely to generate such structural features. Besides structural 721
investigation, isotope studies of kaolinite-dickite transformation series should be a powerful tool to 722
investigate the transformation mechanism, although interpretations are frequently complicated by 723
the difficulty to ascertain the composition of ancient and possibly mixing fluids. A number of works 724
contain isotope data that report little or no isotope resetting in the kaolinite-to-dickite 725
transformation (Franks et al. 1997; Parnell et al. 2000) or dickite indicating improbably low 726
formation temperature (85-95 °C from Ruiz Cruz and Reyes 1998; 5-45 °C from Veniale et al. 727
2002; 50 °C from Simeone et al. 2005; 70-90 °C from Marfil et al. 2003; 50-80 °C from Osborne et 728
al. 1994). Without engaging into the detailed discussion of the individual studies, we suggest that 729
the preservation of much of the original kaolinite structure in dickite could be a key factor 730
producing these results. 731
732
IMPLICATIONS 733 734 Our study shows that kaolinite transformation into dickite by burial diagenesis is substantially a 735
defect-healing process, where crystals become more ordered, progressively larger, and the polytype 736
changes. Thus, the reaction should have limited geochemical effects on the surrounding rock 737
because no large amounts of solutes are released and there is no large increase in porosity due to 738
grain dissolution. However, it is expected that kaolin diagenesis will tend to increase rock porosity 739
to a certain extent due the coalescence of smaller into larger particles, with lower surface area, 740
although this change in the fabric may not effectively alter porosity if it is overcome by the 741
increasing pressure and chemical compaction due to other processes. Permeability increase with 742
increasing relative dickite:kaolinite content between different rocks or sites of similar lithology may 743
30 be the result of other factors or due to the inverse relation, i.e., greater permeability propitiates a 744
faster transformation from kaolinite into dickite. 745
746
ACKNOWLEDGMENTS 747
C. Fialips, D. Beaufort and S. Hillier are thanked for kindly providing the North Sea kaolinite-748
dickite series samples and the Keokuk kaolinite. C. Fialips is also thanked for discussion from the 749
early inception of the study to the stage of data interpretation. R.V. and A.T. were funded by the 750
Erasmus program of the EU via the University of Huelva, Spain. 751
752
31
REFERENCES 753
754
Anovitz, L.M., Perkins, D., and Essene, E.J. (1991) Metastability in near-surface rocks in the 755
system Al2O3-SiO2-H2O. Clays and Clay Minerals, 39, 225–233. 756
757
Bailey, S.W. (1980) Structures of layer silicates. In G.W. Brindley and G.Brown, Eds., Crystal 758
Structures of Clay Minerals and their X-Ray Identification, p. 1-124. Mineralogical Society, 759
London, UK. 760
761
Beaufort, D., Cassangnabère, A., Petit, S., Lanson, B., Berger, G., Lacharpagne, J.C., and Johansen, 762
H. (1998) Kaolinite to Dickite reaction in sandstone reservoirs. Clay Minerals, 33, 297-316. 763
764
Brindley, G.W. and Lemaitre, J. (1987) Thermal, oxidation, and reduction reactions of clay 765
minerals. In A.C.D. Newman, Ed., Chemistry of Clays and Clay Minerals, p. 319-370. 766
Mineralogical Society-Longman Scientific & Technical, London, UK. 767
768
Brindley, G.W., Kao, C.-C., Harrison, J.L., Lipsicas, M., and Raythatha, R. (1986) Relation 769
between structural disorder and other characteristics of kaolinites and dickites. Clays and Clay 770
Minerals, 34, 239-249. 771
772
Buatier, M., Travé, A., Labaume, P., Potdevin, J.L. (1997) Dickite related to fluid-sediment 773
interaction and deformation in Pyrenean thrust-fault zones. European Journal of Mineralogy, 9, 774
875-88. 775
776

32 Cassagnabère, A. (1998) Caracterisation et interpretation de la transition kaolinite-dickite dans les 777
reservoirs a hydrocarbures de Froy et Rind (Mer du Nord), Norvege. PhD thesis, University of 778
Poitiers, France. 779
780
Choo, C.O., Kim, S.J. (2004) Dickite and other kaolin polymorphs from an Al-rich clay deposit 781
formed in volcanic tuff, southeastern Korea. Clays and Clay Minerals, 52, 749-759. 782
783
De Bona, J., Dani, N., Ketzer, J.M., De Ros, L.F. (2008) Dickite in shallow oil reservoirs from 784
Reconcavo Basin, Brazil: diagenetic implications for basin evolution. Clay Minerals, 43, 213-233. 785
786
De Ligny, D. and Navrotsky, A. (1999) Energetics of kaolin polymorphs. American 787
Mineralogist, 84, 506–516. 788
789
Drits, V., Derkowski, A., McCarty, D. (2011) New insight into the structural transformation of 790
partially dehydroxylated pyrophyllite. American Mineralogist, 96, 153-171. 791
792
Dudek, T., Cuadros, J., and Huertas, J. (2007) Structure of mixed-layer kaolinite-smectite and 793
smectite-to-kaolinite transformation mechanism from synthesis experiments. American 794
Mineralogist, 92, 179-192. 795
796
Ehrenberg, S., Aagaard, P., Wilson, M.J., Fraser, A.R., Duthie, D.M.L. (1993) Depth-dependent 797
transformation of kaolinite to dickite in sandstones of the Norwegian continental shelf. Clay 798
Minerals, 28, 325-352. 799
800
Fialips, C.-I., Majzlan, J., Beaufort, D., and Navrotsky, A. (2003) New thermochemical evidence on 801
the stability of dickite vs. kaolinite. American Mineralogist, 88, 837-845. 802
33 803
Fialips, C.I., Navrotsky, A., and Petit, S. (2001) Crystal properties and energetics of 804
synthetic kaolinite. American Mineralogist, 86, 304–311. 805
806
Franks, S., Hameg, A., and Liang, L. (1997) Diagenetic evolution of Cambrian sandstones, Hassi 807
Bir Rekaiz area, Algeria. American Association of Petroleum Geologists Annual Convention, 6, 37. 808
809
Goemaere, E. (2004) Dickite and nacrite from the Liege coal basin (Belgian Coal Measures Group, 810
Westphalian, Upper Carboniferous). Geologica Belgica, 7, 285-311. 811
812
Hassouta, L., Buatier, M., Potdevin, J.-L., Liewig, N. (1999) Clay diagenesis in the sandstone 813
reservoir of the Ellon Field (Alwyn, North Sea). Clays and Clay Minerals, 47, 269-285. 814
815
Hayes, J.B. (1936) Kaolinite from Warsaw geodes, Keokuk Region, Iowa. Iowa Academy of 816
Sciences Proceedings, 70, 261-272. 817
818
Johnston, C.T., Kogel, J.E., Bish, D.L., Kogure, T., Murray, H. (2008) Low-temperature FTIR 819
study of kaolin-group minerals. Clays and Clay Minerals, 56, 470-485. 820
821
Kerr, P.F. and Kulp, J.L. (1949) References clay localities – United States. In American Petroleum 822
Institute, Project 49, Clay Mineral Standards, Preliminary Report no. 2, p. 24-25. Columbia 823
University, New York, USA. 824
825
Kogure, T. and Inoue, A. (2005a) Determination of defect structures in kaolin minerals by high-826
resolution transmission electron microscopy (HRTEM). American Mineralogist, 90, 85-89. 827
828

34 Kogure, T., Inoue, A. (2005b) Stacking defects and long-period polytypes in kaolin minerals from a 829
hydrothermal deposit. European Journal of Mineralogy, 17, 465-473. 830
831
Kogure, T., Inoue, A., and Beaufort, D. (2005) Polytype and morphology analyses of kaolin 832
minerals by electron back-scattered diffraction. Clays and Clay Minerals, 53, 201-210. 833
834
Kogure, T., Elzea-Kogel, J., Johnston, C.T., and Bish, D.L. (2010) Stacking order in a sedimentary 835
kaolinite. Clays and Clay Minerals, 58, 62-71. 836
837
Kumeda, J., Beaufort, D., and Kogure, T. (2007) Morphological features of kaolin minerals during 838
kaolinite-to-dickite transition; FIB-TEM analyses. Euroclay 2007, Aveiro, Portugal, 22-27 July. 839
Book of abstracts, p. 123. 840
841
Lanson. B., Beaufort, D., Berger, G., Bauer, A., Cassagnabère, A., Meunier, A. (2002) Authigenic 842
kaolin and illitic minerals during burial diagenesis of sandstones: a review. Clay Minerals, 37, 1-22. 843
844
Lanson, B., Beaufort, D., Berger, G., Baradat, J., and Lacharpagne, J.-C. (1996) Illitization of 845
diagenetic kaolinite-to-dickite conversion series: late-stage diagenesis of the lower Permian 846
Rotliegend sandstone reservoir, offshore of The Netherlands. Journal of Sedimentary Research, 66, 847
501-518. 848
849
Lindberg, J.D. and Smith, M.S. (1974) Visible and near infrared absorption coefficients of kaolinite 850
and related clays. American mineralogist, 59, 274-279. 851
852
McAculay, G.E., Burley, S.D., Fallick, A.E., and Kusznir, N.J. (1994) Palaeohydrodinamic fluid 853
flow regimes during diagenesis of the Brent Group in the Hutton-NW Hutton reservoirs: constraints 854

35 from oxygen isotope studies of authigenic kaolin and reverse flexural modelling. Clay Minerals, 29, 855
609-626. 856
857
Marfil, R., Delgado, A., Rossi, C., La Iglesia, A., and Ramseyer, K. (2003) Origin and diagenetic 858
evolution of kaolin in reservoir sandstones and associated shales of the Jurassic and Cretaceous, 859
Salam Field, Western Desert (Egypt). International Association of Sedimentologists Special 860
Publication, 34, 319-342. 861
862
Martin-Martin, J.D., Gomez-Gras, D., Sanfeliú, T., Thiry, M., Ruiz-Cruz, M.D., and Franco, F. 863
(2007) Extensive dickitization of the Permo-Triassic fluvial sandstones from the eastern Iberian 864
Range, Spain. Clays and Clay Minerals, 55, 481-490. 865
866
Moll, W., Jr (2001) Baseline studies of the clay minerals society source clays: Geological origin. 867
Clays and Clay Minerals, 49, 374-380. 868
869
Osborne, M., Haszeldine R.S., and Fallick, A.E. (1994) Variation in kaolinite morphology with 870
growth temperature in isotopically mixed pore-fluids, Brent group, UK North Sea. Clay Minerals, 871
29, 591-608. 872
873
Palinkas, S.S., Sostarik, S.B., Bermanec, V., Palinkas, L., Prochaska, W., Furic, K., and Smajlovic, 874
J. (2009) Dickite and kaolinite in the Pb-Zn-Ag sulphide deposits of northern Kosovo (Trepca and 875
Crnac). Clay Minerals, 44, 67-79. 876
877
Parnell, J., Baron, M., and Boyce, A. (2000) Controls on kaolinite and dickite distribution, Highland 878
Boundary Fault Zone, Scotland and Northern Ireland. Journal of the Geological Society, London, 879
157, 635-640. 880

36 881
Parnell, J., Watt, G., Chen, H., Wycherley, H., Boyce, A., Elmore, D., Blumstein, R., Engel, M., 882
and Green, P. (2004) Kaolin polytype evidence for a hot-fluid pulse along Caledonian thrusts during 883
rifting of the European Margin. Mineralogical Magazine, 68, 419-432. 884
885
Ruiz Cruz, M.D. and Moreno Real, L. (1993) Diagenetic kaolinite/dickite (Betic cordilleras, Spain). 886
Clays and Clay Minerals, 41, 570-579. 887
888
Ruiz Cruz, M.D. and Reyes, E. (1998) Kaolinite and dickite formation during shale diagenesis: 889
isotopic data. Applied Geochemistry, 13, 95-104. 890
891
Sato, H., Ono, K., Johnston, C., and Yamagishi, A. (2004) First-principle study of polytype 892
structures of 1:1 dioctahedral phyllosilicates. American Mineralogist, 89, 1581-1585. 893
894
Shutov, V.D., Aleksandrova, A.V., and Losievskaya, S.A. (1970) Genetic interpretation of the 895
polymorphism of the kaolinite group in sedimentary rocks. Sedimentology, 15, 53-68. 896
897
Simeone, R., Dilles, J.H., Padalino, G., and Palomba, M. (2005) Mineralogical and stable isotope 898
studies of kaolin deposits: shallow epithermal systems of western Sardinia, Italy. Economic 899
Geology, 100, 115-130. 900
901
Stoch, L. and Wacławska, I. (1981) Dehydroxylation of kaolinite group minerals. I. Kinetics of 902
dehydroxylation of kaolinite and halloysite. Journal of Thermal Analysis, 20, 291-304. 903
904
Suitch, P.R. (1986) Mechanism for the dehydroxylation of kaolinite, dickite, and nacrite from room 905
temperature to 455°C. Journal of the American Ceramic Society, 69, 61-65. 906

37 907
Veniale, F., Delgado, A., Marinoni, L., and Setti, M. (2002) Dickite genesis in the 'varicoloured' 908
clay-shale formation of the Italian Apennines: an isotopic approach. Clay Minerals, 37, 255-266. 909
910
Wada, K. (1965) Intercalation of water in kaolin minerals. American Mineralogist, 50, 924-941. 911
912
Zhang, M., Redfern, S., Salje, E., Carpenter, M., and Wang, L. (2010) H2O and dehydroxylation of 913
phyllosilicates: An infrared spectroscopy study. American Mineralogist, 95, 1686-1693. 914
915
Zimmerle, W. and Rösch, H. (1990) Petrogenetic significance of dickite in European sedimentary 916
rocks. Zbl. Geol. Paläont. Teil I, 1175-1196. 917
918
Zotov, A., Mukhamet-Galeev, A., and Schott, J. (1998) An experimental study of kaolinite and 919
dickite relative stability at 150-300 ºC and the thermodynamic properties of dickite. American 920
Mineralogist, 83, 516-524. 921
922
923
924

38 925
926
Table 1. Depth of the studied samples from the North Sea (ELK series), percent dickite from XRD, 927
and the standard deviation (2σ) of percent dickite. 928
Sample Depth (m) % Dickite St. dev. KGa-2 0 Kaol 17 0 Keokuk 0 ELK 76 3036.8 42 16 ELK 33 3155.0 67 15 ELK 9 3219.9 91 2
ELK 22 3221.4 92 5 ELK 43 3256.0 72 8 ELK 5 3271.4 83 5
ELK 67 3354.1 86 8 ELK 84 3404.6 89 2 ELK 11 3415.1 90 5 ELK 63 3441.7 84 10 ELK 88 3463.1 90 2 ELK 53 3585.6 94 7 ELK 91 4519.2 93 6
BM 1923 92 10 BM 1927 89 7

39 Table 2. Analysis of the CSDS of several kaolinite (K) and dickite (D) XRD peaks in Kaol 17 (K initial) and in kaolinite-dickite 29 samples with >80% dickite. K+D values correspond to peaks where kaolinite and dickite peaks coincide and they could not be 30 deconvolved. K and D values are kaolinite and dickite peaks that could be deconvolved and measured separately. CSDS 31 measurements from reflections within the same plane (00l and 0k0) are averaged for each individual type of measurement (K, D and 32 K+D). The standard deviation is 1σ. Growth is calculated as (CSDS-CSDSK initial)×100 / CSDSK initial. The calculated values follow the 33 model explained in the text. 34
Experimental Calculated hkl data type CSDS
(Å) n. of data
Stand. dev.
Growth (%)
Dimen-sion
data type CSDS (Å)
Growth (%)
[001] K initial 373 1 [001] K+D 649 12 77 [003] K initial 391 1 [003] K 1063 12 110 [003] D 888 12 150 [004] K initial 308 1 [004] K 890 12 107 [004] D 903 12 105 [005] K initial 300 1 [005] K 756 7 67 [005] D 761 8 132
Aver [00l] K initial 343 3 50 Aver [00l] K+D 649 1 89 Aver [00l] K 903 3 154 163 Aver [00l] D 851 3 78 148
[020] K initial 527 1 [020] K 740 5 211 [020] D 653 5 26 [060] K initial 256 1
Aver [0k0] K initial 391 2 191 Aver [0k0] K 740 1 89 Aver [0k0] D 653 1 67
[200] K initial 331 1 [200] D 430 12 57 30 [110] K+D 570 11 66 ab K+D 512 [130] K+D 470 10 66 [021] K initial 362 1 bc K initial 520 [021] K 491 2 46 36 bc K 1120 115 [021] D 498 12 73 38 bc D 1120 115 [022] K initial 222 1 [022] D 525 12 88 137 [02-1] K initial 306 1 [024] D 450 12 72 [026] D 338 5 121
[1-1-1] K initial 399 1 abc K initial 581 [1-1-1] K+D 528 8 47 32 abc K 1132 95 [1-1-1] K 547 4 75 37 abc D 1132 95 [1-1-2] K+D 439 8 62 [13-3] K initial 382 1 [26-2] K initial 281 1 [13-1] K initial 437 1 [13-1] K 470 11 63 8 [131] K initial 327 1 [131] K 494 2 94 51 [13-5] K initial 228 1 [111] D 525 9 87 [112] D 476 12 70 [113] D 464 9 57
35
40
Figures 936
937
Figure 1. XRD patterns of three samples, indicating the dickite content (% D). Panels a) and b) 938
display the two samples with the highest proportion of non-kaolin phases. The identification of 939
peaks is not exhaustive, and shows only the most prominent peaks corresponding to non-kaolin 940
phases. c) Shows the 11 groups of peaks that were used for kaolin polytype quantification. D = 941
dickite, K = kaolinite, Ch = chlorite, M = mica, Q = quartz, Exp = expandable phase (~11.36 Å; 942
probably illite-rich illite-vermiculite mixed-layer), J = jarosite, Cr = crandallite, Py = 943
pyrite/marcasite. 944
945
Figure 2. Increase of dickite abundance in the ELK series with depth. The equation (see text) is a 946
best fit for the data points. 947
948
Figure 3. Relative intensity (as percent) of several non-basal peaks with respect to the average 949
intensity of the 001 and 002 peaks (% intensity = 100 × hnon-basal / [(h7.15Å + h3.57Å)/2]) of all the 950
samples in this study, plotted versus (a) the proportion of dickite and (b) versus the coherent 951
scattering domain size (CSDS) from the 001 peak (in Å). The regression in (b) includes all data 952
points. The hkl indices of the peaks (different for kaolinite and dickite) are: 4.45 Å: 020, 11-1; 2.56 953
Å: 1-30, 20-1, 130, 20-2; 1.488 Å: 060, 33-1, 3-3-1, 33-2. 954
955
Figure 4. Thermogravimetry (TG) plots and their derivative (DTG) of selected samples: three 956
kaolinites (a-c) and one dickite-rich specimen (d) for comparison; and four specimens from the 957
North Sea sandstone (e-h). 958
959
Figure 5. Examples of the decomposition of the DTG diagrams in individual dehydroxylation 960
components. The actual components may not be symmetric but this procedure allows the 961

41 quantification of hydroxyl loss at several temperatures. The location of the individual maxima from 962
left to right is the following: a) 509, 546, 609, 650 (arrow indicates the position of this small 963
component), 685 ºC; b) 502, 540, 610, 639, 676, 726 ºC (the small component at ~420 ºC is not 964
considered to correspond to kaolin dehydroxylation); c) 497, 535, 608, 632, 660, 675, 724 ºC. 965
966
Figure 6. a) Plot of the sum of areas (normalized to 100) of individual contributions to 967
dehydroxylation above 550 ºC, from the DTG diagrams, versus CSDS measured on the 001 peaks. 968
The full line corresponds to a regression including Keokuk; the dash line corresponds to a 969
regression without Keokuk. b) Sum of areas below 550ºC (normalized to 100) of individual 970
contributions to dehydroxylation versus the CSDS measured at the base of the 001 peak (bottom 971
quarter of peak height), in which part of the peak the contribution of small crystal domains is 972
greatest. 973
974
Figure 7. SEM images of several kaolinite and kaolinite-dickite samples. a) Kaol 17; typical 975
kaolinite booklet with plates of different thickness and signs of joining between plates. b) Keokuk 976
kaolinite; booklets with thick plates coming together in their basal and lateral faces. c) ELK 76 977
(42% dickite); on the right, group of particles with straight edges seemingly grown from solution; 978
on the left, booklet of plates with irregular shape. d) ELK 33 (67% dickite); booklet of imperfectly 979
parallel plates that are joined in some points; the arrow shows a plate introduced between two 980
diverging ones. e) ELK 43 (72% dickite); on the right, two plate booklets have come together 981
laterally and seemingly joined (arrow). f) BM 1927 (89% dickite); large particle composed of 982
individual plates of very different thicknesses. g) ELK 76 (42% dickite); thick plate-like particles 983
with some thinner plates sandwiched between them. 984
985
Figure 8. Particle size analysis of kaolinite-dickite samples in three dimensions: longest particle 986
dimension in the ab plane (c), particle dimension in the ab plane perpendicular to the longest 987

42 dimension (b), and particle thickness (a). Data points are the average size (for the ELK series the 988
values are connected with lines) and vertical bars are the range of size values for which Frequency 989
≥ Maximum frequency/5. Notice that some average values plot outside this range. The vertical bar 990
for Kaol 17 is the wide grey line. The calculated linear correlation includes only the ELK values. 991
992
Figure 9. Sketch of (a) an original kaolinite crystal divided in XRD coherent scattering domains 993
limited by lines, and (b) the same crystal at a later stage, where many crystal defects have 994
disappeared, mainly those limiting the domain size in the c direction. As a result, the growth of 995
CSDS in the c direction is greater than in the ab directions. The relative dimensions of the domain 996
sizes in the sketch are not representative of the experimental ones. 997
998
999


Fig. Depth (2)
0
20
40
60
80
100
2000 3000 4000
%Dickite(XRD)
Depth (m)
R2 = 0.90

Fig. CSDS (3)
0
5
10
15
20
25
30
35
40
0 20 40 60 80 100
%Intensity
% Dickite
4.45 A
2.56 A
1.488 A
R2 = 0.720
5
10
15
20
25
30
35
40
200 300 400 500 600 700 800
%Intensity
CSDS 001 (A)
4.45 A
2.56 A
1.488 A
b
a

Fig TG (4)
-0.03
0.02
0.07
0.12
0.17
0.22
84
86
88
90
92
94
96
98
100
0 200 400 600 800 1000
DTG(%
wt/
o C)
TG(%
wt)
aKGa20% D
TG
DTG
-0.02
0
0.02
0.04
0.06
0.08
0.1
0.12
84
86
88
90
92
94
96
98
100
0 200 400 600 800 1000
DTG(%
wt/
o C)
TG(%
wt)
bKaol 170% D
-0.010.010.030.050.070.090.110.130.150.17
828486889092949698
100
0 200 400 600 800 1000
DTG(%
wt/
o C)
TG(%
wt)
cKeokuk0% D
-0.010.010.030.050.070.090.110.130.150.170.19
84
86
88
90
92
94
96
98
100
0 200 400 600 800 1000
DTG(%
wt/
o C)
TG(%
wt)
Temperature (oC)
dBM 192789% D
-0.01
0
0.01
0.02
0.03
0.04
0.05
0.06
0.07
86
88
90
92
94
96
98
100
0 200 400 600 800 1000
DTG(%
wt/
o C)
TG(%
wt)
eELK 7642% D
-0.0100.010.020.030.040.050.060.070.08
85
87
89
91
93
95
97
99
0 200 400 600 800 1000
DTG(%
wt/
o C)
TG(%
wt)
fELK 4372% D
-0.01
0
0.01
0.02
0.03
0.04
0.05
0.06
0.07
86
88
90
92
94
96
98
100
0 200 400 600 800 1000DT
G(%
wt/
o C)
TG(%
wt)
gELK 6384% D
-0.0100.010.020.030.040.050.060.070.08
86
88
90
92
94
96
98
100
0 200 400 600 800 1000
DTG(%
wt/
o C)
TG(%
wt)
Temperature (oC)
hELK 9193% D

Fig. DTG (5)
-0.01
0.01
0.03
0.05
0.07
0.09
0.11
300 400 500 600 700 800 900
DTG(%
wt/
o C)
aKaol 170% D
-0.002
0.018
0.038
0.058
300 400 500 600 700 800 900
DTG(%
wt/
o C)
bELK 7642% D
-0.002
0.018
0.038
0.058
300 500 700 900
DTG(%
wt/
o C)
Temperature (oC)
cELK 9193% D

Fig TGXRD (6)
R² = 0.61R² = 0.79
0102030405060708090100
200 400 600 800
%Areaband
>550oC(DTG)
XRD CSDS of 001 (A)
ELKKeokukKGa2Kaol 17BM
R² = 0.72
0
20
40
60
80
100
100 300 500 700%Areaband
<550oC(DTG)
XRD CSDS at bottom quarter 001 (A)
ELKKeokukKGa2Kaol 17BM
b
a

Fig. SEM (7)
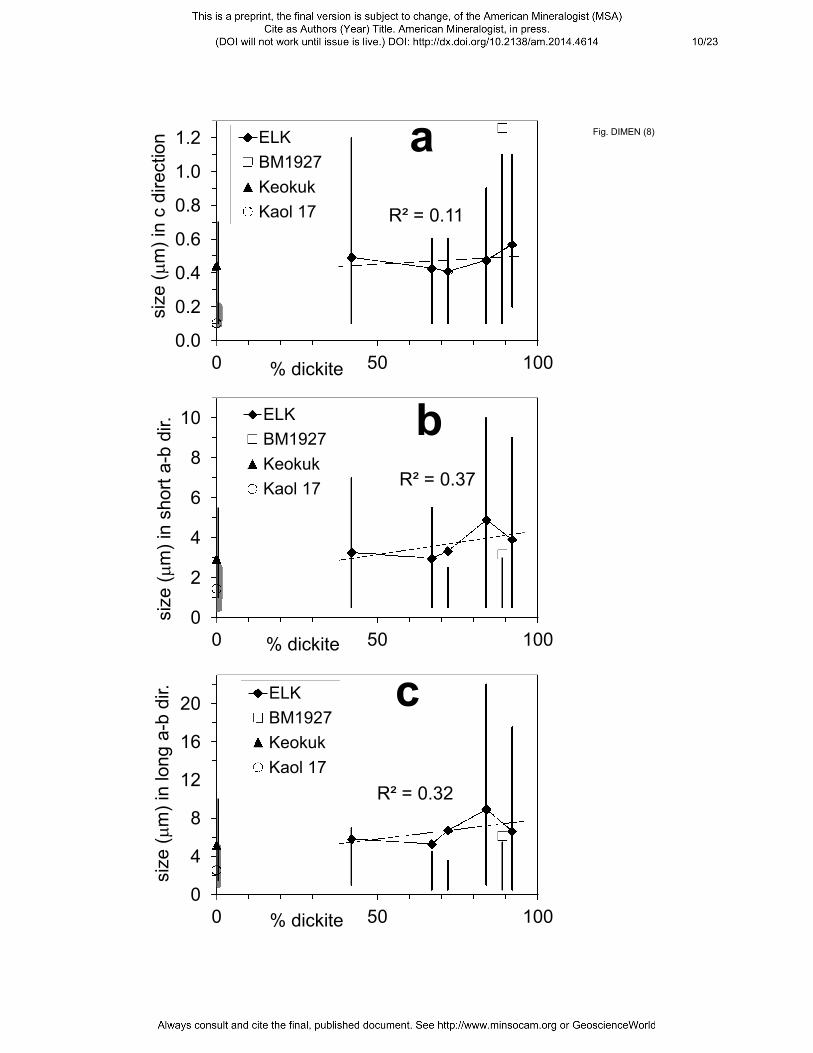
Fig. DIMEN (8)
R² = 0.11
0.0
0.2
0.4
0.6
0.8
1.0
1.2
0 50 100
size(�m)incdirection
% dickite
ELKBM1927KeokukKaol 17
a
R² = 0.37
0
2
4
6
8
10
0 50 100
size(�m)inshorta-bdir.
% dickite
ELKBM1927KeokukKaol 17
b
R² = 0.32
0
4
8
12
16
20
0 50 100
size(�m)inlonga-bdir.
% dickite
ELKBM1927KeokukKaol 17
c

a
b
ab plane
c*
Fig Crystal (9)