1. 2 Chapter 2 A FURTHER LOOK AT FINANCIAL STATMENTS.
51
1
-
Upload
julianna-henry -
Category
Documents
-
view
213 -
download
0
Transcript of 1. 2 Chapter 2 A FURTHER LOOK AT FINANCIAL STATMENTS.
1
2
Chapter 2
A FURTHER LOOK A FURTHER LOOK AT FINANCIAL AT FINANCIAL STATMENTSSTATMENTS
3
Identify the sections of a classified balance sheet.
Identify and compute ratios for analyzing a company's profitability.
Explain the relationship between a retained earnings statement and a statement of stockholders' equity.
Identify and compute ratios for analyzing a company's liquidity and solvency using a balance sheet.
Chapter 2A Further Look at Financial Statements
4
Explain the meaning of generally accepted accounting principles.
Discuss financial reporting concepts.
Chapter 2A Further Look at Financial Statements
5
Identify the Sections of a Identify the Sections of a Classified Balance SheetClassified Balance Sheet
Helps users see if company Helps users see if company has enough assets to pay has enough assets to pay debtsdebts
Can determine the short-term Can determine the short-term and long-term claims on total and long-term claims on total assetsassets
11 1
6
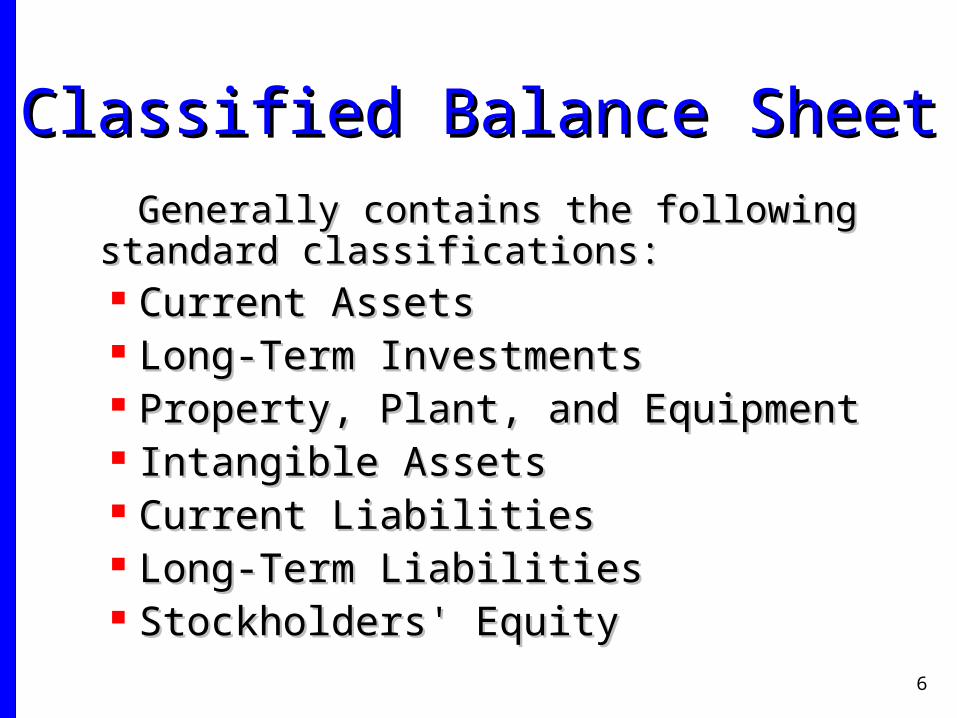
Classified Balance SheetClassified Balance Sheet Generally contains the following Generally contains the following
standard classifications:standard classifications: Current Assets Current Assets Long-Term InvestmentsLong-Term Investments Property, Plant, and EquipmentProperty, Plant, and Equipment Intangible AssetsIntangible Assets Current LiabilitiesCurrent Liabilities Long-Term LiabilitiesLong-Term Liabilities Stockholders' EquityStockholders' Equity
7
Current Assets
Assets that are expected to be converted to cash or used up within one year.
Current assets are listed in order of liquidity. Examples:
Cash Short-term investments Receivables Inventories Supplies Prepaid expenses
8
Long-Term Investments
Investments of stocks and bonds of other corporations which are normally held for many years.
Investments in long-term assets such as land or buildings that are not currently being used in the company’s operations
9
Property, Plant, and Equipment
Assets with relatively long useful lives.
Assets used in operating the business.
Examples: land buildings machinery delivery equipment furniture and fixtures
10
Depreciation is... Practice of allocating an asset’s full
purchase price to a number of years instead of expensing full cost in year of purchase.
11
Accumulated Depreciation...
Shows the total amount of depreciation that the company has expensed thus far in the asset’s life.
12
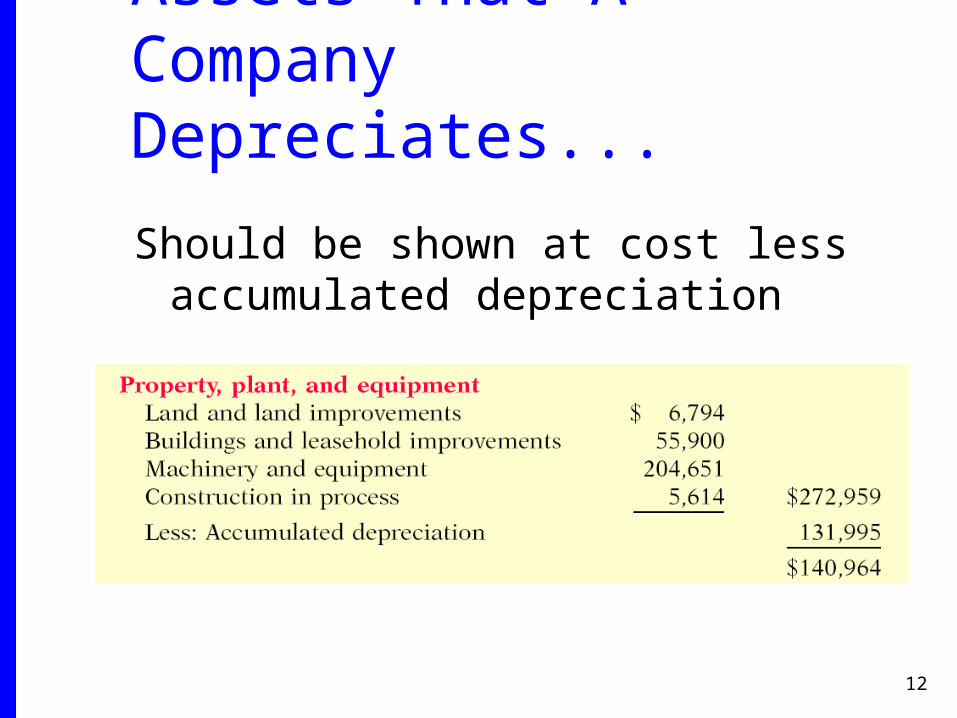
Assets That A Company Depreciates...
Should be shown at cost less accumulated depreciation
13
Intangible Assets have value because of the exclusive
rights or privileges they give the company.
Intangible Assets Non-current assets Have no physical substance Examples:
patents copyrights trademarks or trade names franchise
14
Current Liabilities
Obligations that are supposed to be paid within the coming year...
accounts payable wages payable bank loans payable interest payable taxes payable current maturities of long-term bank
loans payable
15
Long-Term LiabilitiesDebts expected to be paid after one yearExamples… bonds payable mortgages payable long-term notes payable lease liabilities and obligations under employee
pension plans
16
Stockholders' Equity
Capital stock - investments of assets in the business by the stockholders
Retained earnings - earnings kept for use in the business
17
Ratio AnalysisRatio Analysis Expresses relationship among
selected items of financial statement data
Relationship can be expressed in terms of… Percentage Rate Proportion
18
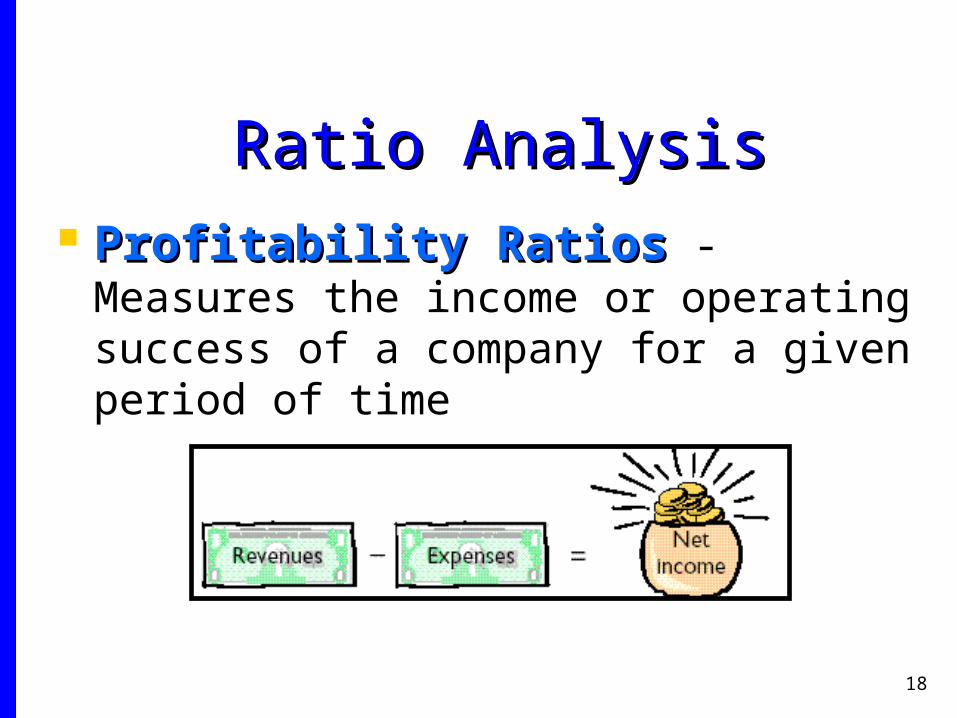
Ratio AnalysisRatio Analysis Profitability RatiosProfitability Ratios - Measures
the income or operating success of a company for a given period of time
19
Ratio AnalysisRatio Analysis
Liquidity RatiosLiquidity Ratios - Measures short-term ability of company to pay its maturing obligations and meet unexpected needs for cash
20
Ratio AnalysisRatio Analysis
Solvency RatiosSolvency Ratios - Measures the ability of the company to survive over a long period of time
21
Ratio Analysis – Ratio Analysis – Use Multiple Measures!Use Multiple Measures!
Intracompany comparisonsIntracompany comparisons - covering two years of the same company
Industry average comparisonsIndustry average comparisons - based on average ratios for a particular industry
Intercompany comparisonsIntercompany comparisons - based on comparisons with a competitor in the same industry
22
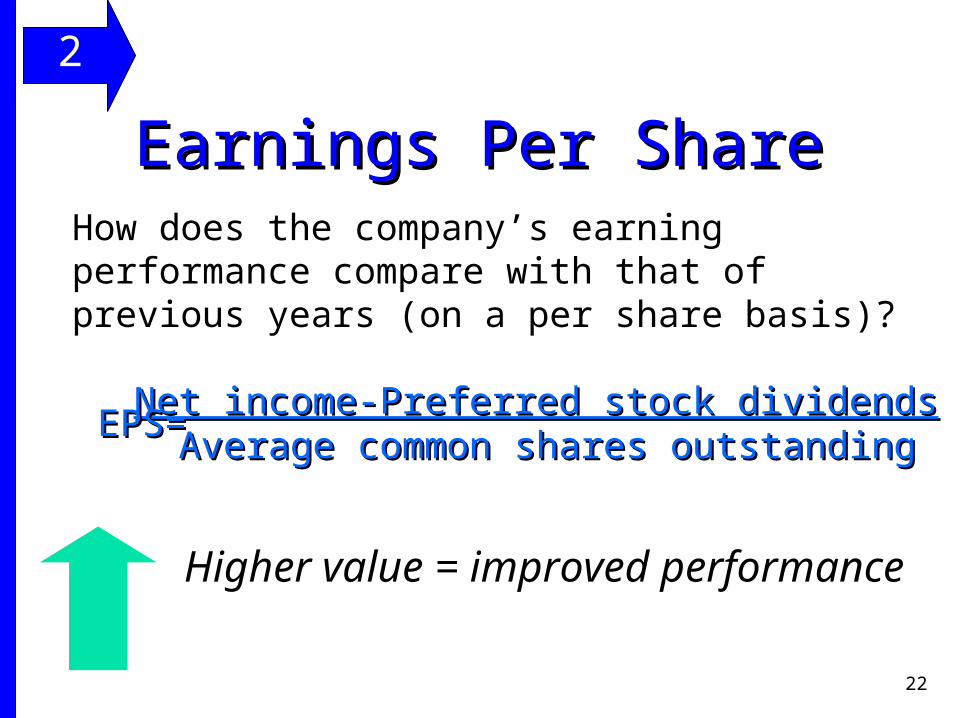
Earnings Per ShareEarnings Per ShareHow does the company’s earning performance compare with that of previous years (on a per share basis)?
Higher value = improved performance
Net income-Preferred stock dividendsNet income-Preferred stock dividends Average common shares outstandingAverage common shares outstandingEPS=EPS=
11 2
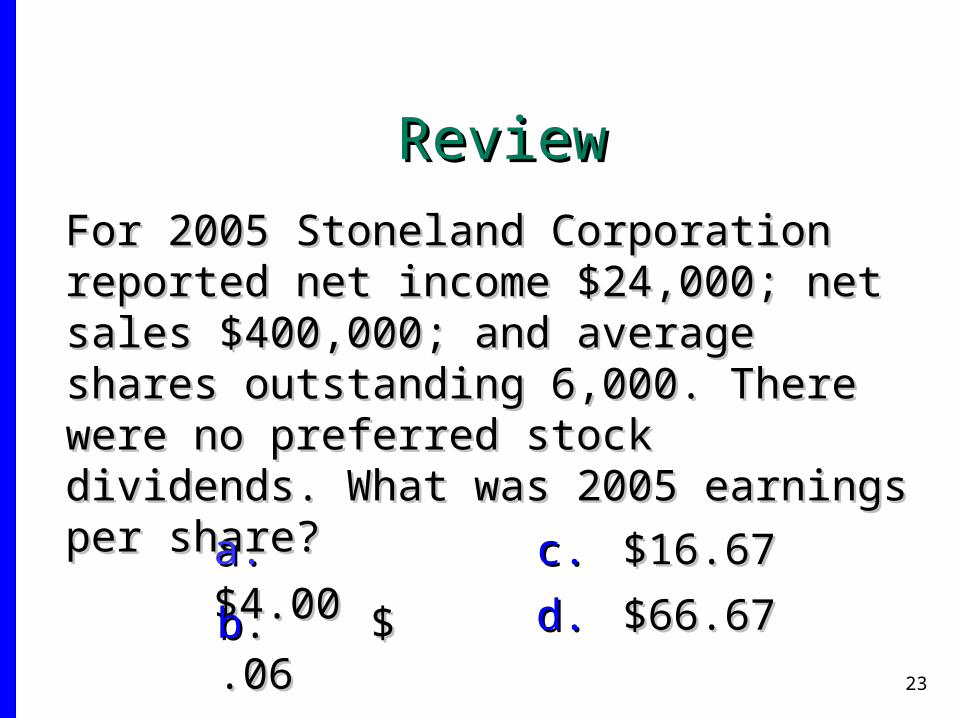
23
For 2005 Stoneland Corporation reported net For 2005 Stoneland Corporation reported net income $24,000; net sales $400,000; and average income $24,000; net sales $400,000; and average shares outstanding 6,000. There were no shares outstanding 6,000. There were no preferred stock dividends. What was 2005 preferred stock dividends. What was 2005 earnings per share?earnings per share?
a.a. $4.00$4.00
d.d. $66.67$66.67
c.c. $16.67$16.67
ReviewReview
bb. $. $ .06.06
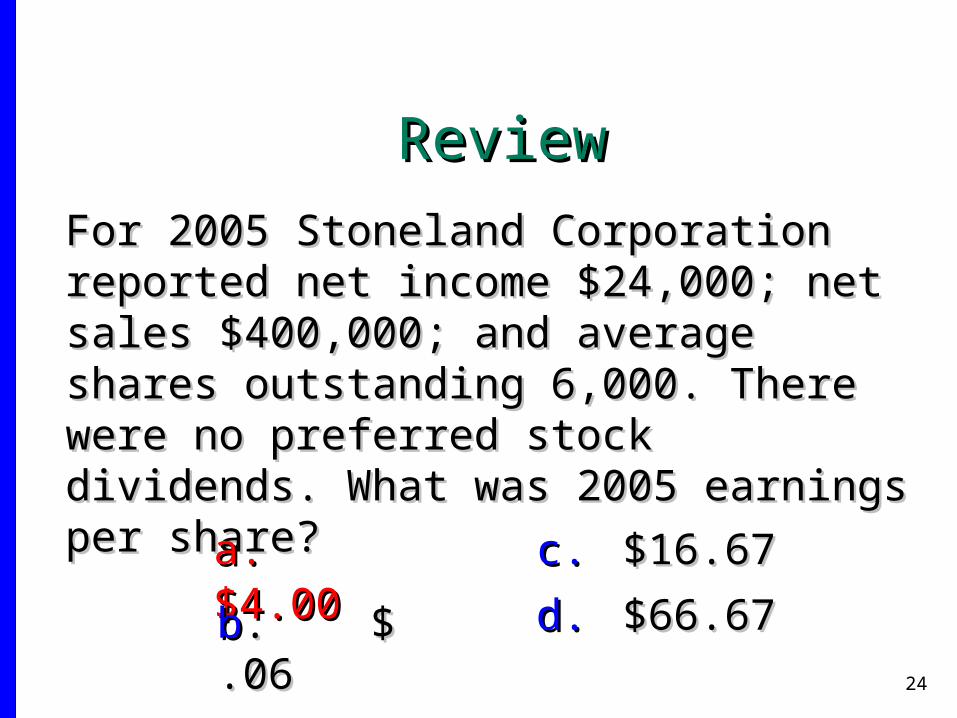
24
For 2005 Stoneland Corporation reported net For 2005 Stoneland Corporation reported net income $24,000; net sales $400,000; and average income $24,000; net sales $400,000; and average shares outstanding 6,000. There were no shares outstanding 6,000. There were no preferred stock dividends. What was 2005 preferred stock dividends. What was 2005 earnings per share?earnings per share?
a.a. $4.00$4.00
d.d. $66.67$66.67
c.c. $16.67$16.67
ReviewReview
bb. $. $ .06.06
25
Liquidity RatiosLiquidity Ratios
Measure of short-term ability to pay maturing obligations and to meet unexpected needs for cash
•Working capitalWorking capital
•Current ratioCurrent ratio
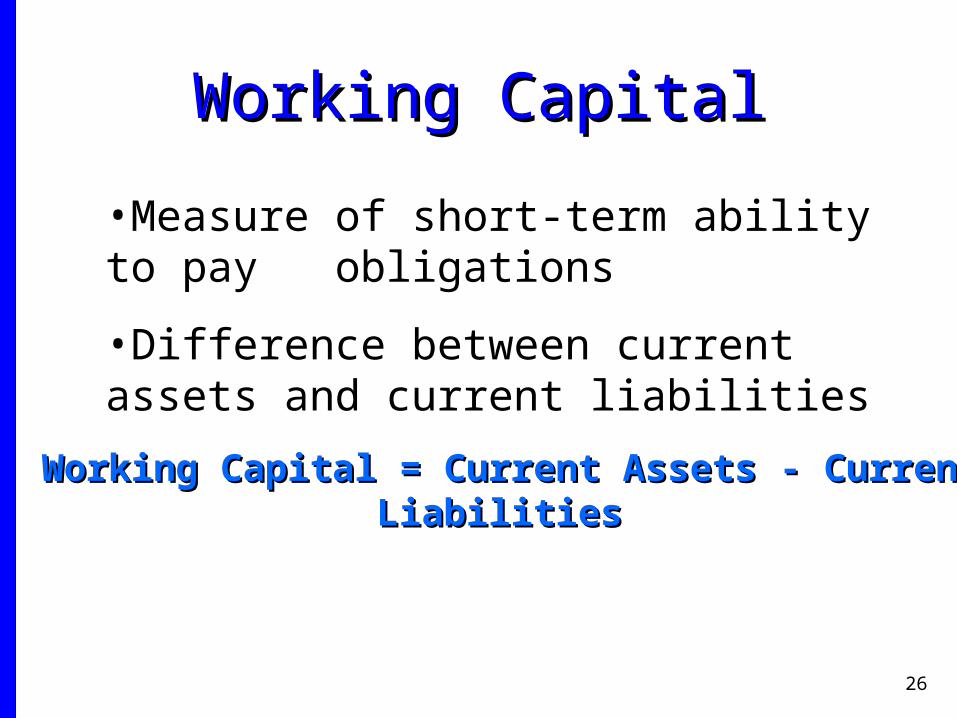
26
Working CapitalWorking Capital
Working Capital = Current Assets - Current Liabilities Working Capital = Current Assets - Current Liabilities
•Measure of short-term ability to pay obligations
•Difference between current assets and current liabilities
27
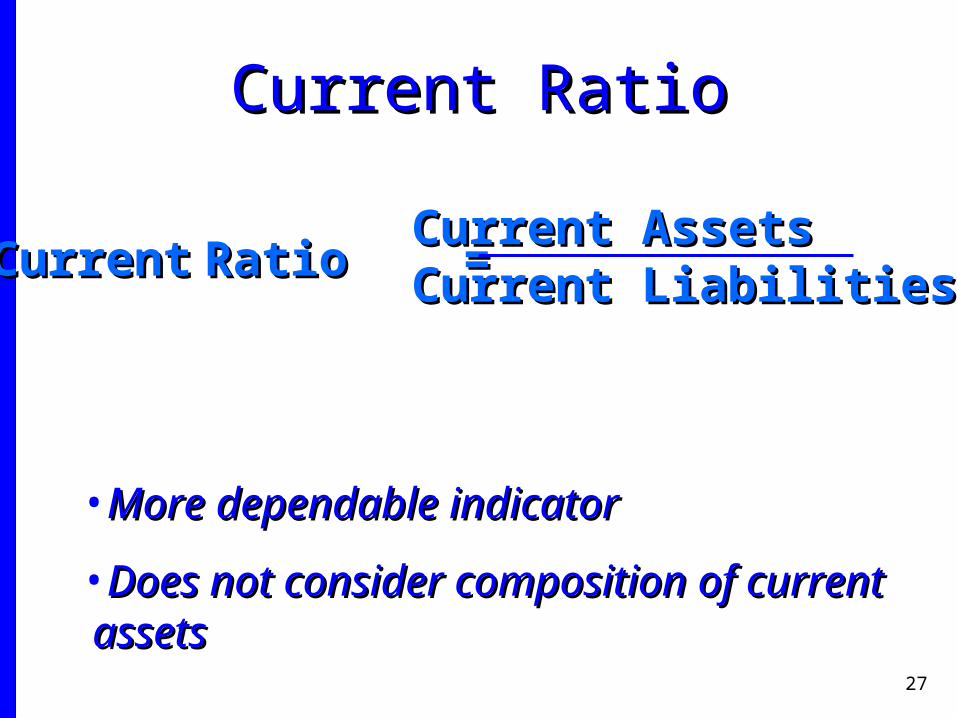
Current RatioCurrent Ratio
CurrentCurrent Ratio =Ratio =Current AssetsCurrent AssetsCurrent LiabilitiesCurrent Liabilities
•More dependable indicatorMore dependable indicator
•Does not consider composition of current Does not consider composition of current assetsassets
28
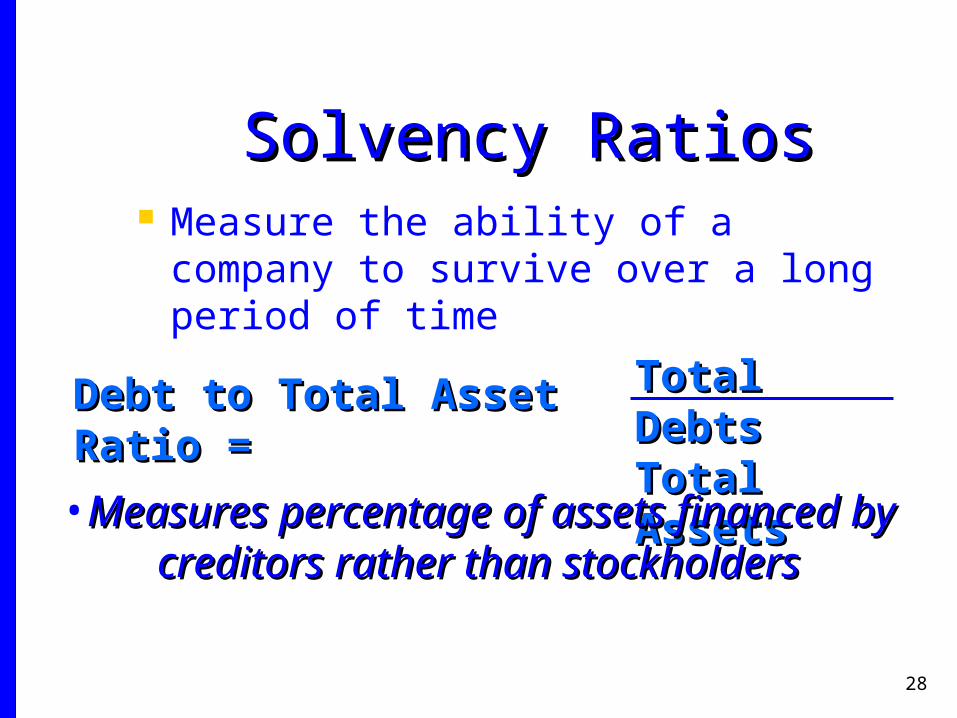
Measure the ability of a company to survive over a long period of time
Solvency RatiosSolvency Ratios
Total DebtsTotal DebtsTotal AssetsTotal Assets
Debt to Total Asset Ratio Debt to Total Asset Ratio ==
•Measures percentage of assets financed by Measures percentage of assets financed by creditors rather than stockholderscreditors rather than stockholders
29
ReviewReviewStatement of Cash FlowsStatement of Cash Flows
Provides information about sources and uses of cash, organized as: Operating Activities Investing Activities Financing Activities
11 5
30
Primary Accounting Setting Body in the U.S.
FinancialAccountingStandardsBoard
11 6

31
U.S. Government Agency That Oversees Financial Markets
SecuritiesExchangeCommission
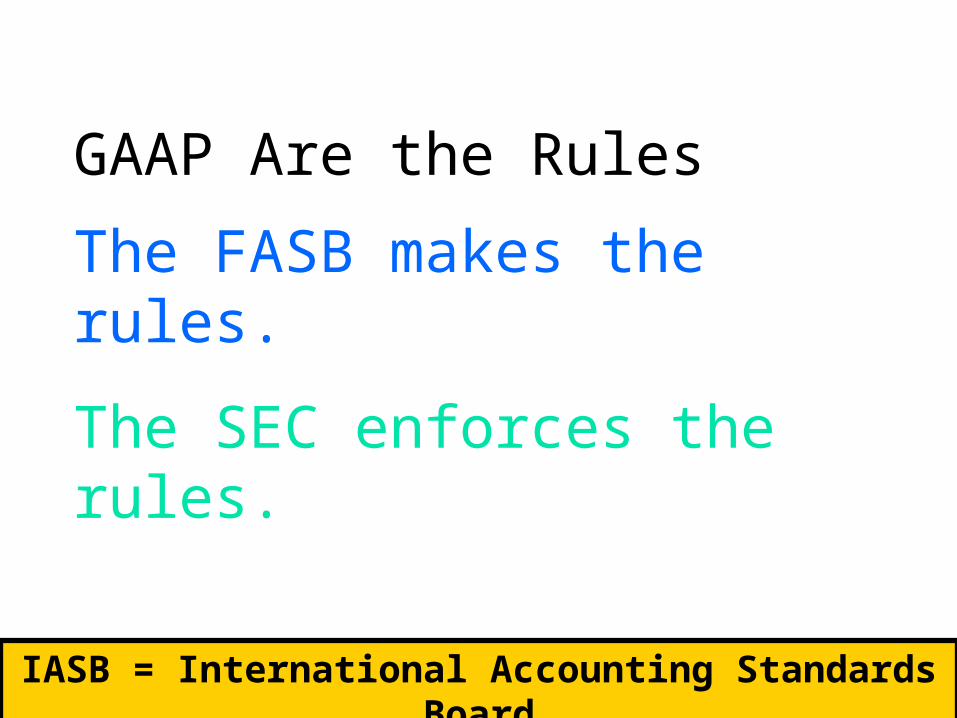
GAAP Are the Rules
The FASB makes the rules.
The SEC enforces the rules.
IASB = International Accounting Standards Board
33
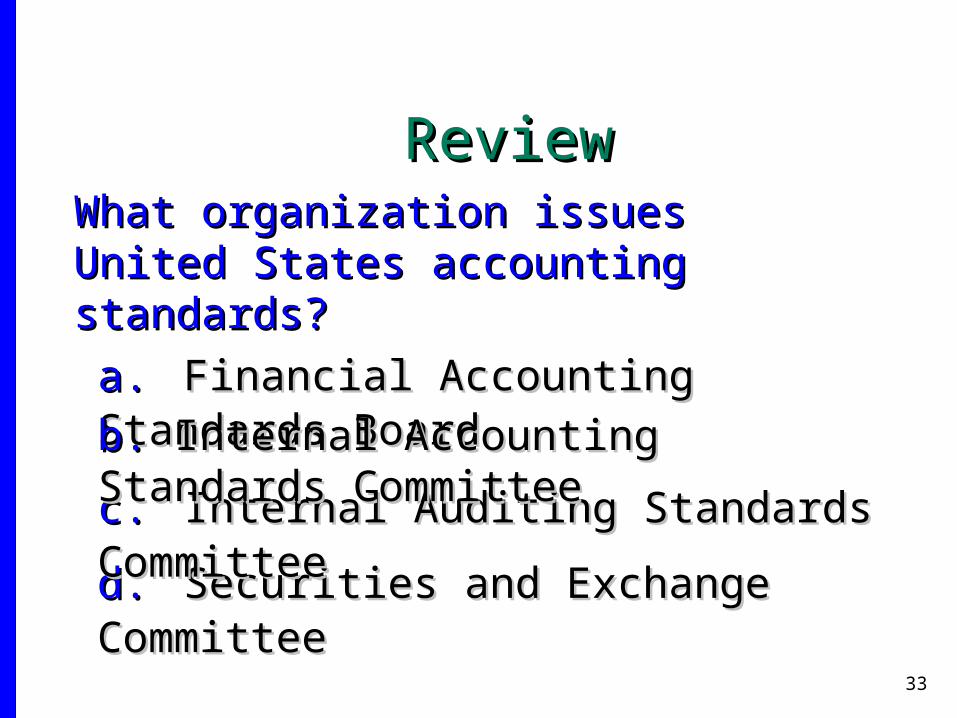
ReviewReviewWhat organization issues United States What organization issues United States accounting standards?accounting standards?
a.a. Financial Accounting Standards BoardFinancial Accounting Standards Board
d.d. Securities and Exchange CommitteeSecurities and Exchange Committee
c.c. Internal Auditing Standards CommitteeInternal Auditing Standards Committee
b. b. Internal Accounting Standards CommitteeInternal Accounting Standards Committee
34
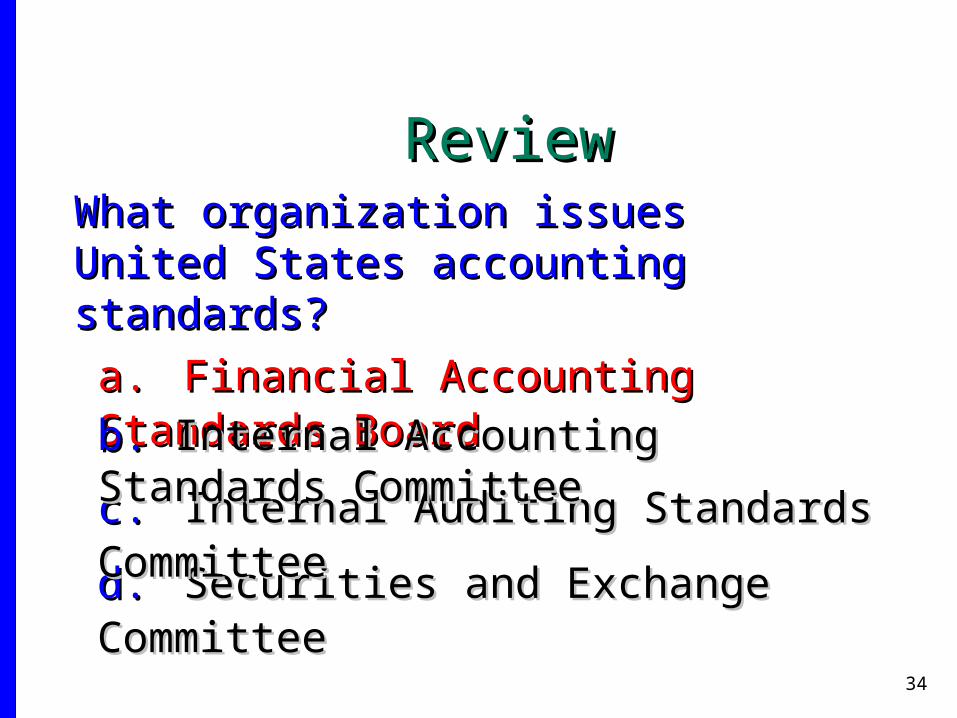
ReviewReviewWhat organization issues United States What organization issues United States accounting standards?accounting standards?
a.a. Financial Accounting Standards BoardFinancial Accounting Standards Board
d.d. Securities and Exchange CommitteeSecurities and Exchange Committee
c.c. Internal Auditing Standards CommitteeInternal Auditing Standards Committee
b. b. Internal Accounting Standards CommitteeInternal Accounting Standards Committee
35
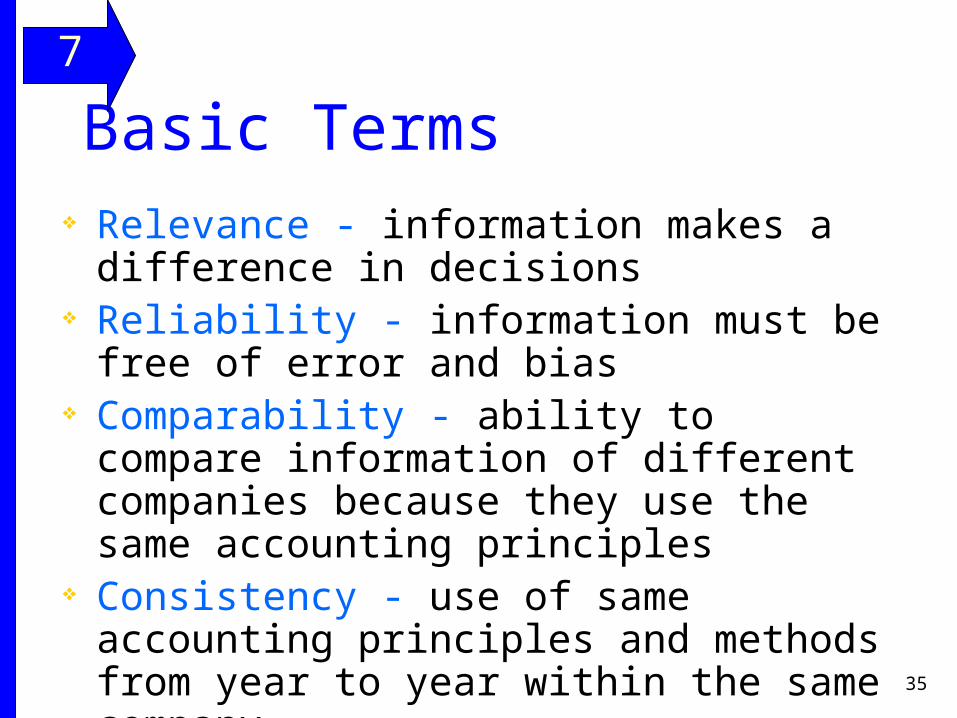
Basic Terms Relevance - information makes a difference in
decisions Reliability - information must be free of error
and bias Comparability - ability to compare
information of different companies because they use the same accounting principles
Consistency - use of same accounting principles and methods from year to year within the same company
11 7
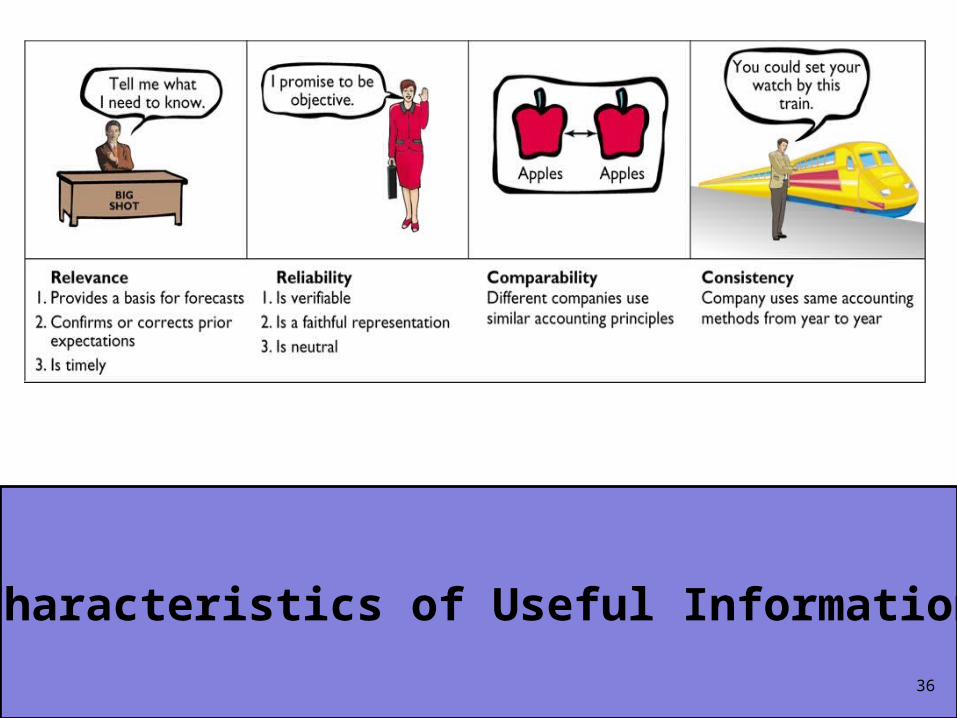
Characteristics of Useful Information
36
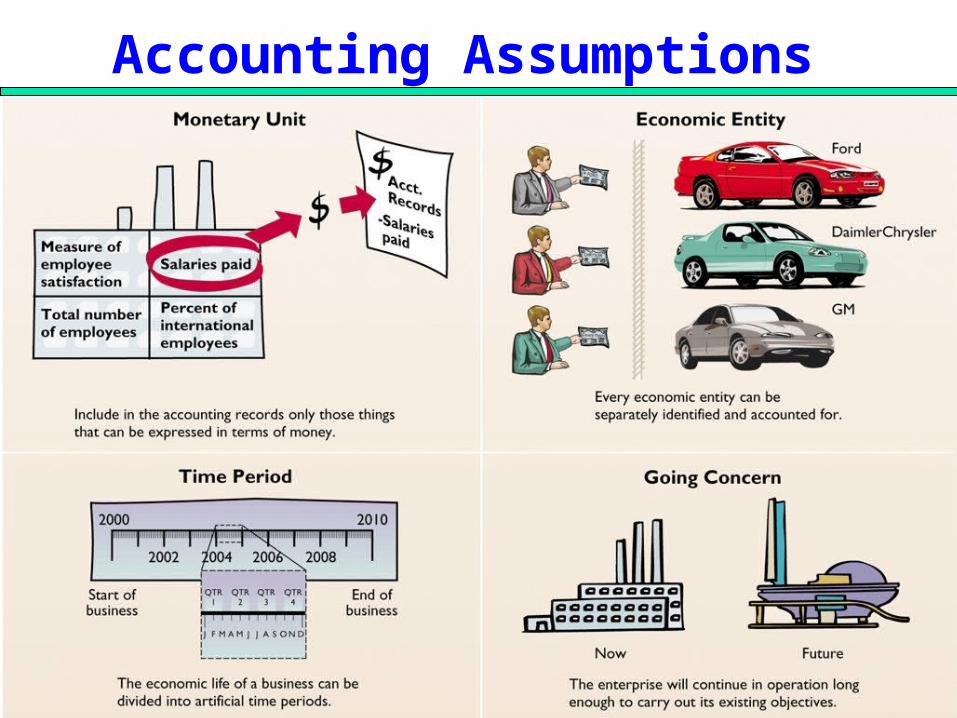
Accounting Assumptions
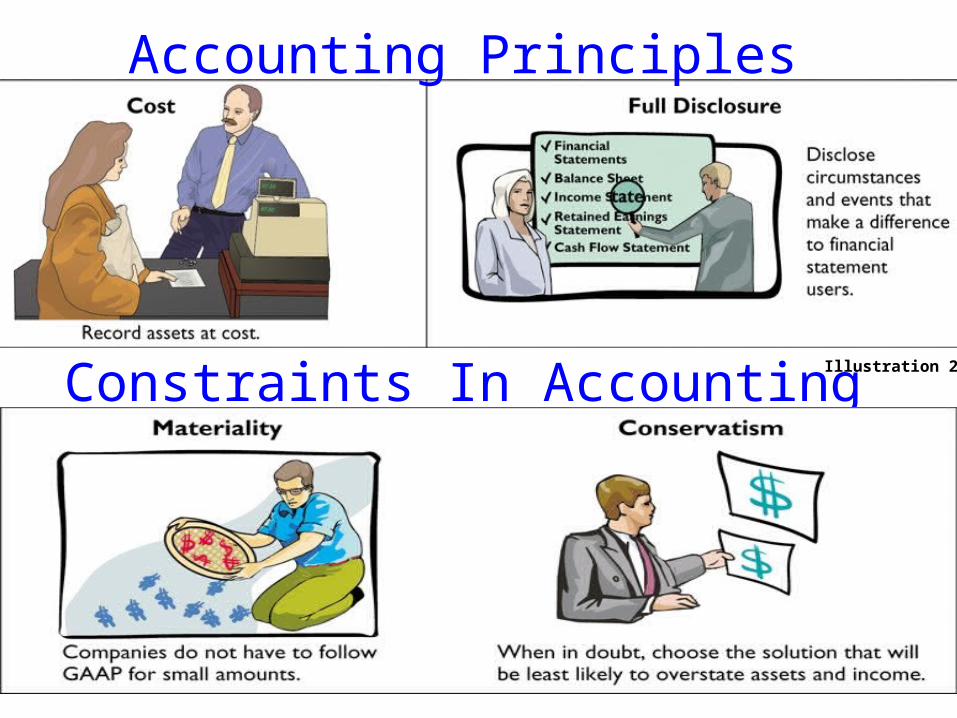
Accounting Principles
Constraints In Accounting Illustration 23
39
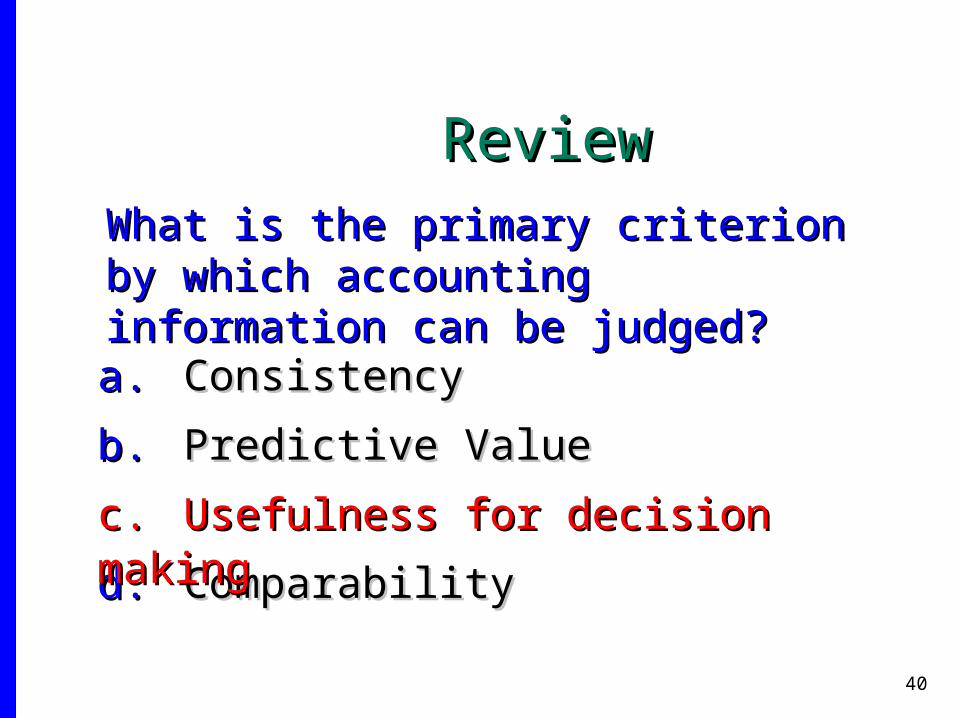
ReviewReviewWhat is the primary criterion by which What is the primary criterion by which accounting information can be judged?accounting information can be judged?
a.a. ConsistencyConsistency
d.d. ComparabilityComparability
c.c. Usefulness for decision makingUsefulness for decision making
b.b. Predictive ValuePredictive Value
40
ReviewReviewWhat is the primary criterion by which What is the primary criterion by which accounting information can be judged?accounting information can be judged?
a.a. ConsistencyConsistency
d.d. ComparabilityComparability
c.c. Usefulness for decision makingUsefulness for decision making
b.b. Predictive ValuePredictive Value
41
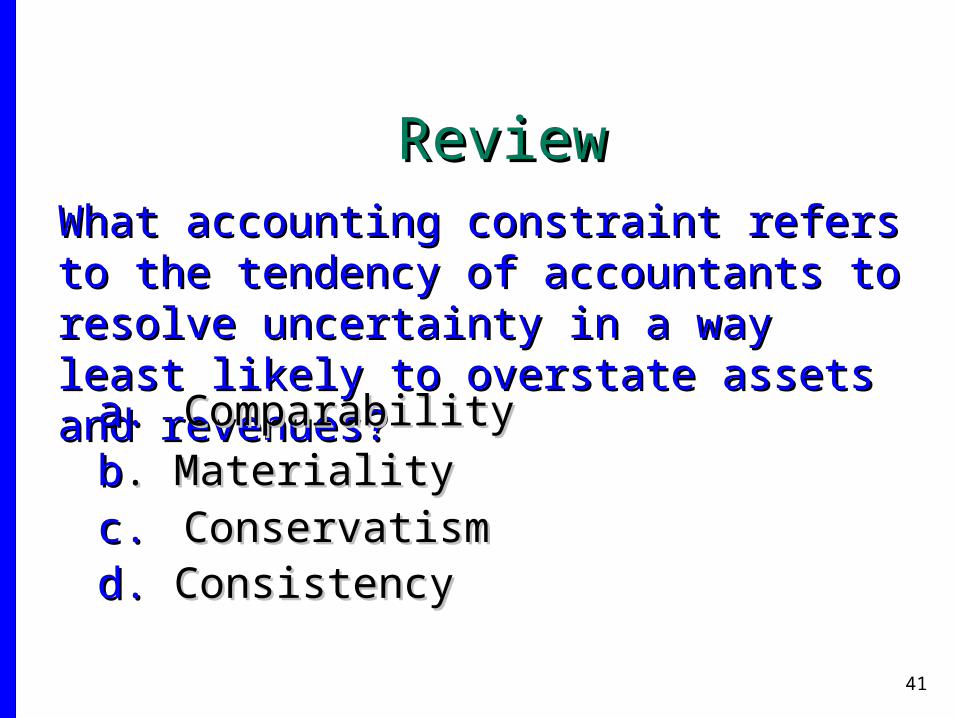
What accounting constraint refers to the tendency What accounting constraint refers to the tendency of accountants to resolve uncertainty in a way of accountants to resolve uncertainty in a way least likely to overstate assets and revenues?least likely to overstate assets and revenues?
a.a. ComparabilityComparability
d. d. ConsistencyConsistencyc.c. ConservatismConservatism
ReviewReview
bb. Materiality. Materiality
42
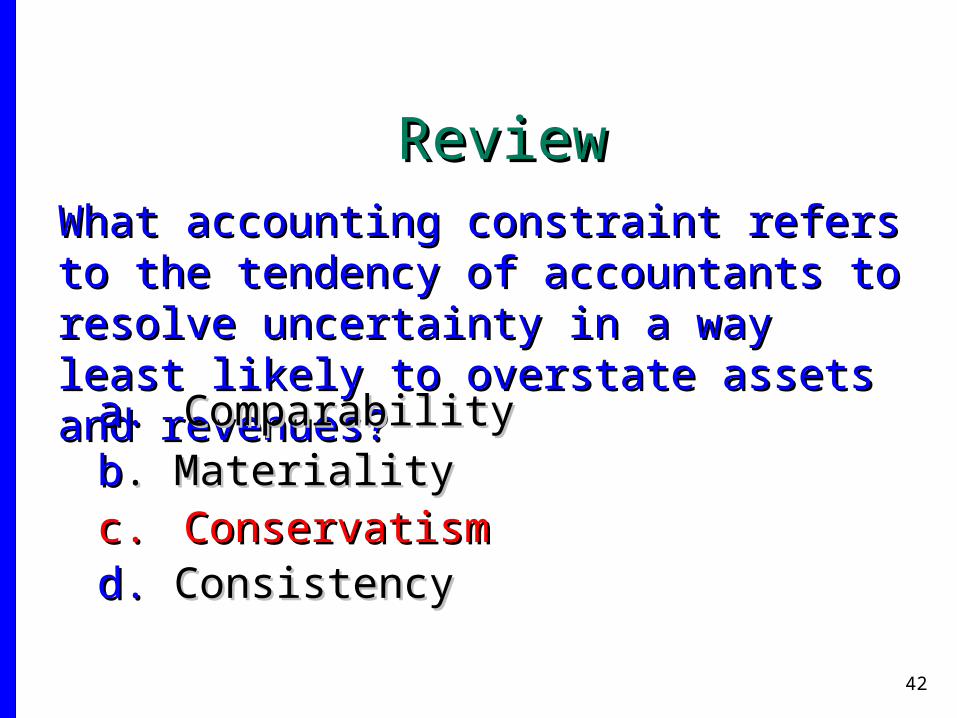
What accounting constraint refers to the tendency What accounting constraint refers to the tendency of accountants to resolve uncertainty in a way of accountants to resolve uncertainty in a way least likely to overstate assets and revenues?least likely to overstate assets and revenues?
a.a. ComparabilityComparability
d. d. ConsistencyConsistencyc.c. ConservatismConservatism
ReviewReview
bb. Materiality. Materiality
43
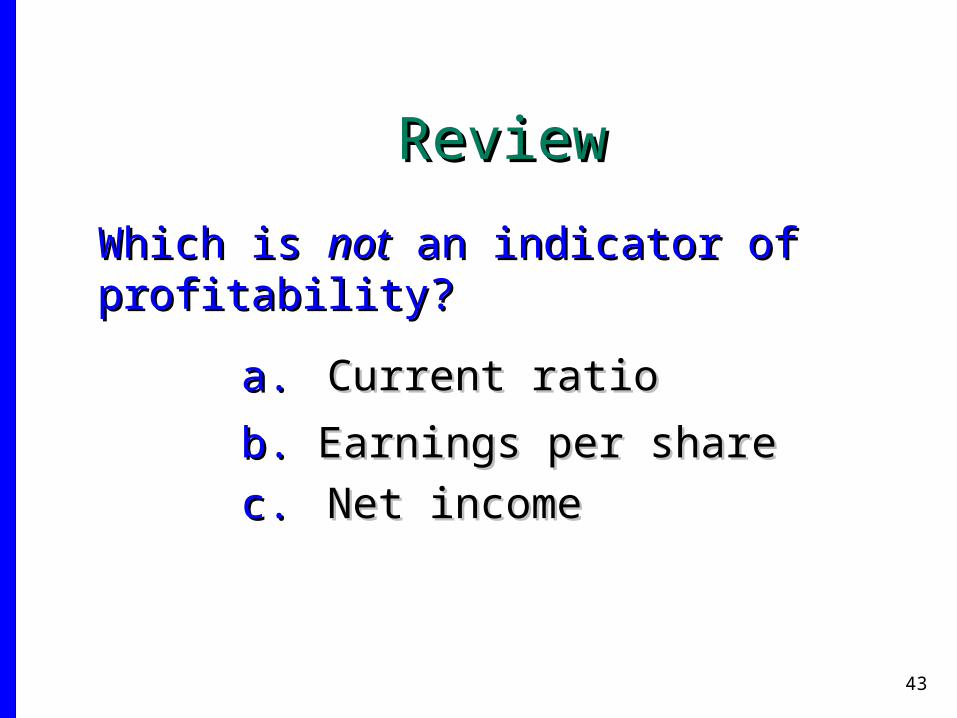
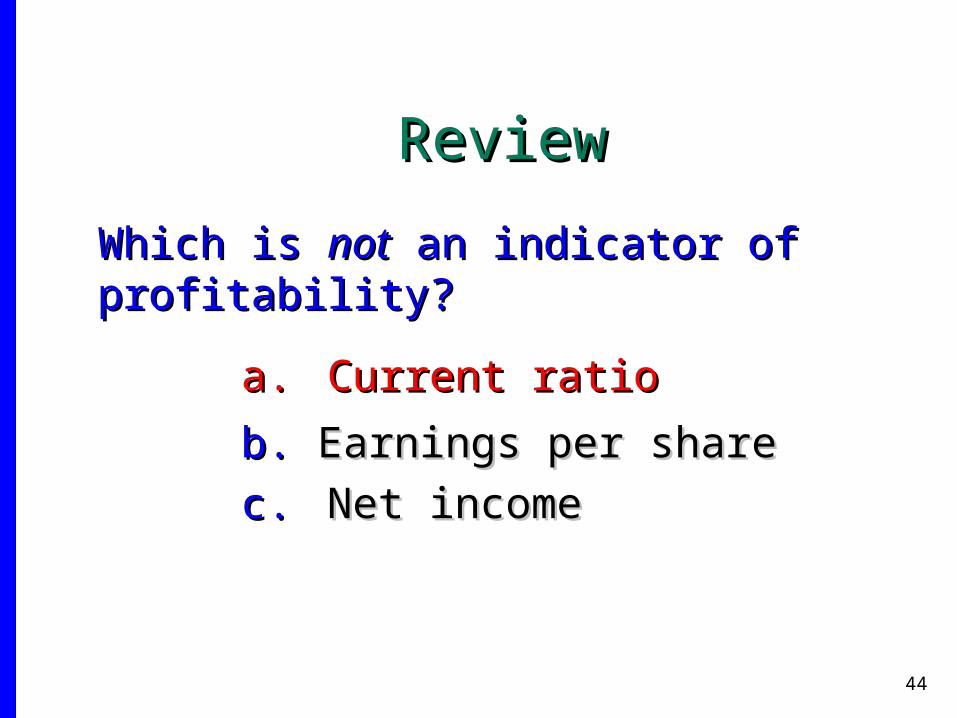
Which is Which is notnot an indicator of profitability? an indicator of profitability?
a.a. Current ratioCurrent ratio
c.c. Net incomeNet income
ReviewReview
b. b. Earnings per shareEarnings per share
44
Which is Which is notnot an indicator of profitability? an indicator of profitability?
a.a. Current ratioCurrent ratio
c.c. Net incomeNet income
ReviewReview
b. b. Earnings per shareEarnings per share
45
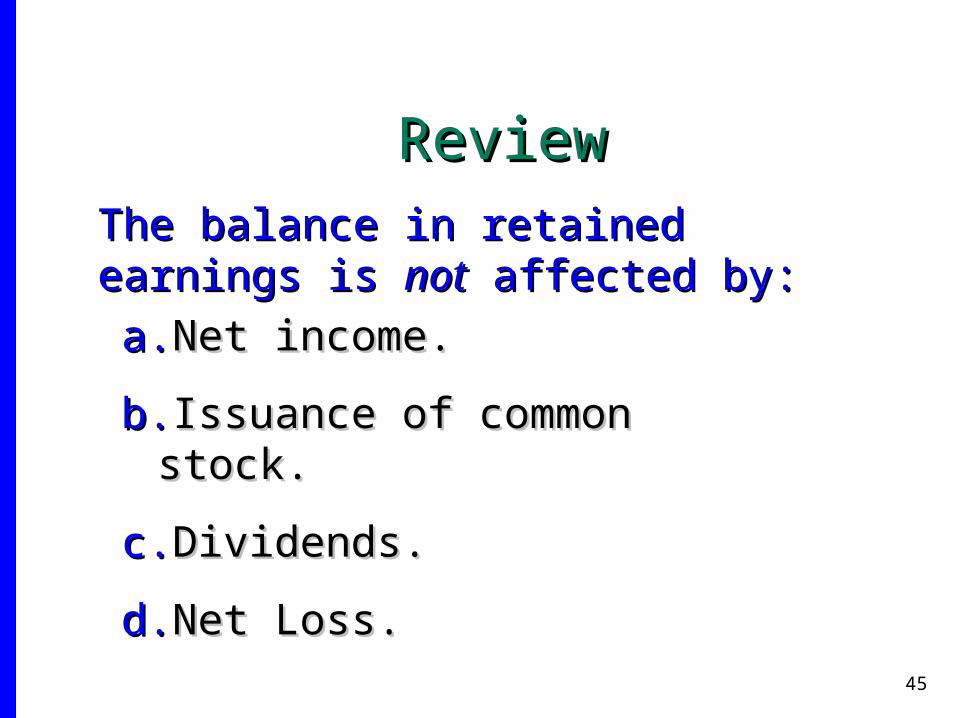
The balance in retained earnings is The balance in retained earnings is notnot affected by:affected by:
a.a. Net income.Net income.
b.b. Issuance of common stock.Issuance of common stock.
c.c. Dividends.Dividends.
d.d. Net Loss.Net Loss.
ReviewReview
46
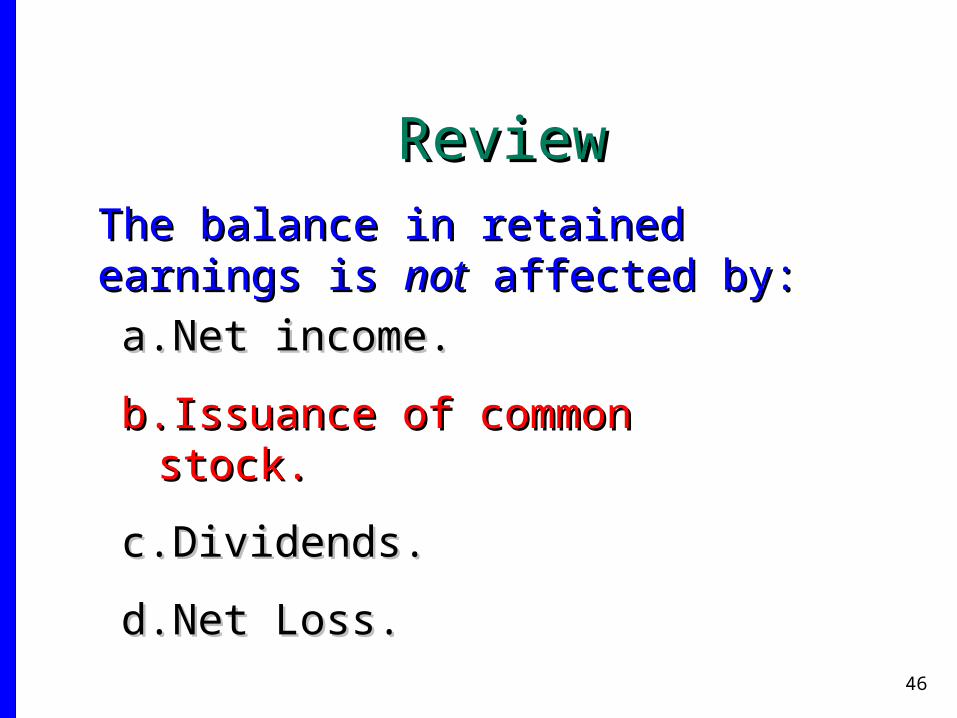
The balance in retained earnings is The balance in retained earnings is notnot affected by:affected by:
a.a. Net income.Net income.
b.b. Issuance of common stock.Issuance of common stock.
c.c. Dividends.Dividends.
d.d. Net Loss.Net Loss.
ReviewReview
47
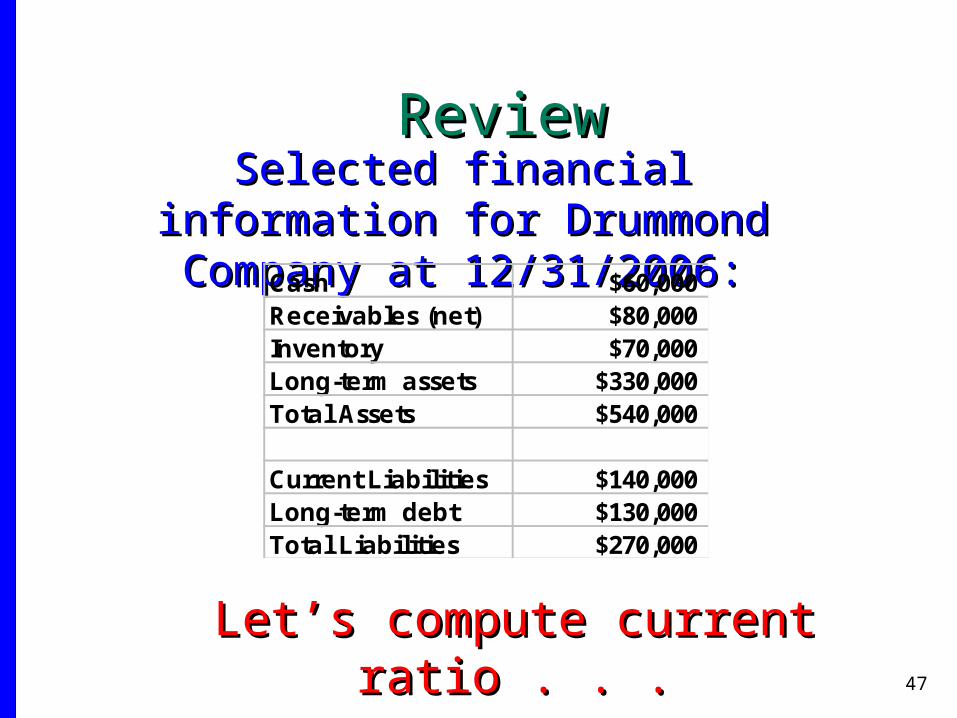
Selected financial information for Selected financial information for Drummond Company at 12/31/2006:Drummond Company at 12/31/2006:
Cash $60,000Receivables (net) $80,000Inventory $70,000Long-term assets $330,000Total Assets $540,000
Current Liabilities $140,000Long-term debt $130,000Total Liabilities $270,000
Let’s compute current ratio . . .Let’s compute current ratio . . .
ReviewReview
48
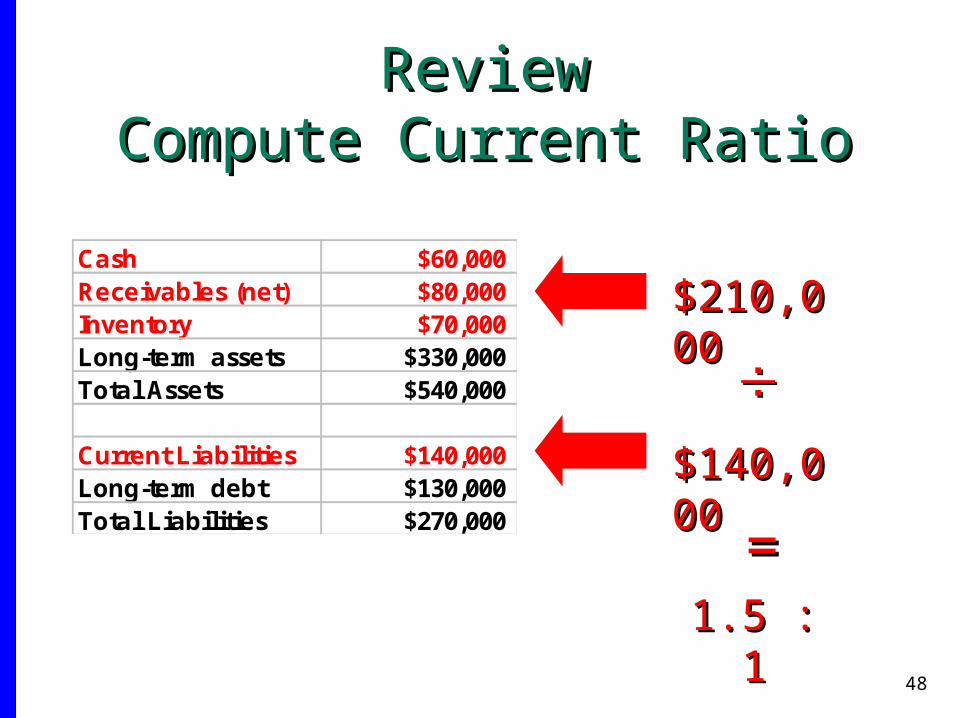
Cash $60,000Receivables (net) $80,000Inventory $70,000Long-term assets $330,000Total Assets $540,000
Current Liabilities $140,000Long-term debt $130,000Total Liabilities $270,000
$210,000$210,000
$140,000$140,000
==1.5 : 11.5 : 1
Review Review Compute Current RatioCompute Current Ratio
49
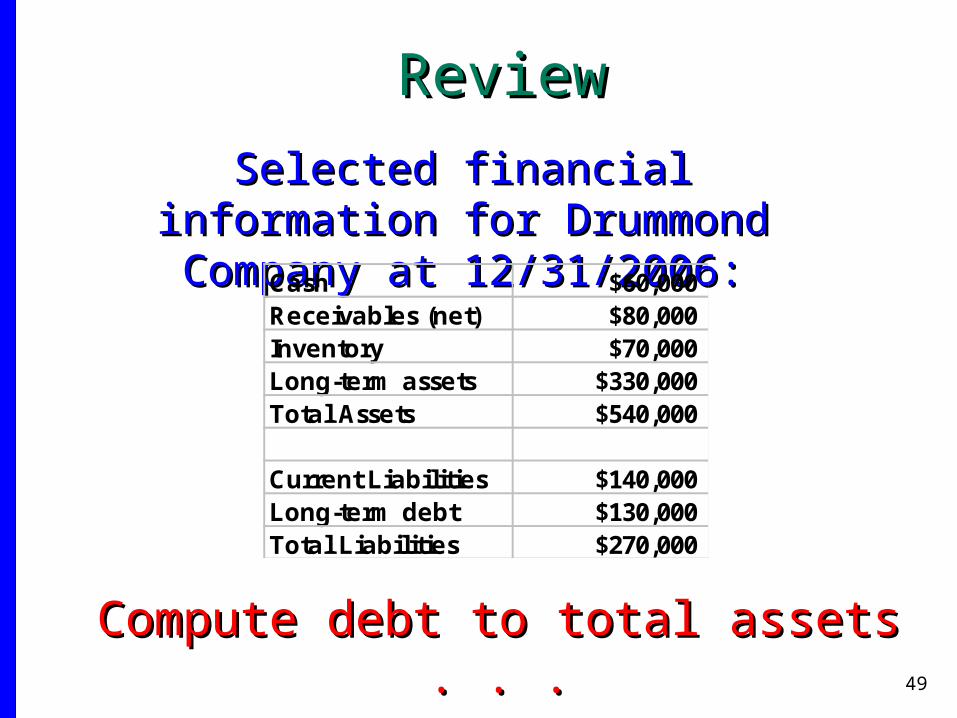
Selected financial information for Selected financial information for Drummond Company at 12/31/2006:Drummond Company at 12/31/2006:
Cash $60,000Receivables (net) $80,000Inventory $70,000Long-term assets $330,000Total Assets $540,000
Current Liabilities $140,000Long-term debt $130,000Total Liabilities $270,000
Compute debt to total assets . . .Compute debt to total assets . . .
ReviewReview
50
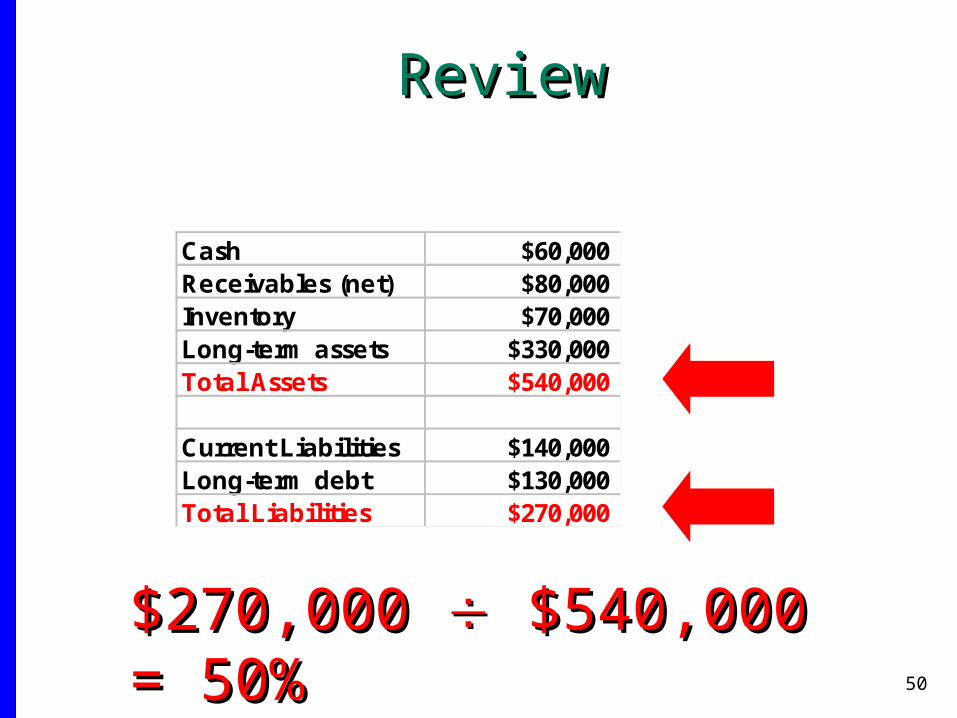
Cash $60,000Receivables (net) $80,000Inventory $70,000Long-term assets $330,000Total Assets $540,000
Current Liabilities $140,000Long-term debt $130,000Total Liabilities $270,000
$270,000 $270,000 $540,000 = 50% $540,000 = 50%
ReviewReview
51
Copyright © 2008 John Wiley & Sons, Inc. All rights reserved. Reproduction or translation of this work beyond that named in Section 117 of the United States Copyright Act without the express written consent of the copyright owner is unlawful. Request for further information should be addressed to the Permissions Department, John Wiley & Sons, Inc. The purchaser may make back-up copies for his/her own use only and not for distribution or resale. The Publisher assumes no responsibility for errors, omissions, or damages, caused by the use of these programs or from the use of the information contained herein.