1. 2 3 The 10-Step Road Map To Prosperity 1.Trade Policy 2.Fiscal Burden 3.Government Intervention...
13
1
-
Upload
abraham-malone -
Category
Documents
-
view
213 -
download
0
Transcript of 1. 2 3 The 10-Step Road Map To Prosperity 1.Trade Policy 2.Fiscal Burden 3.Government Intervention...

1

2

3
The 10-Step Road Map To Prosperity
1. Trade Policy
2. Fiscal Burden
3. Government Intervention
4. Monetary Policy
5. Capital Flows and Foreign Investment
6. Banking and Finance
7. Wages and Prices
8. Property Rights
9. Regulations
10. Informal Market

4
Economic Freedom and Per Capita Income
$30,997
$13,531
$4,058 $4,239
$0
$5,000
$10,000
$15,000
$20,000
$25,000
$30,000
$35,000
Free Mostly Free Mostly Unfree Repressed
2004 GDP per Capita (in Purchasing Power Parities)
Source: World Bank, World Development Indicators Online, available by subscription at wwww.worldbank.org/data; Central Intelligence Agency, The World Factbook 2005,available at http://www.cia.gov/cia/publications/factbook/index.html; Marc A. Miles, Kim R. Holmes, and Mary Anastasia O’Grady, 2006 Index of Economic Freedom (Washington, D.C.: The Heritage Foundation and Dow Jones & Company, Inc., 2006), at www.heritage.org/index.
2006 Index of Economic Freedom

5
Improvement in Economic Freedom and Economic Growth
4.06%
3.01%
1.46%1.32%
1.53%
0.0%
0.5%
1.0%
1.5%
2.0%
2.5%
3.0%
3.5%
4.0%
4.5%
1st Quintile 2nd Quintile 3rd Quintile 4th Quintile 5th Quintile
Compound per Capita Growth (1995-2004)
Change in Economic Freedom (1997 Index to 2006 Index)Biggest Improvement Biggest Decline
Source: World Bank, World Development Indicators Online, available by subscription at wwww.worldbank.org/data; Central Intelligence Agency, The World Factbook 2005, available at http://www.cia.gov/cia/publications/factbook/index.html; Marc A. Miles, Kim R. Holmes, and Mary Anastasia O’Grady, 2006 Index of Economic Freedom (Washington, D.C.: The Heritage Foundation and Dow Jones & Company, Inc., 2006), at www.heritage.org/index.

6
Country Score Change over Index History
Slovenia 1.38 (1996 to 2006)
Lithuania 1.31 (1996 to 2006)
Malta 1.28 (1995 to 2006)
Poland 1.02 (1995 to 2006)
New EU Members 0.83 (1996 to 2006)
Cyprus 0.79 (1996 to 2006)
Latvia 0.76 (1996 to 2006)
Estonia 0.70 (1995 to 2006)
Bulgaria 0.68 (1995 to 2006)
Hungary 0.49 (1995 to 2006)
Slovak Republic 0.48 (1995 to 2006)
Old EU Members 0.39 (1995 to 2006)
Czech Republic 0.23 (1995 to 2006)
Improving Economic Freedom: Performance over Index History

7
1995 1996 1997 1998 1999 2000 2001 2002 2003 2004 2005 2006
Bulgaria’s Monetary Stability Takes a Step Backwards
Monetary Policy Score
High
Low
Source: Marc A. Miles, Kim R. Holmes, and Mary Anastasia O’Grady, 2006 Index of Economic Freedom (Washington, D.C.: The Heritage Foundation and Dow Jones & Company, Inc., 2006), available at www.heritage.org/index.
Index of Economic Freedom
1
5

8
1
2
3
4
5
1995 1996 1997 1998 1999 2000 2001 2002 2003 2004 2005 2006
Bulgaria’s Trade Policy – Slipping
Trade Policy Score
High
Low
Source: Marc A. Miles, Kim R. Holmes, and Mary Anastasia O’Grady, 2006 Index of Economic Freedom (Washington, D.C.: The Heritage Foundation and Dow Jones & Company, Inc., 2006), available at www.heritage.org/index.
Index of Economic Freedom

9
1
2
3
4
5
1995 1996 1997 1998 1999 2000 2001 2002 2003 2004 2005 2006
Bulgaria Welcomes Foreign Investment
Capital Flows and Foreign Investment Score
High
Low
Source: Marc A. Miles, Kim R. Holmes, and Mary Anastasia O’Grady, 2006 Index of Economic Freedom (Washington, D.C.: The Heritage Foundation and Dow Jones & Company, Inc., 2006), available at www.heritage.org/index.
Index of Economic Freedom

10
*Income Tax Rate as of June 30, 2005 Country Top Income Tax Rate Growth Rate (1999-2004) Average Growth Rate
Countries with Tax Rates
below 35 percent
Slovak Republic 19 4.1
5.0
Bulgaria 24 4.9
Estonia 24 7.2
Latvia 25 7.5
Cyprus 30 3.4
Czech Republic 32 3.0
Lithuania 33 6.7
Finland 33.5 2.8
Countries with Tax Rates
from 35 to 45 percent
Malta 35 1.8
3.0
United States 35 2.6
Hungary 38 3.9
Luxembourg 38.95 4.1
Greece 40 4.3
Poland 40 3.1
Portugal 40 1.1
United Kingdom 40 2.8
Ireland 42 6.1
Italy 43 1.3
Germany 44.3 1.2
Spain 45 3.6
Countries with Tax Rates
above 45 percent
France 48.1 2.1
2.1
Austria 50 1.8
Belgium 50 1.9
Slovenia 50 3.4
Netherlands 52 1.3
Denmark 59 1.5
Sweden 60 2.5
11
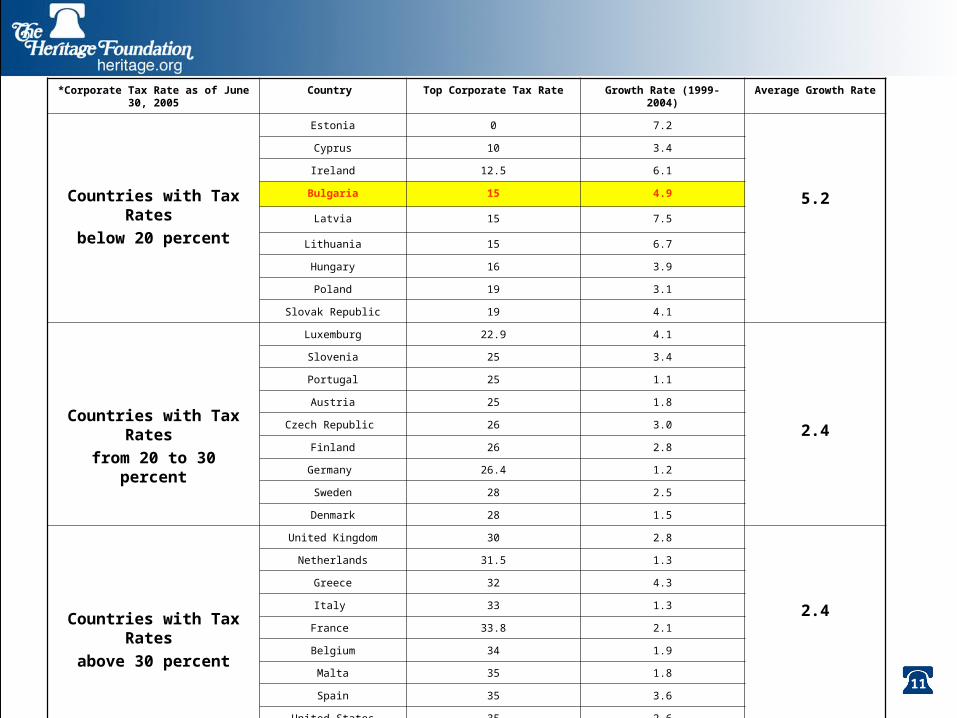
*Corporate Tax Rate as of June 30, 2005 Country Top Corporate Tax Rate Growth Rate (1999-2004) Average Growth Rate
Countries with Tax Rates
below 20 percent
Estonia 0 7.2
5.2
Cyprus 10 3.4
Ireland 12.5 6.1
Bulgaria 15 4.9
Latvia 15 7.5
Lithuania 15 6.7
Hungary 16 3.9
Poland 19 3.1
Slovak Republic 19 4.1
Countries with Tax Rates
from 20 to 30 percent
Luxemburg 22.9 4.1
2.4
Slovenia 25 3.4
Portugal 25 1.1
Austria 25 1.8
Czech Republic 26 3.0
Finland 26 2.8
Germany 26.4 1.2
Sweden 28 2.5
Denmark 28 1.5
Countries with Tax Rates
above 30 percent
United Kingdom 30 2.8
2.4
Netherlands 31.5 1.3
Greece 32 4.3
Italy 33 1.3
France 33.8 2.1
Belgium 34 1.9
Malta 35 1.8
Spain 35 3.6
United States 35 2.6

12
1995 1996 1997 1998 1999 2000 2001 2002 2003 2004 2005 2006
Bulgaria’s Property Rights – Must ImproveProperty Rights Score
High
Low
Source: Marc A. Miles, Kim R. Holmes, and Mary Anastasia O’Grady, 2006 Index of Economic Freedom (Washington, D.C.: The Heritage Foundation and Dow Jones & Company, Inc., 2006), available at www.heritage.org/index.
Index of Economic Freedom
1
5

13
1995 1996 1997 1998 1999 2000 2001 2002 2003 2004 2005 2006
Bulgaria’s Regulatory Burden – RepressiveRegulations Score
High
Low
Source: Marc A. Miles, Kim R. Holmes, and Mary Anastasia O’Grady, 2006 Index of Economic Freedom (Washington, D.C.: The Heritage Foundation and Dow Jones & Company, Inc., 2006), available at www.heritage.org/index.
Index of Economic Freedom
1
5