1. Introduction · 1. Introduction Since Nordhaus’ early contribution ( Nordhaus, 1969, 1972),...
58
Transcript of 1. Introduction · 1. Introduction Since Nordhaus’ early contribution ( Nordhaus, 1969, 1972),...


1
1. Introduction
Since Nordhaus’ early contribution (Nordhaus, 1969, 1972), economic theorists have undertaken
extensive analysis of the problem of optimal patent design. Theorists have long recognized the tradeoffs
inherent in the patent system – a system which creates static losses (by conferring upon innovators
temporary monopoly power) in order to realize dynamic social gains by inducing greater innovative effort.
Within policy circles, the debate surrounding intellectual property rights design and enforcement
has also increasingly come to the forefront. As has been widely noted, legal and procedural reforms in the
U.S. in the early 1980s provided stronger protection to holders of existing patents, reflecting a shift in the
U.S. policy consensus in favor of stronger intellectual property rights protection. This policy shift then
took on an international dimension as several consecutive U.S. administrations placed intellectual property
rights at the center of the U.S. agenda in bilateral and multilateral trade negotiations.1 Since the early
1980s, the U.S. has repeatedly sought to cajole or coerce its trading partners into significantly
strengthening their own intellectual property rights regimes, bringing them more in line with the new U.S.
model.
However, neither the expanding theoretical literature on patent design nor the international policy
debate has been sufficiently guided by empirical work.2 Much recent theoretical work explicitly assumes
that R&D performing firms are quite responsive to subtle changes in patent design. The U.S. position in
the international fight over intellectual property rights is based on the proposition that the additional
innovation induced by stronger patent systems is so substantial that the net social impact of a strengthening
of intellectual property rights abroad will be positive. These propositions are empirically testable, yet the
empirical evidence underlining these propositions ranges from sketchy to nonexistent.
Does an expansion of the scope of patent rights really induce more innovative effort? Our paper
provides badly needed empirical evidence on this question by analyzing the response of Japanese firms to
the Japanese patent reforms of 1987, enacted in January 1988 (hereafter the 1988 reforms or “patent
reform”). For reasons which we document in the paper, this Japanese reform provides an unusually clean

2
“natural experiment.”3 Furthermore, this policy reform was undertaken in a country with a large number of
R&D-intensive firms that had reached the global “technology frontier” by the time the reforms were
enacted.4 Thus, we have micro-level data on the R&D investment and patenting of a large number of firms
both prior to and after the enactment of reforms. Finally, Japanese firms are not only aggressive about
seeking patent protection at home, but they are also aggressive in patenting in the U.S., receiving
approximately 25% of all patents granted by the U.S. Patent and Trademark Office (U.S. PTO). There
was no similar change in U.S. patent law at the time of the 1988 reforms. Because we possess two parallel
patent series for our sample firms, we may be able to identify more precisely just what the impact of the
patent reforms was on innovative output.
We show that the 1988 patent reforms in Japan expanded the scope of patent protection, as defined
by the theoretical literature on patent design, based on interviews with practitioners. Interview results also
suggest that organizational setting has an effect on firms’ response to changes in patent systems.
Empirically analyzing data on 307 Japanese firms during the period 1980 to 1994, we find little evidence
that this expansion of patent scope induced additional R&D effort by Japanese firms. We also examine
whether or not the Japanese patent reform resulted in additional innovative output by examining firm
patenting in the U.S. and Japan. We find some evidence consistent with the hypothesis that innovative
output increased. However, only a portion of this increase can be reasonably attributed to the effects of
patent reform. Taken together, the empirical evidence suggests that firm responsiveness to even significant
changes in patent design is limited. This has important implications for both the current policy debate and
the theoretical literature, which we discuss in our conclusion.
This article is organized as follows. Section 2 explains the pre-reform Japanese patent system.
Section 3 describes the 1988 Japanese patent system reforms. This section also explains why these reforms
can be considered an “exogenous” policy change. Section 4 discusses the perceptions of the effects of the
reforms by practitioners and demonstrates that patent reform effectively expanded the scope of patent
protection. Section 5 establishes the linkage between the 1988 reforms and theoretical literature, and

3
introduces a model which summarizes the expected effect of the 1988 reforms on innovation. Section 6
examines the impact of patent reform on Japanese firms at the aggregated level. Section 7 empirically
analyzes the impact of patent reform on R&D spending. Section 8 examines the effect of the patent
reforms on Japanese firms’ patenting in Japan and the U.S., and section 9 concludes.
2. The Japanese patent system before the 1988 reforms
Japanese and American patent examiners followed similar standards of what constituted a
patentable invention. A major difference between the two patent systems concerned the scope of a patent.5
A claim defines the subject matter which an applicant regards as his or her invention. Japanese patents
covered a single, independent claim - meaning that one novel advance was permitted per patent. In
contrast, American and European patents often listed multiple, independently valid claims. The Japanese
single-claim system (or the “head claim system”) meant that, compared with other nations, many more
Japanese patents had to be filed to cover the same technology. This difference led to a much greater
number of patent applications in Japan than in other countries.
It was also argued that the scope of each claim tended to be narrower in Japan than in the U.S. A
patent in the U.S. could claim protection for broad classes of a product, whereas in Japan only specific
cases of the product that had been proven in practice could be patented. For example, if a new material
could conceivably contain 10% to 50% of a certain ingredient, the U.S. patent could specify this range; in
Japan the patent covered only the specific percentage that the inventor had used.6 As each patent was so
thinly defined under the Japanese patent system,7 some critics even called it the sashimi system, after the
Japanese sliced fish delicacy.8
3. The 1988 reforms
From the single-claim system to the “improved” multiple-claim system. Before 1976, Japanese
patent law allowed only one independent, single claim to be included in an invention. A 1976 amendment

4
to the patent law allowed the inclusion of multiple dependent claims, which defined the technical ways to
implement an independent claim, in the same patent application. This amendment, however, did not
substantially change the number of claims included in a patent.
In contrast, the 1988 reforms significantly expanded the extent to which multiple claims could be
included in one patent. Patent applicants can now define the coverage of an invention with multiple claims,
and those claims can be either independent of or dependent on other claims. In addition, the extent to which
related inventions could be included in a single patent was dramatically expanded by the new law. For
example, in patenting chemical compounds, both the final chemical compound and the intermediate
products generated in its manufacture can be covered by one patent (Niihara ed., 1987). Patent experts
contend that, after the 1988 reforms, the scope of invention covered by a single patent application
equaled or even exceeded that conferred by the U.S. and European patent systems (Okamoto et. al.,
1996). The consequences of expansion of patent scope under these reforms will be our primary empirical
focus in this paper.
Patent term restoration for pharmaceuticals. The 1988 reforms also provided patent term
restoration of up to five years for the period necessary for drug safety and efficacy examination if the
patented invention could not be implemented for more than two years due to delays in the examination
process. This amounted to an effective extension of the length of patent rights in the pharmaceutical
industry. Our data set includes all of the important participants in the Japanese pharmaceutical industry,
allowing us, in principle, to explore the innovation-inducing effects of increased patent length as well as
increased patent scope.9
Motives of the series of reforms. When a patent system reform comes about primarily through
the lobbying efforts of the system’s primary beneficiaries, it is not clear that such a reform can be taken as
exogenous. In the case of the 1988 reforms, much of the political impetus for change came, not from heavy
domestic users of the patent system, such as Sony or NEC, but from Japan’s trading partners – chiefly the
U.S. The purpose of those reforms was to harmonize the Japanese patent system with that of other

5
countries, and so was driven by motives largely exogenous to the wishes of Japanese firms.
Many of the reasons for American dissatisfaction with the pre-reform Japanese patent system are
well illustrated by the case of Fusion Systems, which was made famous by a Harvard Business School case
study. Fusion Systems was a small U.S. high-tech company which invented a microwave lamp in 1974.
Fusion Systems sought patent protection in Japan for its invention, filing 20 patents in Japan by 1983.
While 20 U.S.-style multi-claim patents might have been enough to secure Fusion Systems’ intellectual
property rights, the 20 single-claim patents the company filed in Japan left substantial “holes” in the
intellectual product space it had sought to protect. Before Fusion Systems could correct this error, its chief
competitor in the Japanese market, Mitsubishi Electric, exploited its mistake by filing 139 patents in closely
related technologies – an example of a practice known as “patent flooding.” After finding that Mitsubishi
Electric’s 139 patent applications had effectively prevented it from plugging the “holes” in its intellectual
property protection, Fusion Systems appealed to USTR.10 Other U.S. firms with similar complaints put
additional political pressure on the U.S. government to pressure the Japanese government for a stronger
intellectual property rights regime. The major outcome was the introduction of the multi-claim system.
At the same time, the U.S. and other countries requested that Japan shorten the patent examination
period. Due to a severe backlog, the average examination period (from the request of the examination11 to
the end of the examination) reached 36 months in 1985. One cause of the delay was the very large number
of patent applications filed by Japanese firms. The broadening of patent scope was expected to reduce the
number of patent applications. Parallel to the 1988 reforms, the Japanese Patent Office asked the top 100
patenting companies, which account for 50% of the total patenting, to reduce the number of unnecessary
and trivial patent applications in 1988.12
4. Expected results of the reform and the perception by practitioners
The significance of the multi-claim system. In order to evaluate the expected and perceived
outcomes of the 1988 reforms, we conducted a series of interviews in Japan in March - September, 1998.

6
Six high-ranking officials at the Japanese Patent Office, general managers of intellectual property
departments at 10 major Japanese companies in electronics, office equipment, pharmaceuticals, chemicals,
and food industries, and three officers at the Japan Patent Information Organization (JAPIO), a quasi-
government organization which provides a Japanese patent electronic database, were interviewed.
----------------------------------------------Figure 1 about here
----------------------------------------------
Figure 1 illustrates the effect the new multi-claim system, as perceived by company managers and
Japanese Patent Office officers. The Xs in the center are inventions by a firm and each circle represents a
claim. Let us assume this company invented a chip which is used for image processing. The Xs are the
chip itself, and the processes used to make the chip. One circle represents a camera which contains this
chip. Another circle represents a personal computer which includes this chip. The third circle might be a
system which combines this chip, a camera, and a personal computer. The multi-claim system allows one
patent to contain all of these claims. Thus, a firm tries to maximize the territory covered by these circles
without tapping into claims associated with inventions by other firms. Under the single-claim system, a
company can draw only one circle, resulting in much narrower scope of intellectual property protection.
Does the multi-claim system really matter? One might argue that before the 1988 reforms,
innovators could duplicate the protection afforded by patents of greater scope by simply taking out multiple
patents.13 This argument would be incorrect if (1) the multi-claim system substantially reduced the cost of
a given level of patent protection, or (2) if the multi-claim system substantially improved the breadth of
patent protection (meaning innovations that could not be completely protected under the old system could
now receive full protection). Based on our interviews and on more objective data, we will argue that patent
reform did indeed produce effects (1) and (2). The extent and relative strength of these two effects, of
course, is difficult to calculate with precision, but we believe the effect of (2) is more substantial for
reasons discussed below.
Before addressing these issues, however, we feel that it is important at the outset to dispel the

7
widely held misconception that patents are neither important nor effective as instruments of appropriation
of innovation in Japan. Strong evidence to the contrary is presented in the recent paper by Cohen et. al.
(1998). The authors conduct a comprehensive survey of the R&D managers of U.S. and Japanese R&D-
intensive firms. Firms’ responses to these surveys suggest that Japanese firms regard patents as among the
most effective instruments of appropriation of innovation.14 In striking contrast, U.S. firms’ responses
suggest that American firms find patents to be a much less effective means of protection than, for instance,
trade secrecy. Likewise, when asked their most important reasons for patenting innovations, Japanese
firms listed prevention of imitation, blocking similar innovation by rivals, and the prevention of lawsuits as
the most important reasons for filing patents for both product innovations and process innovations.15
Financial implications of patent reform. The most obvious implications of patent reform, and the
easiest to demonstrate quantitatively, are the reductions in private patenting costs to the firms. To put it simply,
taking out multiple patents to protect a single idea under the “sashimi” system could prove quite costly.
Examination fees and agent fees, which are several times higher than the actual examination fees, had to be
incurred for each patent if multiple patents were filed to protect a single innovation. Multiple patenting per
invention would also increase the cost of enforcing patent rights if patent infringement took place, since a lawsuit
would have to be filed for each patent infringed. Many companies suggested in interviews that the multiple-
claim system brought an opportunity to save patent related fees through the combination of multiple claims
(and therefore multiple inventions) in one patent application, because a substantial portion of patent fees
are incurred per patent, not per claim.16
As an illustration of the potential cost savings, we use the patent fee schedule as of 1996. Official
fees including the filing fee and the examination fees are 105,300 yen per patent and 2,700 yen per claim.
Okamoto (1996) estimates that the agent fees incurred in the processing of these patent documents (as
explained later, some interviewed firms rely on agents to process as much as 70% of their patent
applications) were 604,000 yen per patent. Finally, maintenance fees for the life of the patent, assuming
the patent is registered at the fourth year from the filing, include 1,301,000 yen per patent and 132,300 yen

8
per claim. Under this fee schedule, the total costs of protection for a patent is 2,010,300 yen per patent
(denoted F, for the “fixed cost” of a patent) and 135,000 yen per claim (denoted V, for the “variable cost”
of a claim).
In 1993, for example, the average number of claims per patent (denoted N) is 3.77. Under the
1996 fee schedule, the total cost for the life of a typical patent is NV + F = 2,519,250 yen. Assuming that
under the old system each claim has to be filed as an independent patent17, the total cost for the life of a
patent to cover the same invention was N(V+F) = 8,087,781 yen. The cost saving from the multi-claim
system is ∆C = N(V+F) - (NV + F) = 5,568,531 yen, or a 68.9% cost saving. The number of the total
patent applications in Japan in 1993 was 366,486, and so the total cost saving would be 2,041 billion yen
or $17 billion (using $1 = 120 yen). This illustration suggests that the total cost savings could be quite
substantial.18
Admittedly, this sum is an upper bound. It overstates our case, as not all patents which are
examined are granted, nor are maintenance fees paid on all patents. Nevertheless, given the fee structure,
the potential costs savings are so large that they remain substantial even after more realistic adjustments
are made. Assuming only 10% of filed patents are examined and maintained, for example, the total cost
saving will still be 224 billion yen or $1.8 billion.19
While the private benefits of cost reduction for a given amount of patent protection are clear, the
social benefits are less so. A substantial reduction in the cost of patenting could lead firms to seek to
protect lower quality ideas. Certainly, we might expect the “quality” of the marginal protected idea to
decline with a large enough decline in cost. In fact, if the only real effect of patent reform was to reduce
the private cost of patent protection, we would expect to observe firms “repackaging” the same number of
ideas into fewer patents, thereby realizing cost savings, but we would not necessarily expect such a reform
to induce additional innovative output.
Real expansion of intellectual property rights under patent reform. An alternative

9
interpretation of these reforms is that, not only did they provide cost savings, but the advent of the multi-
claim system really did generate an increase in the breadth of intellectual property protection. Whether this
really happened or not is quite difficult to verify without detailed knowledge of changes in patent practice
that occurred after reform. When we went to those individuals most knowledgeable about these changes –
Japanese Patent Office officials and the heads of intellectual property departments at major corporations –
they claimed that this increase in effective scope did occur.
In practice, the total protection afforded by multiple narrow patents fell short of the protection
conferred by the new broader patents. All possible modifications to the original innovation were often not
regarded by patent examiners as bona fide independent innovations. Interviewees suggested that, in
practice, the “burden of proof” in establishing novelty was less stringent for a claim than for a patent.
Some firm managers also said that the multi-claim system allowed firms to describe an invention in
multiple dimensions, which increased the opportunities to demonstrate the novelty of the invention and,
thus, actually increase the chance that a patent is granted.20
The multi-claim system allowed the patent applicant to define the invention in ways which made
infringement easier to prove and prosecute under Japanese legal practice. This is an extremely important
but rather complicated point, which is best illustrated by example. Fortunately, Hiraoka et. al. (1988) and
Japan Patent Association (1988) provide many such examples. In the following case, a firm found that if
chemical compounds A and B (both publicly known materials) were combined at a specific ratio with
polyethylene, they significantly prevent the deterioration of polyethylene products. In filing a patent
application for this invention, there were several alternative ways to describe it.
(1) An additive which consists of materials A and B, that prevents the deterioration of polyethylene
(which emphasizes the product)
(2) A strengthened shaped polyethylene product which consists of materials A and B and
polyethylene (which emphasizes the product)
(3) A method to produce strengthened shaped polyethylene products which is characterized by

10
adding materials A and B to polyethylene (which emphasizes the production process)
After the 1988 reforms, (1), (2), and (3) could be included as separate claims in one patent. Under
the old system, however, the inventor had to choose one claim from the above three to include in the patent
application, since all three claims point to the same invention. If a patent including one of above claims
was granted, subsequent patent applications by the same inventor which contained any of the remaining
claims would be rejected on the grounds of not having met the “one invention, one patent” principle or the
“unity” requirement. Subsequent patent applications by other inventors which contained any of these
remaining claims would be rejected on the grounds of not having met the novelty requirement, as these
overlapping claims point to essentially the same invention. This does not mean, however, that a patent with
one claim protects the intellectual property space covered by the other closely related claims, because
claims are narrowly interpreted under historical Japanese legal practice. If the inventor is granted a patent
which includes (1), then the inventor would not be able to sue someone selling a shaped polyethylene
product for infringement unless he/she could prove that the produce is the result of adding the protected
additive to polyethylene. Similarly, if the inventor chooses to include (2) in a patent filing, then he/she
could only sue a rival firm selling the protected additive for infringement if it can be proven that the
additive will be used only for the production of the strengthened shaped product. Finally, in case the
inventor chose to include (3), he/she would not be able to sue someone selling the additive for infringement
unless he/she could prove that the additive would only be used for the patented method. In practice, these
indirect infringement cases were very difficult to prove in court. The old system illustrated here might
sound very strange to Western readers, but the philosophy behind it is that a claim should briefly and
clearly define an invention, and so a claim (and a patent) can include only the essential features of an
invention.
To sum up, the narrow interpretation of claims for purposes of determining infringement created a
“commons” of intellectual product space around existing patent grants which no patent holder could
effectively appropriate and within which any firm was free to operate. This situation changed with patent

11
reform. Firms were now allowed to use claims “defensively.” In addition to describing independent
innovations, the claims could be used to “fill in” the traditional “commons,” substantially strengthening the
firms’ scope of intellectual property rights.21 It is this sort of effect that the theoretical literature highlights
in models of patent scope. To the extent that this effect was present in the wake of Japanese patent reform,
examining the Japanese case will allow us to get some sense of how firms respond to such an expansion of
patent scope.
Note, however, that this “defensive” use of overlapping claims is a very different use of the
multiclaim system from that outlined in the preceding subsection. Here firms are not using the multiclaim
system to repackage several independent ideas into one patent document so much as they are using
overlapping claims to fill in the “no man’s land” around a single invention. Interview evidence and
quantitative firm-level evidence suggests that firms used the multi-claim system in both ways in different
patents, so that both effects had an actual impact on Japanese firms’ patenting practices.
Managerial implications of patent reform. Interview results of general managers of intellectual
property departments showed interesting differences in the effects of the multi-claim system across firms.
They indicated that the degree of change in firms’ patenting behavior and the utilization of the new multi-
claim system was strongly related to the degree to which patent-related tasks are conducted within the firm,
and to the number of people in a company involved in patent processing. In one electronics company, for
example, over the course of a single year 30 people in the intellectual property department engaged in
producing 20,000 domestic patent applications as well as thousands of overseas patents. However, the
generation of more than 70% of the actual patent documents, both for Japan and overseas filings, was
contracted out to patent agents. For another company, the degree of outsourcing is more than 90%. In
situations such as these, where there is such a profound organizational disconnect between those in the firm
(or outside the firm) dealing directly with the patent system, and those in the firm actually conducting
R&D, it is perhaps not surprising that the “feedback” from changes in the patent system to the conduct of
R&D was muted and slowed. On the other hand, at one consumer electronics company, 70% of the patent

12
application documents are drafted by the corporate R&D personnel actually producing the innovations. In
such a context, the “feedback” from patenting changes to the conduct of R&D is, not surprisingly, much
stronger.
Some companies also admitted that the internal incentive structures worked, in some cases, to
prevent R&D departments from responding to patent law changes. At one large diversified company,
business units shared costs related to patent administration through the intellectual property division of the
company’s headquarters, with the cost allocation determined by the number of patent applications in
previous years. Business units were not allowed to retain any “patent administration cost” savings if they
filed fewer patents than in previous years, which deterred these business units from responding to patent
law changes which were designed to reduce the number of patent filings. On the other hand, in some
companies, the internal reward structure was changed, with greater emphasis placed on maximizing the
number of claims rather than simply the number of patents.
Interviewees suggested that company-specific factors were likely to influence the degree of firm
responsiveness to patent reforms, in addition to the aforementioned organizational factors. The degree of
learning and the utilization of the new patent system in R&D efforts also depended on the efforts of
intellectual property departments. In many companies, commentaries and examples of the multiple-claim
system were documented and circulated among R&D departments, which stimulated the thinking of
engineers concerning how to utilize an invention in multiple ways. In some companies, a series of seminars
were held to communicate the change in the patent system to researchers.
In the cases where the “feedback” from patent changes to R&D conduct was strong, some
corporate R&D managers reported that it had an impact on the manner in which researchers approached
innovation. Some R&D managers in the office equipment industry noted, for example, that R&D personnel
began to look for new/multiple applications of an innovation due to the multi-claim system. However, this
response was far from unanimous. Many respondents claimed that neither the multi-claim system nor the
effective extension of patent rights in the pharmaceutical industry had a significant impact on the nature or

13
level of R&D activity.22
Theorists in this literature typically assume that the “innovating unit,” be it an individual or a firm,
directly confronts and internalizes the incentives in the patent system. Our interviews drove home the
reality that corporate R&D departments are embedded in larger organizations, and the feedback from
changes in the patent system to their activity is anything but automatic. Organizational settings affect how
innovations are turned to patents, and organizational settings vary across firm. We need to keep this reality
in mind not only in interpreting our empirical results, but also in determining the lessons our study has for
the next generation of theoretical models.
5. Theoretical linkage between the 1988 reforms and R&D
The multi-claim system and the theoretical literature on patent scope. In this section, we
establish a link between these institutional changes in Japan and the theoretical literature on patent scope.
This requires that we briefly review this literature. However, due to space constraints, we will necessarily
be selective and incomplete in our review.
In Nordhaus’ original work, and in the famous exchange with Scherer that followed, emphasis was
placed on the optimal length of a patent as a policy variable.23 In this setup with the assumption that patent
protection allows patent recipients to fully command monopoly rents, the optimal length of a patent was
found to be finite. Gilbert and Shapiro (1990) and Klemperer (1990) used more sophisticated modeling
frameworks to consider both the optimal length and breadth of a patent. They found conditions under
which a narrow but infinitely long patent is optimal, thereby demonstrating the importance of patent
breadth, or scope, as an instrument of patent policy. Gilbert and Shapiro (1990) define the scope of patents
as anything which increases the flow rate of the innovator’s profits during the period of protection, whereas
Klemperer (1990) defines it as the area of differentiated product space covered by a patent grant. Much
theoretical work followed, including Gallini (1992) and Matutes et. al. (1996). Gallini (1992) defines the
scope in terms of the cost of imitation, while and Scotchmer and Green (1990) define scope in terms of

14
novelty. Finally, Matutes et. al.’s (1996) definition relates to the leniency of courts (and the patent office)
in granting claims of innovation that are not fully developed.
We contend that the introduction of the “improved” multiple-claim system effectively expanded the
scope of patent protection in Japan along a number of important dimensions stressed in the literature. The
definitions used by Klemperer and Gallini fit especially well with the 1988 reforms, since the multi-claim
system allows firms to include all possible applications and related inventions within a single patent grant.24
Thus the reform certainly increased the differentiated product space covered and the imitation costs.
On the other hand, there were some important dimensions of patent scope along which there was
less strong evidence of change. The literature has also stressed the ex-post legal interpretation of patents in
the courts vis-à-vis subsequent innovation as a dimension of patent scope.25 We have no direct evidence of
any change in this ex-post interpretation of the scope of patent claims by the courts immediately after
reform.26 Anecdotal evidence suggests a gradual turning of Japanese legal practice towards a more “pro-
patent holder” position. Later, we will present circumstantial evidence consistent with this shift.
Furthermore, we believe that the presence of substantial change along some dimensions of patent
scope and the apparent absence of substantial change along other dimensions is actually a useful feature of
the data, as it allows us to separate out the partial effect on incentives for innovation of expansion of patent
scope along some particular dimensions. On the other hand, we must acknowledge that the absence of
expansion along other dimensions limits our conclusions. That is simply the nature of our natural
experiment. Nevertheless, in the absence of any real empirical evidence on the responsiveness of firms to
changes in patent design along any dimension, even a limited natural experiment is welcome.
Model. Having established that the broadening of patent scope in Japan “fits” with the theoretical
treatment of expansion of patent scope along a number of important dimensions, we review the theoretical
relationship between changes in patent scope, or length, and the optimal level of R&D effort. We show
that the first-order impact of an expansion of patent rights, both in scope and in length, on the level of
R&D is positive.

15
The particular framework that we use here borrows heavily from Denicolo (1996), which, in turn,
is based on Lee and Wilde (1980). We consider a race for a patentable innovation between n symmetric
firms. In this model, both the winner and losers of the patent race get positive profits in the post-innovation
equilibrium. The length of the patent is finite, and after the patent has expired, both the winner and losers
get the same positive profits. Each firm chooses its R&D investment to maximize its expected profit. The
R&D technology is “memoryless”, i.e. a flow of expenditure xi yields a probability of discovery h(xi) per
unit of time. Key assumptions in this model are that the equilibrium investment level, x*, the flow of
profits accruing to the winner,πW , and the flow of profits accruing to the non-innovating firms,π L are
functions of the breadth of the patent, which can be denoted as b, and that πW ′(b) > 0 and π L ′(b) ≤ 0. We
also assume a stability condition analogous to Lee and Wilde’s. From these assumptions, we show that,
even in a model of innovative competition among firms where the outcome of innovation is uncertain, an
expansion of patent scope (and length) induces additional innovation. Appendix 1 shows the full
description of the model.
This result, although general to a broad class of models, does not hold in every conceivable
circumstance. Merges and Nelson (1994) discuss behavioral, historical, and technology-specific aspects to
be considered for the evaluation of the effect. We also note that neither the model presented here, nor the
simpler framework on which our empirical work is based consider sequential innovation.27 In this
important, more recent branch of the theoretical literature, the impact of an expansion of patent scope can
have either positive or negative effects on R&D. A narrow patent scope might induce subsequent
innovation because it encourages incremental innovation. On the other hand, a broad patent scope might
induce subsequent innovation because a broad patent scope will force an innovator to disclose more
technical knowledge, which can then be used by subsequent innovators. These conflicting effects are due to
the dual roles played by patents, as instruments of diffusion and exclusion (Ordover, 1991). Even though
theory may yield ambiguous predictions concerning the impact of patent scope, it is critically important for

16
policy makers to know which effects predominate in practice. This is what we seek to estimate.
6. Effects of the 1988 reforms - results at the aggregated level
Results from Japanese patent data at the aggregated level. A number of changes have been
observed after the 1988 reforms at the aggregated level. Figure 2 shows the trend of patent applications in
Japan in the postwar period. A vertical line is drawn in 1987, the end of the pre-reform period in order to
highlight the changes after the 1988 reforms. Figure 2 shows that the growth rate of the number of patent
applications has declined after 1988, though the actual number of patent filings is still increasing. In
general, this pattern holds across technological fields, with applications actually falling in physics,
electricity, and chemistry-related inventions.
---------------------------------------------------------Figures 2 through 4 about here
---------------------------------------------------------
Figure 3 shows the initial response to the introduction of the multi-claim system. This figure
shows the number of claims per patent application by section of the International Patent Classification
(IPC) System.28 This figure illustrates that the number of claims per patent jumped in 1988. The most
dramatic increase is seen in section C (chemistry-related inventions) and section A, which includes
pharmaceuticals. General managers in the intellectual property division of pharmaceutical and chemical
companies expressed that they were quick to adopt the new system, because they already learned how to
utilize the multi-claim system from the more limited multi-claim system introduced in 1976. This feature of
the 1976 revision in the patent law had been heavily utilized in patents of chemical compounds. On the
other hand, the increase in class H (electricity-based inventions, which includes semiconductors and
computers) and class G (physics-based inventions, which includes copiers), was more gradual, suggesting a
learning process firms patenting in these areas had to go through before they could fully utilize the multi-
claim system.
While applications have leveled off or fallen since patent reform, patent grants have followed a

17
very different trend. Recall that one implication of the multi-claim system is that in makes the novelty of an
invention easier to demonstrate, increasing the likelihood that a patent will eventually be granted. If this
effect is real, then we should expect to observe a sharp increase in grants 3-5 years after patent reform
(based on the historical lags between file date and grant date). In fact, patent grants exploded in certain
technology fields such as physics and electricity, almost tripling between 1991 and 1992. Less extreme
increases can be seen in all technology fields. While this increase is consistent with the positive effects
ascribed to patent reform, this is, at best, circumstantial evidence which certainly does not constitute proof
of the story. A number of other institutional changes – notably an increase in the number of patent
examiners and the introduction of the electronic filing and processing system – are likely to have
contributed to these changes.
Figure 4 shows trends in intellectual property lawsuits filed in Japan from 1983 through 1995.
Patent-related lawsuits are only a component of these sums, but one can observe a striking and sharp
upturn in the incidence of lawsuits in the most recent years.29 These are the years in which, based on
historical lags, we would expect to begin observing grants of patents filed under the new system.30 Given
the expense of civil litigation in Japan, we would only expect to see an increase if the plaintiffs believed
that the likelihood of victory (or the size of damage awards) increased. Unfortunately, we have not yet
been able to obtain quantitative data on the outcomes of this kind of civil litigation, but the observed trends
suggest patent reform strengthened the position of incumbent patent holders. This is consistent with the
perceptions of interviewed firms.
Data used in the empirical analysis. Examining the impact of these reforms at the micro level
requires data on patenting, R&D, and other firm characteristics at the firm level. To undertake such
analysis, we constructed an original data set of 307 publicly traded Japanese manufacturing firms, drawn
from various industries. The actual number of firms used in our empirical work varies according to
specification because data on some variables are not available for all firms in all years. Data on firm sales,
capital investment, and industry affiliation are taken from the Japan Development Bank (JDB) Corporate

18
Finance Database. This data set also contains information on firms’ R&D spending, but the reliability of
this series is not high. These data were therefore supplemented with data on firm-level R&D expenditures
drawn from Japanese language primary sources, especially the Toyo Keizai Kaisha Shiki Ho R&D
survey.31 This analysis also requires data on Japanese patenting at the firm level. Regrettably, such data
are difficult to obtain and, relative to our U.S. data, extremely expensive. Despite the assistance of the
staff of JAPIO, which provides the only practical electronic patent database in Japan, and despite their
provision of a generous discount over the rates charged to commercial users, we were only able to obtain
two series of patent data for each of our sample firms. First, we have information on the total patent
applications in each of our sample years, from 1980 to 1994.32 Second, we have a random sample of
patent applications taken out up to 300 applications in each year, which includes information on the
number of claims each application contained as well as the IPC codes in each patent. Based on that
random sample, we can estimate changes in patent quality for the entire stream of the firms’ patents.
Ironically, our data on the U.S. patenting of our Japanese firms are much more complete than our
Japanese patent data. Initially, we obtained data on U.S. patenting, including complete information on the
number of patent classes assigned to each patent, from the CASSIS CD-ROM disk published by the U.S.
PTO. These data were matched with the REI patent database in order to obtain information on the number
of claims and ex-post citations for each of these patents.33
Finally, as a proxy for investment opportunity, we calculated “average Q” for each firm-year in
our data set. This calculation was undertaken along the lines of Hoshi and Kashyap (1990).34 Further
details on data construction are available from the authors on request.
7. Effects of the 1988 reforms on R&D
Empirical framework. Our first empirical examination is to test if the expansion of patent scope
in January 1988 was followed by an increase in the level of R&D investment. While the modeling
framework alluded to in section 5 (and fully presented in Appendix 1) captures a number of interesting

19
features of reality, the available data are such that it is difficult to directly test such a model. Furthermore,
the theoretical results achieved in that framework are generated at the cost of some untenable assumptions:
in the real world, firms are not symmetric, profits from particular innovations are not observed nor do we
observe the actual outcomes of individual patent races. So, in motivating our empirical work, we utilize the
following necessarily simpler framework, which borrows from Cornelli and Schankerman (forthcoming).
Let the profits obtained from an innovation be described by
∫ =−T
iT Vdterqw0
),,,( θπ (1)
where T is the length of patent protection, which we presume for the moment to be fixed across all firms
and years.35 The profit function, π , gives the period by period flow of profits from innovation. It is
assumed to be concave and monotonically increasing in four important parameters. The first, w, represents
the scope (“width”) of patent protection, which will be common to all firms but vary over time. The next
parameter, q, represents expectations of future demand and other “macroeconomic” conditions which effect
the future profit streams generated by current investment. θ represents the research productivity of a firm
– the “quality” of its research team. This varies across firms, but is assumed to be constant within firms
over time. Finally, the profit function is increasing in r, the level of R&D effort, as higher levels of R&D
investment lead to “better” (more privately – and socially – profitable) innovations.
The firm sets R&D to maximize profits, earning a profit net of research costs of
∫ −−T
iT rdterqw
0
2
2),,,( θπ (2)
We assume quadratic costs of adjustment in R&D here, but we contend that our qualitative results would
carry over for any non-concave cost function. Integration over T allows us to rewrite the problem as
Maxr 2
)1)(,,,(1 2r
erqwi
iT −− −θπ (3)
The firm’s first order condition is

20
riTe
ir π)1(
1 −−= (4)
Because π is assumed to be concave, the second order conditions are satisfied, and by the implicit function
theorem there exists a function φ such that
),,,(* Tqwr θφ= (5)
where 0,0,0,0 >>>> Tqw φφφφ θ . For the purposes of our empirical analysis, we take a log-linear
first order approximation of this φ function. Our estimating equation thus becomes:
∑ +++++=c
iticcittit Dqwr εθδβββ 210 (6)
Here r is the natural log of R&D spending by firm i in year t, w is an indicator variable taking on a value of
0 in the pre-reform years and a value of 1 thereafter, q is a measure of firm-level “average Q”, and θ is a
measure of firm-level research productivity. We add industry dummy variables, D, to control for
differences in levels of R&D spending across industries (possibly due to differences in technological
opportunity). Although firm-level research productivity is not observed, we can deal with it
econometrically by using fixed-effects models and random effects models, depending on what assumptions
we wish to make about the correlation of this unobserved productivity with our other independent variables.
Macro disturbances. In essence, our identification comes from common shifts in a time trend.
Unfortunately, there are at least four other “macro” shocks, all more or less contemporaneous with patent
reform, which could also have had an impact on firms’ R&D effort. The first is the now infamous bubble
economy. Starting in 1986-87, the Japanese central bank adopted a fairly loose monetary policy. To the
extent that Japanese firms were credit-constrained prior to the onset of the bubble economy, the bubble
years could have generated a liquidity-induced increase in R&D spending that had nothing to do with patent
reform. The second is yen appreciation. From 1985 through 1987, the yen appreciated substantially
relative to the dollar. Faced with an increase in foreign competition, many Japanese firms sought to defend
their global market share through quality-upgrading. To the extent that this was a common reaction, one

21
may conclude that “competitive necessity” rather than patent reform, was the mother of any observed
increase in Japanese invention. Third, one could argue that “technological opportunity” expanded for
Japanese firms in the late 1980s, and that increases in R&D were driven by this exogenous increase in
R&D productivity rather than any increase in the ability of firms to appropriate the returns from that R&D
through stronger patents. Finally, increasing international “technological competition” between U.S. and
Japanese firms might have prompted additional innovation and patenting.36 Over the course of the 1980s,
many U.S. firms sought to defend themselves from effective Japanese rivals by suing them for patent
infringement in U.S. courts. It is argued that a few well-publicized victories by U.S. incumbent firms
prompted Japanese firms to begin “ramping up” their patent portfolios.
Untangling all of these effects is quite difficult given the available data. However, one avenue open
to us is to exploit the variation in the cross-section dimension of our data. Our data set includes a number
of large, R&D-intensive firms in technologically progressive industries which held sizable patent portfolios
prior to patent reform. Ex ante, we would expect these firms to benefit disproportionately from reform,
and hence modify their behavior. Likewise, we can identify subgroups of firms which are more likely to be
affected by liquidity constraints, currency appreciations, and other potential confounding effects. By
comparing changes within firms over time in R&D and patenting across these groups, we can get some
sense of the extent to which observed changes in innovative activity can reasonably be ascribed to patent
reform. Alternatively, we can insert control variables which allow us to more precisely identify the impact
of patent reform.
In our initial regressions, we do not attempt to completely eliminate the effects of these other
“macro” shocks. Therefore, we interpret our initial results as representing an “upper bound” of the real
R&D response to patent reform. The expansion of patent rights is represented by a dummy variable,
reform, equal to one from 1987 (on the presumption that firms might have begun to alter their behavior
even before the law officially went into force). In addition to this dummy variable, we include a general
time trend in order to avoid falsely attributing any general tendency for Japanese firms to increase R&D
22
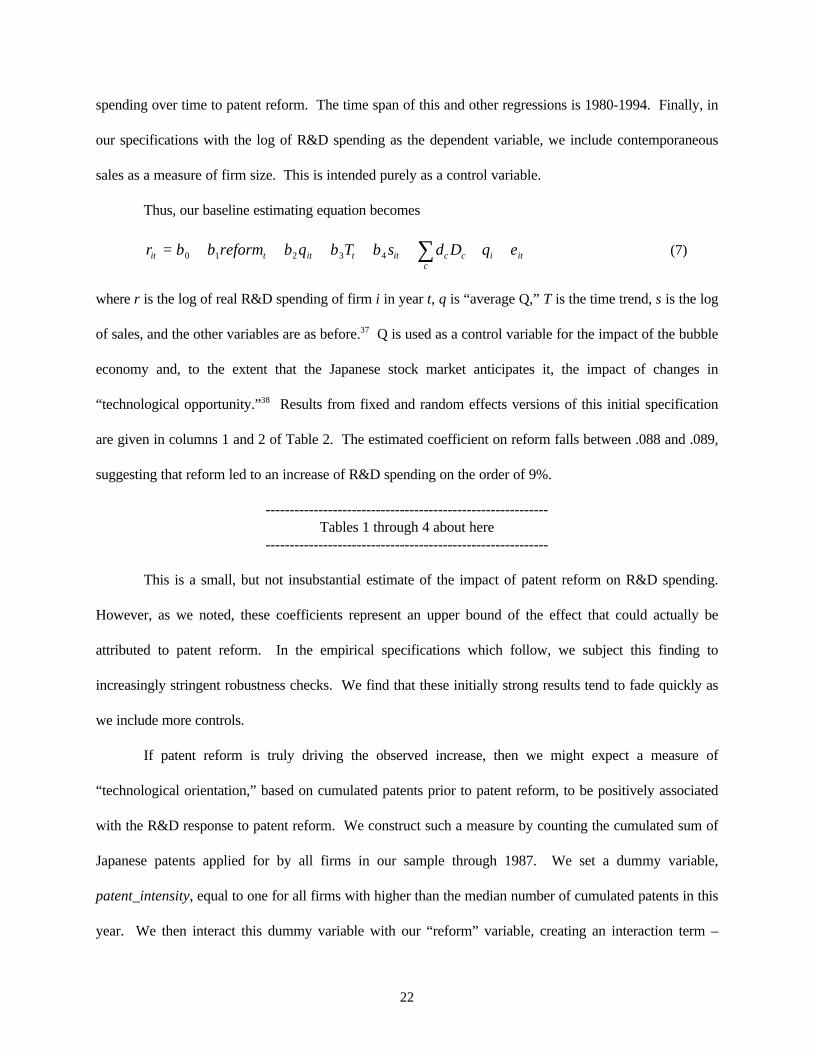
spending over time to patent reform. The time span of this and other regressions is 1980-1994. Finally, in
our specifications with the log of R&D spending as the dependent variable, we include contemporaneous
sales as a measure of firm size. This is intended purely as a control variable.
Thus, our baseline estimating equation becomes
r reform q T s Dit t it t it c cc
i it= + + + + + + +∑β β β β β δ θ ε0 1 2 3 4 (7)
where r is the log of real R&D spending of firm i in year t, q is “average Q,” T is the time trend, s is the log
of sales, and the other variables are as before.37 Q is used as a control variable for the impact of the bubble
economy and, to the extent that the Japanese stock market anticipates it, the impact of changes in
“technological opportunity.”38 Results from fixed and random effects versions of this initial specification
are given in columns 1 and 2 of Table 2. The estimated coefficient on reform falls between .088 and .089,
suggesting that reform led to an increase of R&D spending on the order of 9%.
-----------------------------------------------------------Tables 1 through 4 about here
-----------------------------------------------------------
This is a small, but not insubstantial estimate of the impact of patent reform on R&D spending.
However, as we noted, these coefficients represent an upper bound of the effect that could actually be
attributed to patent reform. In the empirical specifications which follow, we subject this finding to
increasingly stringent robustness checks. We find that these initially strong results tend to fade quickly as
we include more controls.
If patent reform is truly driving the observed increase, then we might expect a measure of
“technological orientation,” based on cumulated patents prior to patent reform, to be positively associated
with the R&D response to patent reform. We construct such a measure by counting the cumulated sum of
Japanese patents applied for by all firms in our sample through 1987. We set a dummy variable,
patent_intensity, equal to one for all firms with higher than the median number of cumulated patents in this
year. We then interact this dummy variable with our “reform” variable, creating an interaction term –

23
patent_intensity*reform – which is introduced into columns 4 and 5 of Table 3. Our empirical
specification thus becomes
itic
cctiittittit Dreformensitypatent_intsTqreformr εθδββββββ ++++++++= ∑*543210 (8)
If the post-patent reform increase in R&D spending was driven primarily by the efforts of firms to
respond to changes in appropriability conditions, then we might expect this increase to be
disproprotionately higher for more technologically sophisticated firms. Such a disproportionate effect
would be indicated by a positive, statistically significant 5β coefficient. As the reader can see from
columns 3 and 4 of Table 2, this measure is negatively correlated with the R&D response to patent reform
in the random effects and fixed effects specifications, calling into question the view that the coefficient on
the reform variable in the first two columns is really driven by patent reform.
We also tested the robustness of our initial results by altering the assumed “date” of reform. If one
pushes back the date of patent reform by a single year (for instance, if one sets reform=1 in years on or
after 1988) the positive “level shift” effect identified in the initial specifications turns negative and loses
significance. We also observe a negative effect (albeit statistically insignificant) if we set the reform=1 in
years on or after 1990. We can see this clearly in the first two columns of Table 3. On the other hand,
dating the reform from earlier years (such as 1985) produces a positive, significant estimate in most
specifications, as is illustrated in column 3 of Table 3. This was long before the firms in our sample could
have reasonably anticipated patent reform. This sensitivity of our results casts doubt on the view that the
observed upturn in R&D spending is really driven by a one-time response to the implementation of patent
reform in 1988.
Exploitation of our industry cross-section did not produce results favorable to the view that patent
reform is driving a large component of the observed increase in R&D. We collapsed our set of industry
dummy variables down to eight and interacted them with the reform dummy variables in column 4 of Table
3. The coefficients of these interaction terms and the standard errors are given in that column.39 The

24
electronics/precision instruments industry cluster comes up consistently negative in all specifications, as
does the “chemicals” cluster. This is troubling, given that these clusters are among the most patent and
R&D intensive in Japan.40 As a further variation on this theme, we tried estimating versions of equation (7)
for only the electronics industry and only the pharmaceuticals industry. The results of the “reform” dummy
were typically insignificant or negative.41
As a final alternative approach, we included as a right hand side variable the average number of
claims per patent per firm-year (average_claim).42 After all, if the expectation of being able to exploit the
patent reforms ex ante is driving up R&D spending, then one should expect to see a positive relationship
between R&D increases and actual exploitation of the multi-claim patent system ex post. Thus, we could
adopt the following specification:
r reform q T s average claim Dit t it t it it c cc
i it= + + + + + + + +∑β β β β β β δ θ ε0 1 2 3 4 5 _ (9)
Unfortunately, there is no evidence of this kind of relationship.43 Average_claim is consistently negative in
random effects and fixed effects specifications, as is illustrated in Table 4. This casts further doubt on the
view that it is really patent reform that is responsible for the observed increase in R&D spending.
The best conclusion that can be drawn from this set of results is that there was a broadly observed
increase in R&D spending in the 1980s which overlapped in time with the onset of patent reform in Japan.
However, much of this increase actually predated the onset of patent reform and robustness checks suggest
that relatively little, if any, of the upturn can be reasonably ascribed to the change in Japan’s patent regime.
8. Effects of the 1988 reforms on patenting at the micro level in Japan and the U.S.
An increase in R&D effort of any magnitude is only socially beneficial to the extent that it results
in increased innovation. We therefore want to test whether or not the innovative output of Japanese firms
increased after patent reform. Given the previous results, of course, we will have to be cautious in
attributing any observed increase to the effects of patent reform. The standard approach taken in the
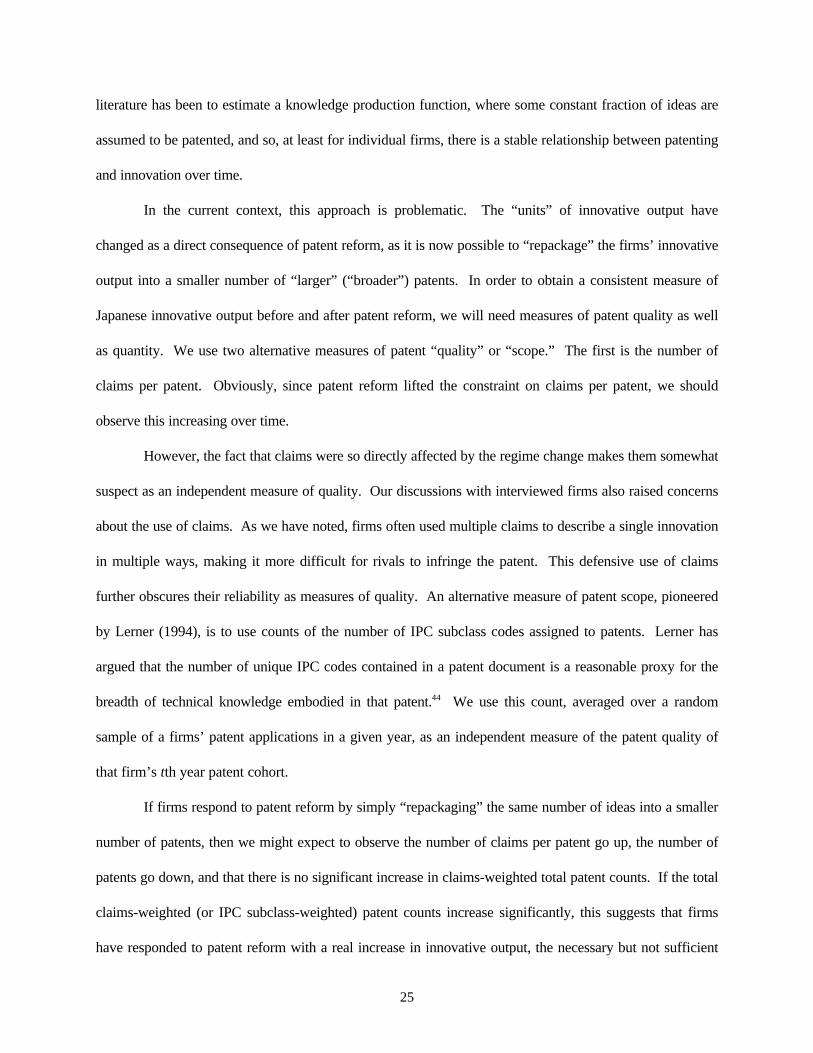
25
literature has been to estimate a knowledge production function, where some constant fraction of ideas are
assumed to be patented, and so, at least for individual firms, there is a stable relationship between patenting
and innovation over time.
In the current context, this approach is problematic. The “units” of innovative output have
changed as a direct consequence of patent reform, as it is now possible to “repackage” the firms’ innovative
output into a smaller number of “larger” (“broader”) patents. In order to obtain a consistent measure of
Japanese innovative output before and after patent reform, we will need measures of patent quality as well
as quantity. We use two alternative measures of patent “quality” or “scope.” The first is the number of
claims per patent. Obviously, since patent reform lifted the constraint on claims per patent, we should
observe this increasing over time.
However, the fact that claims were so directly affected by the regime change makes them somewhat
suspect as an independent measure of quality. Our discussions with interviewed firms also raised concerns
about the use of claims. As we have noted, firms often used multiple claims to describe a single innovation
in multiple ways, making it more difficult for rivals to infringe the patent. This defensive use of claims
further obscures their reliability as measures of quality. An alternative measure of patent scope, pioneered
by Lerner (1994), is to use counts of the number of IPC subclass codes assigned to patents. Lerner has
argued that the number of unique IPC codes contained in a patent document is a reasonable proxy for the
breadth of technical knowledge embodied in that patent.44 We use this count, averaged over a random
sample of a firms’ patent applications in a given year, as an independent measure of the patent quality of
that firm’s tth year patent cohort.
If firms respond to patent reform by simply “repackaging” the same number of ideas into a smaller
number of patents, then we might expect to observe the number of claims per patent go up, the number of
patents go down, and that there is no significant increase in claims-weighted total patent counts. If the total
claims-weighted (or IPC subclass-weighted) patent counts increase significantly, this suggests that firms
have responded to patent reform with a real increase in innovative output, the necessary but not sufficient

26
condition for broader patent rights to be in the public interest.
With only Japanese patents as an index of innovative output, it still might be difficult to distinguish
between a real increase in innovative output, and a “cosmetic” increase which represents only firms’
rational responses to changes in the patent system. Fortunately, for many of the firms in our sample, we
also observe their patenting in the U.S., both prior to and after patent reform. As we have already noted,
there were no major reforms in the U.S. patent system at the time of Japanese patent reform, and so there is
no incentive for Japanese firms to change their U.S. patenting. However, if Japanese patent reform did
indeed induce greater innovation, then some of this might “spill over” into higher levels of U.S. patenting.
We will thus examine U.S. patenting, both quantity of grants and the quality of patent cohorts.
The basic empirical specification will be as follows:
∑ ++++++=c
iticctititit DTlog(R&D)refomp εθδββββ 3210 (10)
where p will be a measure of patent quantity or quality, depending on the specification, for firm i in year t,
reform is our reform dummy variable, log(R&D) is the log of real R&D spending, and T is the time trend.45
A positive, significant coefficient on reform gives us statistical evidence of an increase in innovative output.
θ represents the firm-effect, which we interpret as the research quality of the firm. Again, we include a
full set of industry dummy variables or, in some specifications, fixed effects.46 We also include “Q” and
the log of real sales as additional controls in some specifications.
----------------------------------------------------------Tables 5 through 8 about here
----------------------------------------------------------
Evidence from Japanese patenting. Our first patent results come from regressions using the log
of annual counts of Japanese patent applications per firm per year, where the dates are years of
application.47 We run fixed and random effects models of equation (10). Results are presented in Table 5.
We find no statistically significant evidence of a positive “level shift” in the patent data. In fact, the
coefficients are negative, although very imprecisely estimated.48 Both specifications are consistent with the

27
view that, after reforms, Japanese firms’ patent applications continued to increase, but at a decreasing
rate. In fact, we estimated pre-reform and post-reform time trends separately. A Chow test confirmed the
presence of a statistically significant negative trend break in the data.
Though total patent applications failed to increase at the pre-reform rate, total innovative output
could have increased substantially if the firms’ patent applications contain more ideas. We present two
measures of patent scope. The first measure is the number of claims per patent. The second measure is the
number of IPC subclasses per patent. Results on claims per patent are presented in Table 6. In these
regressions, the cross-section dimension is limited to the subset of firms for which we have claims and class
count data. The time series dimension is limited to the years 1983-1994. Using our random sample of
Japanese patents per firm, we can actually count the number of claims in these patents. We use this to
generate an average number of claims per firm per year, which is the dependent variable in the first two
columns of Table 6. In both random and fixed effects specifications, there is a positive, significant level
shift in the number of claims per patent at the time of patent reform. In fact, if one weights total patent
application counts by the increase in claims per patent, one finds statistically significant evidence of a
substantial post-reform increase in “claims-adjusted” total patenting, as is shown in column 3 of Table 6.
On the other hand, there is no evidence that post-reform Japanese patent cohorts contained a larger
number of IPC subclasses. Results confirming this are presented in columns 4 and 5 of Table 6. This
holds true regardless of whether one looks at fixed effects or random effects results. It also holds
regardless of whether one uses average numbers of classes per patent or total class-weighted patent output
as the dependent variable. The absence of any positive shift in this alternative measure of quality suggests
that our concerns about claims have some empirical basis. “Claims-adjusted” total patenting may
substantially inflate the real increase in innovative output of Japanese firms.
This examination of Japanese patenting at the firm level also provides some insight into how firms
have exploited the multi-claim system. The discussion in section 4 noted that claims could be used to
“repackage” multiple independent innovations into a single patent document, thereby achieving costs

28
savings. Alternatively, overlapping claims could be used “defensively” to more fully appropriate the
intellectual product space around a given invention. A careful look at firm-level R&D series and patent
application counts shows that R&D spending levels have continued to rise while patent application counts
have remained stable or fallen. The lack of evidence of a decline in innovative effort suggests that firms
are, to some extent, “repackaging” ideas into smaller numbers of patent applications, thereby enjoying
some of the potential cost savings. On the other hand, the very different indications that we get from our
two alternative measures of Japanese patent quality suggest that many of the claims being inserted in
Japanese patent applications are not “independent” ideas, but rather, “overlapping” claims of a defensive
nature. Thus, firms seem to be exploiting the potential gains of the new multi-claim system along both
potential dimensions.
Evidence from patenting in the U.S. We go through a similar set of regressions with our data on
the U.S. patenting of Japanese firms. In the first two columns of Table 7, we present fixed effects and
random effects results with the log of total counts of patent grants in the U.S., dated by year of application,
as our dependent variable. We find in both cases a significant “level shift” -- there is an increase in U.S.
patenting after reforms. The size of the coefficients are quite substantial, they suggest that reform was
associated with 40% higher levels of patenting in the U.S. Given the relatively modest to nil increases in
R&D spending that could be plausibly attributed to patent reform, it seems implausible to think that this
increase could be attributed entirely to the effects of patent reform. Robustness checks similar to those
conducted in Tables 3 and 4 confirmed this skepticism. It was indeed the more “patent-oriented” firms that
were increasing their patenting in the U.S. during this period.49 However, attempts to “re-date” reform to,
for instance, 1985, also produced statistically significant coefficients of approximately the same
magnitude.50 The results of the “redating” experiment are shown in columns 3 and 4 of Table 7. These
results suggest that the increased propensity to patent in the U.S. was probably driven by factors other than
patent reform.51
Moreover, we find little evidence that the scope of Japanese patenting in the U.S. has significantly

29
changed. Columns 1 and 2 in Table 8 provide evidence on changes in the number of claims per patent.
These columns present results using actual averages of claims per patent per firm per year. There is no
significant evidence of an increase in claims per U.S. patent, regardless of whether one uses fixed or
random effects. In fact, the estimated coefficient is negative in both cases, albeit statistically
indistinguishable from zero.
Columns 3 and 4 in Table 8 present further evidence on changes in the scope of U.S. patents. We
were unable to obtain information on the IPC codes assigned to these patents. We were instead forced to
count the number of U.S. patent subclasses assigned by the U.S. PTO. For reasons discussed at length in
Lerner (1994), this count of classes is much less satisfactory than counts of IPC codes. Nevertheless, we
utilize it, with the understanding that there is more “noise” in these counts, and that any inference based on
these results must remain tentative. We find no statistically significant evidence of an increase in the
number of U.S. patent subclasses per patent, regardless of whether one looks at fixed or random effects
estimates.
One test of patent quality in the U.S. remains to be conducted. If Japanese post-reform patents are
relatively more “idea-rich,” then one might expect them to be more heavily cited by subsequent patents,
controlling for the time lag between grant of the cited patent and the lag of the citing patent.52 To measure
this empirically, we use the “citations function” approach pioneered by Caballero and Jaffe (1993). This
approach is described fully in Appendix 2. Results from this specification are given in Table 9. The
coefficients for the years 1977-1993 measure the relative “citedness” of the patent cohorts filed in those
years. To make these results a bit easier to understand, these coefficients are graphed in Figure 5.
----------------------------------------------------------Table 9 and Figure 5 about here
----------------------------------------------------------
To sum up the results, there is no evident increase in the “citedness” of post-reform patent cohorts.
If anything, the post-reform cohorts seem to be less idea-rich than the pre-reform patent cohorts. More
research would be required to determine the extent to which “citedness” has really declined, but we can at

30
least say that there is no evidence from patent citations of a post-1988 increase in the “quality” of the U.S.
patent grants of Japanese firms.
9. Conclusion
Does an expansion of patent scope induce additional innovative effort? How responsive are firms
to changes in patent design? Answers to these questions are vital in assessing the relevance of the vast
theoretical literature on patent design and the appropriateness of current trends in intellectual property
rights policy. This paper takes a first step towards providing answers to these questions by examining the
response of a large cross-section of Japanese firms to the 1988 patent reforms.
Interviews with firm practitioners revealed that firms recognized the change in the patent law, and
that many perceived the reform to have “expanded patent scope” in the sense in which theorists have used
this phrase. However, the firms we interviewed perceived their own response to the new law to have been
relatively modest, with some interesting exceptions. In addition to providing us with some qualitative sense
of firms’ responses to the reform, our interviews also drove home the fundamental reality of the substantial
heterogeneity in firms’ responses to changes in patent systems and the role that organization of the firms’
patent operations and its linkage (or lack thereof) to the R&D department seems to play in explaining this
heterogeneity. Exploring the implications of different organizational structures for the impact of patent
reform on firm behavior would seem to be a potentially fruitful area for future theoretical research and
managerial analysis.
Turning from findings in our small, possibly nonrepresentative sample of interviewed firms to our
findings from a fairly large firm level data set, we find statistical evidence of an increase in R&D spending
by Japanese firms that roughly coincided with the onset of patent reform. However, attempts to identify
what component of this increase is actually attributable to patent reform suggest that the real partial effect
of patent scope expansion on R&D spending is close to or equal to zero.
Turning to evidence on innovative output, our results are a bit more mixed. We do find evidence of

31
an increase in innovative output according to some of our measures. However, we cannot attribute the full
amount of this increase to patent reform any more than we can attribute the full observed increase in firms’
R&D spending in the late 1980s to patent reform. In Japan, where the “units of innovative output”
changed as a direct consequence of patent reform, we find a decrease in the rate of growth of patent
applications, but post-reform cohorts are more “idea-rich” as measured by claims per patent. On the other
hand, there is no evidence whatsoever of an increase in patent quality as measured by the number of IPC
subclasses per application. Data on our sample firms’ U.S. patent grants provide some support for the
conclusion that patenting in the U.S. increased over a period of time which overlapped with patent reform.
However, this increase in U.S. patenting evidently pre-dated patent reform by several years, and was
therefore likely driven by other factors. There is no evidence whatsoever of any increase in the quality of
post-reform U.S. patents, regardless of the measure used.53
Japan’s patent reforms provide us with a “natural experiment” in patent policy – an expansion of
patent scope which took place in an advanced, industrial economy, precisely the sort of economic context in
which we might expect such a change to have measurable effects. Nevertheless, the evidence in this paper
suggest that Japanese firms have been rather unresponsive to the change in patent regime.
There are two alternative explanations of our findings. One is that firms are responding, but our
data do not capture it. We view this as unlikely, given that our data set provides such a rich description of
firm innovative inputs and outputs. Our data set covers a fairly large cross-section of firms across a wide
range of industries and, the firms and industries most likely to benefit from a strengthening of patent rights
are well represented in our data. The other alternative hypothesis is that the 1988 patent reform was
actually a very minor change which did not, in fact, significantly change patent scope. As we have already
noted at length, this is not consistent with the perceptions of those public and corporate officials who deal
with the patent system for a living. Nor does it seem to be consistent with recent trends in intellectual
property rights litigation and patent grants, both of which corroborate the opinions of our interviewees.
Obviously, it would be premature to generalize from our findings to all nations or all possible

32
patent reforms. In fact, more empirical work on this particular policy experiment in Japan will be
necessary before coming to any final conclusions concerning its effects, and we hope that this paper will
stimulate additional empirical work in this area. Nevertheless, if correct, our findings may have important
implications for the theoretical literature on patent design and for public policies affecting the scope of
patent rights. For if stronger patents do not, in fact, effectively induce more innovation, then some of these
theoretical models and the “pro-patent” public policies based on them will need to be reexamined.

33
Footnotes
1 Jeffrey Kushan, who was involved in these negotiations, claims that the U.S. negotiating team never made thisargument. Rather, he claims that the U.S. position was quite straightforward: the U.S. wanted to increase theincomes of incumbent U.S. patent holders (and therefore U.S. national income) through stronger globalenforcement of patent rights. However, others have defended the U.S. position using the argument given above.See Cockburn and Lanjouw (1998).2 There is some work on the value of patent protection derived from surveys of firms. For a recent example of workin this tradition, see Cohen, Nelson, and Walsh (1996). More recently, econometric studies have attempted toquantify the private value of patent protection using patent renewal data. For a recent example of this kind ofstudy, see Schankerman (1998). However, there has been no empirical work, to our knowledge, which tests firms’responses to the significant strengthening of a pre-existing patent regime.3 To some extent, this reform represents the first and to date most substantial diplomatic success of the U.S. inimposing stronger patent rights on a major trading partner. The incorporation of the TRIPs agreement into GATTand the successful use of trade sanctions against Brazil to force it to reform its intellectual property rights regimeare also important diplomatic successes. See Cockburn and Lanjouw (1998).4 This could be important. The Uruguay round of the GATT negotiations required some signatory states to grantpatents to pharmaceutical innovations where previously none had existed. Put simply, the absence in thesecountries of a thriving R&D intensive pharmaceutical industry to exploit this legal change might make empiricalanalysis of its effects problematic. Such was not the case with the Japanese reforms.5 Two other important differences include the practice of pre-grant disclosure and pre-grant opposition. Theformer practice has been discussed at length in the literature – see Ordover (1991). It was not affected by patentreform. The pre-grant opposition system was changed to the post-grant opposition system in 1996.6 “Fusion Systems Corporation in Japan (A)”, Harvard Business School, 9-390-021.7 In addition, the U.S. system adopts the doctrine of equivalents which states that a product serving the samefunction as another may infringe its patent. This doctrine had not been explicitly adopted in Japan until theSupreme Court of Japan’s ruling on February 24, 1998 on Tsubakimoto Seiko Co. Ltd. vs. THK K.K. (Case No.1994 (o) 1083).8 Another major difference between the U.S. and Japanese patent systems is the existence of a “second tier”intellectual property rights system – the utility model system. When the Japanese patent system was enacted in1876, the domestic technological level was quite low. To nurture national technological development, Japanesepolicy makers deemed it necessary to set up a system that protected “minor” inventions which did not fit the patentsystem. The Japanese Utility Model Law was therefore established in 1896, modeled after the Utility Model Lawin Germany. For more details, please consult a longer version of the paper available from the authors.9 There were other changes to the Japanese patent system after 1988 which we regard as relatively minor. Changesinclude the application of the priority-claim system under the Paris Convention to domestic filing, theestablishment of the new utility model system, the introduction of the electronic filing, and patent related feeincreases. A complete discussion of these changes is given in a longer version of this paper, available from theauthors.10 Many readers of this popular case study conclude that Mitsubishi Electric did nothing illegal or unfair – itmerely exploited a serious mistake made by a competitor unfamiliar with the Japanese patent system. Perhaps notsurprisingly, the CEO of Fusion Systems did not see things this way.11 Under the Japanese patent system, patent examination is not automatic; an applicant can request theexamination within 7 years from the filing date.12 This request is dubbed “AP80”.13 The ideas in this section owe much to discussions with Mark Schankerman and Nancy Gallini, and we thankthem for their detailed comments.14 Other tools of appropriation include secrecy, “lead time,” complementary manufacturing, complementaryservice, and “other legal means.”15 Further evidence of the weight Japanese firms place on patents is provided in a very different context inSchankerman (1998). In his study of patent renewals in France, Schankerman finds that Japanese patent holdershave a much higher propensity to renew their patent grants than grantees of any other nationality, controlling for

34
effects due to technological field. His data examine patents filed from the late 1960s through the early 1980s,suggesting the high degree of “patent consciousness” documented in the survey research of Cohen et. al. was afeature of Japanese firms before patent reform.16 Hugh Patrick has suggested to us that obtaining these cost savings was a primary goal of U.S. trade negotiators.17 Under the very limited multi-claim systen before the reforms, the average number of claims per patent in 1987was 1.21, and so this is not an unrealistic assumption.18 We thank Mark Schankerman for suggesting this calculation. This illustration is not quite accurate, as we areusing the patent fee schedule from a post reform year to compare the costs of pre-reform and post-reform patentapplications. Nevertheless, our basic message here is that the potential costs savings alone could be quite large.As we argue later, however, the expansion of patent scope through this reform was likely to have had even greaterimpact than cost savings.19 As mentioned, our data indicate that claims per patent went from approximately 1 to approximately 4 by 1993.In principle, a firm could achieve the same level of protection with 10,000 patent applications (each with roughly 4claims) that would have required 40,000 applications under the old system of one claim per patent. Assuming thatfiling and examination fees are incurred for all patents, total expenditures would be 1.161 billion yen under thenew system, 4.320 billion yen under the old system. Let us further assume that agent fees are incurred on 70percent of the patent applications. This raises the total costs to approximately 5.39 billion yen under the newsystem, and a whopping 21.2 billion yen under the old system. Finally, let us assume that firms choose to paymaintenance fees on only twenty percent of their patents (this figure reflects the percentage of patent applicationsactually granted.) This incurs an additional cost of 3.660 billion yen under the new system and 11.5 billion yenunder the old system. The total patent lifetime cost of one year’s 10,000 patent applications thus comes to 9.05billion yen under the new system, 32.7 billion yen under the old. The total cost savings of 23.6 billion yen is equalto $197 million. This sum, for instance, is equal to about 9% of Toshiba’s annual R&D budget in 1993.20 Recent trends in patent grants are consistent with this view.21 One could expect that, with this “filling up” of the traditionally wide “buffer zone” between patents, provableinfringement would become more frequent and intellectual property litigation would increase. We presentevidence of a substantial increase in such litigation in Figure 4.22 In fact, there is substantial econometric evidence suggesting that the “adjustment costs” associated with R&Dspending are orders of magnitude higher than those associated with physical capital investment (see Himmelbergand Petersen, 1994), which could help explain the muted adjustment to patent reform. Most R&D spendingconsists of the salaries of highly specialized research personnel. Building up a strong corporate research team isquite time-consuming, even in the U.S. where the labor markets for such workers are relatively liquid. In Japan,where the lifetime employment system and the relative absence of mid-career hiring places even strongerconstraints on the short-run supply of research personnel, these adjustment costs are likely to be higher.23 See Nordhaus (1972) and Scherer (1972). However, Nordhaus explicitly recognized the importance of patentbreadth, and even gave a parametric representation of it in Nordhaus (1972). He also anticipated the result thatnarrower patents of longer length could provide the same protection as his “perfectly broad” finitely lived patents.24 As we have already noted, the new system provided a higher degree of intellectual property protection than wasavailable under the old system at any price.25 This is a particularly important dimension of scope in the U.S., because the U.S. Patent and Trademark Officetends to grant patents more or less automatically if a standard of novelty is met. Often, the actual scope of a patentgrant vis-à-vis other overlapping grants is ultimately decided through litigation in the court system after the patentis granted. In contrast, through 1995, the Japanese Patent Office allowed firms to register their opposition to apatent application before that patent was granted, and it used evidence submitted by these firms in decidingwhether or not a given patent should be granted. Over the period covered by our data, patent disputes which wouldhave been settled through post-grant litigation in the U.S. were handled within the Japanese Patent Office throughthe pre-grant opposition process. Thus, this “legal” dimension of patent scope may have been less important inJapan.26 The most notable expansion of the ex-post interpretation of the scope of patent claims by the court was theexplicit adoption of the doctrine of equivalents by the Supreme Court of Japan in 1998, ten years after patentreform.27 For theoretical examinations of the effect of patent protection on sequential innovation, see Green and

35
Scotchmer (1995), Chang (1995), Scotchmer (1996) and Cadot and Lippman (1995).28 One might argue that the number of claims per patent application might be different from the number of claimsper patent granted, but interview results suggests that managers in intellectual property departments do not observemuch difference between these two.29 We have not yet been able to obtain quantitative data which breaks down filed lawsuits by the kind of intellectualproperty dispute.30 The reader will recall that rivals can only be sued for infringement after a patent has already been granted.31 Though these R&D data are the best publicly available, there are a number of firm-years in which survey datafrom Kaisha Shiki Ho are not available.32 It is important to note that our inference on Japanese patenting is based on data on Japanese patent applications,not Japanese patent grants. In contrast, our data on the U.S. patenting of Japanese firms is based on their patentgrants, though these grants have been “re-dated” by date of application. This is primarily due to data availability,as the U.S. PTO does not keep data on unsuccessful applications whereas JAPIO’s data on patent grants is muchmore limited than its data on applications. One fortunate consequence of working with Japanese applications datais that we are not constrained by the historically long and variable lags between application date and grant date inthe Japanese system.33 The REI data base is further described in Jaffe and Trajtenberg (1997).34 We note that the Q-ratio used in this paper is not tax-adjusted. Because of the measurement error induced bythis computational shortcut, we do not view the coefficient on the Q variable as a structural parameter of interest.Hoshi and Kashyap (1990) noted, however, that both tax-unadjusted and tax-adjusted Q ratios follow the sametrend.35 For simplicity, this formulation is made in terms of a single innovation, but we interpret this as the discountedvalue of profits from the multiple innovations created by a firm’s research program over the course of a given year.36 We thank Wesley Cohen for bringing this point to our attention.37 We also estimated versions of (7) with an R&D/Sales ratio on the left hand side, obtaining qualitatively similarresults to those reported here.38 Of course, to the extent that the Japanese stock market drove up the prices of Japanese stocks in response toanticipated profits from stronger patent rights, the Q variable might actually absorb some of the impact of patentreform on R&D spending.39 This specification, equation (8), and equation (9) were re-run with a full set of time dummies to control formacroeconomic shocks and other time effects. We obtained results that are qualitatively very similar to thosepresented here.40 Electronics is also one of the most export-intensive industries along with the machinery industry and thetransportation equipment industry. This and other specifications seemed to indicate that yen appreciation was notan important factor in motivating the observed increase in R&D spending.41 These results suggest that any positive response of pharmaceuticals firms to the extension of patent length wassmall to nonexistent. One institutional factor which might explain this is the national health care system in Japan.The pricing policies for pharmaceuticals under this system tend to prevent Japanese drug companies fromappropriating the full value of their patented innovations.42 We thank Marvin Lieberman for suggesting this specification.43 We also experimented with versions of (9) in which R&D spending in year t was regressed on measures of the“average_claim” variable taken from later years. These alternative specifications yielded qualitatively similarresults.44 See Lerner (1994) for a convincing argument as to why this measure is a reasonable proxy for the scope ofpatents.45 Here “reform” is dated as 1988, because it was, of course, impossible to file multi-claim patents before then.46 Rather than estimate a “shift” change in patenting, we also looked for “trend breaks” in the data by conductingChow tests for significant differences in pre- and post reform patent trends. This alternative approach yieldedqualitatively similar results.47 Since the log of zero is undefined, we follow the practice in this literature of taking the log of one plus the actualnumber of patent applications. This practice is followed in subsequent specifications as well.48 As a robustness check, we estimated nonlinear “count data” models (Poisson and Negative Binomial

36
specifications) as an alternative to the log-linear results presented herein. We obtained qualitatively similar resultsto those reported here.49 However, we found no statistical relationship between the use of the multi-claim system in Japan and thepropensity to patent in the U.S. This casts doubt on the view that the increase in U.S. patenting by Japanese firmswas driven primarily by the introduction of the multi-claim system. The results of this and other robustness checksare available from the authors upon request.50 One factor which does not seem to have contributed to higher propensities to patent in the U.S. was the 1988“patent process amendment” enacted into U.S. law, which provided U.S. firms with the right to impound importsof goods manufactured abroad using processes which infringed on U.S. patents. We specifically asked ourJapanese interviewees about the impact of this legal change, and they indicated that it was not a factor in theirdecision to patent in the U.S. We nevertheless thank Jeffrey Kushan for calling this procedural change to ourattention.51 One alternative explanation for the observed increase of patenting by Japanese firms in the U.S., suggested to usby Wesley Cohen, is that it was prompted by a series of high-profile lawsuits in the mid 1980s in which U.S. firms(notably Texas Instruments) successfully sued Japanese firms for patent infringement. Japanese firms are allegedto have responded by “ramping up” their U.S. patent portfolios. In the absence of quantitative data on litigationagainst Japanese firms in the U.S., this hypothesis is difficult to test formally.52 This approach is not available to us with the Japanese data due to the absence of reliable citations data.53 One possible reason suggested by our interviews is, again, organizational structure. Japanese firms typicallycontract the generation of most of their overseas patent documents to foreign patent agents. This organizationaldisconnect could conceivably lessen the impact of an increase in Japanese innovation on the “quality” of their U.S.patents.

37
Figure 1. The “Improved” Multi-claim System
x
x
x
y
y
y
x: invention by this firm
y: invention by other firms
claim

38
Figure 2. Patent Applications in Japan
50,000
100,000
150,000
200,000
250,000
300,000
350,000
400,000
1945
1947
1949
1951
1953
1955
1957
1959
1961
1963
1965
1967
1969
1971
1973
1975
1977
1979
1981
1983
1985
1987
1989
1991
1993
1995
Year
Nu
mb
er o
f A
pp
licat
ion
s
Data source: Japanese Patent Office.

39
Figure 3. Number of Claims per Patent Application
0
0.5
1
1.5
2
2.5
3
3.5
4
4.519
80
1981
1982
1983
1984
1985
1986
1987
1988
1989
1990
1991
1992
1993
Year
A: human necessities
B: performing operations, transporting
C: chemistry, metallurgy
D: textiles, paper
E: fixed constructions
F: mechanical engineering, lighting,heating, weapons, blastingG: physics
H: electricity
Data source: Japanese Patent Office. The number of claims per patent application to the Japanese PatentOffice, by section of the International Patent Classification System.

40
Figure 4. Newly Filed Intellectual Property Lawsuits in Japan
83 84 85 86 87 88 89 90 91 92 93 94 95
200
400
500
300
272
345373
346
401
350
315
369
307
407
456
497
527
Year
Number of Lawsuits
Data source: Industrial Research Institute (1996).

41
Figure 5 Quality of Japanese Patent Grant Cohorts as Measured by Subsequent Patent Citations
0
0.2
0.4
0.6
0.8
1
1.2
Cited77 Cited78 Cited79 Cited80 Cited81 Cited82 Cited83 Cited84 Cited85 Cited86 Cited87 Cited88 Cited89 Cited90 Cited91 Cited92 Cited93
1988 Patent Reforms
The line plots the relative "citedness" of Japanese patent cohorts from 1977-1993.

42
Table 1. Summary Statistics
Variable Observations Mean Std. Dev. Minimum Maximum____________________________________________________________________________________Real R&D (million yen)1 3562 17211.01 43943.79 0 445212.3Real sales (million yen) 4696 316383.8 640490 1673.111 9025592R&D/sales 4699 .034 .031 0 .178Counts of Japanese patents 5073 756.158 2668.701 0 34334Counts of claims per Japanese patent2 1114 2.116 1.342 1 12.740Counts of classes per Japanese patent2 1114 1.491 .200 1 2.333Counts of US patents 4896 44.434 171.224 0 4302Counts of claims per US patent 4867 6.865 5.725 0
64Counts of classes per US patent 4896 1.489 1.065 0
7Tobin’s Q (average Q) 4605 2.174 1.454 0.026 14.313Patent citations3 9605 112.118 574.115 0 9106
Note:1. Data from Kaisha Shiki Ho, high quality R&D data.2. Counts of claims and classes per Japanese patent are calculated from a random sample of a firms patent applications in year t. The numbers in our data base are average counts of claims and classes per firm-year.3. Data on patent citations are drawn from the REI data base at Case Western Reserve University. The citations data are not sorted by firm-year, but by patent characteristics, so that the number of observations differs substantially from our other variables.

43
Table 2: The Impact of Patent Reform on R&D SpendingDependent variable: Log (real R&D spending), standard errors in parentheses
(1) RandomEffect
(2) FixedEffect
(3) Random Effectwith
Patent_intensity
(4) Fixed Effectwith
Patent_intensityReform .089
(.028).088
(.027).120
(.033).143
(.040)Q .0299
(.008).026
(.008).031
(.008).027
(.008)Time trend .019
(.004).039
(.004).019
(.004).039
(.004)Log(sales) .954
(.025).557
(.040).966
(.025).562
(.040)Patent_intensity*reform -.054
(.029)-.096
(.018)Food -1.15
(.224)-1.16(.220)
Textiles -.931(.184)
-.940(.181)
Paper -1.47(.368)
-1.49(.362)
Chemicals -.071(.103)
-.072(.101)
Petroleum -2.51(.255)
-2.54(.2510
Ceramics, materials -.804(.221)
-.808(.217)
Iron/steel -.822(.206)
-.832(.202)
Nonferrous metals -.975(.176)
-.974(.173)
Fabricated metal products -2.31(.256)
-2.32(.252)
Machinery -.817(.126)
-.819(.124)
Transportation equipment -.317(.157)
-.328(.154)
Precision instruments .208(.266)
.211(.261)
Miscellaneous manufacturing -1.31(.373)
-1.33(.367)
Engineering -1.31(.624)
-1.31(.613)
Constant -2.80(.290)
1.38(.453)
-2.94 (.291)
1.31(.453)
Number of observations 3404 3404 3404 3404
The reference industry is electronics.

44
Table 3: The Impact of Patent Reform on R&D Spending: Robustness TestsDependent variable: Log(real R&D spending), standard errors in parentheses
(1) ReformBegins in
1988, FixedEffect
(2) ReformBegins in
1990, FixedEffect
(3) ReformBegins in 1985,Random Effect
(4) AllowingReform Impact toVary by Industry,
Random EffectReform .344
(.062)Reform begins in 1988 -.051
(.027)Reform begins in 1990 -.049
(.025)Reform begins in 1985 .167
(.026)
Q .037(.008)
.031(.008)
.022 (.008)
.020(.008)
Time trend .055(.004)
.054(.004)
.016(.003)
.021(.004)
Log(sales) .551(.040)
.553 (.040)
.937 (.026)
.923(.028)
Electronics, prec. instruments*reform -.445 (.066)
Chemicals, petroleum*reform -.236 (.063)
Ceramics, materials*reform -.090 (.105)
Steel, nonferrous metals*reform -.197 (.077)
Fab. Metal prod., machinery*reform -.208 (.069)
Transportation equipment*reform -.152 (.077)
Misc. manufacturing*reform .129(.156)
Industry dummies N.A. N.A. Jointlysignificant atthe 1% level
Jointly significantat the 1% level
Constant 1.38 (.454)
1.37(.454)
-2.61 (.292)
-3.66(.359)
Number of observations 3404 3404 3404 3404
The reference sector is “basic manufacturing” (food, textiles, and paper).

45
Table 4: The Impact of Patent Reform on R&D Spending:Using Average Claims per Patent as a Control Variable
Dependent variable: Log(real R&D spending), standard errors in parentheses(1) Random Effect (2) Fixed Effect
Reform .077(.042)
.072(.041)
Average_claim -.023 (.015)
-.034 (.015)
Log(sales) .968(.036)
.513(.070)
Q .020 (.012)
.020 (.012)
Time trend .019 (.008)
.044 (.008)
Industry dummies Jointly significant at the 1% level N.A.
Constant -2.54 (.451)
2.69 (.860)
Number of observations 1023 1023

46
Table 5: The Impact of Patent Reform on Counts of Japanese Patent Applications
Dependent variable: Log(counts of Japanese patent applications), standard errors in parentheses(1) Random Effect (2) Fixed Effect
Reform -.019 (.029)
-.024 (.027)
Log(R&D) .216 (.017)
.116(.017)
Time trend .018(.004)
.027(.004)
Industry dummies Jointly significant at 1% level N.A.
Constant 3.09(.241)
3.24(.135)
Number of observations 3535 3535

47
Table 6: The Impact of Patent Reform on Counts of Claims and Classes per Japanese PatentApplication
Standard errors in parentheses(1) AverageCounts ofClaims per
Patent,Random Effect
(2) AverageCounts ofClaims per
Patent,Fixed Effect
(3) Claims-Weighted
Total Patents,Fixed Effects
(4) AverageCounts of
Classes perPatent,
Random Effect
(5) AverageCounts of
Classes perPatent,
Fixed EffectReform .320
(.095).315
(.095).334
(.049)-.037
(.014)-.037
(.014)
Log(R&D) -.057 (.039)
-.261(.069)
.064(.036)
-.010 (.007)
-.015(.011)
Time trend .215(.014)
.229 (.014)
.101(.007)
.032(.014)
.032(.002)
Industrydummies
Jointlysignificant at the
1% level
N.A. N.A. Jointlysignificant at the
1% level
N.A.
Constant .507(.387)
2.49(.630)
4.96(.332)
1.27(.069)
1.39(.095)
Number ofobservations
1085 1085 1072 1085 1085
Total counts of patent applications are not available for all firms in all years, hence the number of observationsdiffers in column 3.

48
Table 7: The Impact of Patent Reform on Patent Grants in the U.S.
Dependent Variable: Log(counts of Japanese patent grants in the U.S.), standard errors in parentheses(1) Log of
Total Counts ofPatents,
Random Effect
(2) Log ofTotal Countsof Patents,
Fixed Effect
(3) EffectsSetting Date ofReform = 1990,Random Effect
(4) EffectsSetting Date ofReform = 1985,
Fixed EffectReform .402
(.045).402
(.044)
Reform begins in 1990 -.034 (.042)
Reform begins in 1985 .347(.041)
Log(R&D) .466(.023)
.262(.028)
.467 (.023)
.214(.029)
Time trend -.034(.006)
-.018 (.006)
.014(.006)
.001 (.005)
Industry dummies Jointlysignificant atthe 5% level
N.A. Jointlysignificant at the
5% level
N.A.
Constant -1.43 (.226)
-.044 (.221)
-1.58 (.227)
.158 (.224)
Number of observations 3555 3555 3555 3555

49
Table 8: The Impact of Patent Reform on Patent Quality in the U.S.
Standard errors in parentheses(1) AverageCounts ofClaims per
Patent,Random Effect
(2) AverageCounts ofClaims per
Patent,Fixed Effect
(3) AverageCounts of
Classes perPatent,
Random Effect
(4) AverageCounts of
Classes perPatent,
Fixed EffectReform -.258
(.282)-.211(.281)
.014(.053)
.012(.053)
Log(R&D) 1.09 (.101)
.258(.179)
.198(.018)
.198(.017)
Time trend .088(.037)
.150 (.039)
-.013(.053)
-.013 (.007)
Industrydummies
Jointlysignificant atthe 5% level
N.A. Jointlysignificant atthe 5% level
N.A.
Constant -2.41 (.929)
4.45 (1.41)
-.082 (.168)
.055 (.140)
Number ofobservations
3551 3551 3555 3555

50
Table 9: Citations Function Estimates
Variable Estimate Standard ErrorDiffusion parameter 0.423 0.014Obsolescence parameter 0.0000358 3.942E-6Relative number of citations to patents filed in 1977 1.06 .124Relative number of citations to patents filed in 1978 0.954 .114Relative number of citations to patents filed in 1979 .927 .119Relative number of citations to patents filed in 1980 .810 .110Relative number of citations to patents filed in 1981 .853 .114Relative number of citations to patents filed in 1982 .825 .114Relative number of citations to patents filed in 1983 .787 .115Relative number of citations to patents filed in 1984 .718 .112Relative number of citations to patents filed in 1985 .720 .116Relative number of citations to patents filed in 1986 .686 .114Relative number of citations to patents filed in 1987 .657 .113Relative number of citations to patents filed in 1988 .609 .111Relative number of citations to patents filed in 1989 .523 .102Relative number of citations to patents filed in 1990 .483 .099Relative number of citations to patents filed in 1991 .416 .088Relative number of citations to patents filed in 1992 .349 .078Relative number of citations to patents filed in 1993 .268 .069Citing period 1982-85 .996 .095Citing period 1986-89 1.11 .151Citing period 1990-94 1.21 .220
Number of observations 9605
The coefficients for the years 77-93 give the “vintage effects” associated with cohorts of cited patents, as inJaffe and Trajtenberg (1997).

51
Appendix 1. The Model in Section 5.
The particular framework that we use here borrows heavily Denicolo (1996), which, in turn, isbased on Lee and Wilde (1980). We consider a race for a patentable innovation between n symmetricfirms. In this model, both the winner and losers of the patent race get positive profits in the post-innovationequilibrium. The length of the patent is finite, and after the patent has expired, both the winner and losersget the same positive profits. Before the innovation, all firms make zero profit. This assumption is madeto simplify the exposition of the model. Our results don’t change if we assume all firms make the samepositive profits before the innovation.
Each firm i invests in R&D an amount xi per unit of time; xi is a flow cost that firm i pays until oneplayer succeeds. Assuming an exponential distribution, the probability of being successful at a date τprior to date t is Pr(τ ≤ t ) = 1− −e h x ti( ) , where h(xi) is the (twice differentiable) hazard function whichgives the instantaneous conditional probability of success by firm i as a function of its R&D expenditure xi.A concave hazard function is assumed, that is ′ >h xi( ) 0 and ′′ <h xi( ) 0 .
The payoff function of firm i is the present value of expected profits, net of R&D costs:
i
h x r t
i i ie h x V X L x dtj
j
n
∏ ∫=∑
+ −− +∞
−=
[ ( ) ]
[ ( ) ]1
0
=+ −
+ +−
−
h x V X L x
X h x ri i i
i i
( )
( )(1)
where r is the interest rate, xi is i’s R&D expenditure, h(xi) is i’s instantaneous probability of innovating,
X h xi jj
−≠
= ∑ ( )1
is the instantaneous probability that one of the (n −1) rivals of firm i innovates, V is the
present value of the prize accruing to the winner, and L is the present value of the prize to the losers.Denoting the length of the patent by T, the prize to the winner is:
V e dt e dte
r
e
rWrt rt
rT
T
T
W
rT
= + =−
+− −−∞ −
∫∫π π π π1
0
, (2)
where πW is the flow of profits accruing to the patentee, and π is the profit after the patent has expired
(the same for all firms). Similarly, the prize to the losers of the R&D race is:
Le
r
e
r
rT
L
rT
=−
+− −1
π π , (3)
where π L is the flow of profits accruing to the non-innovating firms when they have no access to the
patented innovation. We assume π π πW L≥ ≥ ; the first inequality is strict except for the case of zero
patent breadth. This implies V ≥ L with a strict inequality for a positive patent breadth.Each firm chooses its R&D investment to maximize its expected profits (1). The first order
condition for a maximum is:∂∂Π i
i
i i i i i i i i
i ix
h x X r V X h x h x X L x h x r
X h x r=
′ + − − − ′ + ′ −+ +
=− − −
−
( )( ) ( ) ( ) ( )
{ ( ) }.2 0 (4)
It may be easily checked that the second order condition holds. Since all firms are identical, we look for asymmetric Nash equilibrium where xi = x for all i. The numerator of condition (4) then becomes:
( ) ( )( )( )
[ ( ) ( )] .n h x V L rVh x
nh x r xh x− − + −′
+ − ′ =11
0 (5)
Let equilibrium investment be denoted x*. Substituting for V and L and rearranging (5), we get:

52
11 0
−− − + − −
+′
+ + =−e
rh h x r
nh x r
h xx
rT
W L W[( ) ( )( ) ( )]( )
( ).*
*
**π π π π π (6)
Note x W* ,π and π L are functions of the breadth of the patent, which can be denoted as b (and which is (1
- α) in Denicolo, 1996). We assume that πW ′(b) > 0 and π L ′(b) ≤ 0.
Differentiating equation (6) with respect to b yields:
dx
db
e
rn h x b b r b
nh x nh x r
h x
e
rn h x
rT
W L W
rT
W L
**
* *
**
[( ) ( ){ ' ( ) ' ( )} ' ( )]
( )( )( ( ) )
( )( ) ( )( )
=
−− − +
− −′′ +
′−
−− ′ −
−
−
11
11
12
π π π
π π(7)
Similarly, differentiating equation (6) with respect to T yields:
dx
dT
e n h x r
nh x nh x r
h x
e
rn h x
rTW L W
rT
W L
* *
* *
**
[( ) ( )( ) ( )]
( )( )( ( ) )
( )( ) ( )( )
=− − + −
− −′′ +
′−
−− ′ −
−
−
1
11
12
π π π π
π π(8)
The numerators are positive in (7) and (8). The denominators of (7) and (8) are the same. Assume that theleft-hand side of (6) decreases with x*. This requires a stability condition analogous to Lee and Wilde’s.From this assumption, differentiating the left-hand side of (6) with respect to x*, we get:
( )( )( ( ) )
( )( ) ( )( )
* *
**n
h x nh x r
h x
e
rn h x
rT
W L− −′′ +
′−
−− ′ − >
−
11
1 02 π π . (9)
Hence dx
db
*
> 0 and dx
dT
*
> 0.
The prediction for empirical results is, therefore, we should see positive association between the breadth ofpatent protection (and the length of the patent protection) and R&D investment.
Appendix 2. The Caballero-Jaffe-Trajtenberg Citations Function
We use the framework pioneered by Caballero and Jaffe (1993). In this framework, the likelihoodthat any particular patent K granted in year T will cite some particular previous patent k granted in year t,p k K( , ) , is assumed to be determined by the combination of an exponential process by which knowledge
diffuses and a second exponential process by which knowledge becomes obsolete. That is,))](exp(1)][(exp[),(),( 21 tTtTKkKkp −−−−−= ββα (10)
where 1β is the rate of obsolescence and 2β measures the rate of diffusion. Here α measures “level
effects” on the probability of citation which are a function of the characteristics of the cited and citingpatent cohorts. We refer to the likelihood determined by (10) as the “citation frequency” and the citationfrequency as a function of the citation lag (T-t) as a citation function. This general approach was alsoused in Jaffe and Trajtenberg (1997).54
The dependence of the parameter α on k and K is meant to indicate that these could be functionsof certain attributes of both the cited and citing patents. In their work, Jaffe and Trajtenberg haveconsidered a number of attributes of the cited patent k that might affect its citation frequency and a numberof attributes of the potentially citing patent K that might affect the citation likelihood. Here, we take aradically simplified version of the Jaffe-Trajtenberg approach. We are really only interested in the extent towhich post-reform Japanese patent cohorts are more heavily cited. Therefore, we confine ourselves toestimating effects associated with cited year, citing year, and lag. This is analogous to estimating

53
“vintage,” time, and age effects in a wage model or hedonic price model. If lag (our “age” effect) enteredthe model linearly, then it would be impossible to estimate all three effects. Given that lag enters the modelnon-linearly, all three effects are identified in principle. In practice, a model was used in which citing yearsare grouped into five year intervals.
Consider now a potentially cited Japanese-invented patent granted in 1985. The expected numberof citations that this patent will receive from a particular subsequent Japanese patent cohort (e.g., aJapanese patent granted in 1993) is just the above likelihood times the number of patents in the cohorts thatare thereby potential citing and cited patents. In symbols:
[ ] ))](exp(1)][(exp[))(( 21 tTtTNNCE tTtTtT −−−−−= ββα (11)
where CtT is the number of citations to the patent cohort of year t by the patent cohort of subsequent yearT. Likewise, NT is the number of patents in the citing cohort, and Nt is the number of patents in the citedcohort. This can be re-expressed as
))](exp(1)][(exp[))((
)(21 tTtT
NN
CEtT
tT
tT −−−−−= ββα (12)
implying that the equation
tTtTtT
tTtT tTtT
NN
Cc εββα +−−−−−== ))](exp(1)][(exp[
))(( 21 (13)
can be estimated by non-linear least squares if the error is well-behaved. Here, c is defined as the estimatedprobability of a citation occurring between patent cohorts t and T. The data set we used for the estimationof (13) was drawn from the REI patent data base.55 It is based on the universe of Japanese patents grantedin the U.S., and consists of one observation for each feasible combination of values of t and T. Allestimation was carried out including a “base” value for 1β and 2β , with all other effects estimated relative
to a base value of unity. The various “vintage” and “age” effects are included by entering multiplicativeparameters, so that the estimating equation looks like
tTTttT tTtTp εββαα +−−−−−= ))](exp(1)][(exp[ 21 (14)
In this model, unlike the linear case, the null hypothesis of no effect corresponds to parameter values ofunity rather than zero. For each effect, one group is omitted from estimation, i.e. its multiplicativeparameter is constrained to unity. Thus, the parameter values are interpreted as relative to that base group.The base group for the cited year effects is the 1976 cohort of Japanese patents. The base group for theciting year affects are patents granted in years 1979-1981.
54 The description of the citation function and its interpretation closely follows Jaffe and Trajtenberg (1997).55 We thank Adam Jaffe for allowing us access to this data base.

54
References
Caballero, R. and Jaffe, A.. “How High Are the Giant’s Shoulders?” NBER Macroeconomics Annual,
University of Chicago Press, Chicago, IL, 1993.
Cadot, O. and Lippman, S.A. “Barriers to Imitation and the Incentive to Innovate.” Working paper No.
434, Western Management Science Institute, University of California, Los Angeles, 1995.
Chang, H.F. “Patent Scope, Antitrust Policy, and Cumulative Innovation.” RAND Journal of Economics,
Vol. 26 (1995), pp. 34 - 57.
Cockburn, I. and Lanjouw, J. “Do Patents Matter? Empirical Evidence After GATT.” Working paper,
1998.
Cohen, W., Goto, A., Nagata, A.., Nelson, R., Walsh, J. “R&D Spillovers, Patents and the Incentives to
Innovate in Japan and the United States.” Working paper, August 1998.
Cohen, W., Nelson, R., and Walsh, J. “Appropriability Conditions and Why Firms Patent and Why They
Do Not in the American Manufacturing Sector.” Working paper, June 1996.
Cornelli, F. and Schankerman, M. “Patent Renewals and R&D Incentives.” RAND Journal of Economics,
forthcoming.
Denicolo, V. “Patent Races and Optimal Patent Breadth and Length.” Journal of Industrial Economics,
Vol. 44 (1996), pp. 249 - 265.
Gallini, N.T. “Patent Policy and Costly Imitation.” RAND Journal of Economics, Vol. 23 (1992), pp. 52
- 63.
Gilbert, R. and Shapiro, C. “Optimal Patent Length and Breadth.” RAND Journal of Economics, Vol. 21
(1990), pp. 106 - 112.
Green, J. and Scotchmer, S. “On the Division of Profit in Sequential Innovation.” RAND Journal of
Economics, Vol. 26 (1995), pp. 20 - 33.
Harvard Business School. “Fusion Systems Corporation in Japan (A).” 9-390-021, Harvard Business

55
School Publishing, Boston MA, 1990.
Himmelberg, C., and Petersen, B. “R&D and Internal Finance: A Panel Study of Small Firms in High-
Tech Industries.” Review of Economics and Statistics, Vol. 78 (1994), pp. 38-51.
Hiraoka, K., Kuzuwa, K., Ukai, K. and Mori, O. Description: The Improved Multi-Claim System and the
Extended Patent Protection Period. Association of Invention, Tokyo, Japan, 1988.
Hoshi, T. and Kashyap, A.K. “Evidence on q and Investment for Japanese Firms.” Journal of the
Japanese and International Economies, Vol. 4 (1990), pp. 371 - 400.
Industrial Research Institute. Research on the Procedures of Lawsuits on Intellectual Property Rights.
Tokyo, Japan, 1996.
Jaffe, A. and Trajtenberg, M. “Flows of Knowledge from Universities and Federal Labs: Modeling the
Flows of Patent Citations Over Time and Across Institutional and Geographic Boundaries.” NBER
Working Paper #5712, 1997.
Japan Patent Association. Amendment of the Patent Law on the Multi-Claim System: Guideline to Utilize
the Multi-Claim System. Patent Committee, the Second Sub-committee, No. 151, Tokyo, Japan,
1988.
Klemperer, P. “How Broad Should the Scope of Patent Protection Be?” RAND Journal of Economics,
Vol. 21 (1990), pp. 113 - 130.
Lee, T. and Wilde, L. “Market Structure and Innovation: A Reformulation.” Quarterly Journal of
Economics, Vol. 93 (1980), pp. 395 - 410.
Lerner, J. “The Importance of Patent Scope: An Empirical Analysis.” RAND Journal of Economics, Vol.
25 (1994), pp. 319 - 333.
Matutes, C., Regibeau P. and Rockett, K. “Optimal Patent Design and the Diffusion of Innovations.”
RAND Journal of Economics, Vol. 27 (1996), pp. 60 - 83.
Merges, R. P. and Nelson, R. R. “ On Limiting or Encouraging Rivalry in Technical Progress: The Effect
of Patent Scope Decisions.” Journal of Economic Behavior and Organization, Vol. 25 (1994),

56
pp. 1 - 24.
Niihara, H. ed. Commentary of the Amended Patent Law. Yuhikaku, Tokyo, Japan, 1987.
Nordhaus, W.D. Invention, Growth, and Welfare: A Theoretical Treatment of Technological Change.
MIT Press, Cambridge, MA, 1969.
Nordhaus, W.D. “The Optimum Life of a Patent: Reply.” American Economic Review, Vol. 62 (1972),
pp. 428 - 431.
Okamaoto, T. et. al. “Total Patent Costs (Filing and Maintenance Costs).” Presented at the 27th Pacific
Intellectual Property Association General Meeting in Hiroshima, October 1996.
Ordover, J.A. “A Patent System for Both Diffusion and Exclusion.” Journal of Economic Perspectives,
Vol. 5 (1991), pp. 43 - 60.
Schankerman, M. “How Valuable is Patent Protection? Estimates by Technology Field.” RAND Journal
of Economics, Vol. 29 (1998), pp. 77-107.
Scherer, F.M. “Nordhaus’ Theory of Optimal Patent Life: A Geometric Reinterpretation.” American
Economic Review, Vol. 62 (1972), pp. 422 - 427.
Scotchmer, S. “Protecting Early Innovators: Should Second-Generation Products be Patentable.” RAND
Journal of Economics, Vol. 27 (1996), pp. 322-331.
Scotchmer, S. and Green, J. “Novelty and Disclosure in Patent Law.” RAND Journal of Economics, Vol.
21 (1990), pp. 131 - 147.