
1 1 EXPANDED RISK MANAGEMENT CASE FARM WORKSHOP Dr. G. A. “Art” Barnaby, Jr Dr. G. A. “Art”...
53
1 EXPANDED RISK MANAGEMENT CASE FARM EXPANDED RISK MANAGEMENT CASE FARM WORKSHOP WORKSHOP Dr. G. A. “Art” Barnaby, Jr Dr. G. A. “Art” Barnaby, Jr Kansas State University Kansas State University Phone: (785) 532-1515 Phone: (785) 532-1515 Email: Email: [email protected] [email protected] Check out our WEB at: Check out our WEB at: AgManager.info AgManager.info
-
date post
21-Dec-2015 -
Category
Documents
-
view
214 -
download
1
Transcript of 1 1 EXPANDED RISK MANAGEMENT CASE FARM WORKSHOP Dr. G. A. “Art” Barnaby, Jr Dr. G. A. “Art”...

1
EXPANDED RISK MANAGEMENT CASE EXPANDED RISK MANAGEMENT CASE FARM WORKSHOPFARM WORKSHOP
Dr. G. A. “Art” Barnaby, JrDr. G. A. “Art” Barnaby, Jr Kansas State UniversityKansas State University
Phone: (785) 532-1515Phone: (785) 532-1515 Email: Email: [email protected]@agecon.ksu.edu
Check out our WEB at: Check out our WEB at: AgManager.infoAgManager.info

2
EXPANDED RISK MANAGEMENT CASE EXPANDED RISK MANAGEMENT CASE FARM WORKSHOPFARM WORKSHOP
Participants make a decision on the type and Participants make a decision on the type and level of crop insurance.level of crop insurance.
Participants draw their yield from a hat at Participants draw their yield from a hat at harvest time. Based on the yield they draw harvest time. Based on the yield they draw the computer draws the county yield for the computer draws the county yield for GRIP/GRP.GRIP/GRP.
3
EXPANDED RISK MANAGEMENT CASE EXPANDED RISK MANAGEMENT CASE FARM WORKSHOPFARM WORKSHOP
Computer drawn county yields are based on a Computer drawn county yields are based on a farm yield-county yield correlation that is farm yield-county yield correlation that is greater than 0.80.greater than 0.80.
There is a 5% chance built in to the county There is a 5% chance built in to the county yield draws that generate no GRIP/GRP yield draws that generate no GRIP/GRP payment. There is also a 5% chance that payment. There is also a 5% chance that participants drawing an average farm yield participants drawing an average farm yield will receive a “large” GRIP/GRP payment. will receive a “large” GRIP/GRP payment. Participants are told about this risk before Participants are told about this risk before they make their crop insurance decision.they make their crop insurance decision.

4
EXPANDED RISK MANAGEMENT CASE EXPANDED RISK MANAGEMENT CASE FARM WORKSHOPFARM WORKSHOP
Participants who draw a low farm yield caused Participants who draw a low farm yield caused by hail damage are assumed to be in a county by hail damage are assumed to be in a county with normal yields, i.e. no GRIP/GRP indemnity with normal yields, i.e. no GRIP/GRP indemnity payments. However, participants are given payments. However, participants are given the option to buy private hail insurance.the option to buy private hail insurance.
All grain produced is sold at harvest. All All grain produced is sold at harvest. All options, futures, and forward cash contracts options, futures, and forward cash contracts are settled at harvest.are settled at harvest.
Net farm incomes are then compared across Net farm incomes are then compared across participants and the highest net income for participants and the highest net income for each of 4 farm level yield draws are compared.each of 4 farm level yield draws are compared.

5
EXPANDED RISK MANAGEMENT CASE EXPANDED RISK MANAGEMENT CASE FARM WORKSHOPFARM WORKSHOP
All farm market plans assume production.All farm market plans assume production.
Requires bushels to offset hedge, forward Requires bushels to offset hedge, forward contract, or on farm feeding.contract, or on farm feeding.
There is little risk protection in the FSA There is little risk protection in the FSA farm program with current higher market farm program with current higher market prices.prices.

6
Example Case FarmExample Case Farm
Summary You are John or Mary Sample. With your spouse, you manage a crop farm with corn and other crop enterprises. Presently the acreage is split between corn and other crops. However, your landlords are demanding a cash rent increase but you intend to retain those corn acres. There are several bank notes outstanding for land and machinery. You have budgeted out your corn and other crop operations and you expect to have sufficient income to cover production costs, scheduled principal and interest payments, and living expenses. Your financial situation, however, is sensitive to changes in crop yields and market prices. So you are willing to consider some alternative pricing strategies to manage your price risk exposure. You are also considering the purchase of crop and/or hail insurance. You may purchase MPCI, CRC\RA-HPO, RA\IP, GRP, GRIP-HRO or Catastrophic crop insurance. If you wish, you may add supplemental hail coverage to your crop insurance purchase.

7
Example Case FarmExample Case FarmYour assignment is to manage the production and marketing risk for the 2008 corn crop. Beginning in April 2008`, you will have 4 opportunities to forward price any portion of your expected crop by forward cash contracts, hedging with futures, or by purchasing put options (a form of "price insurance"). The dates on which you may price the crop are April 8, June 12, July 12, and August 21. You may not sell more than 100,000 bushels of corn before harvest using any combination of the various marketing alternatives offered. If you change your mind, you may buy back futures you sold and/or sell back any put options you purchased -- in effect "cancel" your "price" insurance. However, you may not cancel forward cash contracts. All corn sales will be completed before or by October 21, 2008 (harvest). Also at harvest, all forward contracts will be met even if you have to buy grain on the cash market and any futures contracts and/or put options will be offset. If an LDP is available at harvest, you will be required to take it at that time. There will be no post-harvest storage or ownership and you will not be able to take any actions to “hedge” the counter-cyclical payment (CCP). All participants will receive the same direct payment and the same CCP if a CCP is paid during the 2008/09 marketing year. You will not know what your "actual" yield will be until harvest. At that time you will "draw" one of four possible yields. If you suffer a crop loss it will be due either to "other causes" (insured under MPCI, CRC, RA, RA-HPO, GRP, GRIP-HRO or CAT) or to "hail". You will receive no GRP or GRIP-HRO payment if cause of loss is hail. The probability of suffering a crop loss will be provided at the time crop insurance is to be purchased (March 15, 2008).

8
Example Case FarmExample Case FarmCOST/RETURNS OF Kansas Irrigated CORN ENTERPRISE
Cost / ReturnsExpected
$/ Ac $/FarmPlanted Acres 1 625.0A. Insurance Premium Costs $40 $25,000B. Other Pre-Harvest Variable Costs $209 $130,431C. Harvest, Storage & Trucking Cost($19.50/ac+$0.326/Bu+ $0.13X over 100 Bu ) $79 $49,375D. Fixed Costs $138 $86,475E. Total Costs per Planted Acre $466 $291,281
F. Yield per Acre (bu. ) 160.0 100,000G. Variable Cost/Bu [A+B+C/F] $2.05H. Fixed Cost/Bu [D/F] $0.86I. Total Cost/Bu [E/F] $2.91
J. Market Price/bu. $3.00 $3.00K. Market Income/Acre [J X F] $480 $300,000L. Net Returns/Ac [L-E] $14 $8,719 Returns/Bu $0.09N. Direct Payment $0.28 X 85% X 130 Bushel Program Yield $31 $19,000M. Counter Cyclical Payment Strike- Max (Market, Loan) X 85% X 150 Bushel Program Yield $0.00 $0O. Net Return Plus Gov Payment $45 $28,056

9
Example Case FarmExample Case FarmJuly 12, 2008
Central Illinois, just west of Chicago, is the center of a drought. It is not a record-breaking drought, but Central Illinois has been abnormally dry since March 1st. Tom Skilling on his WGN noon weather report forecasted no rain for the next 10 days. Following the broadcast, corn traded near the limit. At about 1:00 pm CST, a private weather forecaster, who consults with the grain industry, said there would be a chance for thunderstorms and slightly cooler temperatures later in the week. His weather models are forecasting a system to move into Illinois later in the week and stall over most of the Corn Belt and produce widespread beneficial rains, with locally damaging winds and hail. This forecast was enough to cause fund speculators to start liquidating their positions and taking their profits.
MARKET INDICATORS: The June 1 Stocks Report was 105 million bushels larger than industry expectations, indicating U.S. feed usage was lower than anticipated. The June Acreage Report indicated 1% (845 thousand ac.) more acres were planted to corn than reported by the March Planting Intentions Report and is a record for corn acreage. Ending stocks are projected at 1.334 billion bushels and suggests an 11.2% stocks to use ratio.
Campaigning for 2008 Presidency, Senator Hillary Clinton declared the drought-stricken Corn Belt region would receive federal disaster aid under her administration. The Bush administration countered that farmers should depend on crop insurance and there would be no disaster aid program and the Senator's comments were irresponsible election year politics.

10
Example Case FarmExample Case Farm
Case Problem, 2008 Weekly December Corn Futures (High, Low, Close)
$3.70
$3.80
$3.90
$4.00
$4.10
$4.20
$4.30
11/30/07 01/09/08 02/18/08 03/29/08 05/08/08 06/17/08 07/27/08 09/05/08 10/15/08
April 8 $4.00
June 12 $4.10
July 12 $ 4.20

11
Example Case FarmExample Case Farm
Expected Put Expected+ Harvest - Option = Net
Basis Premium Price + - =
WHAT QTY?
HOW?WHY?
= $4.20CBOT CBOTDec Option CALL Put Dec Option CALL PutStrike Price Premium Premium Strike Price Premium Premium
5.00 0.20 0.99 4.10 0.50 0.404.40 0.37 0.57 4.00 0.55 0.354.30 0.41 0.51 3.80 0.60 0.304.20 0.45 0.45 3.90 0.66 0.26
WHAT QTY?_______ HOW?______________WHY?_________________CBOT Dec Corn Futures
- - - - - - - - - - - - - - - - - - - - - - - ($/Bu.) - - - - - - - - - - - - - - - - - - - - - - -
Forward Contract Bid = $3.90 for Oct 21 Delivery (Avg Basis -$0.25/bu.)
SHOULD I BUY BACK ANY Corn SOLD PREVIOUSLY? _____(Y/N)
CBOT Futures or Put Option Strike Price
SHOULD I SELL SOME Corn TODAY? (Y/N)
Pricing Opportunities for Corn on 07/12/08 To Be Delivered at Harvest

12
Example Case FarmExample Case FarmCorn: March 15
625.0Please Circle only ONE Dollar Amount ! (Rounded to $100)
MPCI RA/IP GRP$3.50 $3.90 $3.90 $512 $571
P Election CBOT CBOT CBOT CBOT
1. 80% MP/CRC/RA $15,200 $29,000 $27,000 90% $15,600 $25,100
2. 75% MP/CRC/RA $10,200 $19,200 $17,800 85% $6,300 $19,700
3. 70% MP/CRC/RA $7,200 $14,800 $12,100 80% $4,800 $17,100
4. CatastrophicCatastrophic $100 NONE $ XXXXX $ XXXXX $ XXXXX
5. 80% $19,900 $33,700 $31,700 90% $25,000 $34,500
6. 75% $14,900 $23,900 $22,500 85% $15,700 $29,100
7. 70% $11,900 $19,500 $12,300 80% $14,200 $26,500
8. CAT $9,500 $ XXXXX $ XXXXX $ XXXXX $ XXXXX
WORKSHOP YIELD "DRAWS"
PROBABILITY OF YIELD AND CAUSE OF LOSSES (IF ANY)
Yield Prob Cause Prob Cause % Loss
32 15% Other Causes 5% Hail Loss % 83.3% Bu.
80 20% Other Causes 10% Hail Loss % 58.3% Bu.
160 25% No Loss 5% Hail Loss % 16.7% Bu.
192 20% No Loss No Loss ------- Bu.
Number of Acres
CRC /RA-HPO
GRIP-HRO
Coverage Coverage
GRP/GRIP
GRP/GRIP
GRP/GRIP
In early summer, your crop's development is about 7-10 days behind average. It's been hot and dry but your crop has benefited from locally cooler temperatures. Based on the condition of the crop today, you think your yield could be higher than your APH. The weather forecast includes widely scattered thunderstorms, with locally damaging wind and hail. You are considering purchasing additional private hail insurance.
Basic Hail + CI Coverage
Total Production
GRP/GRIP Basic Hail +
CI Coverage GRP/GRIP Basic Hail +
CI Coverage GRP/GRIP Basic Hail +
CI Coverage
100,000
120,000
20,000
50,000

13
Revenue Insurance, Yield Adjusted Revenue Insurance, Yield Adjusted OptionsOptions
American options can be exercised; American options can be exercised; European/Asian options can not be exercised.European/Asian options can not be exercised.
American options are settled on a spot market; American options are settled on a spot market; Asian options are settled on an average price.Asian options are settled on an average price.
American, European, and Asian options are American, European, and Asian options are based on fixed yields; in CRC/RA yield adjusted based on fixed yields; in CRC/RA yield adjusted options lose value with change in yield.options lose value with change in yield.
Most of the CRC & RA risk is yield. Price risk is Most of the CRC & RA risk is yield. Price risk is probably a greater share of the revenue risk in probably a greater share of the revenue risk in GRIP than in RA/CRCGRIP than in RA/CRC because of thebecause of the aggregate aggregate yield is less variable.yield is less variable.

24 39 54 69 84 99 114 129 144 159 174 189 204 219
CORN YIELD DISTRIBUTION (with 80% Coverage)
Probability

24 39 54 69 84 99 114 129 144 159 174 189 204 219
Expected Yield = 166
CORN YIELD DISTRIBUTION (with 80% Coverage)
Probability

24 39 54 69 84 99 114 129 144 159 174 189 204 219
Expected Yield = 166
CORN YIELD DISTRIBUTION (with 80% Coverage)
Probability

24 39 54 69 84 99 114 129 144 159 174 189 204 219
Expected Yield = 166
CORN YIELD DISTRIBUTION (with 80% Coverage)
Probability
APH = 160

24 39 54 69 84 99 114 129 144 159 174 189 204 219
Expected Yield = 166
CORN YIELD DISTRIBUTION (with 80% Coverage)
Probability
APH = 160

24 39 54 69 84 99 114 129 144 159 174 189 204 219
Expected Yield = 166
CORN YIELD DISTRIBUTION (with 80% Coverage)
Probability
Guaranteed Bushels = 128 bu.
APH = 160

24 39 54 69 84 99 114 129 144 159 174 189 204 219
Expected Yield = 166
CORN YIELD DISTRIBUTION (with 80% Coverage)
Probability
Guaranteed Bushels = 128 bu.
APH = 160
Asian Put @ guaranteed bushels

24 39 54 69 84 99 114 129 144 159 174 189 204 219
Expected Yield = 166
CORN YIELD DISTRIBUTION (with 80% Coverage)
Probability
Guaranteed Bushels = 128 bu.
APH = 160
Asian Put @ guaranteed bushels

24 39 54 69 84 99 114 129 144 159 174 189 204 219
Expected Yield = 166
CORN YIELD DISTRIBUTION (with 80% Coverage)
Probability
Guaranteed Bushels = 128 bu.
APH = 160
Asian Put @ guaranteed bushels
23
Yield Adjusted Asian Put vs. American Yield Adjusted Asian Put vs. American PutPut
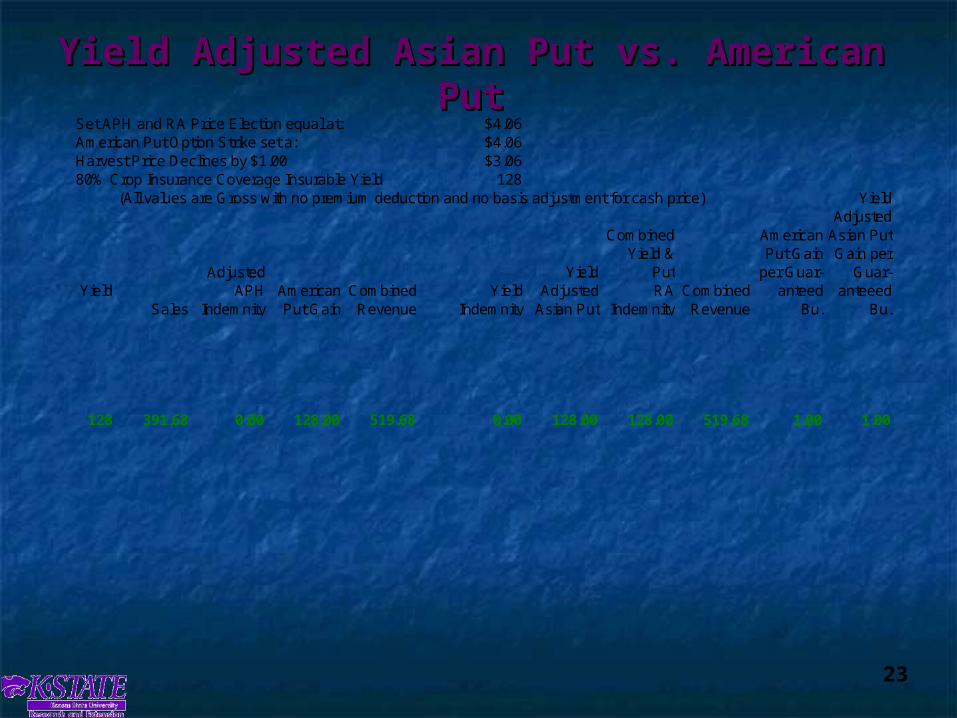
Set APH and RA Price Election equal at: $4.06American Put Option Strike set a: $4.06Harvest Price Declines by $1.00 $3.0680% Crop Insurance Coverage Insurable Yield 128
(All values are Gross with no premium deduction and no basis adjustment for cash price)
YieldSales
128 391.68 0.00 128.00 519.68 0.00 128.00 128.00 519.68 1.00 1.00
Combined Revenue
Combined Yield &
Put RA
Indemnity
Yield Adjusted
Asian Put Gain per
Guar-anteeed
Bu.
American Put Gain
per Guar-anteed
Bu.
Adjusted APH
Indemnity
Yield Adjusted
Asian PutAmerican Put Gain
Combined Revenue
Yield Indemnity

24
Yield Adjusted Asian Put vs. American Yield Adjusted Asian Put vs. American PutPut
Set APH and RA Price Election equal at: $4.06American Put Option Strike set a: $4.06Harvest Price Declines by $1.00 $3.0680% Crop Insurance Coverage Insurable Yield 128
(All values are Gross with no premium deduction and no basis adjustment for cash price)
YieldSales
168 $514.08 $0.00 $128.00 $642.08 $0.00 $5.60 $5.60 $519.68 $1.00 $0.04158 483.48 0.00 128.00 611.48 0.00 36.20 36.20 519.68 1.00 0.28148 452.88 0.00 128.00 580.88 0.00 66.80 66.80 519.68 1.00 0.52138 422.28 0.00 128.00 550.28 0.00 97.40 97.40 519.68 1.00 0.76128 391.68 0.00 128.00 519.68 0.00 128.00 128.00 519.68 1.00 1.00
Combined Revenue
Combined Yield &
Put RA
Indemnity
Yield Adjusted
Asian Put Gain per
Guar-anteeed
Bu.
American Put Gain
per Guar-anteed
Bu.
Adjusted APH
Indemnity
Yield Adjusted
Asian PutAmerican Put Gain
Combined Revenue
Yield Indemnity

25
Yield Adjusted Asian Put vs. American Yield Adjusted Asian Put vs. American PutPut
Set APH and RA Price Election equal at: $4.06American Put Option Strike set a: $4.06Harvest Price Declines by $1.00 $3.0680% Crop Insurance Coverage Insurable Yield 128
(All values are Gross with no premium deduction and no basis adjustment for cash price)
YieldSales
168 $514.08 $0.00 $128.00 $642.08 $0.00 $5.60 $5.60 $519.68 $1.00 $0.04158 483.48 0.00 128.00 611.48 0.00 36.20 36.20 519.68 1.00 0.28148 452.88 0.00 128.00 580.88 0.00 66.80 66.80 519.68 1.00 0.52138 422.28 0.00 128.00 550.28 0.00 97.40 97.40 519.68 1.00 0.76128 391.68 0.00 128.00 519.68 0.00 128.00 128.00 519.68 1.00 1.00118 361.08 40.60 128.00 529.68 40.60 118.00 158.60 519.68 1.00 0.92108 330.48 81.20 128.00 539.68 81.20 108.00 189.20 519.68 1.00 0.84
98 299.88 121.80 128.00 549.68 121.80 98.00 219.80 519.68 1.00 0.7788 269.28 162.40 128.00 559.68 162.40 88.00 250.40 519.68 1.00 0.6978 238.68 203.00 128.00 569.68 203.00 78.00 281.00 519.68 1.00 0.6168 208.08 243.60 128.00 579.68 243.60 68.00 311.60 519.68 1.00 0.5358 177.48 284.20 128.00 589.68 284.20 58.00 342.20 519.68 1.00 0.4548 146.88 324.80 128.00 599.68 324.80 48.00 372.80 519.68 1.00 0.3838 116.28 365.40 128.00 609.68 365.40 38.00 403.40 519.68 1.00 0.3028 85.68 406.00 128.00 619.68 406.00 28.00 434.00 519.68 1.00 0.2218 55.08 446.60 128.00 629.68 446.60 18.00 464.60 519.68 1.00 0.14
8 24.48 487.20 128.00 639.68 487.20 8.00 495.20 519.68 1.00 0.060 0.00 519.68 128.00 647.68 519.68 0.00 519.68 519.68 1.00 0.00
Combined Revenue
Combined Yield &
Put RA
Indemnity
Yield Adjusted
Asian Put Gain per
Guar-anteeed
Bu.
American Put Gain
per Guar-anteed
Bu.
Adjusted APH
Indemnity
Yield Adjusted
Asian PutAmerican Put Gain
Combined Revenue
Yield Indemnity

24 39 54 69 84 99 114 129 144 159 174 189 204 219
Asian Call @ zero yield
Expected Yield = 166
CORN YIELD DISTRIBUTION (with 80% Coverage)
Probability
Guaranteed Bushels = 128 bu.
APH = 160
Asian Put @ guaranteed bushels

24 39 54 69 84 99 114 129 144 159 174 189 204 219
Asian Call @ zero yield
Expected Yield = 166
CORN YIELD DISTRIBUTION (with 80% Coverage)
Probability
Guaranteed Bushels = 128 bu.
APH = 160
Asian Put @ guaranteed bushels

28
Yield Adjusted Asian Call vs. American Yield Adjusted Asian Call vs. American CallCall
Set APH and RA Price Election equal at: $4.06American Call Option Strike set a: $4.06Harvest Price Increases by $1.00 $5.0680% Crop Insurance Coverage Insurable Yield 128
(All values are Gross with no premium deduction and no basis adjustment for cash price)
YieldSales
0 0.00 519.68 128.00 647.68 519.68 128.00 647.68 647.68 1.00 1.00
American Call Gain per Guar-
anteed Bu.
Adjusted APH
Indemnity
Yield Adjusted
Asian CallAmerican Call Gain
Combined Revenue
Yield Indemnity
Combined Revenue
Combined Yield &
Call RA-HPO
Indemnity
Yield Adjusted
Asian Call Gain per Guar-
anteeed Bu.

29
Yield Adjusted Asian Call vs. American Yield Adjusted Asian Call vs. American CallCall
Set APH and RA Price Election equal at: $4.06American Call Option Strike set a: $4.06Harvest Price Increases by $1.00 $5.0680% Crop Insurance Coverage Insurable Yield 128
(All values are Gross with no premium deduction and no basis adjustment for cash price)
YieldSales
168 $850.08 $0.00 $128.00 $978.08 $0.00 $0.00 $0.00 $850.08 $1.00 $0.00158 799.48 0.00 128.00 927.48 0.00 0.00 0.00 799.48 1.00 0.00148 748.88 0.00 128.00 876.88 0.00 0.00 0.00 748.88 1.00 0.00138 698.28 0.00 128.00 826.28 0.00 0.00 0.00 698.28 1.00 0.00128 647.68 0.00 128.00 775.68 0.00 0.00 0.00 647.68 1.00 0.00118 597.08 40.60 128.00 765.68 40.60 10.00 50.60 647.68 1.00 0.08108 546.48 81.20 128.00 755.68 81.20 20.00 101.20 647.68 1.00 0.16
98 495.88 121.80 128.00 745.68 121.80 30.00 151.80 647.68 1.00 0.2388 445.28 162.40 128.00 735.68 162.40 40.00 202.40 647.68 1.00 0.3178 394.68 203.00 128.00 725.68 203.00 50.00 253.00 647.68 1.00 0.3968 344.08 243.60 128.00 715.68 243.60 60.00 303.60 647.68 1.00 0.4758 293.48 284.20 128.00 705.68 284.20 70.00 354.20 647.68 1.00 0.5548 242.88 324.80 128.00 695.68 324.80 80.00 404.80 647.68 1.00 0.6338 192.28 365.40 128.00 685.68 365.40 90.00 455.40 647.68 1.00 0.7028 141.68 406.00 128.00 675.68 406.00 100.00 506.00 647.68 1.00 0.7818 91.08 446.60 128.00 665.68 446.60 110.00 556.60 647.68 1.00 0.86
8 40.48 487.20 128.00 655.68 487.20 120.00 607.20 647.68 1.00 0.940 0.00 519.68 128.00 647.68 519.68 128.00 647.68 647.68 1.00 1.00
American Call Gain per Guar-
anteed Bu.
Adjusted APH
Indemnity
Yield Adjusted
Asian CallAmerican Call Gain
Combined Revenue
Yield Indemnity
Combined Revenue
Combined Yield &
Call RA-HPO
Indemnity
Yield Adjusted
Asian Call Gain per Guar-
anteeed Bu.

30
Define Yield for GRIP/GRPDefine Yield for GRIP/GRP
http://www.rma.usda.gov/FTP/Policies/2005/ra/PDF/http://www.rma.usda.gov/FTP/Policies/2005/ra/PDF/05102co.pdf05102co.pdf
““Expected county yield - The yield Expected county yield - The yield contained in the actuarial documents, on contained in the actuarial documents, on which your coverage for the crop year is which your coverage for the crop year is based. This yield is determined using based. This yield is determined using historical NASS county average yields, historical NASS county average yields, as as adjusted by FCICadjusted by FCIC.”.”
““Payment yield - The yield determined by Payment yield - The yield determined by FCIC based on NASS yields for each FCIC based on NASS yields for each insurable crop’s type and practice, insurable crop’s type and practice, as as adjusted by FCICadjusted by FCIC, and used to determine , and used to determine whether an indemnity will be due.”whether an indemnity will be due.”

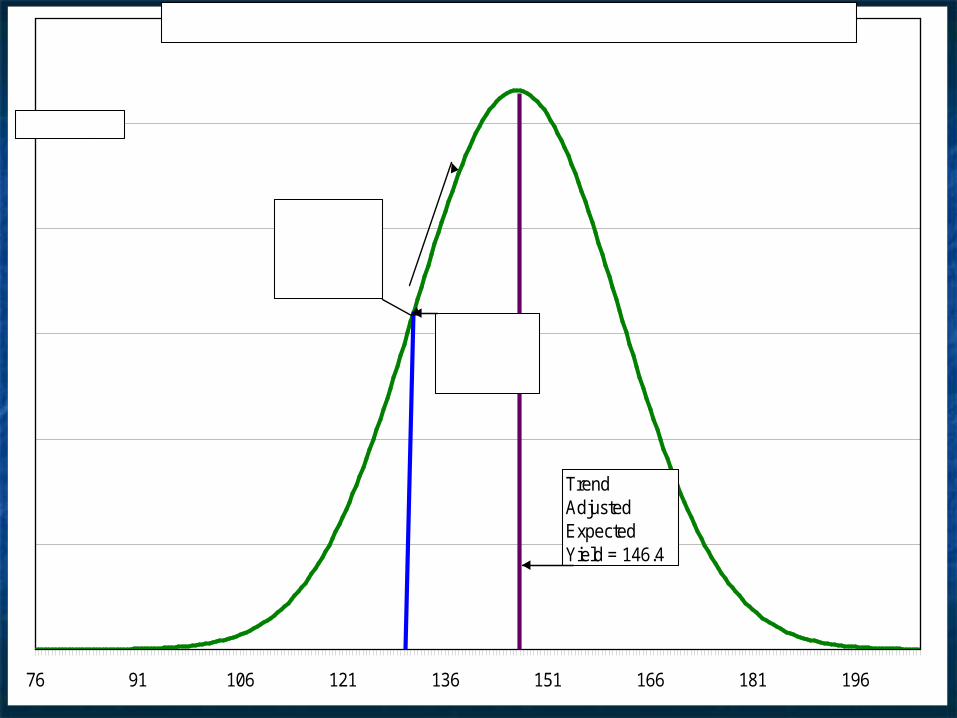
76 91 106 121 136 151 166 181 196
CORN YIELD DISTRIBUTION (with 90% GRIP-HRO)
Probability

76 91 106 121 136 151 166 181 196
Trend Adjusted Expected Yield = 146.4
CORN YIELD DISTRIBUTION (with 90% GRIP-HRO)
Probability

76 91 106 121 136 151 166 181 196
Trend Adjusted Expected Yield = 146.4
CORN YIELD DISTRIBUTION (with 90% GRIP-HRO)
Probability

76 91 106 121 136 151 166 181 196
Trend Adjusted Expected Yield = 146.4
CORN YIELD DISTRIBUTION (with 90% GRIP-HRO)
Probability
Guaranteed Bushels = 131.8 bu.

76 91 106 121 136 151 166 181 196
Trend Adjusted Expected Yield = 146.4
CORN YIELD DISTRIBUTION (with 90% GRIP-HRO)
Probability
Guaranteed Bushels = 131.8 bu.
Asian Put @ GRIP guaranteed bushels
76 91 106 121 136 151 166 181 196
Trend Adjusted Expected Yield = 146.4
CORN YIELD DISTRIBUTION (with 90% GRIP-HRO)
Probability
Guaranteed Bushels = 131.8 bu.
Asian Put @ GRIP guaranteed bushels

76 91 106 121 136 151 166 181 196
Trend Adjusted Expected Yield = 146.4
CORN YIELD DISTRIBUTION (with 90% GRIP-HRO)
Probability
Guaranteed Bushels = 131.8 bu.
Asian Put @ GRIP guaranteed bushels

38
Yield Adjusted Asian Put vs. Yield Adjusted Asian Put vs. American Put In GRIPAmerican Put In GRIP
Set GRP and GRIP Price Election equal at: $4.06American Put Option Strike set a: $4.06Harvest Price Declines by $1.00 $3.06Expected County Yield 146.490% Crop Insurance Coverage Trigger Yield 131.8
(All values are Gross with no premium deduction and no basis adjustment for cash price)
CountyYield Sales
132 403.31 0.00 146.40 549.71 0.00 146.40 146.40 549.71 1.00 1.00
Price Adjusted
GRP Indemnity
Yield Adjusted
Asian Put Gain per
Guar-anteeed
Bu.
Combined Yield &
Put GRIP
Indemnity
American Put Gain
per Guar-anteed
Bu.
Yield Adjusted
Asian PutAmerican Put Gain
Combined Revenue
Yield Indemnity
Combined Revenue

39
Yield Adjusted Asian Put vs. Yield Adjusted Asian Put vs. American Put In GRIPAmerican Put In GRIP
Set GRP and GRIP Price Election equal at: $4.06American Put Option Strike set a: $4.06Harvest Price Declines by $1.00 $3.06Expected County Yield 146.490% Crop Insurance Coverage Trigger Yield 131.8
(All values are Gross with no premium deduction and no basis adjustment for cash price)
CountyYield Sales
172 $525.71 $0.00 $146.40 $672.11 $0.00 $10.44 $10.44 $536.15 $1.00 $0.07162 495.11 0.00 146.40 641.51 0.00 44.43 44.43 539.54 1.00 0.30152 464.51 0.00 146.40 610.91 0.00 78.42 78.42 542.93 1.00 0.54142 433.91 0.00 146.40 580.31 0.00 112.41 112.41 546.32 1.00 0.77132 403.31 0.00 146.40 549.71 0.00 146.40 146.40 549.71 1.00 1.00
Price Adjusted
GRP Indemnity
Yield Adjusted
Asian Put Gain per
Guar-anteeed
Bu.
Combined Yield &
Put GRIP
Indemnity
American Put Gain
per Guar-anteed
Bu.
Yield Adjusted
Asian PutAmerican Put Gain
Combined Revenue
Yield Indemnity
Combined Revenue

Yield Adjusted Asian Put vs. Yield Adjusted Asian Put vs. American Put In GRIPAmerican Put In GRIP
Set GRP and GRIP Price Election equal at: $4.06American Put Option Strike set a: $4.06Harvest Price Declines by $1.00 $3.06Expected County Yield 146.490% Crop Insurance Coverage Trigger Yield 131.8
(All values are Gross with no premium deduction and no basis adjustment for cash price)
CountyYield Sales
172 $525.71 $0.00 $146.40 $672.11 $0.00 $10.44 $10.44 $536.15 $1.00 $0.07162 495.11 0.00 146.40 641.51 0.00 44.43 44.43 539.54 1.00 0.30152 464.51 0.00 146.40 610.91 0.00 78.42 78.42 542.93 1.00 0.54142 433.91 0.00 146.40 580.31 0.00 112.41 112.41 546.32 1.00 0.77132 403.31 0.00 146.40 549.71 0.00 146.40 146.40 549.71 1.00 1.00122 372.71 45.10 146.40 564.21 45.10 135.29 180.39 553.10 1.00 1.03112 342.11 90.19 146.40 578.70 90.19 124.18 214.38 556.49 1.00 0.94102 311.51 135.29 146.40 593.20 135.29 113.08 248.37 559.88 1.00 0.86
91.8 280.91 180.39 146.40 607.70 180.39 101.97 282.36 563.27 1.00 0.7781.8 250.31 225.49 146.40 622.20 225.49 90.86 316.35 566.66 1.00 0.6971.8 219.71 270.58 146.40 636.69 270.58 79.75 350.34 570.05 1.00 0.6161.8 189.11 315.68 146.40 651.19 315.68 68.65 384.33 573.44 1.00 0.5251.8 158.51 360.78 146.40 665.69 360.78 57.54 418.32 576.83 1.00 0.4441.8 127.91 405.88 146.40 680.18 405.88 46.43 452.31 580.22 1.00 0.3531.8 97.31 450.97 146.40 694.68 450.97 35.32 486.30 583.60 1.00 0.2721.8 66.71 496.07 146.40 709.18 496.07 24.21 520.29 586.99 1.00 0.1811.8 36.11 541.17 146.40 723.68 541.17 13.11 554.28 590.38 1.00 0.10
0 0.00 594.38 146.40 740.78 594.38 0.00 594.38 594.38 1.00 0.00
Price Adjusted
GRP Indemnity
Yield Adjusted
Asian Put Gain per
Guar-anteeed
Bu.
Combined Yield &
Put GRIP
Indemnity
American Put Gain
per Guar-anteed
Bu.
Yield Adjusted
Asian PutAmerican Put Gain
Combined Revenue
Yield Indemnity
Combined Revenue

76 91 106 121 136 151 166 181 196
Asian Call @ zero yield
Trend Adjusted Expected Yield = 146.4
CORN YIELD DISTRIBUTION (with 90% GRIP-HRO)
Probability
Guaranteed Bushels = 131.8 bu.
Asian Put @ GRIP guaranteed bushels

76 91 106 121 136 151 166 181 196
Asian Call @ zero yield
Trend Adjusted Expected Yield = 146.4
CORN YIELD DISTRIBUTION (with 90% GRIP-HRO)
Probability
Guaranteed Bushels = 131.8 bu.
Asian Put @ GRIP guaranteed bushels

Yield Adjusted Asian Call vs. Yield Adjusted Asian Call vs. American Call In GRIPAmerican Call In GRIP
Set GRP and GRIP Price Election equal at: $4.06American Call Option Strike set a: $4.06Harvest Price Increases by $1.00 $5.06HRO Adjustedment Factor 1.25Expected County Yield 146.490% Crop Insurance Coverage Insurable Yield 131.8
(All values are Gross with no premium deduction and no basis adjustment for cash price)
CountyYield Sales
0 0.00 594.38 $146.40 740.78 594.38 $146.40 $740.78 740.78 1.00 1.00
Yield Adjusted
Asian Call Gain per Guar-
anteeed Bu.
Combined Yield &
Call GRIP
Indemnity
American Call Gain per Guar-
anteed Bu.
Price Adjusted
GRP Indemnity
Yield Adjusted
Asian CallAmerican Call Gain
Combined Revenue
Yield Indemnity
Combined Revenue

Yield Adjusted Asian Call vs. Yield Adjusted Asian Call vs. American Call In GRIPAmerican Call In GRIP
Set GRP and GRIP Price Election equal at: $4.06American Call Option Strike set a: $4.06Harvest Price Increases by $1.00 $5.06HRO Adjustedment Factor 1.25Expected County Yield 146.490% Crop Insurance Coverage Insurable Yield 131.8
(All values are Gross with no premium deduction and no basis adjustment for cash price)
CountyYield Sales
172 $869.31 $0.00 $146.40 $1,015.71 $0.00 $0.00 $0.00 $869.31 $1.00 $0.00162 818.71 0.00 $146.40 965.11 0.00 $0.00 $0.00 818.71 1.00 0.00152 768.11 0.00 $146.40 914.51 0.00 $0.00 $0.00 768.11 1.00 0.00142 717.51 0.00 $146.40 863.91 0.00 $0.00 $0.00 717.51 1.00 0.00132 666.91 0.00 $146.40 813.31 0.00 $0.00 $0.00 666.91 1.00 0.00122 616.31 45.10 $146.40 807.81 45.10 $11.11 $56.21 672.51 1.00 0.08112 565.71 90.19 $146.40 802.30 90.19 $22.22 $112.41 678.12 1.00 0.15102 515.11 135.29 $146.40 796.80 135.29 $33.32 $168.62 683.72 1.00 0.23
91.8 464.51 180.39 $146.40 791.30 180.39 $44.43 $224.82 689.33 1.00 0.3081.8 413.91 225.49 $146.40 785.80 225.49 $55.54 $281.03 694.93 1.00 0.3871.8 363.31 270.58 $146.40 780.29 270.58 $66.65 $337.23 700.54 1.00 0.4661.8 312.71 315.68 $146.40 774.79 315.68 $77.75 $393.44 706.14 1.00 0.5351.8 262.11 360.78 $146.40 769.29 360.78 $88.86 $449.64 711.75 1.00 0.6141.8 211.51 405.88 $146.40 763.78 405.88 $99.97 $505.85 717.35 1.00 0.6831.8 160.91 450.97 $146.40 758.28 450.97 $111.08 $562.05 722.96 1.00 0.7621.8 110.31 496.07 $146.40 752.78 496.07 $122.19 $618.26 728.56 1.00 0.8311.8 59.71 541.17 $146.40 747.28 541.17 $133.29 $674.46 734.17 1.00 0.91
0 0.00 594.38 $146.40 740.78 594.38 $146.40 $740.78 740.78 1.00 1.00
Yield Adjusted
Asian Call Gain per Guar-
anteeed Bu.
Combined Yield &
Call GRIP
Indemnity
American Call Gain per Guar-
anteed Bu.
Price Adjusted
GRP Indemnity
Yield Adjusted
Asian CallAmerican Call Gain
Combined Revenue
Yield Indemnity
Combined Revenue

45
In a recent CARD paper, Dr. Babcock In a recent CARD paper, Dr. Babcock states; “Also, because GRIP bases its states; “Also, because GRIP bases its guarantee levels on long-term trend guarantee levels on long-term trend yields, two or three consecutive years of yields, two or three consecutive years of low yields in a county have no impact on a low yields in a county have no impact on a farmer’s guarantees.” farmer’s guarantees.”
Is that true?Is that true?
GRIP & Multiple Year LossesGRIP & Multiple Year Losses
Source: Bruce Babcock, “Farm Policy Amid High Prices: Which Direction Will We Source: Bruce Babcock, “Farm Policy Amid High Prices: Which Direction Will We Take?”, Iowa State University, Take?”, Iowa State University, http://www.card.iastate.edu/iowa_ag_review/fall_06/article1.aspxhttp://www.card.iastate.edu/iowa_ag_review/fall_06/article1.aspx
46
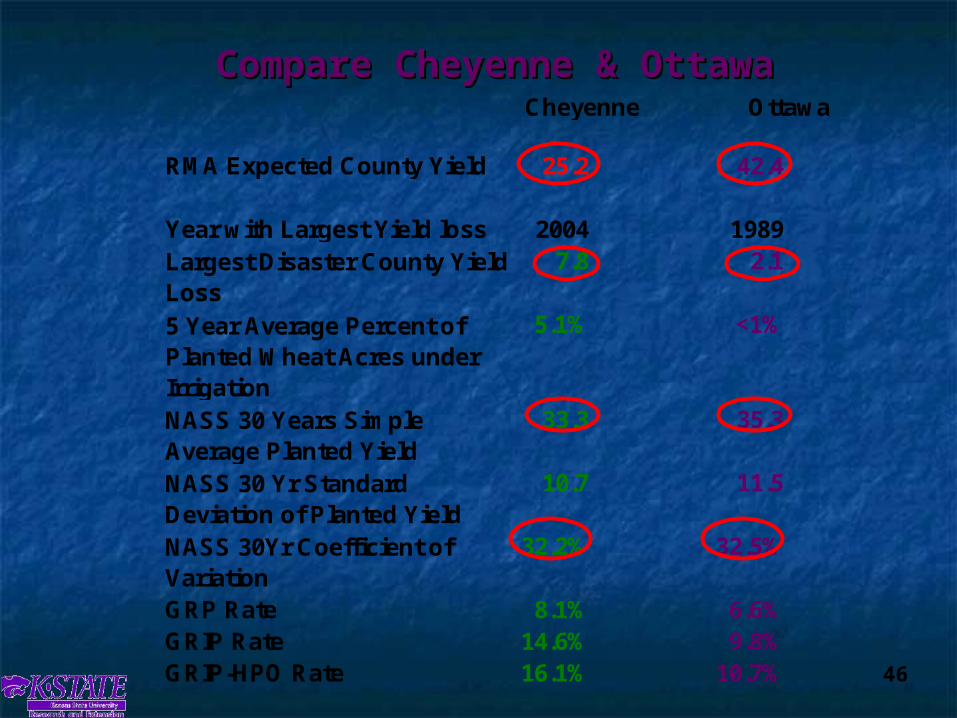
Compare Cheyenne & OttawaCompare Cheyenne & Ottawa
25.2 42.4
2004 19897.8 2.1
5.1% <1%
33.3 35.3
10.7 11.5
32.2% 32.5%
GRP Rate 8.1% 6.6%GRIP Rate 14.6% 9.8%GRIP-HPO Rate 16.1% 10.7%
RMA Expected County Yield
NASS 30 Years Simple Average Planted YieldNASS 30 Yr Standard Deviation of Planted Yield
Year with Largest Yield lossLargest Disaster County Yield Loss5 Year Average Percent of Planted Wheat Acres under Irrigation
Cheyenne Ottawa
NASS 30Yr Coefficient of Variation
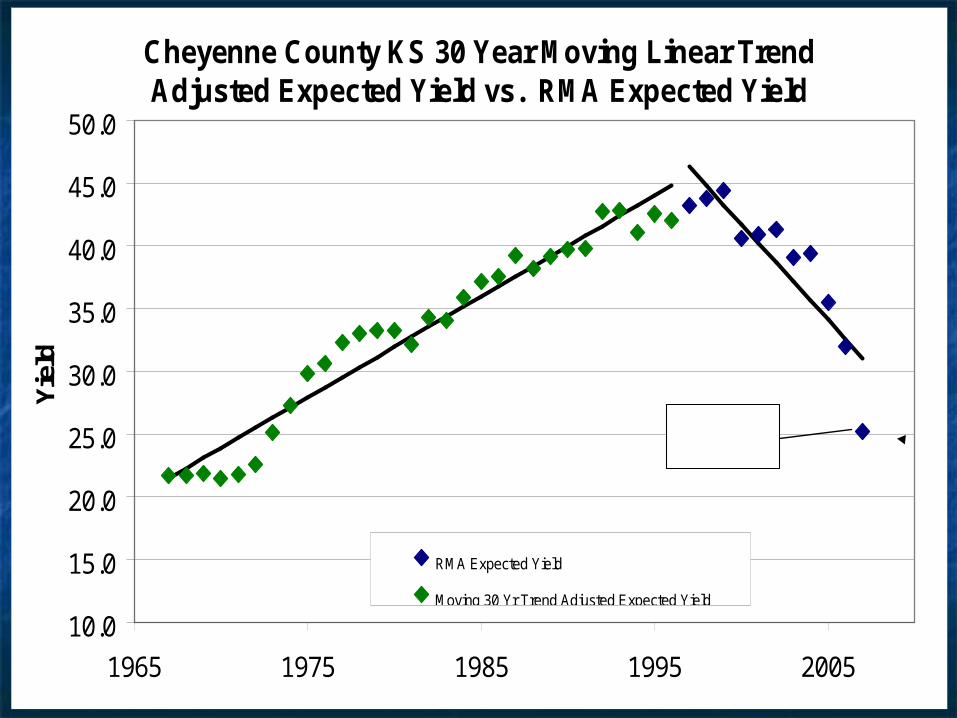
Cheyenne County KS 30 Year Moving Linear Trend Adjusted Expected Yield vs. RMA Expected Yield
10.0
15.0
20.0
25.0
30.0
35.0
40.0
45.0
50.0
1965 1975 1985 1995 2005
Yie
ld
RMA Expected Yield
Moving 30 Yr Trend Adjusted Expected Yield
RMA 2007 Expected County Yield

Ottawa County KS 30 Year Moving Linear Trend Adjusted Expected Yield vs. RMA Expected Yield
10.0
15.0
20.0
25.0
30.0
35.0
40.0
45.0
50.0
1965 1975 1985 1995 2005
Yie
ld
RMA Expected Yield
Moving 30 Yr Trend Adjusted Expected Yield
RMA 2007 Expected County Yield

49
Example Case FarmExample Case Farm
90% 85% 80% GRP$123,000 $107,000 $90,000 (20,000 Bu Yield)
$44,000 $24,000 $0 (50,000 Bu Yield)
$0 $0 $0 (100,000 Bu Yield)
90% 85% 80% GRIP-HERO$207,000 $194,000 $178,000 (20,000 Bu Yield)
$139,000 $122,000 $102,000 (50,000 Bu Yield)
$19,000 $0 $0 (100,000 Bu Yield)

50
Example Case FarmExample Case Farm
90% 85% 80% GRP$140,000 $125,000 $108,000 (20,000 Bu Yield)
$116,000 $100,000 $81,000 (50,000 Bu Yield)
$0 $0 $0 (100,000 Bu Yield)
90% 85% 80% GRIP-HERO$221,000 $208,000 $194,000 (20,000 Bu Yield)
$201,000 $187,000 $171,000 (50,000 Bu Yield)
$49,000 $27,000 $1,000 (100,000 Bu Yield)

51
Example Case FarmExample Case Farm
90% 85% 80% GRP$68,000 $49,000 $27,000 (20,000 Bu Yield)
$0 $0 $0 (50,000 Bu Yield)
$0 $0 $0 (100,000 Bu Yield)
90% 85% 80% GRIP-HERO$76,000 $54,000 $30,000 (20,000 Bu Yield)
$0 $0 $0 (50,000 Bu Yield)
$0 $0 $0 (100,000 Bu Yield)
52
SummarySummary
Trend yield method that sets Trend yield method that sets expected county yield is the key for expected county yield is the key for GRP and GRIP.GRP and GRIP.
Yield basis risk, high correlation with Yield basis risk, high correlation with farm yield reduces basis risk.farm yield reduces basis risk.
A farm level yield variance that is less A farm level yield variance that is less than county level yield variance than county level yield variance reduces basis risk.reduces basis risk.
Purchase of the 1.5 GRIP/GRP scalar Purchase of the 1.5 GRIP/GRP scalar reduces basis risk.reduces basis risk.

53
Thank YouDR. G. A. “ART” BARNABY, JR.KANSAS STATE UNIVERSITY
PHONE: 785-532-1515EMAIL: [email protected]
Check out our WEB page athttp://www.AgManager.Info


![Barnaby bear visits_china[1]](https://static.fdocuments.in/doc/165x107/55bff02cbb61eb73428b473d/barnaby-bear-visitschina1-55c29acf8e5e8.jpg)

![Barnaby bear visits_china[1]-1](https://static.fdocuments.in/doc/165x107/54b3040e4a7959680b8b465c/barnaby-bear-visitschina1-1.jpg)