0LVVRXULV 9HWHUDQV - University of Missouri
18
Missouri's Veterans: A Demographic and Workforce Overview February 2019
Transcript of 0LVVRXULV 9HWHUDQV - University of Missouri

Missouri's Veterans: A Demographic and Workforce Overview
February 2019

Missouri’s Veterans: A Demographic and Workforce Overview February 2019
Executive Highlights
Missouri’s veteran population
• In 2017, Missouri was home to almost 425,000 veterans. This population represented roughly 9.1 percent of the total state population 18 years and older—a figure higher than the national average (7.7 percent).
o Just over half of Missouri veterans are of working age (ages 18 to 64), a figure consistent with the national average for veterans.
o Roughly 84,000 Missouri veterans are aged 55 to 64; this represents almost 40 percent of the state’s working age veterans.
• Missouri’s veterans have higher median annual incomes ($35,216) than non-veterans ($27,565). • Almost one-third (32 percent) of Missouri’s veterans have some form of disability, compared to
16 percent of non-veterans.
Veteran business-owners
• Based on the Survey of Business Owners, Veteran non-employer businesses represented about 13.2% of all Missouri self-employed firms.
• According to the Annual Survey of Entrepreneurs, veterans own and operate approximately 8,200 Missouri firms; another 4,400 firms have a veteran/nonveteran co-owner partnership.
o Combined, these 12,600 firms represent roughly 11 percent of all Missouri-based firms—a figure above the national average of 9.5 percent.
• Missouri’s veteran-owned businesses are most commonly found in industries such as Professional, Scientific, and Technical Services; Healthcare and Social Assistance; and Construction.
Veteran job seekers
• Among the nearly 63,000 individual veteran jobseekers that sought DWD services between April 2012 and November 2018, the vast majority were slightly older, more diverse, and primarily male relative to the jobseeker population at large.
• Most veterans (60 percent) that applied for employment services indicated that they served four years or less, and another 22 percent noted service times of 5 to 8 years.
• 62 percent of Missouri workers (aged 25-64) have some post-secondary education, but only 30 percent of veteran jobseekers have a post-secondary education.
o Approximately 1 in 6 veteran jobseekers have at least a 4-year degree • Veterans from the US Army and US Navy account for 49 and 20 percent of Missouri’s veteran
jobseekers, respectively. • Just over half of the individual, Missouri-based jobseekers sought employment opportunities in
male-dominated occupations that do not often require post-secondary education. o One in five veteran jobseekers sought Construction, Installation, Maintenance, and
Repair (CIMR) occupations.

Missouri’s Veterans: A Demographic and Workforce Overview February 2019
• In those instances where applicants provided job history information, 47 percent sought a job in an occupation similar to what they had held in the past.
• Jobseekers who are open to shifting careers could provide a source of workers for the state’s critical and growing occupations, but they are often interested in slowing growing, less in-demand occupations (e.g., production).
o Healthcare-related occupations will represent 18 percent of Missouri’s net new jobs between 2016 and 2026, but less than 5 percent of veteran jobseekers sought jobs in healthcare.
• Higher demand occupations such as Construction, Installation, Maintenance and Repair, and Healthcare-related occupations tend to be tied to locally-serving industries. Demand for these occupations will primarily be found in the parts of the state experiencing population growth (e.g., Kansas City and Springfield), and this can pose challenges for veteran jobseekers in Missouri’s more rural, slower growing regions.
• Veteran jobseekers are found throughout Missouri, but in most instances the number of veteran jobseekers is proportionate to the size of the county’s population; the greatest number of veteran jobseekers were in St. Louis and Jackson counties—Missouri’s first and second largest counties, respectively.
• Veteran jobseekers are also highly concentrated in areas near the state’s military bases; Pulaski County—home of Fort Leonard Wood—had the 6th most veteran jobseekers, but was only the state’s 22nd largest county by population in 2017.

1
Missouri’s Veterans: A Demographic and Workforce Overview February 2019
Missouri's Veterans: A Demographic and Workforce Overview1
The US Military is an important driver of Missouri’s state economy. In FY2015, military spending accounted for approximately 5 percent ($14 billion) of Missouri’s $261 billion economy.2 Beyond the direct and indirect spending, the state benefits from the workforce contributions of its veteran population. Veterans possess several key soft skills—basic leadership experience, working within organizational structures, and learning new processes and procedures—that many Missouri employers need from their workforce. There are numerous federal and state resources available to help veterans transition from active duty service into the civilian workforce.3 These programs provide assistance in a number of areas, including:
• Employment (e.g., Missouri Job Centers, On-The-Job Training, Hire Vets, and Veteran-Owned Business resources),
• Education (e.g., Veteran Educational Programs, GI Bill services, Missouri Returning Heroes Education Act resources, and University of Missouri Veteran Center),
• Healthcare and support activities (e.g., Missouri Veteran’s Commission, Veteran Service Offices, Veteran Affairs Facilities, Veterans Crisis Line, and Mental Health Resources), and
• Housing and residency (e.g., Housing Loans for Qualified Veterans, Benefits for Veterans and Military Personnel, USO of Missouri, Tax, License and DMV information).
Not all veterans take advantage, or are even aware, of all the resources—both veteran-specific and for the population at large—that are available to provide assistance. Better connecting veterans to these resources not only benefits the veteran, but stronger engagement of this key groups of workers benefits the state’s overall workforce. In fact, the 2017 Task Force on Agriculture and Rural Prosperity Report4 identified the need to connect veterans to underutilized training programs as a key element in supporting the country’s rural workforce. A better understanding of the veteran population, and particularly their contributions to the state’s economy and workforce, can help state and local service providers strengthen their engagement and expand their outreach with the state’s veterans.
This report examines the characteristics of Missouri’s veteran population by using a variety of publically available data sources, as well as information drawn from the applications of veteran jobseekers who sought employment services.5 First, we review the demographic characteristics of Missouri’s overall veteran population. Second, we consider veteran business owners and the types of activities in which
1 The authors of this report include Dr. Mark C. White from University of Missouri Extension’s Labor and Workforce Development program, and Ms. Kristin Arnette and Mr. Alan Spell from the Missouri Economic Research and Information Center. Please direct questions to Dr. White ([email protected]). 2 For more information, see An Assessment of the Economic Impact of Military Spending in Missouri. (https://military.ded.mo.gov/sites/military/files/Economic_Impact_Report.pdf) 3 A more comprehensive listing of programs, and links to those resources can be found on the State of Missouri’s website: www.mo.gov/veterans. 4 Report to the President of the United States from the Task Force on Agriculture and Rural Prosperity, chaired by US Secretary of Agriculture Sonny Purdue, October 2017. 5 Missouri Division of Workforce Development provided these records to the Missouri Economic Research and Information Center (MERIC), which in turn took steps to de-identify the applicants. Once these records were anonymized, MERIC shared the data with MU Extension for analysis.

2
Missouri’s Veterans: A Demographic and Workforce Overview February 2019
they are most likely to engage. Third, we provide a detailed analysis of veteran jobseekers within the State of Missouri. We conclude by highlighting a number of the key findings and identifying areas that require more investigation.
Missouri’s veteran population tends to be older, more likely to have a high school degree, and has higher rates of disability
The number of veterans located in any one geographic area can help to inform the nature and extent of the products, services, and employment investment and incentives it provides to its veterans. Figure 1 shows each state’s veteran population as a share of its total population (age 18+). In 2017, Missouri was home to almost 425,000 veterans. This population represented roughly 9.1 percent of the total state population 18 years and older, higher than the national average of 7.7 percent.6 This places Missouri among the 20 states with the greatest share of veterans.
Missouri’s veteran population represents all branches of the armed services and spans over seven decades of decorated service. According to the American Community Survey (2013-2017), the majority (37.7 percent) of Missouri’s veterans served during the Vietnam era, another 17.8 percent served during Gulf War I (1990-2001), 14.4 percent served during Gulf War II (2001 or later), 9.6 percent served during the Korean War period, and 4.7 percent served during World War II.
6 Data from the US Census Bureau’s 2013-2017 American Community Survey, Table S2101.
Figure 1: Veterans as a percent of total population (Age 18+)
3
Missouri’s Veterans: A Demographic and Workforce Overview February 2019
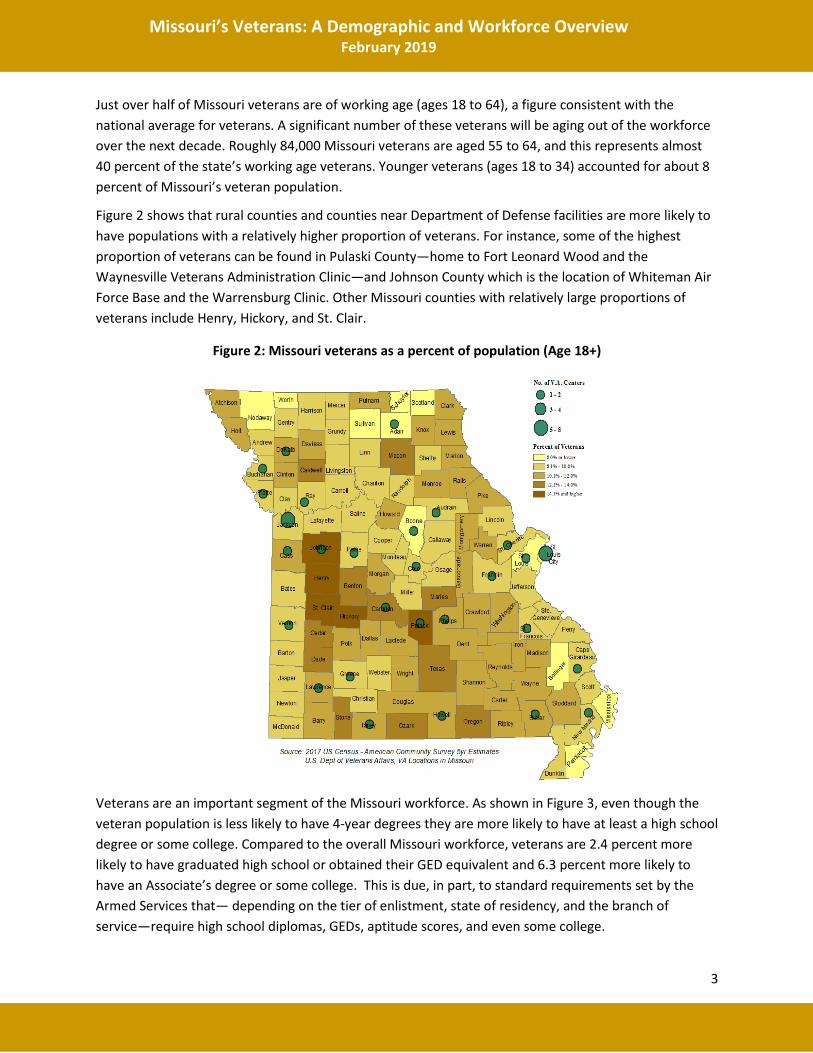
Just over half of Missouri veterans are of working age (ages 18 to 64), a figure consistent with the national average for veterans. A significant number of these veterans will be aging out of the workforce over the next decade. Roughly 84,000 Missouri veterans are aged 55 to 64, and this represents almost 40 percent of the state’s working age veterans. Younger veterans (ages 18 to 34) accounted for about 8 percent of Missouri’s veteran population.
Figure 2 shows that rural counties and counties near Department of Defense facilities are more likely to have populations with a relatively higher proportion of veterans. For instance, some of the highest proportion of veterans can be found in Pulaski County—home to Fort Leonard Wood and the Waynesville Veterans Administration Clinic—and Johnson County which is the location of Whiteman Air Force Base and the Warrensburg Clinic. Other Missouri counties with relatively large proportions of veterans include Henry, Hickory, and St. Clair.
Veterans are an important segment of the Missouri workforce. As shown in Figure 3, even though the veteran population is less likely to have 4-year degrees they are more likely to have at least a high school degree or some college. Compared to the overall Missouri workforce, veterans are 2.4 percent more likely to have graduated high school or obtained their GED equivalent and 6.3 percent more likely to have an Associate’s degree or some college. This is due, in part, to standard requirements set by the Armed Services that— depending on the tier of enlistment, state of residency, and the branch of service—require high school diplomas, GEDs, aptitude scores, and even some college.
Figure 2: Missouri veterans as a percent of population (Age 18+)

4
Missouri’s Veterans: A Demographic and Workforce Overview February 2019
Missouri’s veterans have higher median annual incomes ($35,216) than non-veterans ($27,565), and are also less likely to live in poverty than non-veterans.7 These higher average earnings than the general population are consistent with veterans nationwide, and may be due in part to the fact that veterans tend to be older, male and have somewhat higher base levels of education.8
However, one key difference between veterans and non-veterans is that veterans are almost twice as likely to have some kind of disability. Almost one-third (32 percent) of Missouri veterans have some form of disability, compared to 16 percent of non-veterans. While the severity of these disabilities will vary, some may present real barriers to employment and without the proper accommodation, it may hinder their ability to fully participate in the labor force.
7 US Census Bureau, 2013-2017 American Community Survey, Table S2101. 8 Farrigan, T. “Veterans are positioned to contribute economically to rural communities”, Amber Waves, US Department of Agriculture, Economic Research Service, September, 5 2017.
Figure 3: Veteran Educational Attainment in Missouri
8.1%
33.0%
35.7%
23.2%
11.1%
30.6%29.4% 28.7%
0%
10%
20%
30%
40%
Less than H.S. H.S. Graduate-or-Equivalent
Some College-or-Associates
Bachelors Degree orHigher
Perc
ent P
opul
atio
n (A
ge 1
8+)
Veterans Non-Veterans
Source: US Census Bureau, 2013-2017 American Community Survey, S21003
5
Missouri’s Veterans: A Demographic and Workforce Overview February 2019
Veterans represent a significant share of Missouri’s business-owners
Veterans also make important contributions to the Missouri economy and workforce through their entrepreneurial efforts. Veteran-owned businesses not only potentially create more employment opportunities for other veterans, but their veteran status can also prove advantageous in securing federal contracting opportunities.
Two important Census surveys help to record information on veteran business owners, the Survey of Business Owners and Self-Employed Persons (SBO) and the Annual Survey of Entrepreneurs (ASE). The SBO is a five-year release that captures both employer and non-employer based firms. The ASE is an annual release and focuses primarily on firms with employees.
SBO Veteran business owners
“The Survey of Business Owners and Self-Employed Persons (SBO) provides the only comprehensive source of information on selected economic and demographic characteristics for businesses and business owners by gender, ethnicity, race, and veteran status.”9
According to the US Census Bureau’s 2012 Survey of Business Owners and Self-Employed Persons10, veterans who owned or co-owed an employer-based business accounted for approximately 13,600 firms, representing about 12.8% of all Missouri-based firms in 2012. Veterans who owned or co-owned a non-employer-based (self-employed) business accounted for approximately 50,900 firms, or about 13.2% of all Missouri non-employer based firms in 2012. It is important, however, not to combine these figures due to data overlap that is known to occur through reporting.
The Census Bureau obtains electronic files from the Internal Revenue Service of companies reporting business activity on tax forms submitted in the survey year.11 Overlap occurs when employer firms file with the IRS as both self-employed and incorporated employer-based, making it difficult to ascertain which of the self-employed figures also represent employer-based businesses.
ASE Veterans who own employer-based businesses
“The Annual Survey of Entrepreneurs (ASE) provides annual data on select economic and demographic characteristics of businesses with employees and their owners by gender, ethnicity, race, and veteran status. The ASE supplements the Survey of Business Owners and Self-Employed Persons (SBO). The ASE, however, has significant differences that affect the comparability between the two programs. Conducting the ASE allows for a more frequent collection of economic and demographic characteristics data.”12
9 About the Data, US Census Survey of Business Owners https://factfinder.census.gov/faces/affhelp/jsf/pages/metadata.xhtml?lang=en&type=survey&id=survey.en.SBO_SBO 10 2012 Survey of Business Owners, U.S. Census Table: CSA02 11 About the Data, US Census Survey of Business Owners https://factfinder.census.gov/faces/affhelp/jsf/pages/metadata.xhtml?lang=en&type=survey&id=survey.en.SBO_SBO 12 About the Data, US Census Annual Survey of Entrepreneurs https://factfinder.census.gov/faces/affhelp/jsf/pages/metadata.xhtml?lang=en&type=program&id=program.en.ASE

6
Missouri’s Veterans: A Demographic and Workforce Overview February 2019
According to the US Census Bureau’s 2016 Annual Survey of Entrepreneurs, veterans own and/or operate approximately 8,200 Missouri-based firms; another 4,400 firms have a veteran/nonveteran co-owner partnership. Combined, these 12,600 firms represent roughly 11 percent of all Missouri-based firms—a figure above the national average of 9.5 percent.
These 12,600 veteran-led, and co-led, businesses account for almost 138,000 jobs that pay an annual average of over $34,000. Figure 4 shows that veteran-owned businesses are most commonly found in industries such as Professional, Scientific, and Technical Services; Healthcare and Social Assistance; and Construction. Among firms with veteran part-owners the common industries include Construction; Retail Trade; Accommodation and Food Services; Other Services; Real Estate; and Professional, Scientific, and Technical Services.
Figure 4: Veteran Business Ownership in Missouri by Sector
0 200 400 600 800 1,000 1,200 1,400
Mgmt of companies
Natural Resources
Industries not classified
Information
Educational services
Arts, ent., & rec.
Real estate
Transport & warehousing
Manufacturing
Accom. & food services
Other services
Wholesale trade
Admin. & waste mgmt
Retail trade
Finance & insurance
Construction
Healthcare & soc assist.
Prof., sci., & tech. services
Number of firms by industry (2016)
Veteran Owned
Veteran Part-Owner
Source: US Census Bureau, 2016 Annual Survey of Entrepreneurs
7
Missouri’s Veterans: A Demographic and Workforce Overview February 2019
Veteran job seekers can help address workforce needs in a tight labor market
In addition to starting businesses, veterans also provide Missouri with an important source of workers. At the most basic level, military experience can provide veterans with important soft skills related to leadership, teamwork and the ability to learn new processes and procedures that many employers seek. As a result, connecting veteran jobseekers to available job opportunities may represent an important way in which Missouri employers can address their workforce needs in a tight labor market.
The demographic characteristics described above are necessary, but not entirely sufficient for better designing services that address workforce needs. The following analysis helps to better understand the characteristics of veteran jobs seekers that are already making use of the Missouri Division of Workforce Development’s (DWD) services. For the purposes of this analysis, veteran jobseekers are defined as applicants and/or recipients of DWD services who indicated some form of veteran status. These veteran jobseekers demonstrate their availability and willingness to work by seeking DWD assistance. Understanding the characteristics of these jobseekers is a critical first step in strengthening the programs designed to prepare them for, and connect them to, job opportunities.
This analysis considers the demographic characteristics of veteran jobseekers that sought DWD services between April 2012 and November 2018, and whom indicated some form of veteran status.13 The sample provided included 96,844 application records from 67,460 unique individuals.14 Roughly 93 percent (62,748) of these individuals lived within the State of Missouri; the other 7 percent (4,731 individuals) lived outside of Missouri, primarily in bordering counties. This analysis focuses primarily on the population of individual veteran jobseekers that resided in Missouri.
Veteran jobseekers largely mirror Missouri’s male jobseekers
Demographic characteristics show that veteran jobseekers are slightly older and more diverse and—reflective of the general military population—primarily male. Men accounted for almost 87 percent of Missouri-based veteran jobseekers. Veteran jobseekers also tend to be more ethnically and racially diverse than Missouri’s overall workforce. According to the American Community Survey15, 84 percent of the Missouri workforce was white but this figure was somewhat smaller amongst veteran jobseekers (76 percent). Most veterans (60 percent) that applied for employment services indicated that they served four years or less, and another 22 percent noted service times of 5 to 8 years. Consequently, the majority of veteran jobseekers did not make the military a career. Given that the enlistment period for many veterans occurs in the years immediately after high school, there are disproportionately few veterans under the age of 25 relative to the jobseeker population more generally.16
13 As noted in an earlier footnote, MERIC took steps to de-identify the applicants and only shared these data with MU Extension once the records were anonymized. 14 Individuals can apply for DWD services on multiple occasions. In this same, 11,958 individuals applied for DWD services on multiple occasions. To avoid double counting these individuals, we only considered information from just one of their application records. 15 2013-2017 American Community Survey, Employment Status (S2301). 16 In order to anonymize the individual records, MERIC removed specific birthdays but kept birth years. As a result, information about jobseekers age is based on their age at the end of 2018. This is also a multiyear sample of jobseekers, so we do not have the jobseeker’s age at the time they applied for DWD services.
8
Missouri’s Veterans: A Demographic and Workforce Overview February 2019
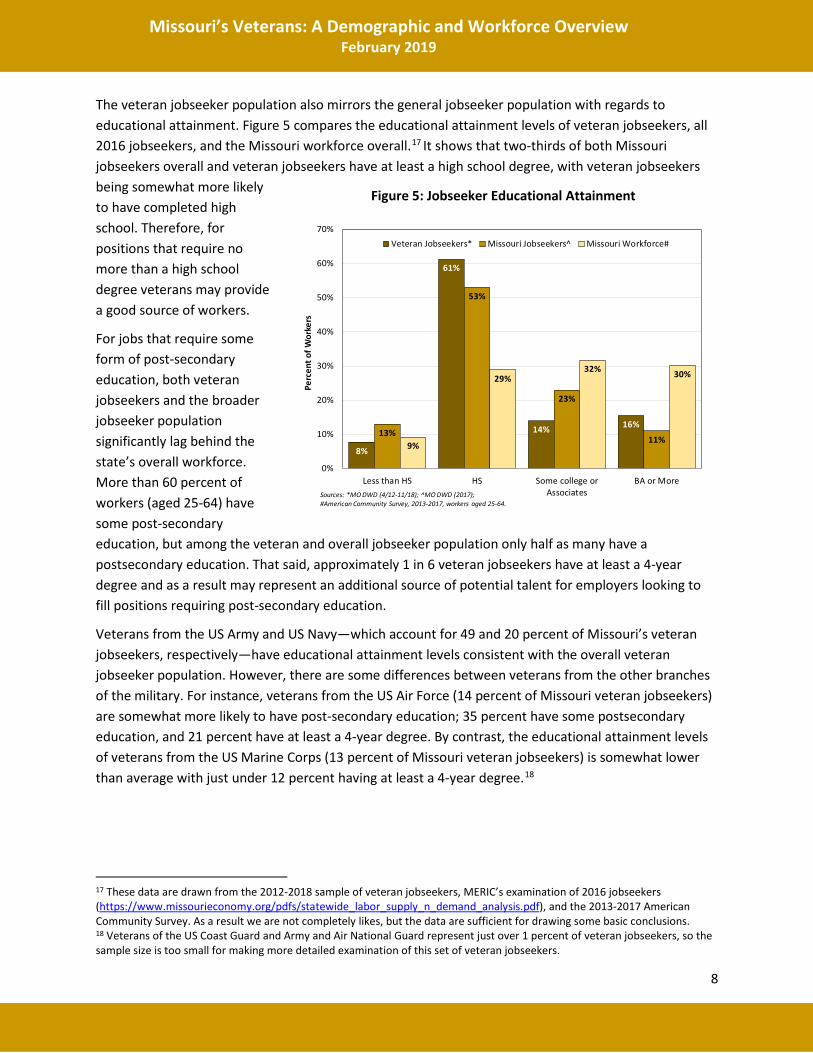
The veteran jobseeker population also mirrors the general jobseeker population with regards to educational attainment. Figure 5 compares the educational attainment levels of veteran jobseekers, all 2016 jobseekers, and the Missouri workforce overall.17 It shows that two-thirds of both Missouri jobseekers overall and veteran jobseekers have at least a high school degree, with veteran jobseekers being somewhat more likely to have completed high school. Therefore, for positions that require no more than a high school degree veterans may provide a good source of workers.
For jobs that require some form of post-secondary education, both veteran jobseekers and the broader jobseeker population significantly lag behind the state’s overall workforce. More than 60 percent of workers (aged 25-64) have some post-secondary education, but among the veteran and overall jobseeker population only half as many have a postsecondary education. That said, approximately 1 in 6 veteran jobseekers have at least a 4-year degree and as a result may represent an additional source of potential talent for employers looking to fill positions requiring post-secondary education.
Veterans from the US Army and US Navy—which account for 49 and 20 percent of Missouri’s veteran jobseekers, respectively—have educational attainment levels consistent with the overall veteran jobseeker population. However, there are some differences between veterans from the other branches of the military. For instance, veterans from the US Air Force (14 percent of Missouri veteran jobseekers) are somewhat more likely to have post-secondary education; 35 percent have some postsecondary education, and 21 percent have at least a 4-year degree. By contrast, the educational attainment levels of veterans from the US Marine Corps (13 percent of Missouri veteran jobseekers) is somewhat lower than average with just under 12 percent having at least a 4-year degree.18
17 These data are drawn from the 2012-2018 sample of veteran jobseekers, MERIC’s examination of 2016 jobseekers (https://www.missourieconomy.org/pdfs/statewide_labor_supply_n_demand_analysis.pdf), and the 2013-2017 American Community Survey. As a result we are not completely likes, but the data are sufficient for drawing some basic conclusions. 18 Veterans of the US Coast Guard and Army and Air National Guard represent just over 1 percent of veteran jobseekers, so the sample size is too small for making more detailed examination of this set of veteran jobseekers.
Figure 5: Jobseeker Educational Attainment
8%
61%
14% 16%13%
53%
23%
11%9%
29%32% 30%
0%
10%
20%
30%
40%
50%
60%
70%
Less than HS HS Some college orAssociates
BA or More
Perc
ent o
f Wor
kers
Veteran Jobseekers* Missouri Jobseekers^ Missouri Workforce#
Sources: *MO DWD (4/12-11/18); ^MO DWD (2017); #American Community Survey, 2013-2017, workers aged 25-64.

9
Missouri’s Veterans: A Demographic and Workforce Overview February 2019
Veteran jobseekers often pursue male-dominated occupations, but not always growth occupations
The types of jobs that veteran jobseekers pursue reflect the demographic characteristics discussed above. Just over half of the individual, Missouri-based jobseekers sought employment opportunities in male-dominated occupations that do not often require post-secondary education. One in five veteran jobseekers sought Construction, Installation, Maintenance, and Repair (CIMR) occupations, as shown in Figure 6.19 Similarly, 17.5 percent of veteran jobseekers wanted to pursue production jobs (primarily found in the manufacturing sector), and 15.5 percent sought Transportation and Material Moving occupations like truck driving. Not only do men tend to fill these occupations, but these occupations often do not require post-secondary education. Over 75 percent of the veteran jobseekers pursuing work in these occupations had no more than a high school degree.
The most commonly sought white collar jobs were in Management and Office Support (17.6 percent), but only about a third of those veteran jobseekers sought management-related occupations. Veteran jobseekers with at least a bachelor’s degree sought a variety of different types of occupations. For instance, 59 percent of the veteran jobseekers pursuing Education, Training and Library occupations had at least a 4-year degree. Similarly, 56 and 53 percent of veteran jobs seekers seeking jobs in Community and Social Services and Life, Physical and Social Sciences, respectively, had at least a 4-year degree.
In some instances, veteran jobseekers provided information about their job history.20 In those instances where applicants provided job history information, 47 percent sought a job in an occupation similar to what they had held in the past. Figure 7 shows that this was highest for veteran jobseekers that had previously worked in Construction, Installation, Maintenance and Repair, Management, Science and Technology, and Transportation and Material Moving. Veteran jobseekers that had previously worked in typically lower-skill, lower-wage service occupations, like Sales and Food Service, were less likely to pursue employment opportunities in those occupations.
19 Appendix A provides greater detail about the occupations included in each of these occupational groups. 20 Not all applicants for workforce services offered information about their work history. As a result, this information draws from the 26,256 records (27 percent of the records) where this information was provided.
Figure 6: Occupations sought by Jobseekers
Occupations soughtIndividuals w/ Veteran
Status% Total
% All Jobseekers
(2016)Construction, Installation, Maintenance, and Repair 12,629 20.1% 14.3%Management and Office Support 11,059 17.6% 28.3%Production 10,983 17.5% 12.6%Transportation and Material Moving 9,700 15.5% 8.6%Other Services 3,995 6.4% 6.2%Business & Sales 3,840 6.1% 9.9%Healthcare & Related 2,743 4.4% 9.8%Science & Technology 2,693 4.3% 3.3%Food Service 1,589 2.5% 6.9%No data 3,226 5.1% ndMilitary Occupations 291 0.5% ndGrand Total 62,748 100.0% 100.0%Source: Missouri Dept. of Workforce Development, MERIC

10
Missouri’s Veterans: A Demographic and Workforce Overview February 2019
It is important to note that more than half of applicants were interested in employment opportunities in different fields. With career counseling and additional training and education, these jobseekers could provide a source of workers for the state’s critical and growing occupations. However, these data show that these veteran jobseekers are not always interested in moving into fast-growing occupations. For instance, more than 1 in 6 veteran jobseekers wanted to pursue jobs in production-related occupations. However, according to MERIC’s occupational projections Missouri is expected to experience a net decline in production jobs between 2016 and 2026.21 There will still be demand for people to work in production occupations particularly to replace an aging workforce, but given continued globalization of production and increased use of automation, the number of net new production-related job opportunities is projected to decline.
By contrast, more veteran jobseekers sought employment opportunities in CIMR than in any other occupational group. This makes sense given that, much like the overall veteran jobseeker population, workers in CIMR occupations are overwhelmingly male22 and this occupational group is projected to grow over the next decade. According to the MERIC occupational projections, CIMR occupations will account for almost 10 percent of Missouri’s net new jobs between 2016 and 2026. However, CIMR occupations are also projected to contribute 18 percent of the net new jobs that typically require no more than a high school degree. Moreover, workers can earn stronger wages as they gain experience and training in occupations like the construction trades.
Nevertheless, there are other high-demand occupational groups that many veteran jobseekers are not considering by any significant level. Most notably, healthcare-related occupations will represent 18 percent of Missouri’s net new jobs between 2016 and 2026, but less than 5 percent of veteran jobseekers sought jobs in healthcare. The healthcare profession primarily attracts women23, but this should not preclude more men from considering employment in healthcare fields because they are
21 MERIC produces 10 year occupational projections on a biannual basis for the state and its regions. These projections are available here: https://www.missourieconomy.org/occupations/occ_proj.stm 22 The 2013-2017 American Community Survey (S2401) shows that 97 percent of Missouri’s CIMR workforce is male. 23 Women account for almost 78 percent of Missouri’s healthcare occupations according to the 2013-2017 American Community Survey (S2401).
Figure 7: Veteran jobseeker occupational preferences relative to past work history
Business & Sales
CIMRFood
ServiceHealthcare & Related
Mgmt & Office
Support
Other Services
ProductionScience & Tech
Transport. & Material Moving
Grand Total
Business & Sales 30.2% 8.8% 1.4% 4.8% 32.9% 4.1% 8.0% 3.4% 6.3% 100.0%CIMR 3.1% 54.7% 2.0% 1.8% 8.3% 3.3% 12.0% 4.5% 10.3% 100.0%Food Service 6.0% 12.2% 36.8% 3.9% 13.6% 4.4% 10.0% 3.2% 9.8% 100.0%Healthcare & Related 5.5% 4.9% 2.4% 42.4% 23.0% 4.5% 6.2% 3.6% 7.5% 100.0%Mgmt & Office Support 7.9% 7.7% 1.7% 5.4% 53.9% 4.1% 7.2% 5.4% 6.8% 100.0%Other Services 7.5% 11.6% 1.8% 5.3% 17.3% 34.3% 8.8% 6.0% 7.5% 100.0%Production 3.0% 16.5% 1.8% 1.6% 9.6% 3.5% 48.3% 5.5% 10.2% 100.0%Science & Tech 4.1% 7.7% 0.4% 2.2% 16.0% 3.6% 7.7% 55.2% 3.1% 100.0%Trans. & Material Moving 2.4% 15.1% 1.3% 1.6% 9.1% 2.8% 14.9% 2.8% 50.0% 100.0%Grand Total 6.9% 19.6% 3.2% 5.7% 21.4% 5.9% 15.0% 7.8% 14.5% 100.0%Source: Missouri Department of Workforce DevelopmentLight gray cells indicate less than 100 records
Occupation Sought
Occupation History

11
Missouri’s Veterans: A Demographic and Workforce Overview February 2019
significant sources of future job growth. Moreover, 56 percent of net new jobs that require more than a high school degree, but less than a 4-year degree, will be in healthcare-related occupations. As a result, they represent a significant source of opportunity for veteran jobseekers who may consider pursuing additional postsecondary education and training.
It is important to note that both CIMR and Healthcare-related occupations tend to be tied to locally-serving industries. As a result, demand for these occupations will primarily be found in the parts of the state experiencing population growth—namely urban areas like Kansas City and Springfield. Veterans who live in slow-growth part of the state may therefore experience job-seeking difficulties within these fields. The uneven distribution of job opportunities within the state can create some challenges for connecting veteran jobseekers to job opportunities, particularly in the state’s more rural and economically distressed regions. The next section considers some of the geographic trends among veteran jobseekers.
Veteran jobseekers are found throughout the state, but are most concentrated around the state’s military installations.
Veteran jobseekers can be found in every county in Missouri, and in most instances the number of veteran jobseekers is proportionate to the size of the county’s population. The greatest number of veteran jobseekers were in St. Louis and Jackson counties—the state’s first and second largest counties,
respectively. However, there are a number of counties where this is not the case. Not surprisingly, Pulaski County—home of Fort Leonard Wood—had the 6th most veteran jobseekers, but was only the state’s 22nd largest county by population in 2017. Neighboring Laclede County had the 22nd most veteran jobseekers, although only the 33rd ranked county by population. Further south, Taney County had the 13th most veteran jobseekers, but was only the state’s 20th largest county.
Figure 8 shows the relative concentration of veteran jobseekers by county within
Figure 8: Relative Concentration of Missouri’s Veteran Jobseekers (2012-2018)

12
Missouri’s Veterans: A Demographic and Workforce Overview February 2019
the State of Missouri.24 Consistent with the above findings, the greatest concentration of veteran jobseekers can be found around Fort Leonard Wood, where the concentration of veteran jobseekers in Pulaski County was almost four times greater than the state, and in Laclede County it was nearly twice as great. Around Whiteman Air Force Base, the relative concentration in Henry County was twice the state average and in Johnson (home of Whiteman AFB) and Pettis counties there were almost 60 percent more veteran jobseekers relative to the state. Other areas with higher than average concentration are found in Southwest Missouri (including the Springfield, Joplin, and Branson areas), as well as a number of rural counties in Southeast Missouri.
Differences in veteran jobseekers geographically tend to reflect the broader differences amongst Missouri regions. For instance, the greatest proportion of veteran jobseekers with at least a 4-year degree are in the same areas (e.g., suburban St. Louis and Kansas City) with the highest overall levels of educational attainment. Figure 9 shows the occupations sought by veteran jobseekers in Missouri’s different workforce areas.25 Some of the key regional differences (by workforce area) are highlighted below.
• Veteran jobseekers express interest in Production occupations across the state but this interest varies between regions, ranging as high as 29 percent of veteran jobseekers in the Southwest region to under 14 percent in the Central region.
• The areas where veteran jobseekers had the greatest interest in Management and Office Support occupations is in urban areas that have the most employment opportunities in professional and business services; over 21 percent of veteran jobseekers in the St. Louis and Kansas City areas sought Management and Office Support occupations.
• Roughly one out of every five veteran jobseekers expressed interest in CIMR occupations; the greatest relative interest was north of Interstate 70 in the Northwest (24.2 percent of veteran jobseekers) and Northeast (23.6 percent of veteran jobseekers) areas.
24 The location quotients here show the concentration of veteran jobseekers relative to the state average. 25 For the purposes of this table, the St. Louis Workforce Development Boards—St. Louis City, St. Louis County, St. Charles, Jefferson/Franklin Consortium—have been combined.
Figure 9: Occupations sought by veteran jobseeker in Missouri workforce regions
Occupation Group CentralKansas City & Vicinity
North East
North West
OzarkSouth
CentralSouth East
South West
St. Louis Area WDBs
West Central
Missouri
CIMR 20.6% 18.7% 23.6% 24.2% 20.6% 22.2% 23.4% 18.9% 17.7% 22.7% 20.1%Mgmt & Office Support 18.0% 21.5% 13.7% 12.5% 17.2% 12.4% 11.6% 13.2% 21.6% 13.2% 17.6%Production 13.7% 14.3% 20.4% 22.6% 15.0% 21.5% 23.4% 29.2% 15.5% 20.3% 17.5%Trans. & Material Moving 13.9% 15.7% 16.5% 16.9% 15.8% 18.0% 17.9% 15.7% 14.7% 14.1% 15.5%Other Services 8.0% 6.1% 6.9% 6.3% 6.9% 5.9% 6.3% 4.5% 5.8% 6.7% 6.4%Business & Sales 5.6% 6.0% 4.8% 4.0% 7.1% 4.7% 5.5% 5.1% 7.4% 5.2% 6.1%Healthcare & Related 5.2% 4.4% 3.4% 3.4% 5.0% 4.5% 3.7% 3.3% 4.4% 4.4% 4.4%Science & Tech 3.7% 5.9% 3.1% 2.8% 3.5% 3.3% 2.3% 2.7% 5.9% 3.1% 4.3%Food Service 3.1% 2.3% 1.7% 2.0% 2.9% 2.4% 2.0% 2.1% 2.8% 1.7% 2.5%Military Occupations 0.6% 0.6% 0.5% 0.7% 0.4% 0.4% 0.3% 0.2% 0.4% 0.8% 0.5%No Data 7.7% 4.6% 5.2% 4.8% 5.5% 4.7% 3.7% 5.1% 3.8% 7.9% 5.1%Total 100.0% 100.0% 100.0% 100.0% 100.0% 100.0% 100.0% 100.0% 100.0% 100.0% 100.0%Source: Missouri Dept. of Workforce Development, MERIC
13
Missouri’s Veterans: A Demographic and Workforce Overview February 2019
Concluding thoughts
Missouri’s veteran population makes significant contributions to the state’s workforce and economy. Located throughout the state, veterans represent over 9 percent of the state’s population (age 18+). They are found in large numbers in the state’s population centers and have high relative geographic concentrations around Fort Leonard Wood and Whiteman Air Force Base. In addition to their contributions to the civilian workforce, veterans either own or co-own 12,600 Missouri businesses (11 percent of all firms) that support almost 138,000 jobs.
Expanded use of workforce services will enable Missouri’s veterans to make even greater contributions to the state’s economy and workforce. This analysis showed that the veteran jobseeker tends to be reflective of the male jobseeker population both in terms of demographic characteristics, as well as the types of occupations sought. A relatively greater share of veteran jobseekers have at least a high school degree, making them a relatively good pool of candidates to draw from for jobs that do not requires extensive post-secondary education.
Given that veteran jobseekers are disproportionately male, they tend to look for job opportunities in male-dominated occupations related to Production; Transportation and Material Moving; Construction; and Installation, Maintenance and Repair. For jobseekers with the right training and experience there are opportunities in all of these occupational groups, however, the number of those opportunities will vary by occupation and location. For instance, many veteran jobseekers want jobs in production-related occupations, but there are projected to be 4,000 fewer production jobs in 2026 than there was in 2016. By contrast, demand for jobs in CIMR occupations is projected to grow over the next decade, but that demand is typically tied to population growth. As a result, these opportunities will most likely be found in the state’s more urban and faster growing counties. A greater emphasis on sharing information about growth occupations can help veteran jobseekers make more informed decisions about how to use workforce training resources so that they can better prepare themselves for their respective region’s more in-demand occupations.
This analysis increases our knowledge about the characteristics of Missouri’s veteran and veteran jobseeker population. However, there are several other research areas that will allow Missouri to maximize contributions that veterans can make to the state’s economy and workforce. For instance, the data presented above can give some indication of a veteran’s work history and preferred occupations. However, greater information about the hard or technical skills they acquired during their period of service would enable workforce service providers to better connect veterans to job opportunities upon exiting the military. Better understanding of what they did in the military might also help explain their occupational preferences. For instance, many veterans seek jobs in CIMR occupations because that is what they did as part of their service.
Missouri is also not the only place looking to attract and retain talented veterans. For instance, places like the Hampton Roads in Virginia actively try to attract exiting military personnel from its many military installations with the hope of keeping them in the region once they are no longer serving.26 Home Base Iowa is a program that connects veterans and transitioning military to Iowa-based businesses looking to
26 http://www.vcwhamptonroads.org/veterans-services/

14
Missouri’s Veterans: A Demographic and Workforce Overview February 2019
hire skilled workers.27 Representatives from the state of Wisconsin have been even more aggressive in attracting exiting military by traveling to military bases across the country to promote Wisconsin-based job opportunities.28 Therefore, identifying potential best practices for attracting and retaining exiting military and connecting them to training, education and job opportunities provides another potential avenue for future investigation.
Finally, another line of potential future research might examine the workforce challenges and opportunities facing military spouses who can also make important contributions to the state’s workforce. Military spouses can be an important source of workers and talent, particularly in the often-rural areas that house military installations. However, many face significant challenges in finding work, not from a lack of skills and training, but rather differences in state licensing requirements can pose real barriers for military spouses looking for work, particularly for those involved in fields like healthcare. Better understanding of these challenges will allow Missouri to take advantage of the skill, training and talent living in and around places like Fort Leonard Wood and Whiteman Air Force Base.
27 https://www.homebaseiowa.gov/ 28 https://inwisconsin.com/veterans/

15
Missouri’s Veterans: A Demographic and Workforce Overview February 2019
Appendix A: Occupational Groups
For the purposes of this analysis, occupations with similar attributes were grouped into 8 ‘Job Fields’. Five other major occupational groups—Legal; Education, Training & Library; Arts, Design, Entertainment & Media; Protective Service; and Farming, Fishery, & Forestry were grouped into a category of “Other Services”. This typology is consistent with previous MERIC studies.
Job Fields Major Occupational Group SOC Code
Business & Sales Business & Financial Operations 13-0000
Sales & Related 41-0000
Construction, Installation, Maintenance & Repair
Building & Grounds Cleaning & Maintenance 37-0000
Construction & Extraction 47-0000
Installation, Maintenance, & Repair 49-0000
Food Service Food Preparation & Serving 35-0000
Healthcare & Related Community & Social Service 21-0000
Healthcare Practitioners & Technical 29-0000
Healthcare Support 31-0000
Personal Care & Service 39-0000
Management & Office Support
Management 11-0000
Office & Administrative Support 43-0000
Production Production 51-0000
Science & Technology Computer & Mathematical 15-0000
Architecture & Engineering 17-0000
Life, Physical & Social Sciences 19-0000
Transportation & Material Moving
Transportation & Material Moving 53-0000
Other services Legal 23-0000
Education, Training, & Library 25-0000
Arts, Design, Entertainment, Sports, & Media 27-0000
Protective Service 33-0000
Farming, Fishery, & Forestry 45-0000