Different Usage of the Glycosaminoglycan-Attachment Sites of ...

Supplementary Information
for
Glycosaminoglycan mimetic peptide nanofiber gel as an osteoinductive scaffold
Gulistan Tansika, Erden Kilicb, Mustafa Betera, Bahtiyar Demiralpc, Gullu Kiziltas Sendurd,e, Nuray Canf, Huseyin Ozkanf, Elif Ergula, Mustafa O. Gulera,*, Ayse B. Tekinaya,*
Fig. S1. Liquid chromatogram and mass spectrum of GAG-PA. (A) RP-HPLC chromatogram of
GAG-PA, the change of response units with respect to time at 220 nm. (B) Mass spectrometry
of GAG-PA. [M-H]- (calculated): 1225.59 [M-H]-(observed): 1224.66, [M-2H]-2/2 (calculated):
611.79 [M-2H]-2/2(observed): 611.83 [M-3H]-3/3 (calculated): 407.53 [M-3H]-3/3 (observed):
407.55.
Fig. S2. Liquid chromatogram and mass spectrum of E-PA. A) RP-HPLC chromatogram of E-PA,
the change of response units with respect to time at 220 nm. (B) Mass spectrometry of E-PA.
[M-H]- (calculated): 655.42 [M-H]-(observed): 654.45, [M-2H]-2/2 (calculated): 326.71 [M-2H]-
2/2(observed): 326.72.
S1
Electronic Supplementary Material (ESI) for Biomaterials Science.This journal is © The Royal Society of Chemistry 2016

Fig. S3. Liquid chromatogram and mass spectrum of K-PA. (A) RP-HPLC chromatogram of K-
PA, the change of response units with respect to time at 220 nm. (B) Mass spectrometry of K-
PA. [M+H]+ (calculated):653.48 [M+H]+ (observed): 654.47, [2M+H]+ (calculated): 1307.96
[2M+H]+ (observed): 1307.93, [M+2H]+2/2 (calculated): 327.74 [M+2H]+2/2 (observed):
327.73.
Fig. S4. FT-IR spectra of PA nanofibers. Both peptides displayed amide I peaks located in
1630–1640 cm− 1 region, suggesting β-sheet formation.
S2
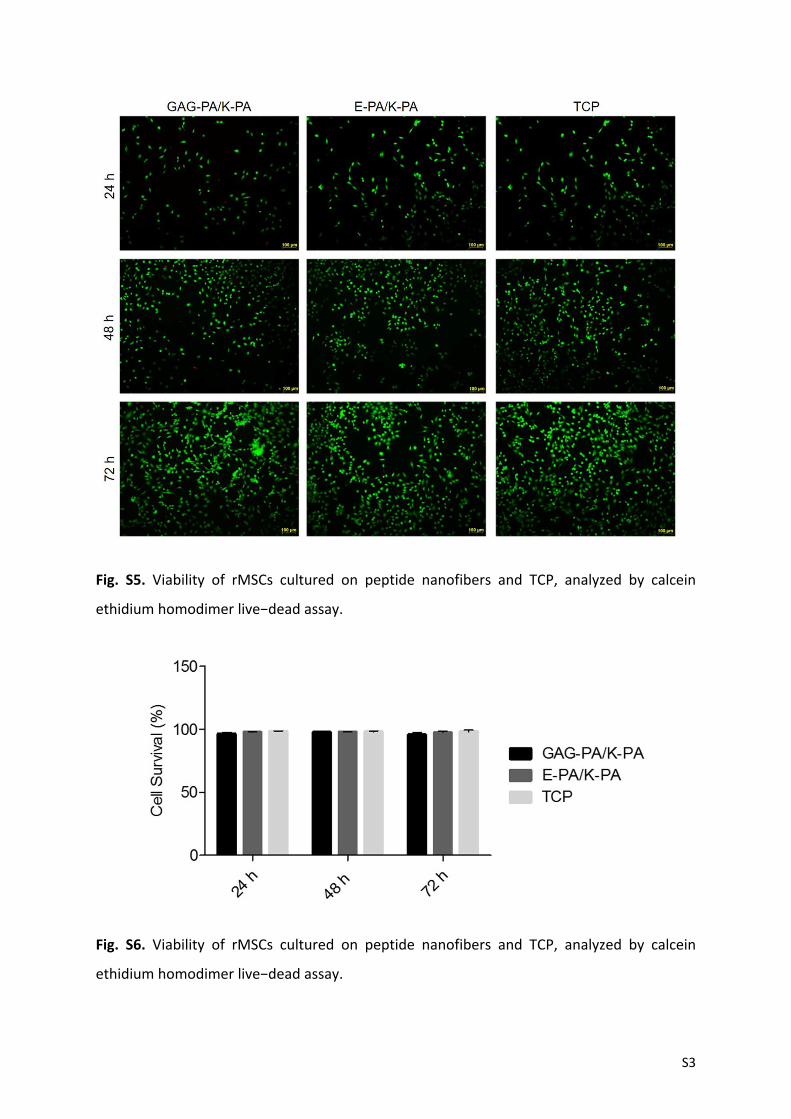
Fig. S5. Viability of rMSCs cultured on peptide nanofibers and TCP, analyzed by calcein
ethidium homodimer live−dead assay.
Fig. S6. Viability of rMSCs cultured on peptide nanofibers and TCP, analyzed by calcein
ethidium homodimer live−dead assay.
S3

Fig. S7. F-actin filaments stained with phalloidin (green) showing actin networks formed by
rMSCs on PA nanofibers and TCP. Nuclei were stained with TO-PRO-3 reagent (blue). Scale
bars are 20 μm.
Fig. S8. Histological evaluation of rabbit tibial defects after 4 weeks of GAG-PA gel treatment.
Tissue sections of GAG-PA gel and physiological saline control groups were stained with H&E.
Scale bars are 100 µm. (CB: Cortical bone, W: Woven bone, L: Lamellar bone, BV: Blood
vessel).
S4