0C, 48M, 88Y, 0K original, final artwork; outlined fonts
4
SRI International offers innovative tools for modeling and analyzing genomes, metabolic pathways, and regulatory networks to support activities in drug discovery, agriculture, and biotechnology. These tools accelerate research and lead to a greater understanding of biological systems. SRI’s unique Omics Viewers support visualiza- tion and analysis of large omics datasets on genome-scale cellular network diagrams. BioCyc and Pathway Tools are freely available for academic research. The BioCyc database collection from SRI International is a set of 1,100 Pathway/Genome Databases (PGDBs) for many sequenced genomes. PGDBs describe the entire genome of an organism, as well as its biochemical pathways and (when curated) its regulatory network. New expanded releases occur twice per year. Two members of the BioCyc collection, the EcoCyc 1 and MetaCyc 2 databases, are derived from more than three decades of literature-based curation of genome and pathway data. The HumanCyc database provides a unique collection of human metabolic pathway data. The downloadable Pathway Tools software (licensed to date to more than 3,000 groups) and BioCyc databases provide many capabilities not present on the BioCyc.org Web site. APPLICATIONS OF BIOCYC AND PATHWAY TOOLS Pathway/Genome Databases are platforms for knowledge management and data analysis for organisms of critical importance for R&D activities. Genome Analysis: Predict metabolic pathways, genes coding for missing enzymes in metabolic pathways, and operons, from an annotated genome. Metabolic flux analysis: Fast generation of ux models using ux-balance analysis. Omics Data Analysis: Paint combinations of gene expression, metabolomics, and proteomics data onto a metabolic map diagram uniquely congured for each organism (Figure 1), onto a cellular regulatory network (Figure 2), and onto a genome map diagram (Figure 3). Genome Browser tracks speed analysis of ChIP-chip data and other positional data. Encyclopedic Reference: Query and display relationships among genome and pathway data. Drug Discovery: BioCyc databases facilitate discovery of new drugs through improved pathway-based target selection and validation 3 : – Target selection: Pathway Tools algorithms for nding drug targets include identifying chokepoints in the metabolic network, identifying enzymes present in multiple pathways, and identifying previously uncharacterized genes lling holes in the metabolic network – Lead generation: Extensive data on enzyme inhibitors in EcoCyc and MetaCyc – Target and lead evaluation: Improved analysis of omics data BioCyc Database Collection and Pathway Tools Software BioCyc and Pathway Tools are freely available to academic groups for research purposes. KEY CAPABILITIES OF PATHWAY TOOLS AND BIOCYC Develop a comprehensive database for mission-critical organisms Computational prediction of metabolic pathways, missing enzymes, operons Omics data analysis using genome-scale visualizations of the metabolic network, regulatory network, and genome Comparative genome analysis and comparative pathway analysis RECENT ENHANCEMENTS Flux-Balance Analysis module supports automatic generation of metabolic ux models from PGDBs Zoomable web-based navigation of metabolic map Enrichment analysis for pathways, regulons, GO terms, and metabolites Signaling pathway support PATHWAY TOOLS COMPONENTS Pathway Tools supports systems biology and computational genomics. It consists of four components: PathoLogic: Computational inference tools for predicting pathways, pathway hole llers, and operons Pathway/Genome Navigator: Supports querying, visualization, and analysis of PGDBs Pathway/Genome Editors: Interactive editing of PGDBs Flux-Balance Module “ Pathway Tools is a valuable component of our systems biology toolbox. The software allows me to integrate and visualize various types of omics data within the context of the metabolic network for the bacterial and fungal strains we employ. Further, the software provides a huge benefit in allowing us to custom-tailor Pathway/Genome Databases to our specific strain(s).” Randy Berka Director, Novozymes, Inc.
Transcript of 0C, 48M, 88Y, 0K original, final artwork; outlined fonts
SRI International offers innovative tools for modeling and analyzing genomes, metabolic pathways, and regulatory networks to support activities in drug discovery, agriculture, and biotechnology. These tools accelerate research and lead to a greater understanding of biological systems. SRI’s unique Omics Viewers support visualiza-tion and analysis of large omics datasets on genome-scale cellular network diagrams. BioCyc and Pathway Tools are freely available for academic research.
The BioCyc database collection from SRI International is a set of 1,100 Pathway/Genome Databases (PGDBs) for many sequenced genomes. PGDBs describe the entire genome of an organism, as well as its biochemical pathways and (when curated) its regulatory network. New expanded releases occur twice per year. Two members of the BioCyc collection, the EcoCyc1 and MetaCyc2 databases, are derived from more than three decades of literature-based curation of genome and pathway data. The HumanCyc database provides a unique collection of human metabolic pathway data.
The downloadable Pathway Tools software (licensed to date to more than 3,000 groups) and BioCyc databases provide many capabilities not present on the BioCyc.org Web site.
APPLICATIONS OF BIOCYC AND PATHWAY TOOLS
Pathway/Genome Databases are platforms for knowledge management and data analysis for organisms of critical importance for R&D activities.
Genome Analysis: Predict metabolic pathways, genes coding for missing enzymes in metabolic pathways, and operons, from an annotated genome.Metabolic flux analysis: Fast generation of !ux models using !ux-balance analysis.Omics Data Analysis: Paint combinations of gene expression, metabolomics, and proteomics data onto a metabolic map
for 4C flyer
original, final artwork; outlined fonts
PROJECT BIOCYC Product LogoFILE NAME BioCyc_printLogo.aiDATE 03/09/06
SRI InternationalCorporate Marketing Communications Group
CYC Family Logos
Name BioCyc Type fonts: Minion (serif ) and Myriad Pro(sans serif ) combinationColors: Black and CMYK match to RGB FF9933, or 48M, 88Y
0C, 48M, 88Y, 0K
for B&W
original, final artwork; outlined fonts
0C, 0M, 0Y, 60K
diagram uniquely con"gured for each organism (Figure 1), onto a cellular regulatory network (Figure 2), and onto a genome map diagram (Figure 3). Genome Browser tracks speed analysis of ChIP-chip data and other positional data.Encyclopedic Reference: Query and display relationships among genome and pathway data.Drug Discovery: BioCyc databases facilitate discovery of new drugs through improved pathway-based target selection and validation3: – Target selection: Pathway Tools algorithms for "nding drug
targets include identifying chokepoints in the metabolic network, identifying enzymes present in multiple pathways, and identifying previously uncharacterized genes "lling holes in the metabolic network
– Lead generation: Extensive data on enzyme inhibitors in EcoCyc and MetaCyc
– Target and lead evaluation: Improved analysis of omics data
BioCyc Database Collection and Pathway Tools Software
BioCyc and Pathway Tools are freely available to academic groups for research purposes.
KEY CAPABILITIES OF PATHWAY TOOLS AND BIOCYC
Develop a comprehensive database for mission-critical organisms
Computational prediction of metabolic pathways, missing enzymes, operons
Omics data analysis using genome-scale visualizations of the metabolic network, regulatory network, and genome
Comparative genome analysis and comparative pathway analysis
RECENT ENHANCEMENTS
Flux-Balance Analysis module supports automatic generation of metabolic !ux models from PGDBs
Zoomable web-based navigation of metabolic map
Enrichment analysis for pathways, regulons, GO terms, and metabolites
Signaling pathway support
PATHWAY TOOLS COMPONENTS
Pathway Tools supports systems biology and computational genomics. It consists of four components:
PathoLogic: Computational inference tools for predicting pathways, pathway hole "llers, and operons
Pathway/Genome Navigator: Supports querying, visualization, and analysis of PGDBs
Pathway/Genome Editors: Interactive editing of PGDBs
Flux-Balance Module
“ Pathway Tools is a valuable component of our systems biology toolbox. The software allows me to integrate and visualize various types of omics data within the context of the metabolic network for the bacterial and fungal strains we employ. Further, the software provides a huge benefit in allowing us to custom-tailor Pathway/Genome Databases to our specific strain(s).”
Randy BerkaDirector, Novozymes, Inc.
Metabolic Engineering: BioCyc databases support these activities: – Fast characterization of cellular metabolism for industrial
microorganisms – Model debugging through network reachability analysis
and identi"cation of dead-end metabolites – Tracking of alternative strain designs – Comprehensive catalog, through MetaCyc, of known
metabolic reactions and of many metabolic enzymesComparative Analyses: Comparative genome analyses and comparative pathway analysis can be performed.
THE BIOCYC DATABASE COLLECTION
Each PGDB in the BioCyc collection describes the genome and predicted metabolic network of a single organism.
EcoCyc: Pathway/Genome database for Escherichia coli K-12 MG1655. EcoCyc data were gathered during two decades of literature-based curation from more than 21,000 articles1. EcoCyc provides mini-review summaries for 3,300 E. coli genes, and descriptions of the metabolic and transcriptional regulatory networks of E. coli.HumanCyc: Developed from a computational pathway analysis of the human genome, literature-based curation of HumanCye resumed in 2009 and is ongoing.MetaCyc: Contains 1,700 metabolic pathways and 7,400 enzymes from more than 1,800 organisms. MetaCyc data and commentary were gathered from 30,000 publications to provide a comprehensive metabolic encyclopedia, particularly for microbial and plant metabolism2.
All PGDBs are structured within a rich ontology that supports computational analysis. The databases are organized into three tiers.
Tier 1 Pathway/Genome databases, EcoCyc and MetaCyc are the most extensively curated pathway DBs in the world. HumanCyc has received more than one year of curation.Tier 2 Pathway/Genome databases were computationally generated with less than one person-year of subsequent curation, and include databases for Bacillus subtilis, Agrobacterium tumefaciens, Bacillus anthracis, Francisella tularensis, Helicobacter pylori, Mycobacterium tuberculosis, Vibrio cholerae, and others.Tier 3 Pathway/Genome Databases were computationally generated with no subsequent curation. All Tier 3 PGDBs include the genome, predicted metabolic pathways, predicted pathway hole "llers (genes coding for missing enzymes in metabolic pathways) and, for bacteria, predicted operons.
PATHWAY TOOLS SOFTWARE
Pathway Tools4 provides a powerful and comprehensive set of features for querying, visualization, analysis, and curation of the PGDBs. Pathway Tools combines representation and inference techniques from arti"cial intelligence to extract additional information from genomes, and encode that information within a sophisticated ontology.
Pathway Tools can operate on the BioCyc collection of PGDBs available through SRI, and on locally created PGDBs, such as for proprietary genomes. It can also operate on more than 1,000 PGDBs created by third parties, including those listed in SRI’s Registry of Pathway/Genome Databases at http://biocyc.org/registry.html.
Querying, Visualization, and Analysis Of Pathway and Genome Databases
The Pathway/Genome Navigator runs in both a Web mode that allows publishing of a PGDB on the Internet or an intranet, and
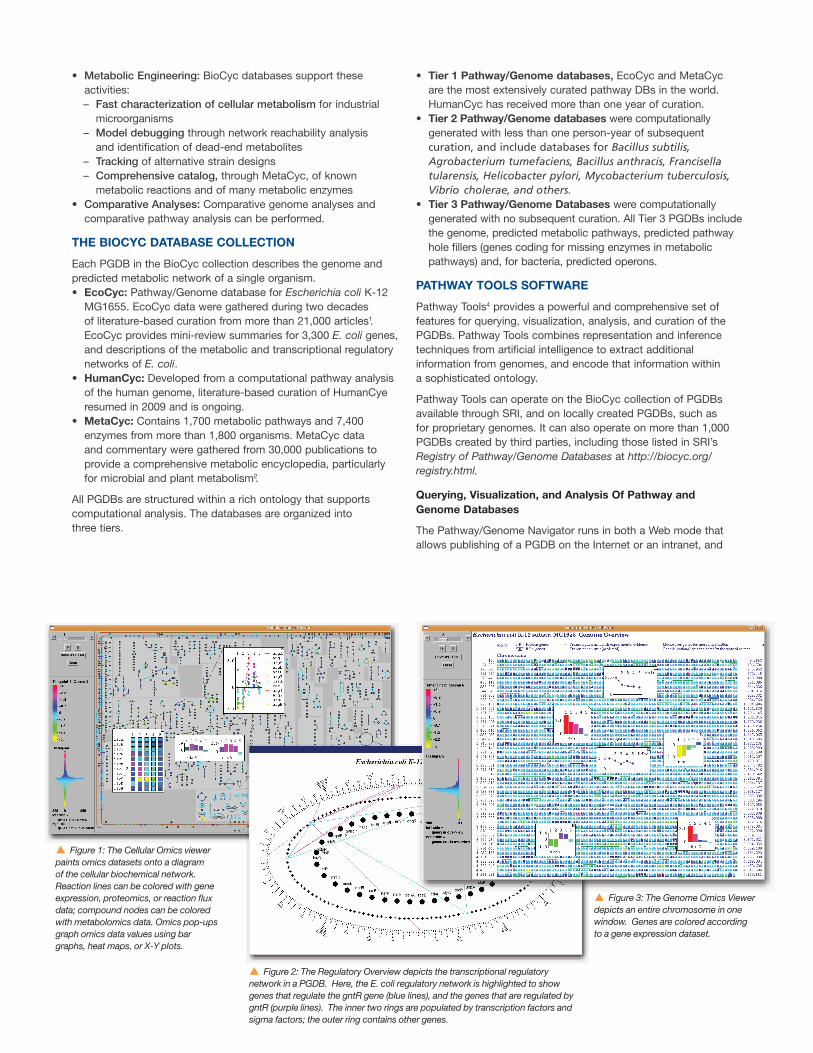
Figure 2: The Regulatory Overview depicts the transcriptional regulatory network in a PGDB. Here, the E. coli regulatory network is highlighted to show genes that regulate the gntR gene (blue lines), and the genes that are regulated by gntR (purple lines). The inner two rings are populated by transcription factors and sigma factors; the outer ring contains other genes.
Figure 1: The Cellular Omics viewer paints omics datasets onto a diagram of the cellular biochemical network. Reaction lines can be colored with gene expression, proteomics, or reaction flux data; compound nodes can be colored with metabolomics data. Omics pop-ups graph omics data values using bar graphs, heat maps, or X-Y plots.
Figure 3: The Genome Omics Viewer depicts an entire chromosome in one window. Genes are colored according to a gene expression dataset.
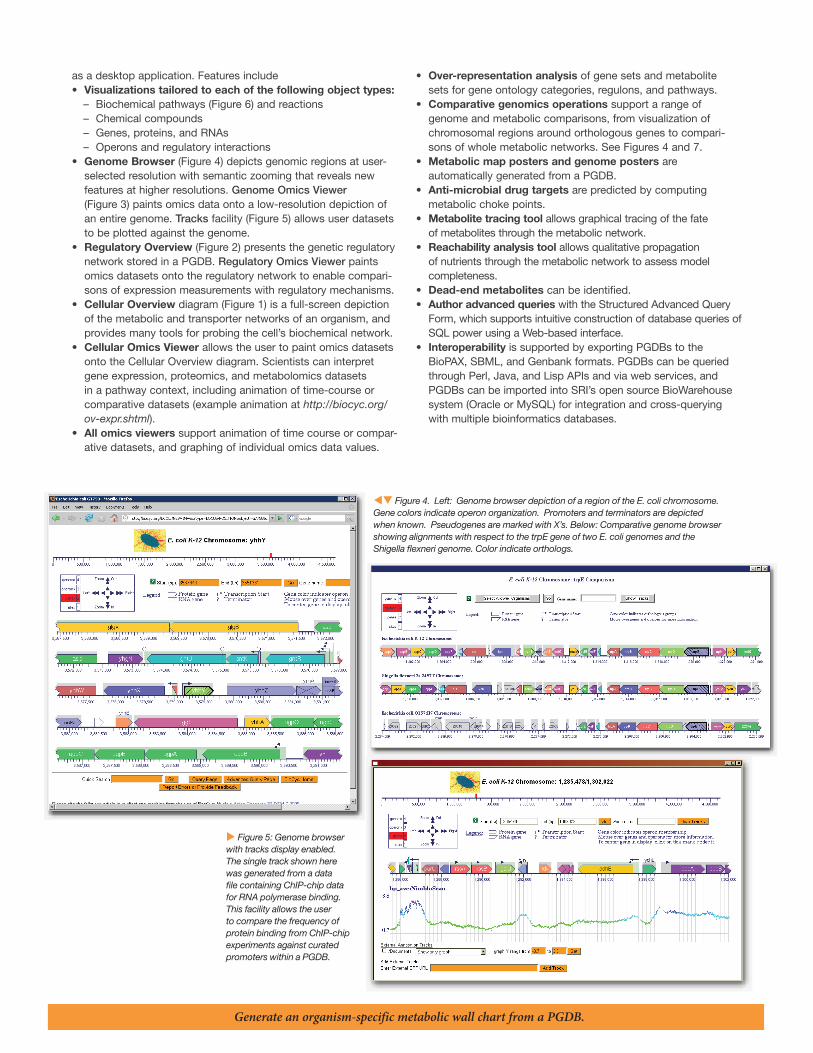
Figure 5: Genome browser with tracks display enabled. The single track shown here was generated from a data file containing ChIP-chip data for RNA polymerase binding. This facility allows the user to compare the frequency of protein binding from ChIP-chip experiments against curated promoters within a PGDB.
as a desktop application. Features includeVisualizations tailored to each of the following object types: – Biochemical pathways (Figure 6) and reactions – Chemical compounds – Genes, proteins, and RNAs – Operons and regulatory interactions
Genome Browser (Figure 4) depicts genomic regions at user-selected resolution with semantic zooming that reveals new features at higher resolutions. Genome Omics Viewer (Figure 3) paints omics data onto a low-resolution depiction of an entire genome. Tracks facility (Figure 5) allows user datasets to be plotted against the genome.Regulatory Overview (Figure 2) presents the genetic regulatory network stored in a PGDB. Regulatory Omics Viewer paints omics datasets onto the regulatory network to enable compari-sons of expression measurements with regulatory mechanisms.Cellular Overview diagram (Figure 1) is a full-screen depiction of the metabolic and transporter networks of an organism, and provides many tools for probing the cell’s biochemical network. Cellular Omics Viewer allows the user to paint omics datasets onto the Cellular Overview diagram. Scientists can interpret gene expression, proteomics, and metabolomics datasets in a pathway context, including animation of time-course or comparative datasets (example animation at http://biocyc.org/ov-expr.shtml). All omics viewers support animation of time course or compar-ative datasets, and graphing of individual omics data values.
Over-representation analysis of gene sets and metabolite sets for gene ontology categories, regulons, and pathways.Comparative genomics operations support a range of genome and metabolic comparisons, from visualization of chromosomal regions around orthologous genes to compari-sons of whole metabolic networks. See Figures 4 and 7.Metabolic map posters and genome posters are automatically generated from a PGDB.Anti-microbial drug targets are predicted by computing metabolic choke points.Metabolite tracing tool allows graphical tracing of the fate of metabolites through the metabolic network. Reachability analysis tool allows qualitative propagation of nutrients through the metabolic network to assess model completeness.Dead-end metabolites can be identi"ed.Author advanced queries with the Structured Advanced Query Form, which supports intuitive construction of database queries of SQL power using a Web-based interface.Interoperability is supported by exporting PGDBs to the BioPAX, SBML, and Genbank formats. PGDBs can be queried through Perl, Java, and Lisp APIs and via web services, and PGDBs can be imported into SRI’s open source BioWarehouse system (Oracle or MySQL) for integration and cross-querying with multiple bioinformatics databases.
Generate an organism-specific metabolic wall chart from a PGDB.
Figure 4. Left: Genome browser depiction of a region of the E. coli chromosome. Gene colors indicate operon organization. Promoters and terminators are depicted when known. Pseudogenes are marked with X’s. Below: Comparative genome browser showing alignments with respect to the trpE gene of two E. coli genomes and the Shigella flexneri genome. Color indicate orthologs.
SRI and SRI International are registered trademarks of SRI International. All other trademarks are the property of their respective owners. ©2011. All rights reserved. 09/11
SRI International 333 Ravenswood Avenue Menlo Park, CA 94025-3493 650.859.2000
www.sri.com
Flux-Balance Analysis in Pathway Tools
The FBA Module generates an FBA model automatically from a PGDB, enabling modeling of steady-state metabolic !uxes. By coupling pathway databases with FBA, we achieve closer coupling of the FBA model to genome information; more accessibility of the FBA model via the query and visualization features of Pathway Tools; and accelerate comprehension of FBA results by painting computed !uxes on the cellular overview diagram and on individual pathways.
The user must de"ne a biomass equation and nutrients for a growth experiment. Development of functional FBA models is greatly accelerated by a multiple gap-"lling tool that postulates additional reactions to add to an FBA model to complete it, and that identi"es what subset of biomass components can be produced by incomplete models.
TECHNICAL SPECIFICATIONS/CONFIGURATIONS
1. Pathway/Genome Navigator Bundled with BioCyc Databases
These con"gurations provide query, visualization, and analysis of existing BioCyc databases. The same binary application can run as both a desktop application and as a Web server within your organization’s intranet.
Con"gurations available:1) Pathway/Genome Navigator plus as many as 20 user- selected BioCyc databases
– Platforms supported: Linux/x86, Windows/x86, Macintosh – Hardware: 2 GHz processor, 2 GB RAM, 5 GB disk
2) Pathway/Genome Navigator plus all BioCyc databases – Platforms supported: Linux/x86 64bit – Hardware: 3 GHz processor, 12 GB RAM, 200 GB disk
2. Add Pathway/Genome Editors and PathoLogicTo edit existing BioCyc PGDBs, add the Pathway/Genome Editors alone to con"guration 1.
To create and edit new Pathway/Genome Databases, add PathoLogic and Pathway/Genome Editors to con"guration 1. – In the PathoLogic con"guration, the EcoCyc and MetaCyc
PGDBs are also required.Use of Pathway/Genome Editors optionally involves a relational database system – Oracle and MySQL are both supported.
ABOUT SRI’S BIOINFORMATICS RESEARCH GROUP
SRI International, an independent research institute, is a key player in the emerging "eld of computational biology, which uses computer science principles and powerful computing capabilities to under-stand complex biological systems. SRI’s Bioinformatics Research Group is a leader in the development of database content and software tools for bioinformatics.
REFERENCES[1] EcoCyc: Nucleic Acids Research 39:D583-90 2011http://nar.oxfordjournals.org/content/39/suppl_1/D583.long[2] MetaCyc: Nucleic Acids Research 38:D473-9 2010http://nar.oxfordjournals.org/cgi/content/full/gkp875[3] “Pathway Tools version 13.0: Integrated Software for Pathway/Genome Informatics and Systems Biology,” Briefings in Bioinformatics 2010 11:40-79. http://www.ai.sri.com/pkarp/misc/ptools09.html[4] “The Pathway Tools Software and Its Role in Anti-MicrobialDrug Discovery,” Microbial Genomics and Drug Discovery, T.J. Dougherty and S.J. Projan eds., Marcel Dekker Inc., New York, 2003[5] “The Pathway Tools Software,” Bioinformatics 18: S225-32 2002
Additional publications: http://biocyc.org/publications.shtml
FOR MORE INFORMATION
Academic and research organizations: BioCyc and Pathway Tools are available free of charge under license. See http://biocyc.org/downloads.shtml for more information.
Commercial organizations: Contact Doug Bercow, Director, Business Development, SRI International (www.sri.com) at (650) 859-5187 or [email protected].
Visit our website: http://biocyc.org
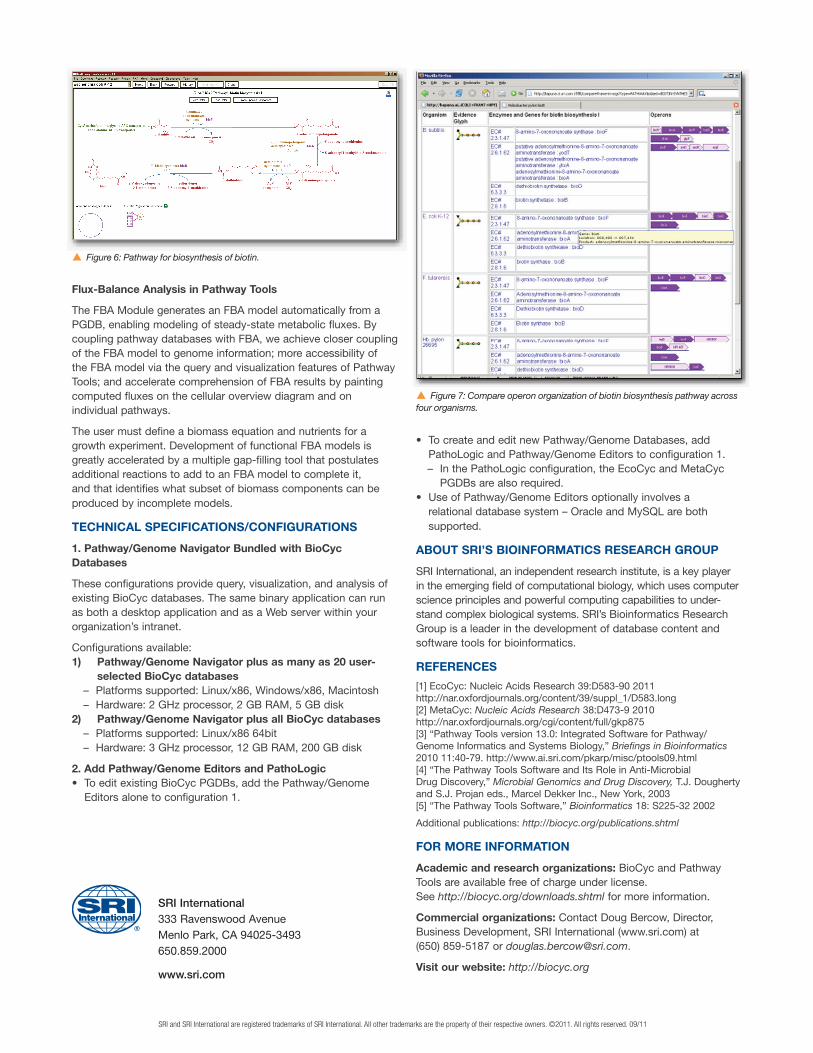
Figure 7: Compare operon organization of biotin biosynthesis pathway across four organisms.
Figure 6: Pathway for biosynthesis of biotin.


![180 2,774 3 10 5, USB -E—F USB SD 2] pc -h>E USB OK 4. 0K ......180 2,774 3 10 5, usb -e—f usb sd 2] pc -h>e usb ok 4. 0k ok ok 0k a 0k 3. a v 0k 0k i ok 2. 0k 15 4 5 10 11 12](https://static.fdocuments.in/doc/165x107/5f943f6ed82d32138a4acfad/180-2774-3-10-5-usb-eaf-usb-sd-2-pc-he-usb-ok-4-0k-180-2774.jpg)