
09mn15
57
DEMAND SIDE MANAGEMENT AND CONTROL By Mr. D.VINOTH KUMAR., B.E 1 st Year ME-ENERGY ENGG, PSG COLLEGE OF TECHNOLOGY, COIMBATORE.
description
09mn15
Transcript of 09mn15

DEMAND SIDE MANAGEMENT AND
CONTROL
ByMr. D.VINOTH KUMAR., B.E
1st Year ME-ENERGY ENGG,PSG COLLEGE OF TECHNOLOGY,
COIMBATORE.
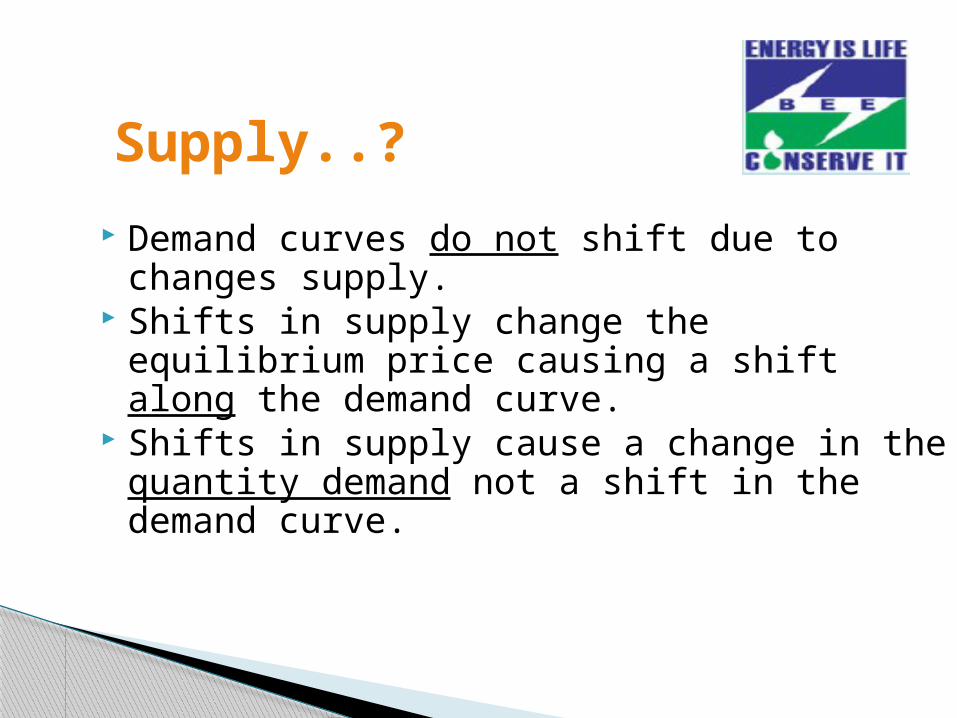
Demand curves do not shift due to changes supply.
Shifts in supply change the equilibrium price causing a shift along the demand curve.
Shifts in supply cause a change in the quantity demand not a shift in the demand curve.
Supply..?

Graph of a supply shift
05
10152025303540
0 2000 4000 6000 8000 10000 12000 14000 Quantity
Pric
e
Old demand New supply Supply
An decrease in supply shifts the supply curve to the left.
Equilibrium price increases.
Quantity demanded decreases.
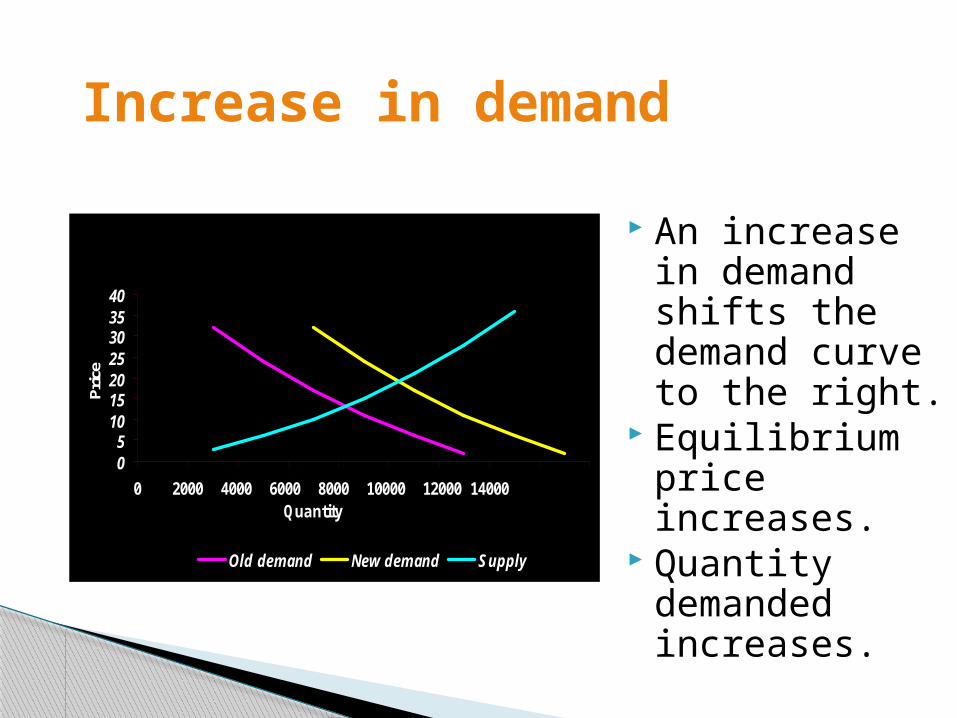
Increase in demand
05
10152025303540
0 2000 4000 6000 8000 10000 12000 14000 Quantity
Pric
e
Old demand New demand Supply
An increase in demand shifts the demand curve to the right.
Equilibrium price increases.
Quantity demanded increases.
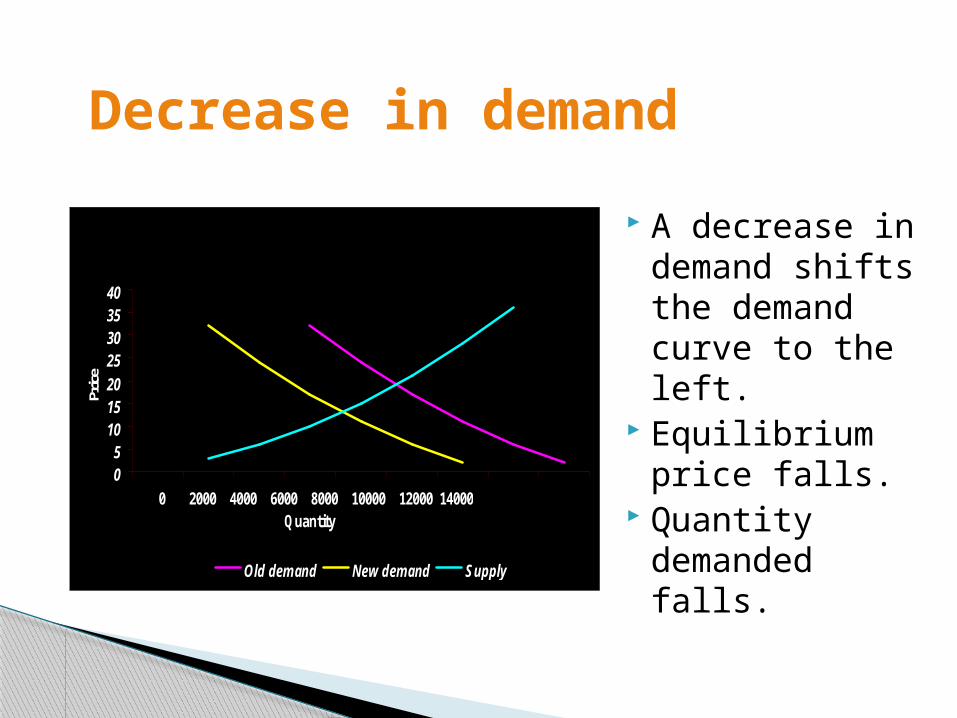
Decrease in demand
05
10152025303540
0 2000 4000 6000 8000 10000 12000 14000 Quantity
Pric
e
Old demand New demand Supply
A decrease in demand shifts the demand curve to the left.
Equilibrium price falls.
Quantity demanded falls.
6
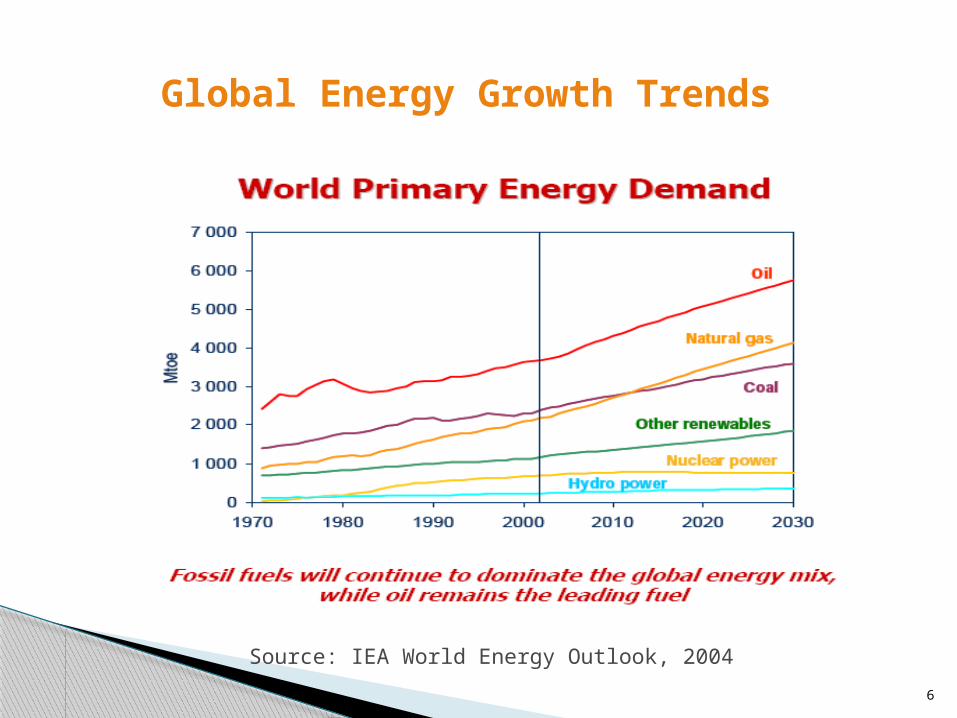
Global Energy Growth Trends
Source: IEA World Energy Outlook, 2004

Maximum Demand is the highest average KVA recorded during any one-demand interval within the month.
The demand interval is normally 30 minutes, but may vary from utility to utility from 15 minutes to 60 minutes.
The demand is measured using tri-vector meter/digital energy meter.
WHAT IS MAXIMUM DEMAND ?

The purpose of controlling the demand is, not to exceed the contracted maximum demand limit. One way to do this is to shed non-critical loads.
Generally, any load which does not affect the main process or which is not essential can be shed.
HOW TO CONTROL MAXIMUM DEMAND ?

Load Curve Generation Rescheduling of loads Storage of products/in process
material/process utilities like refrigeration Shedding of Non-Essential Loads Operation of Captive Generation and Diesel
Generation Sets Reactive Power Compensation
Step by Step Approach for Maximum Demand Control
Prediction - Predictive algorithm identifies pending peaks - Calculates specific action necessary to avoid highest peak
Action - System directly modifies equipment run status - Uses embedded Operator Intelligence to protect process
Information - Real time report of savings performance - Real time & archived energy and load data
Intelligent Demand Controller

Possible loads to be disconnected: • Lights
• Compressors • Air conditioners
• Pumps • Fans and extractors
• Packaging machinery• Shredders
• Ice machines • Refrigerators, etc.,
.

Automated Demand Response It is a Demand Side Management solution that is specifically designed for a customer's specific location, energy/power requirements, and also for the specific electric rates for that customer's location.
Automated Demand Response does not involve human intervention, but is initiated at a facility through receipt of an external communications signal. Automated demand response technology seeks to automatically, through software and hardware applications, to respond to variations in the electricity/power market prices.

Definition of DSM Demand Side Management, or "DSM" is the process of managing the consumption of energy, generally to optimize available and planned generation resources.
Demand Side Management refers to "actions taken on the customer's side of the meter to change the amount or timing of energy consumption.
Energy Reduction Programmes- Reducing demand through more efficient processes, Buildings or equipment
Load Management Programmes- Changing the load pattern and
encouraging less demand at peak times and rates
Load Growth and Conservation Programmes
Types of DSM Measures

Review of Draft Policy Objectives.
15
16
1. Reliability, Stability: Ensure a secure, reliable and stable energy system for the citizens and businesses.
2. Low-Cost, Affordability: Maintain low-cost energy supply and ensure access to affordable energy for all.
3. Environment, Conservation: Protect public health, safety and natural environment and conserve natural resources.
4. Jobs, Economy: Promote sustainable economic growth, job creation and rural economic development through investments in energy infrastructure.
5. Flexibility: Provide the means for energy policy to adapt to changing circumstances.
Categories of Policy Objectives

Is There a Need for DSM in the Energy Plan?
Policy Objectives
17
18
Objective 1: Reliability and Stability◦ DSM provides enhanced reliability to the energy
system by reducing overall demand through energy efficiency and by reducing peak demand through dispatchable programs.
◦ It also reduces transmission and distribution costs relative to a supply side resource
◦ DSM increases diversity of energy sources
DSM in Draft Policy Objectives
19
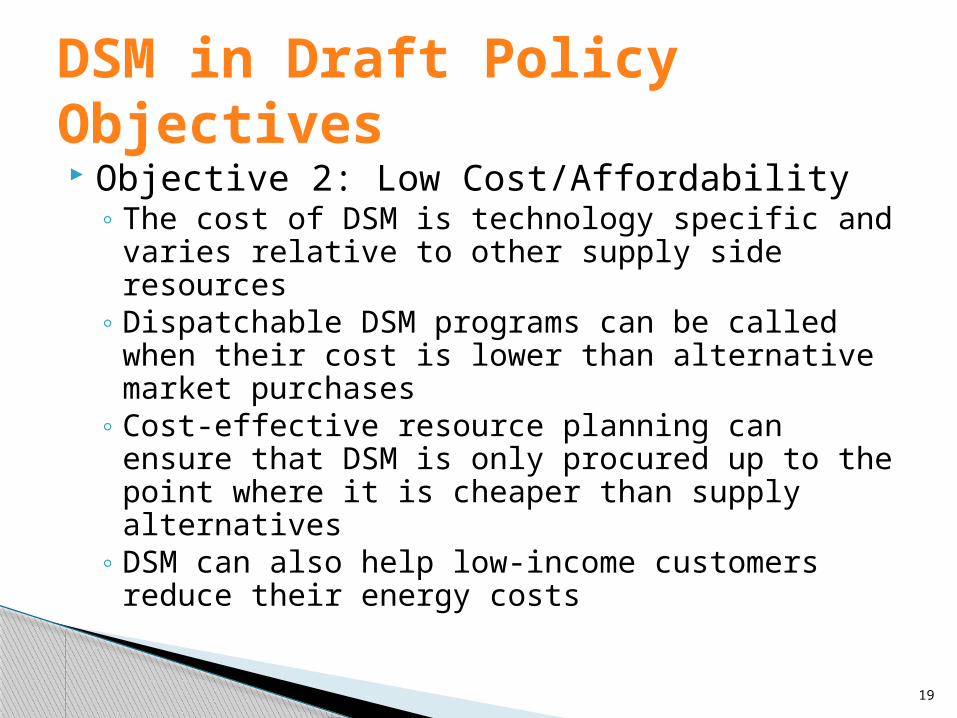
Objective 2: Low Cost/Affordability◦ The cost of DSM is technology specific and varies
relative to other supply side resources ◦ Dispatchable DSM programs can be called when
their cost is lower than alternative market purchases
◦ Cost-effective resource planning can ensure that DSM is only procured up to the point where it is cheaper than supply alternatives
◦ DSM can also help low-income customers reduce their energy costs
DSM in Draft Policy Objectives

20
Objective 3: Environment, Conservation◦ DSM is the most environmentally friendly resource
available◦ It conserve resources◦ It reduces the dependence on foreign energy
sources◦ It reduces dependence on non-renewable energy
sources◦ It positions the state for possible carbon
regulation◦ It protects the public health and safety
DSM in Draft Policy Objectives

21
Objective 4: Jobs/Economy◦ DSM can increase job levels and tax base with
increased investment in the DSM industry◦ DSM can be administered in Idaho and create a
local industry
DSM in Draft Policy Objectives

22
Objective 5: Flexibility◦ Recognizing DSM as an energy resource would
provide additional flexibility to resource planning◦ With the correct approach DSM can be
incorporated into planning without precluding other resources or unnecessary regulation
◦ DSM can be implemented relatively quickly
DSM in Draft Policy Objectives

23
52%43% 38%
10%
9%7%
38%48% 55%
0%
10%
20%
30%
40%
50%
60%
70%
80%
90%
100%
2003 2030 2050
Developing countries
Transition economies
OECD
Primary Energy Demand by Region(Business As Usual)
By 2050 developing countries account for 55% of global energy demand
Source: IEA Energy Technology Perspectives 2006

24
Global Energy-Environment Dynamics
Source: IEA World Energy Outlook, 2004

27
Business–As–Usual Energy Sector Expansion is unsustainable…because of:◦ Investment constraints on the supply side ◦ Increased significance in the current regime of high oil
prices; projections for 2006 are that prices are likely to remain above $70/bbl; Major impact on growth of net oil-importing countries
◦ Environmental Implications (Enormous impacts at local, regional, global levels)
Business–As–Usual Energy Sector Expansion would lead to…◦ Energy Insecurity
Is the Current Energy Growth Sustainable?
28
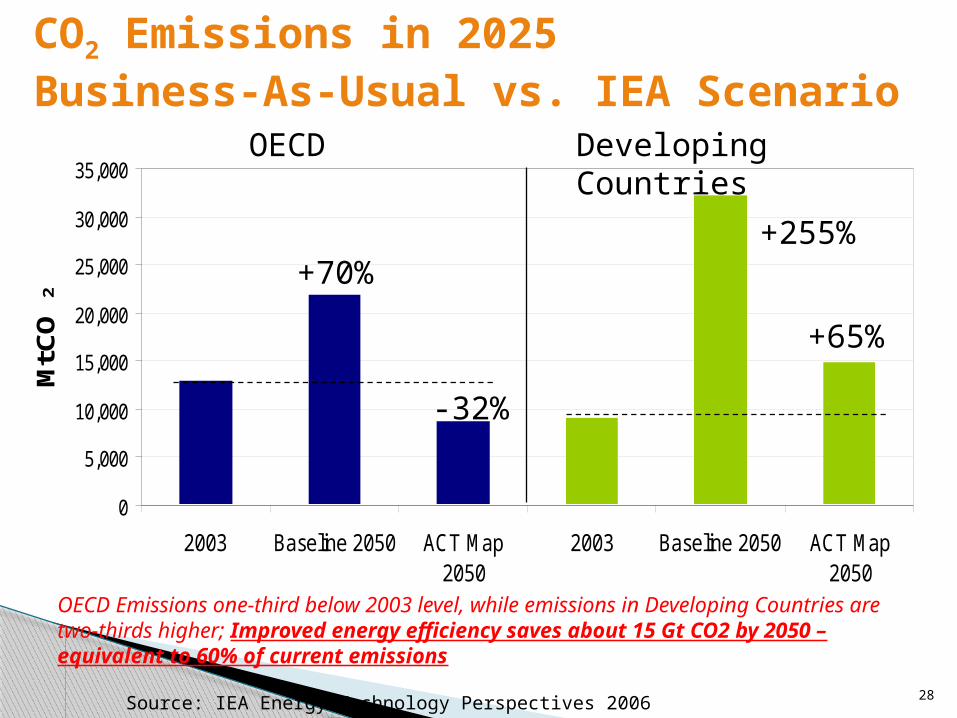
CO2 Emissions in 2025Business-As-Usual vs. IEA Scenario
0
5,000
10,000
15,000
20,000
25,000
30,000
35,000
2003 Baseline 2050 ACT Map2050
2003 Baseline 2050 ACT Map2050
Mt C
O2
OECD Developing Countries
-32%
+65%
OECD Emissions one-third below 2003 level, while emissions in Developing Countries are two-thirds higher; Improved energy efficiency saves about 15 Gt CO2 by 2050 – equivalent to 60% of current emissions
+255%+70
%
Source: IEA Energy Technology Perspectives 2006

30
Other renewables
Biomass
Fossil fuel generation efficiency
Nuclear
Coal to gas
Hydropower
CCSPower
generation
End-useefficiency
Biofuels in transport
CCS in fuel transformation
CCS in industry
Fuel mix in buildings and industry
Emission Reduction by Technology AreaIEA’s Scenario through 2050
Improved energy efficiency most important contributor to reduced emissions
Source: IEA Energy Technology Perspectives 2006

32
Utility Demand Side Management
.
36
United States: Since late 1970s, mandated through regulation and IRP requirements, ratepayer supported, 2-3% revenues spent on DSM (by 1999, 51 GW and 71 TWh peak reduction). Scenario changing since 1998.
Sri Lanka: CEB-sponsored lighting DSM program (started 1996), saved 75 MW & 110 GWh through 1.5 million lamps with net annual utility benefit of Rs.176 Million, in year 2000.
Utility Demand Side Management International Success Stories

37
Brazil: Government Electricity Company spent $20 million by 1991 on 150 projects, ranging from consumer education to motor and lighting replacements, saving $1 billion
Mexico: The national utility spent $24 million (with World Bank and other donor support) on residential CFL program in major cities.
Utility Demand Side Management International Success Stories

38
Six Country Case Study (US, UK, Norway, New Zealand, Argentina, Chile): As reforms occur, and prices decrease, utilities offer energy efficiency services only to the extent required by regulations
Korea: Rational Energy Utilization Act of 1995/97, Article 12- DSM Investment Plan and results to the Minister of Trade, Industry and Energy
Regulatory “Pressure” for DSM:International Experiences
39
New Zealand: Law requires publicly-owned utilities to offer Energy Efficiency.
Norway: In 1980s, were mandated to perform IRP and DSM (>200 DISCOMs). Efforts have waned since restructuring.
United Kingdom: Regulator responsible for DISCOM Energy Efficiency activities, and small tax to fund government-administered activities.
Regulatory “Pressure” for DSM:International Experiences
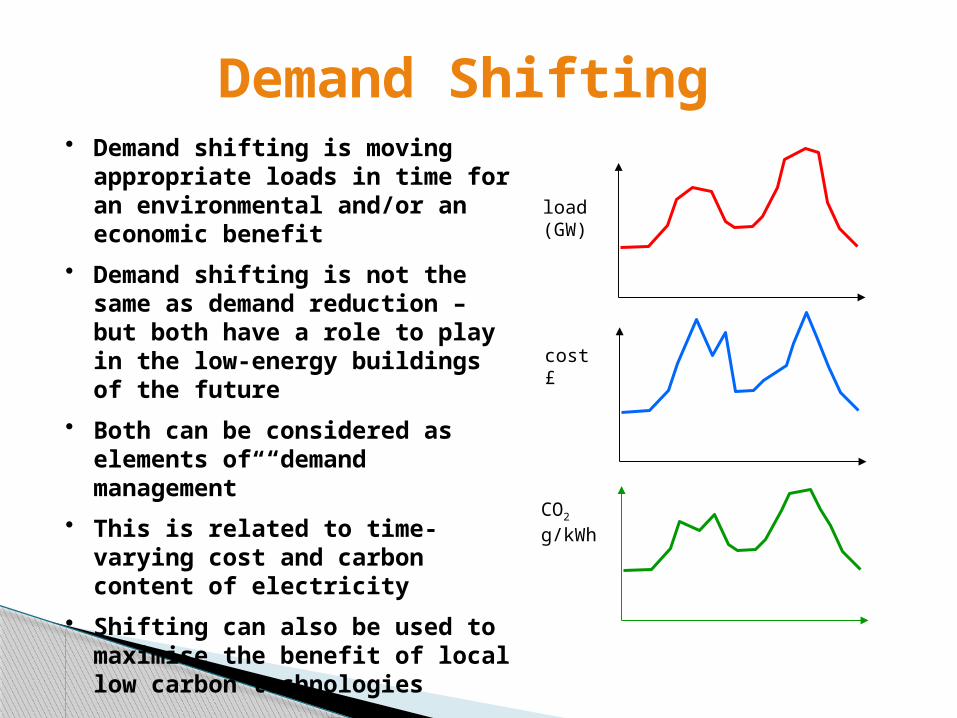
Demand Shifting• Demand shifting is moving
appropriate loads in time for an environmental and/or an economic benefit
• Demand shifting is not the same as demand reduction – but both have a role to play in the low-energy buildings of the future
• Both can be considered as elements of “demand management”
• This is related to time-varying cost and carbon content of electricity
• Shifting can also be used to maximise the benefit of local low carbon technologies
load (GW)
cost £
CO2
g/kWh
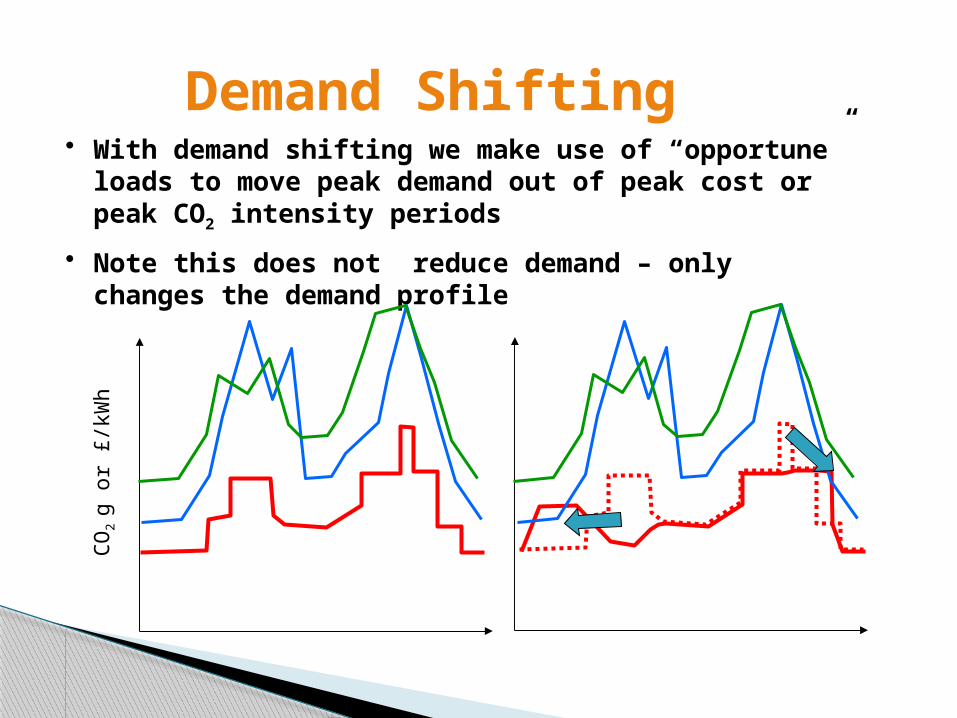
Demand Shifting• With demand shifting we make use of “opportune” loads to
move peak demand out of peak cost or peak CO2 intensity periods
• Note this does not reduce demand – only changes the demand profile
CO
2 g
or £
/kW
h

Demand Shifting• Opportune loads are loads that can be moved in
time without inconveniencing the user or causing adverse effects

• Space heating• Hot water• Electricity
– lighting– appliances– cooling– … also for space heating and hot
water
Energy Required (Revisited)
demand in a typical commercial building

.
Fabric Improvements • Improving the building fabric reduces the
thermal exchanges to/from the environment e.g.:– heat loss from inside to outside– heat gain from outside to inside
• This can be achieved in a number of ways – adding/improving wall insulation– replacing old glazing systems (also
reduced unwanted infiltration)• Improving air tightness (+ MV with heat
exchange)• Potential for 80%* reductions in heating-
related energy loads
* Olivier D, 2001, Building in Ignorance: Demolishing Complacency - Improving the Energy Performance of 21st Century Homes, report published by the Association for the Conservation of Energy.
.
Thermal Mass • the use of exposed thermal mass is typically employed in
buildings (or spaces) likely to experience overheating: – sunspaces– areas of high occupancy– areas with high equipment loads
• thermal mass acts like a sponge – absorbing surplus heat during the day and releasing the heat during the evening
• however to work effectively the release of heat in the evenings needs to be encouraged through flushing of the air inside the building

Natural Ventilation • Ventilation type in most smaller UK buildings • Driven by wind pressure and density variations
– single sided ventilation (density driven)– stack ventilation (density driven)– cross flow ventilation (wind driven)
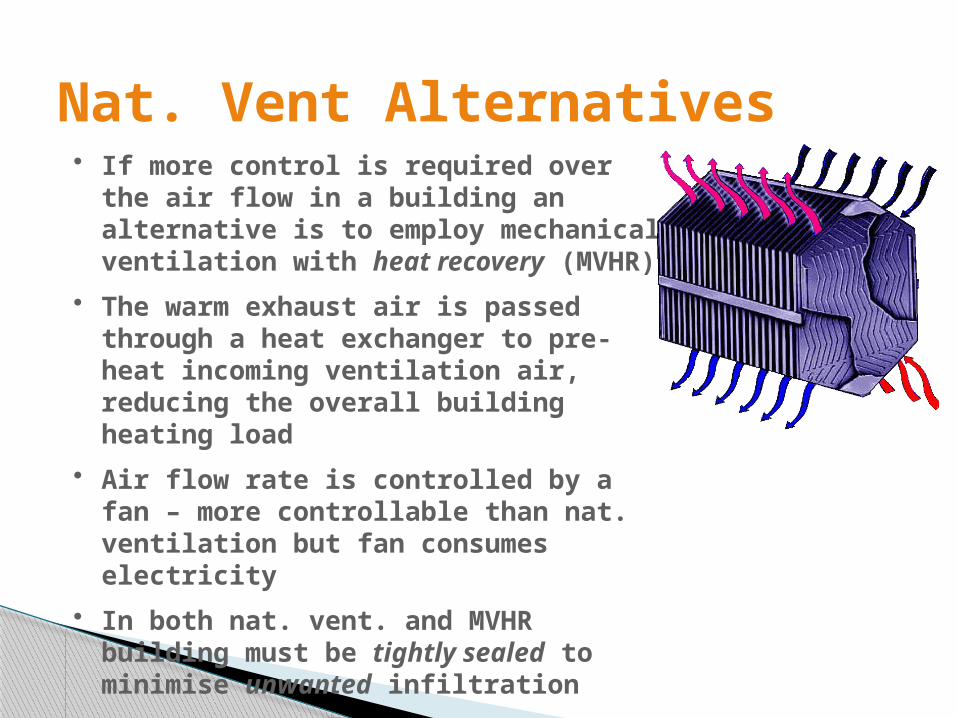
Nat. Vent Alternatives • If more control is required over the air flow
in a building an alternative is to employ mechanical ventilation with heat recovery (MVHR)
• The warm exhaust air is passed through a heat exchanger to pre-heat incoming ventilation air, reducing the overall building heating load
• Air flow rate is controlled by a fan – more controllable than nat. ventilation but fan consumes electricity
• In both nat. vent. and MVHR building must be tightly sealed to minimise unwanted infiltration

Nat. Vent Alternatives • Another alternative to natural
ventilation is so-called “dynamic insulation”
• Ventilation is drawn through porous insulation in the external wall cavity
• Recovers heat that would otherwise be conducted through the wall to the environment
• Interior of the building must be slightly de-pressurised in relation to the outside
• Can significantly reduce the “U-value of the wall”
de –pressurised interior

Demand shifting can be achieved by shifting loads from peak to off-peak periods
It is neither necessary nor feasible to alter the timing of operation of all devices at consumer premises
In residential areas the control of air conditioners, space heaters, water heater and irrigation pumps can produce better results than control of illumination loads
Industrial loads should be controlled provided the production should not suffer
.

IMPROVEMENTS IN DEMAND SIDE MANAGEMENT

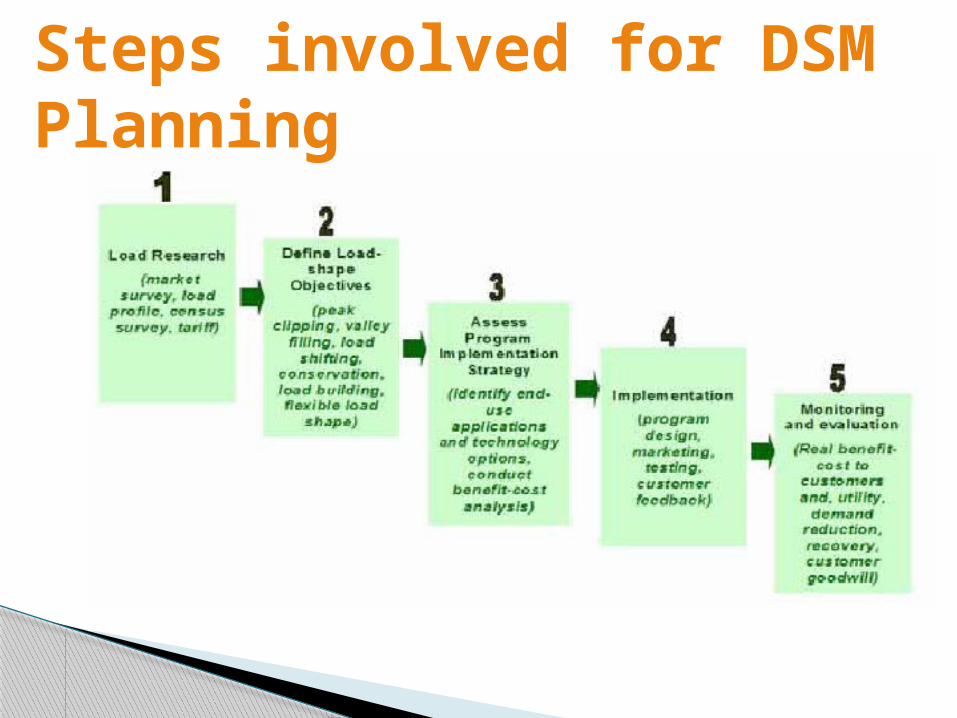
Steps involved for DSM Planning
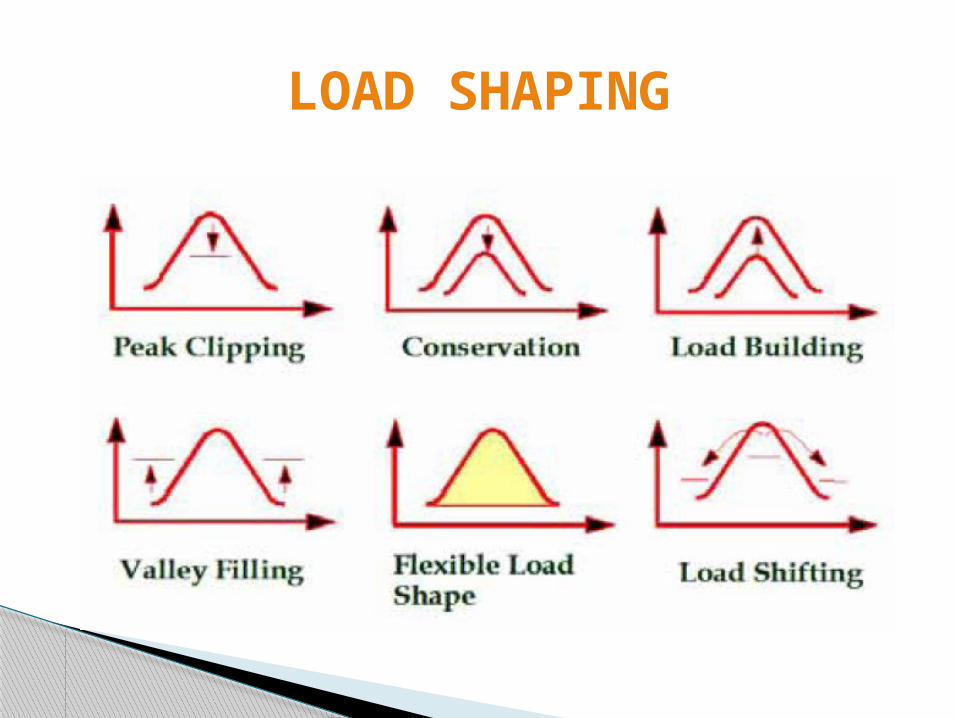
LOAD SHAPING

DSM Programme Design Process
/P
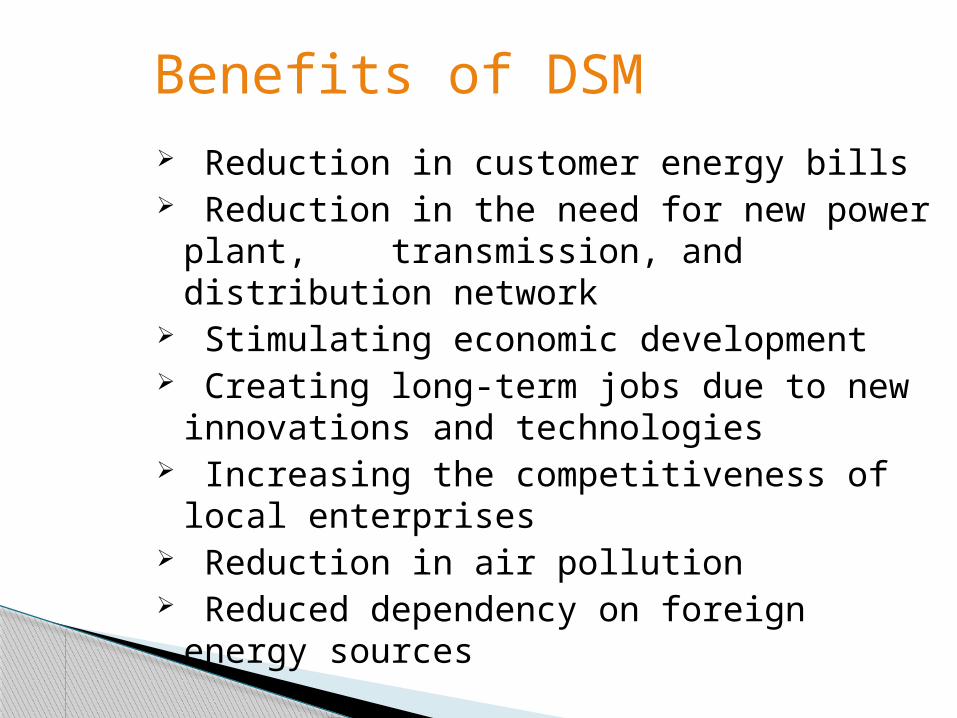
Benefits of DSM Reduction in customer energy bills Reduction in the need for new power plant,
transmission, and distribution network Stimulating economic development Creating long-term jobs due to new innovations and
technologies Increasing the competitiveness of local enterprises Reduction in air pollution Reduced dependency on foreign energy sources

Various approaches can be adopted to achieve benefits of Demand Side Management as:
General information programs for customers about energy efficiency options.
Information programs about specific DSM techniques appropriate for industry
Turnkey programs that provide complete services to design, finance, and install a package of efficiency measures at the consumer end.
DSM Program Approaches

Financing programs to assist customers to pay for DSM measures
Alternative rate programs by the utilities like time-of-use rates and interruptible rates to shift loads to off-peak periods.
Schemes and incentives to invest in energy conservation and efficiency programs
Incentives for new innovations and technologies for Load Response/Load Management Programs.
1

Government policies and regulations
Utilities programs
Customer participation
DSM programs and policies can be promoted and implemented at different levels of the society as:

Demand-Side Management Actual Peak Load Reductions by Program Category, 2003 through 2008(Megawatts)Item 2008 2007 2006 2005 2004 2003
Total Actual Peak Load Reduction
32,741 30,253[R] 27,240 25,710 23,532 22,904
Energy Efficiency 19,650 17,710 15,959 15,351 14,272 13,581
Load Management
13,091 12,543[R] 11,281 10,359 9,260 9,323
R = Revised. Source: U.S. Energy Information Administration, Form EIA-861, "Annual Electric Power Industry Report."
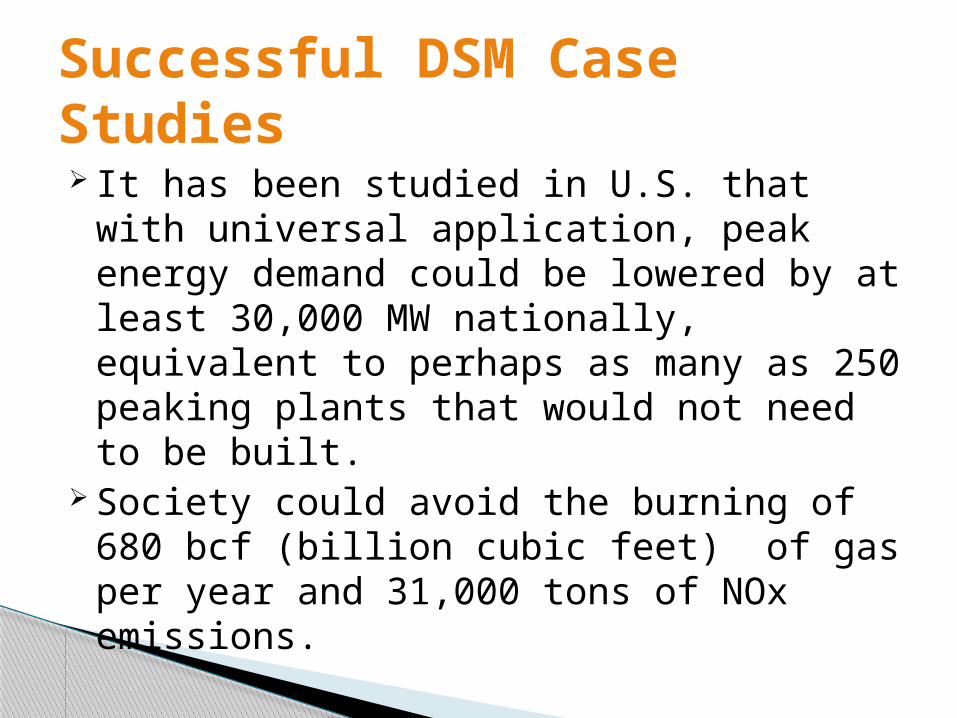
It has been studied in U.S. that with universal application, peak energy demand could be lowered by at least 30,000 MW nationally, equivalent to perhaps as many as 250 peaking plants that would not need to be built.
Society could avoid the burning of 680 bcf (billion cubic feet) of gas per year and 31,000 tons of NOx emissions.
Successful DSM Case Studies
A study in 2002 showed that New York’s electricity market along with its grid operator and large electric utility companies has the potential to reduce demand for electricity by at least 1300 megawatts (MW) through Demand Side Management techniques, which is enough to supply power to 1.3 million homes.
Similarly the Internal Energy Efficiency Program of Ontario Power Generation (OPG) in Canada since 1994 has helped to save 2,131 GWh of energy every year, 2.4 million metric tons of emission savings for CO2, NOx and SO2 and a saving of US$85.2 million every year.
.

DSM techniques are the cheapest, fastest and cleanest way to solve our electricity problems.
These can be immediately implemented and many times at one-tenth the cost of building new power plants
provides significant economic system reliability environmental benefits
Conclusion
A website on www.demandsidemanagement.com www.bee-india.nic.in www.energymanagertraining.com en.wikipedia.org/wiki
REFERENCES

Thank You


