09476 - A STUDY OF FACTORS AFFECTING CO2 ......Length-diameter ratio of horizontal test section...
17
2009 Copyright ©2009 by NACE International. Requests for permission to publish this manuscript in any form, in part or in whole must be in writing to NACE International, Copyright Division, 1440 South creek Drive, Houston, Texas 777084. The material presented and the views expressed in this paper are solely those of the author(s) and are not necessarily endorsed by the Association. Printed in the U.S.A. A STUDY OF FACTORS AFFECTING CO2 CORROSION AND INHIBITOR EFFECTIVENESS USING A MULTI-PHASE FLOWLOOP Mamdouh M. Salama ConocoPhillips Company, Houston, TX, USA [email protected] Bruce N. Brown Institute for Corrosion and Multiphase Technology Ohio University, Athens, OH, USA [email protected] ABSTRACT A mini-flowloop was developed to study CO 2 corrosion and corrosion/erosion interactions, and to assess the effectiveness of inhibitors under conditions that simulate multi-phase pipelines. The mini- flowloop was used to study the effect of testing time, steel chemistry, velocity, temperature, fluid chemistry, sand and inhibitors on corrosion rates. The measured corrosion rates in inhibited and uninhibited solutions using the mini-flowloop were significantly different from those measured using other methods such as the Greene cell method. The effect of adding 1/2% Cr to the steel did not improve its CO 2 corrosion resistance as has been claimed by some suppliers. The presence of oil in a brine solution increased the corrosion rates for both inhibited and uninhibited solutions. The CO 2 corrosion rate increased slightly with increasing flow rate suggesting that the corrosion mechanism is partially diffusion controlled. At high flow rates, the presence of sand enhanced corrosion of steel in both uninhibited and inhibited solutions while at low flow rates sand had no effect on corrosion rates in uninhibited solutions, but it had a profound effect on the rates in inhibited solutions. The water soluble inhibitor was effective in controlling uniform corrosion, but failed to control pitting corrosion for tests conducted in 100% water solution. In 90% water-10% oil solution, the effectiveness of the inhibitor decreased and the corrosion rate increased compared to the oil-free case, but pitting was not observed. When a de-emulsifier was added to a solution inhibited by the water soluble inhibitor, corrosion rate increased dramatically. The oil soluble inhibitor was not successful in controlling pitting corrosion at low flow rates or uniform corrosion at high flowrates. Keywords: Corrosion, pipeline, integrity management, Inhibitors, sand production, CO 2 . 1 Paper No. 09476
Transcript of 09476 - A STUDY OF FACTORS AFFECTING CO2 ......Length-diameter ratio of horizontal test section...
2009
Copyright ©2009 by NACE International. Requests for permission to publish this manuscript in any form, in part or in whole must be in writing to NACE International, Copyright Division, 1440 South creek Drive, Houston, Texas 777084. The material presented and the views expressed in this paper are solely those of the author(s) and are not necessarily endorsed by the Association. Printed in the U.S.A.
A STUDY OF FACTORS AFFECTING CO2 CORROSION AND INHIBITOR EFFECTIVENESS USING
A MULTI-PHASE FLOWLOOP
Mamdouh M. Salama
ConocoPhillips Company, Houston, TX, USA [email protected]
Bruce N. Brown
Institute for Corrosion and Multiphase Technology Ohio University, Athens, OH, USA
ABSTRACT
A mini-flowloop was developed to study CO2 corrosion and corrosion/erosion interactions, and to assess the effectiveness of inhibitors under conditions that simulate multi-phase pipelines. The mini-flowloop was used to study the effect of testing time, steel chemistry, velocity, temperature, fluid chemistry, sand and inhibitors on corrosion rates. The measured corrosion rates in inhibited and uninhibited solutions using the mini-flowloop were significantly different from those measured using other methods such as the Greene cell method. The effect of adding 1/2% Cr to the steel did not improve its CO2 corrosion resistance as has been claimed by some suppliers. The presence of oil in a brine solution increased the corrosion rates for both inhibited and uninhibited solutions. The CO2 corrosion rate increased slightly with increasing flow rate suggesting that the corrosion mechanism is partially diffusion controlled. At high flow rates, the presence of sand enhanced corrosion of steel in both uninhibited and inhibited solutions while at low flow rates sand had no effect on corrosion rates in uninhibited solutions, but it had a profound effect on the rates in inhibited solutions. The water soluble inhibitor was effective in controlling uniform corrosion, but failed to control pitting corrosion for tests conducted in 100% water solution. In 90% water-10% oil solution, the effectiveness of the inhibitor decreased and the corrosion rate increased compared to the oil-free case, but pitting was not observed. When a de-emulsifier was added to a solution inhibited by the water soluble inhibitor, corrosion rate increased dramatically. The oil soluble inhibitor was not successful in controlling pitting corrosion at low flow rates or uniform corrosion at high flowrates.
Keywords: Corrosion, pipeline, integrity management, Inhibitors, sand production, CO2.
1
Paper No.
09476
INTRODUCTION
Corrosion due to CO2 (sweet corrosion) has a major impact on the oil and gas industry by severely affecting production and process facilities. CO2 dissolves in brine to form an acidic solution that corrodes carbon steel equipment. A vast effort has been devoted to combating this problem through materials selection and application of inhibitors. The selection of materials and the corrosion control strategy has a major influence on life cycle cost of production facilities. In many cases, the selection of carbon steel and the use of chemical inhibitors for corrosion control represent the most economical option. However, the economical success of this scenario depends on understanding all factors affecting CO2 corrosion and on the selection of the proper corrosion inhibitors. Factors affecting CO2 corrosion include fluid chemistry, temperature, flow characteristics and steel composition. The selection process of inhibitors requires a careful assessment of the inhibitor's suitability, deliverability and compatibility.
Corrosion inhibitors must be suitable for protecting carbon steel under a variety of operating
environments. Environmental conditions that influence the inhibitor performance include fluid chemistry (oil, water and gas), temperature, pressure and flow velocity. The pressure is important because of its influence on the severity of the environment due to the partial pressure of corrosive species such as CO2 and H2S. In addition to the environment, the surface condition (clean vs. pre-corroded) of the steel component has a major influence on the effectiveness of an inhibitor. Assessment of an inhibitor deliverability involves understanding several issues that include the type of solvent used, the solubility and dispersability of the inhibitor, freezing and flash points, and whether the inhibitor treatment is batch-wise or continuous. Oil soluble inhibitors are extensively used because they offer much longer film life than water soluble inhibitors. Due to the continued environmental restrictions, water soluble inhibitors are being considered for continuous inhibition of offshore pipelines. In general, corrosion inhibitors are not the only chemical added to the production stream. Other chemicals such as scale inhibitors, emulsion breakers, hydrate inhibitor, and paraffin inhibitors can also be present. Therefore, the compatibility of the corrosion inhibitors with these chemicals is an important factor in the inhibitor selection process.
Although corrosion inhibitors have been in use in the oil industry for many decades, there is no
acceptable standard for evaluating their performance. Methods that are currently being used include: wheel test, low pressure kettle/bubble/Greene cell, unstirred autoclave, stirred autoclave, low pressure rotating electrode, high pressure rotating electrode, low pressure rotating cylinder, impinging jet, and flowloop. The preference of which method should be used is, unfortunately, based primarily on the availability of equipment to a specific vendor or an oil company rather than on which method provides the best simulation to the field condition. What makes this issue critical is that different methods generate different results in terms of the suitability of an inhibitor.
For flowline and pipeline applications, the use of a flowloop test method represents the closest
simulation to real service. This method is, however, costly and time consuming. Therefore, it is not often used. In order to reduce the cost of large-scale flowloop testing, a mini-flowloop was designed and constructed. In this report, the description of the mini-flowloop is presented. Also presented are the results of a study of factors affecting CO2 corrosion, and to assess the effect of sand on corrosion rates of inhibited and un-inhibited solutions using the mini-flowloop test setup. Sand production may be inevitable in many fields that have a relatively low formation strength. Two inhibitors were considered in this study: a water soluble product that is considered environmentally friendly, and an oil soluble inhibitor. In addition to effect of sand, issues related to compatibility with de-emulsifiers are discussed.
2
Comparisons between the mini-flowloop results and results from low pressure Greene cell are also presented.
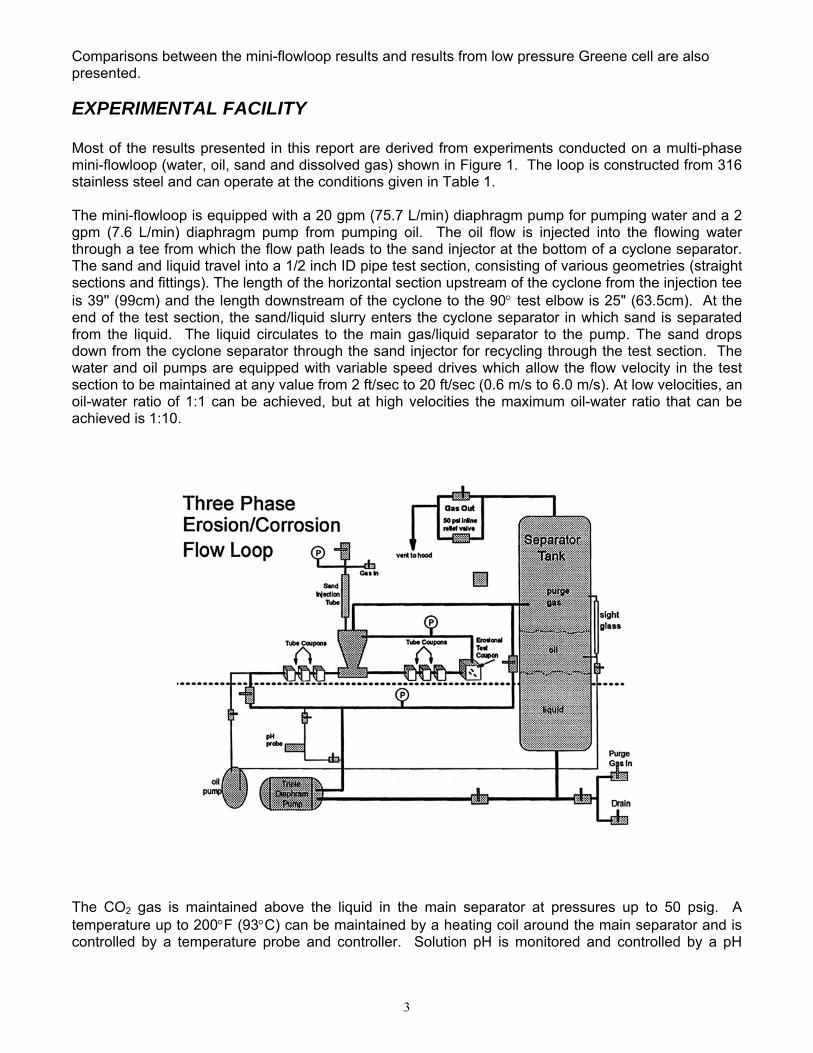
EXPERIMENTAL FACILITY Most of the results presented in this report are derived from experiments conducted on a multi-phase mini-flowloop (water, oil, sand and dissolved gas) shown in Figure 1. The loop is constructed from 316 stainless steel and can operate at the conditions given in Table 1. The mini-flowloop is equipped with a 20 gpm (75.7 L/min) diaphragm pump for pumping water and a 2 gpm (7.6 L/min) diaphragm pump from pumping oil. The oil flow is injected into the flowing water through a tee from which the flow path leads to the sand injector at the bottom of a cyclone separator. The sand and liquid travel into a 1/2 inch ID pipe test section, consisting of various geometries (straight sections and fittings). The length of the horizontal section upstream of the cyclone from the injection tee is 39'' (99cm) and the length downstream of the cyclone to the 90° test elbow is 25" (63.5cm). At the end of the test section, the sand/liquid slurry enters the cyclone separator in which sand is separated from the liquid. The liquid circulates to the main gas/liquid separator to the pump. The sand drops down from the cyclone separator through the sand injector for recycling through the test section. The water and oil pumps are equipped with variable speed drives which allow the flow velocity in the test section to be maintained at any value from 2 ft/sec to 20 ft/sec (0.6 m/s to 6.0 m/s). At low velocities, an oil-water ratio of 1:1 can be achieved, but at high velocities the maximum oil-water ratio that can be achieved is 1:10.
The CO2 gas is maintained above the liquid in the main separator at pressures up to 50 psig. A temperature up to 200°F (93°C) can be maintained by a heating coil around the main separator and is controlled by a temperature probe and controller. Solution pH is monitored and controlled by a pH
3
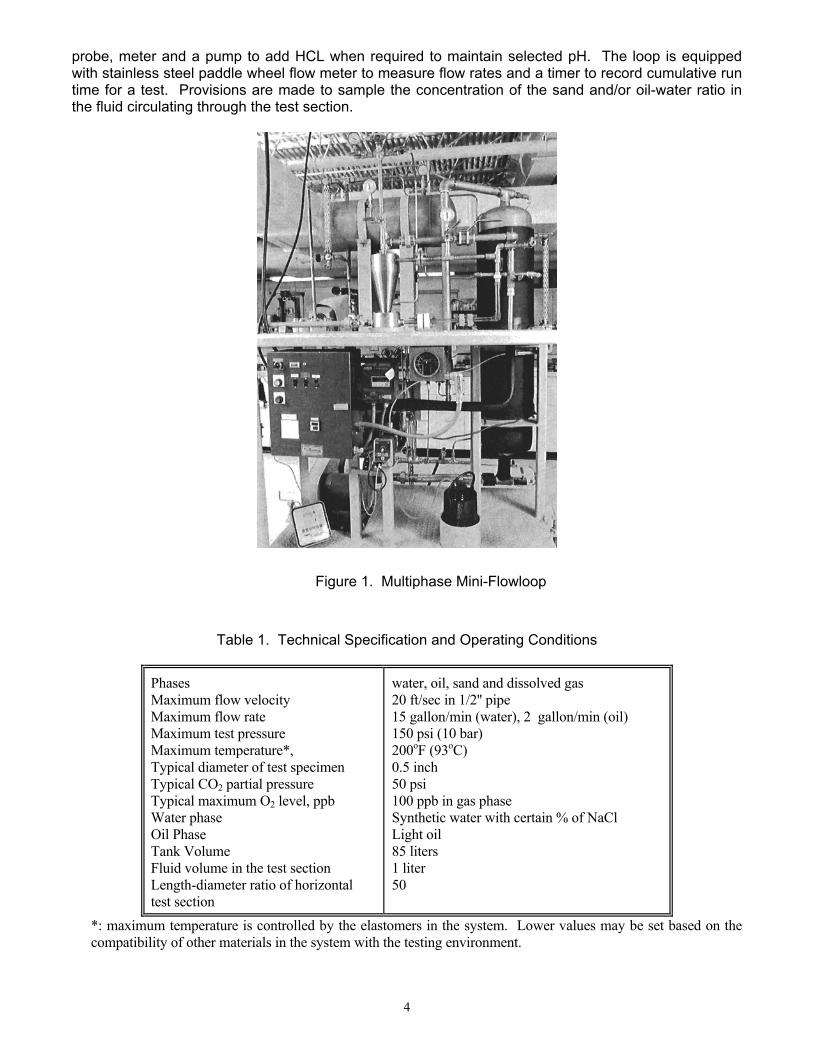
probe, meter and a pump to add HCL when required to maintain selected pH. The loop is equipped with stainless steel paddle wheel flow meter to measure flow rates and a timer to record cumulative run time for a test. Provisions are made to sample the concentration of the sand and/or oil-water ratio in the fluid circulating through the test section.
Figure 1. Multiphase Mini-Flowloop
Table 1. Technical Specification and Operating Conditions
Phases Maximum flow velocity Maximum flow rate Maximum test pressure Maximum temperature*, Typical diameter of test specimen Typical CO2 partial pressure Typical maximum O2 level, ppb Water phase Oil Phase Tank Volume Fluid volume in the test section Length-diameter ratio of horizontal test section
water, oil, sand and dissolved gas 20 ft/sec in 1/2'' pipe 15 gallon/min (water), 2 gallon/min (oil) 150 psi (10 bar) 200oF (93oC) 0.5 inch 50 psi 100 ppb in gas phase Synthetic water with certain % of NaCl Light oil 85 liters 1 liter 50
*: maximum temperature is controlled by the elastomers in the system. Lower values may be set based on the compatibility of other materials in the system with the testing environment.
4
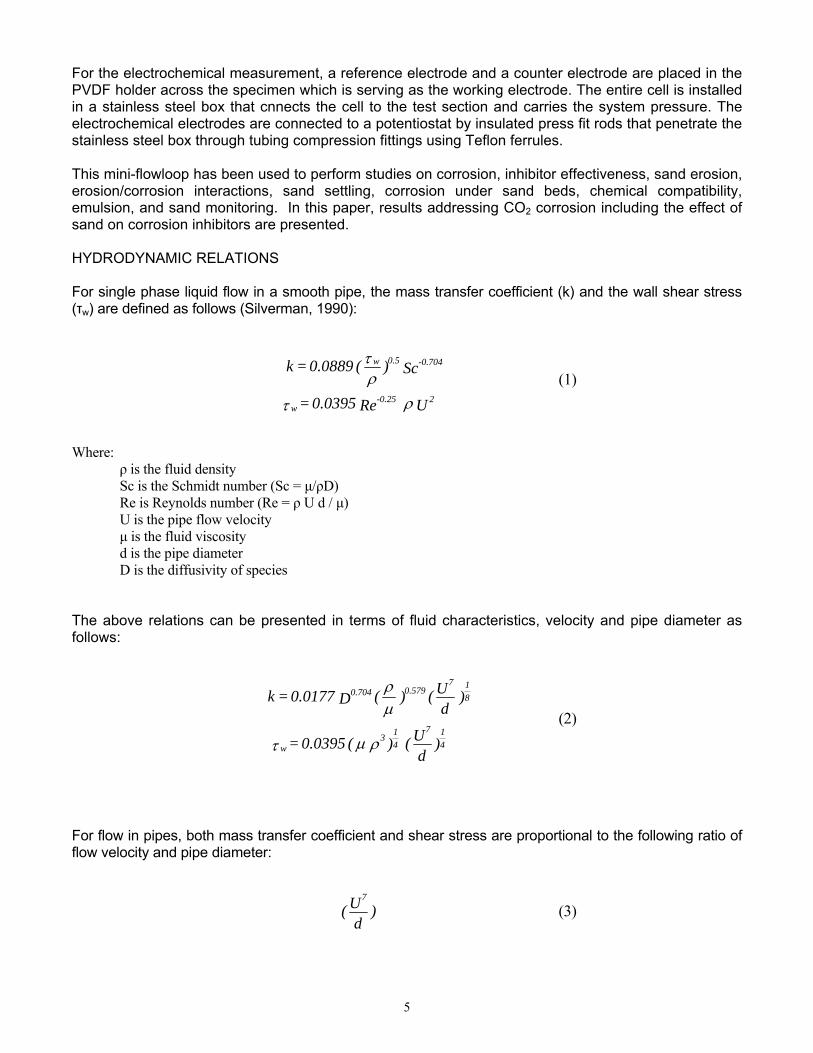
For the electrochemical measurement, a reference electrode and a counter electrode are placed in the PVDF holder across the specimen which is serving as the working electrode. The entire cell is installed in a stainless steel box that cnnects the cell to the test section and carries the system pressure. The electrochemical electrodes are connected to a potentiostat by insulated press fit rods that penetrate the stainless steel box through tubing compression fittings using Teflon ferrules. This mini-flowloop has been used to perform studies on corrosion, inhibitor effectiveness, sand erosion, erosion/corrosion interactions, sand settling, corrosion under sand beds, chemical compatibility, emulsion, and sand monitoring. In this paper, results addressing CO2 corrosion including the effect of sand on corrosion inhibitors are presented. HYDRODYNAMIC RELATIONS For single phase liquid flow in a smooth pipe, the mass transfer coefficient (k) and the wall shear stress (τw) are defined as follows (Silverman, 1990):
Where: ρ is the fluid density Sc is the Schmidt number (Sc = μ/ρD) Re is Reynolds number (Re = ρ U d / μ) U is the pipe flow velocity μ is the fluid viscosity d is the pipe diameter D is the diffusivity of species The above relations can be presented in terms of fluid characteristics, velocity and pipe diameter as follows:
For flow in pipes, both mass transfer coefficient and shear stress are proportional to the following ratio of flow velocity and pipe diameter:
U Re 0.0395 =
Sc )( 0.0889 = k
20.25-w
0.704-0.5w
ρτ
ρτ
(1)
)
dU( ) ( 0.0395 =
)d
U( )( D 0.0177 = k
417
413
w
817
0.5790.704
ρμτ
μρ
(2)
)d
U(7
(3)
5
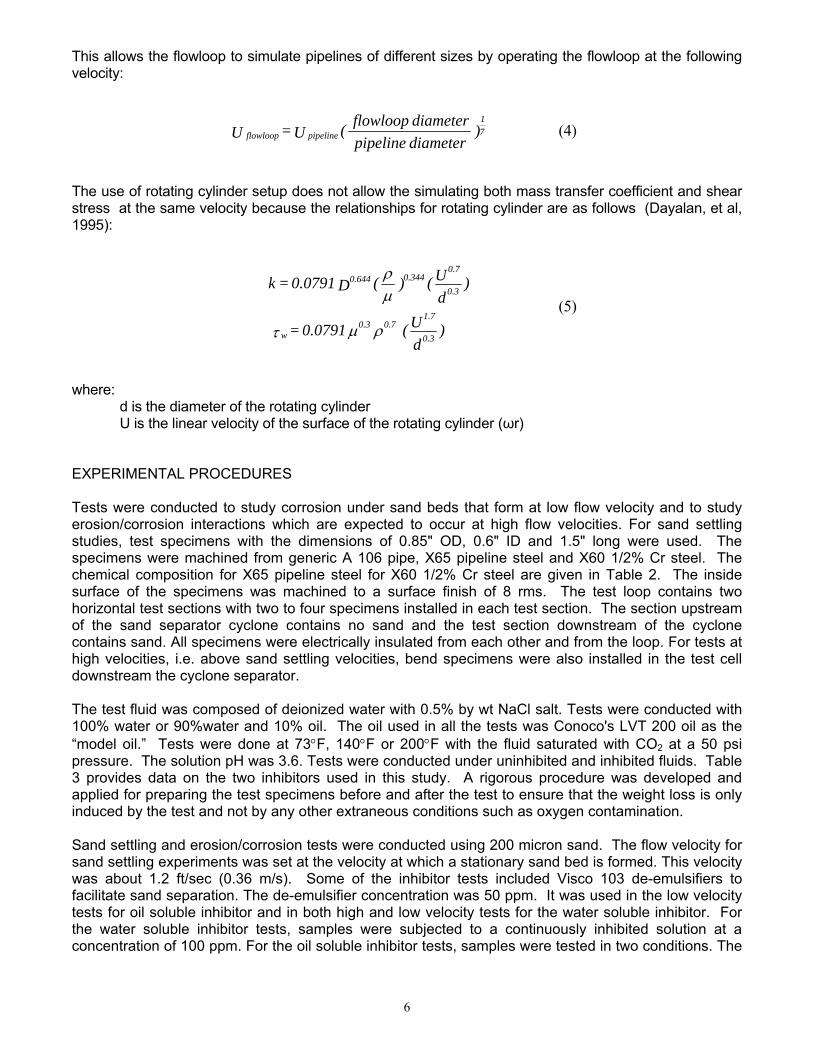
This allows the flowloop to simulate pipelines of different sizes by operating the flowloop at the following velocity:
The use of rotating cylinder setup does not allow the simulating both mass transfer coefficient and shear stress at the same velocity because the relationships for rotating cylinder are as follows (Dayalan, et al, 1995):
where: d is the diameter of the rotating cylinder U is the linear velocity of the surface of the rotating cylinder (ωr) EXPERIMENTAL PROCEDURES Tests were conducted to study corrosion under sand beds that form at low flow velocity and to study erosion/corrosion interactions which are expected to occur at high flow velocities. For sand settling studies, test specimens with the dimensions of 0.85" OD, 0.6" ID and 1.5" long were used. The specimens were machined from generic A 106 pipe, X65 pipeline steel and X60 1/2% Cr steel. The chemical composition for X65 pipeline steel for X60 1/2% Cr steel are given in Table 2. The inside surface of the specimens was machined to a surface finish of 8 rms. The test loop contains two horizontal test sections with two to four specimens installed in each test section. The section upstream of the sand separator cyclone contains no sand and the test section downstream of the cyclone contains sand. All specimens were electrically insulated from each other and from the loop. For tests at high velocities, i.e. above sand settling velocities, bend specimens were also installed in the test cell downstream the cyclone separator. The test fluid was composed of deionized water with 0.5% by wt NaCl salt. Tests were conducted with 100% water or 90%water and 10% oil. The oil used in all the tests was Conoco's LVT 200 oil as the “model oil.” Tests were done at 73°F, 140°F or 200°F with the fluid saturated with CO2 at a 50 psi pressure. The solution pH was 3.6. Tests were conducted under uninhibited and inhibited fluids. Table 3 provides data on the two inhibitors used in this study. A rigorous procedure was developed and applied for preparing the test specimens before and after the test to ensure that the weight loss is only induced by the test and not by any other extraneous conditions such as oxygen contamination. Sand settling and erosion/corrosion tests were conducted using 200 micron sand. The flow velocity for sand settling experiments was set at the velocity at which a stationary sand bed is formed. This velocity was about 1.2 ft/sec (0.36 m/s). Some of the inhibitor tests included Visco 103 de-emulsifiers to facilitate sand separation. The de-emulsifier concentration was 50 ppm. It was used in the low velocity tests for oil soluble inhibitor and in both high and low velocity tests for the water soluble inhibitor. For the water soluble inhibitor tests, samples were subjected to a continuously inhibited solution at a concentration of 100 ppm. For the oil soluble inhibitor tests, samples were tested in two conditions. The
)diameter pipelinediameter flowloop( U= U 7
1
pipelineflowloop (4)
)
dU( 0.0791 =
)dU( )( D 0.0791 = k
0.3
1.70.70.3
w
0.3
0.70.3440.644
ρμτ
μρ
(5)
6
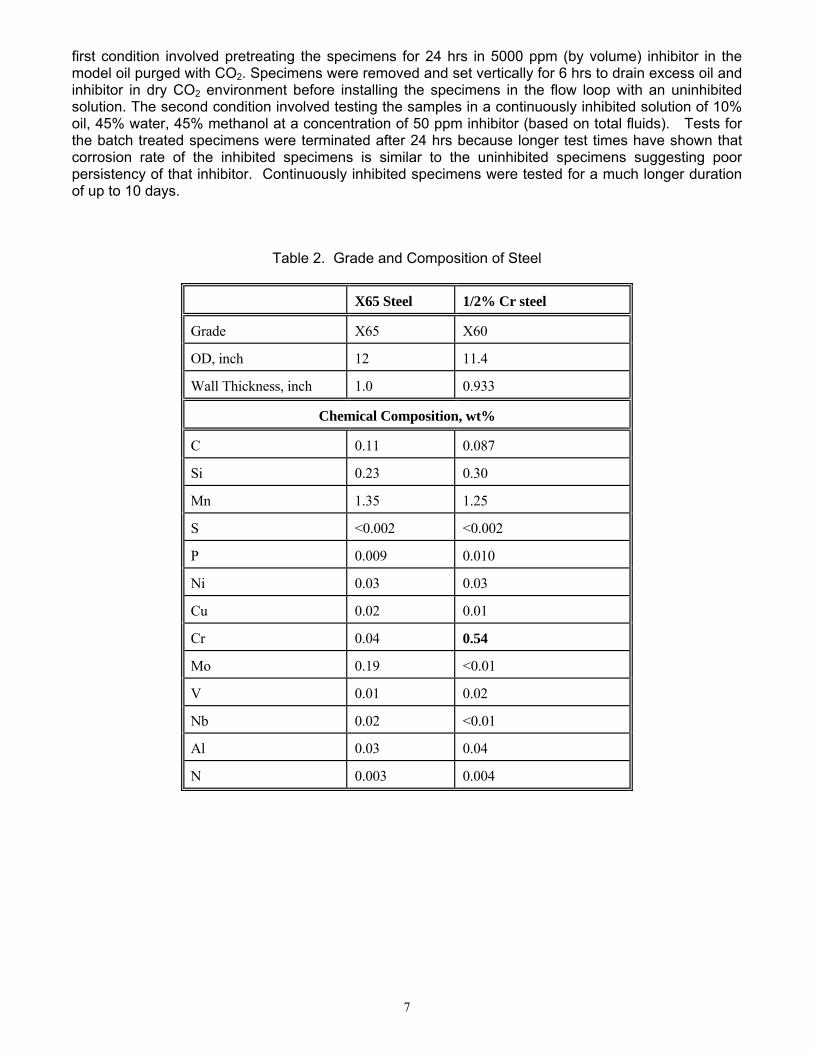
first condition involved pretreating the specimens for 24 hrs in 5000 ppm (by volume) inhibitor in the model oil purged with CO2. Specimens were removed and set vertically for 6 hrs to drain excess oil and inhibitor in dry CO2 environment before installing the specimens in the flow loop with an uninhibited solution. The second condition involved testing the samples in a continuously inhibited solution of 10% oil, 45% water, 45% methanol at a concentration of 50 ppm inhibitor (based on total fluids). Tests for the batch treated specimens were terminated after 24 hrs because longer test times have shown that corrosion rate of the inhibited specimens is similar to the uninhibited specimens suggesting poor persistency of that inhibitor. Continuously inhibited specimens were tested for a much longer duration of up to 10 days.
Table 2. Grade and Composition of Steel
X65 Steel 1/2% Cr steel
Grade X65 X60
OD, inch 12 11.4
Wall Thickness, inch 1.0 0.933
Chemical Composition, wt%
C 0.11 0.087
Si 0.23 0.30
Mn 1.35 1.25
S <0.002 <0.002
P 0.009 0.010
Ni 0.03 0.03
Cu 0.02 0.01
Cr 0.04 0.54
Mo 0.19 <0.01
V 0.01 0.02
Nb 0.02 <0.01
Al 0.03 0.04
N 0.003 0.004
7
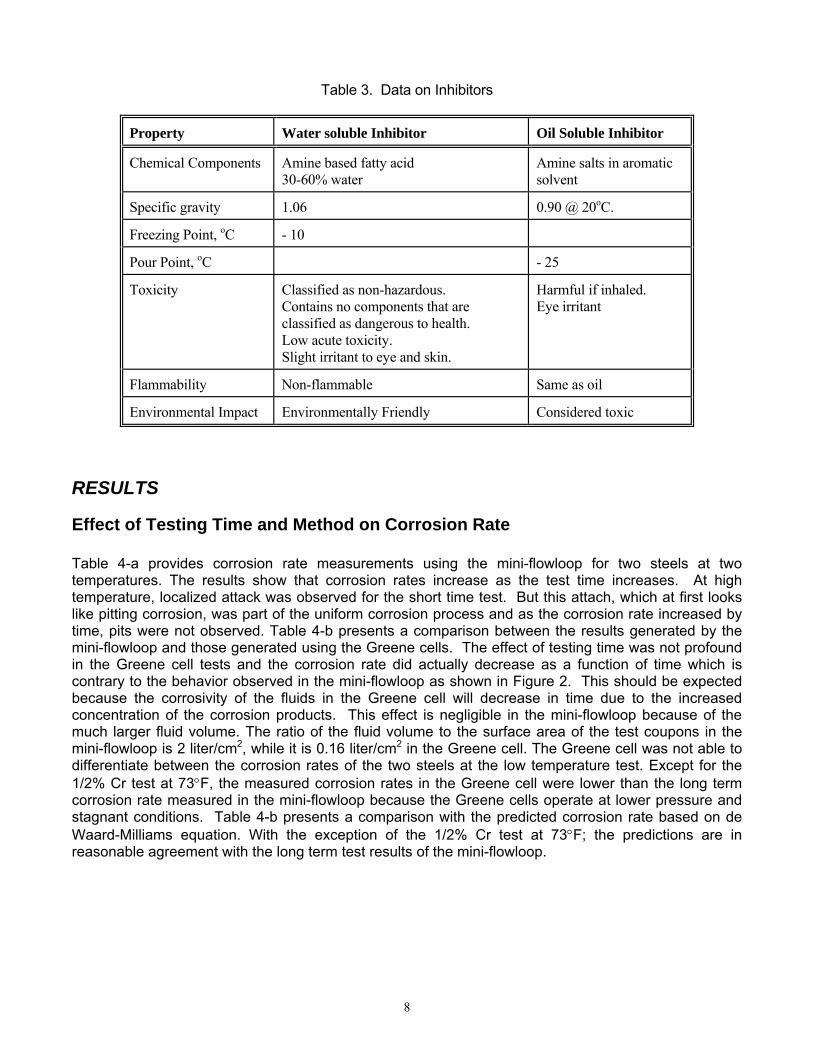
Table 3. Data on Inhibitors
Property Water soluble Inhibitor Oil Soluble Inhibitor
Chemical Components Amine based fatty acid 30-60% water
Amine salts in aromatic solvent
Specific gravity 1.06 0.90 @ 20oC.
Freezing Point, oC - 10
Pour Point, oC - 25
Toxicity Classified as non-hazardous. Contains no components that are classified as dangerous to health. Low acute toxicity. Slight irritant to eye and skin.
Harmful if inhaled. Eye irritant
Flammability Non-flammable Same as oil
Environmental Impact Environmentally Friendly Considered toxic
RESULTS
Effect of Testing Time and Method on Corrosion Rate Table 4-a provides corrosion rate measurements using the mini-flowloop for two steels at two temperatures. The results show that corrosion rates increase as the test time increases. At high temperature, localized attack was observed for the short time test. But this attach, which at first looks like pitting corrosion, was part of the uniform corrosion process and as the corrosion rate increased by time, pits were not observed. Table 4-b presents a comparison between the results generated by the mini-flowloop and those generated using the Greene cells. The effect of testing time was not profound in the Greene cell tests and the corrosion rate did actually decrease as a function of time which is contrary to the behavior observed in the mini-flowloop as shown in Figure 2. This should be expected because the corrosivity of the fluids in the Greene cell will decrease in time due to the increased concentration of the corrosion products. This effect is negligible in the mini-flowloop because of the much larger fluid volume. The ratio of the fluid volume to the surface area of the test coupons in the mini-flowloop is 2 liter/cm2, while it is 0.16 liter/cm2 in the Greene cell. The Greene cell was not able to differentiate between the corrosion rates of the two steels at the low temperature test. Except for the 1/2% Cr test at 73°F, the measured corrosion rates in the Greene cell were lower than the long term corrosion rate measured in the mini-flowloop because the Greene cells operate at lower pressure and stagnant conditions. Table 4-b presents a comparison with the predicted corrosion rate based on de Waard-Milliams equation. With the exception of the 1/2% Cr test at 73°F; the predictions are in reasonable agreement with the long term test results of the mini-flowloop.
8
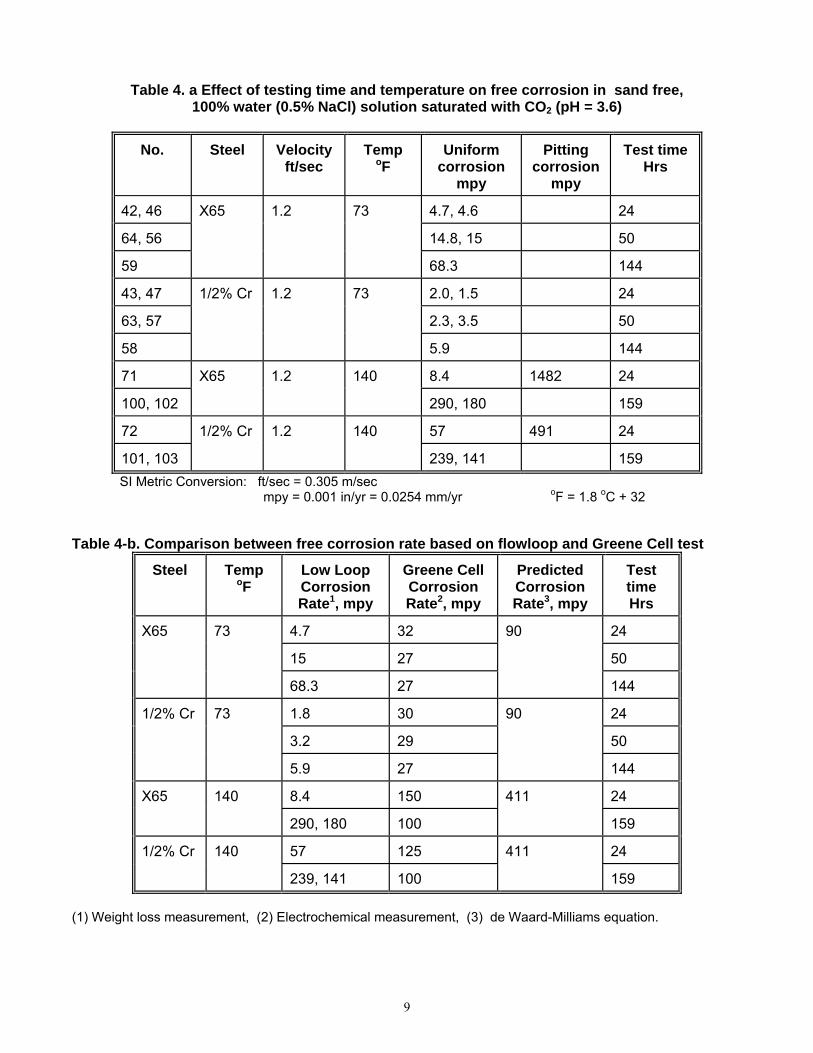
Table 4. a Effect of testing time and temperature on free corrosion in sand free, 100% water (0.5% NaCl) solution saturated with CO2 (pH = 3.6)
No. Steel Velocity ft/sec
Temp oF
Uniform corrosion
mpy
Pitting corrosion
mpy
Test time Hrs
42, 46 X65 1.2 73 4.7, 4.6 24
64, 56 14.8, 15 50
59 68.3 144
43, 47 1/2% Cr 1.2 73 2.0, 1.5 24
63, 57 2.3, 3.5 50
58 5.9 144
71 X65 1.2 140 8.4 1482 24
100, 102 290, 180 159
72 1/2% Cr 1.2 140 57 491 24
101, 103 239, 141 159 SI Metric Conversion: ft/sec = 0.305 m/sec
mpy = 0.001 in/yr = 0.0254 mm/yr oF = 1.8 oC + 32 Table 4-b. Comparison between free corrosion rate based on flowloop and Greene Cell test
Steel Temp oF
Low Loop Corrosion Rate1, mpy
Greene Cell Corrosion Rate2, mpy
Predicted Corrosion Rate3, mpy
Test time Hrs
X65 73 4.7 32 90 24
15 27 50
68.3 27 144
1/2% Cr 73 1.8 30 90 24
3.2 29 50
5.9 27 144
X65 140 8.4 150 411 24
290, 180 100 159
1/2% Cr 140 57 125 411 24
239, 141 100 159 (1) Weight loss measurement, (2) Electrochemical measurement, (3) de Waard-Milliams equation.
9
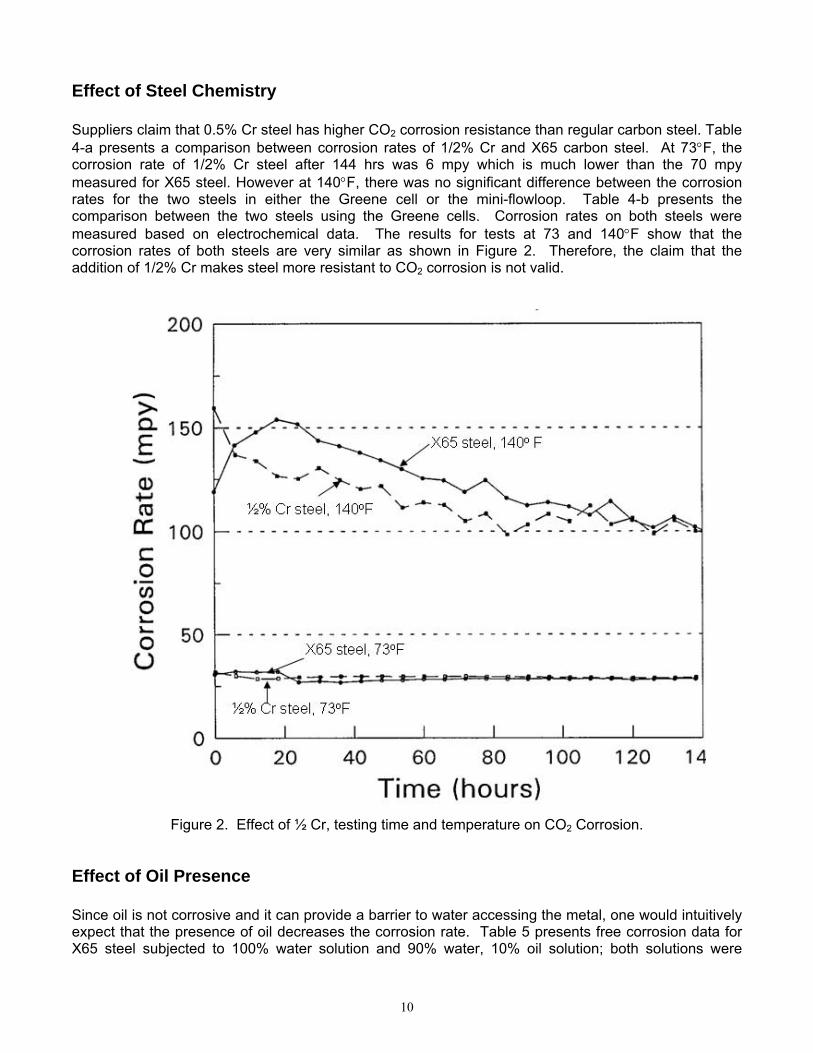
Effect of Steel Chemistry Suppliers claim that 0.5% Cr steel has higher CO2 corrosion resistance than regular carbon steel. Table 4-a presents a comparison between corrosion rates of 1/2% Cr and X65 carbon steel. At 73°F, the corrosion rate of 1/2% Cr steel after 144 hrs was 6 mpy which is much lower than the 70 mpy measured for X65 steel. However at 140°F, there was no significant difference between the corrosion rates for the two steels in either the Greene cell or the mini-flowloop. Table 4-b presents the comparison between the two steels using the Greene cells. Corrosion rates on both steels were measured based on electrochemical data. The results for tests at 73 and 140°F show that the corrosion rates of both steels are very similar as shown in Figure 2. Therefore, the claim that the addition of 1/2% Cr makes steel more resistant to CO2 corrosion is not valid.
Figure 2. Effect of ½ Cr, testing time and temperature on CO2 Corrosion.
Effect of Oil Presence Since oil is not corrosive and it can provide a barrier to water accessing the metal, one would intuitively expect that the presence of oil decreases the corrosion rate. Table 5 presents free corrosion data for X65 steel subjected to 100% water solution and 90% water, 10% oil solution; both solutions were
10
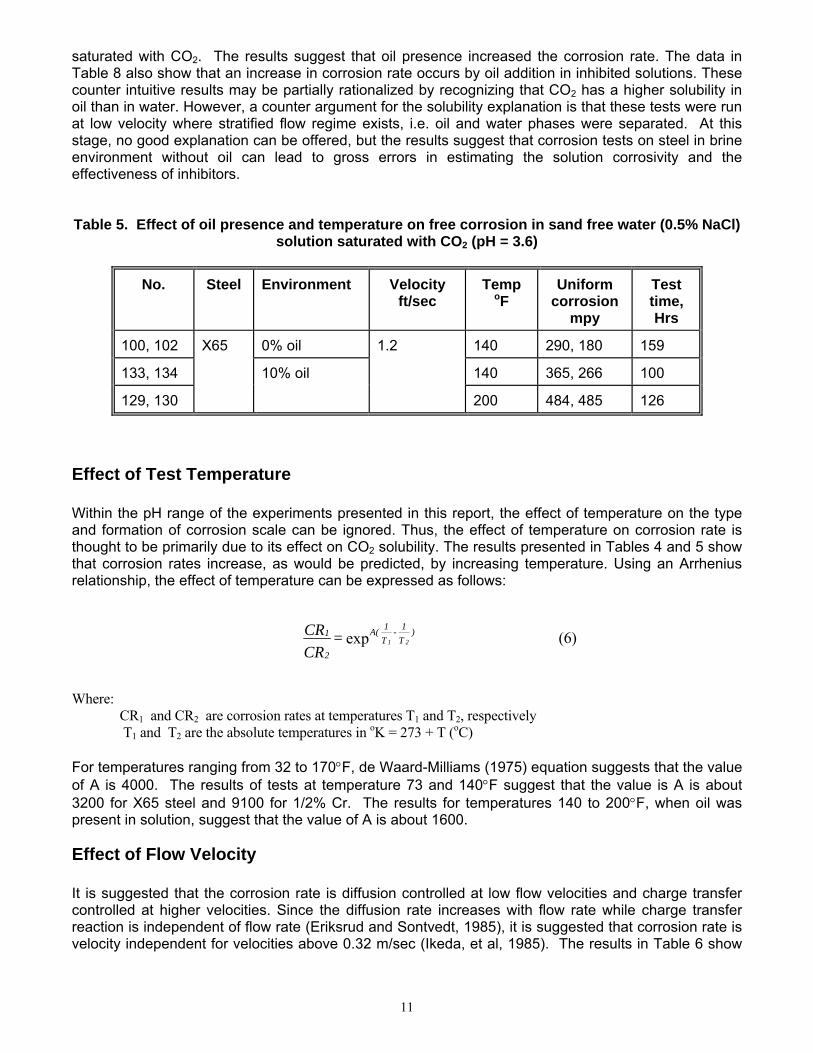
saturated with CO2. The results suggest that oil presence increased the corrosion rate. The data in Table 8 also show that an increase in corrosion rate occurs by oil addition in inhibited solutions. These counter intuitive results may be partially rationalized by recognizing that CO2 has a higher solubility in oil than in water. However, a counter argument for the solubility explanation is that these tests were run at low velocity where stratified flow regime exists, i.e. oil and water phases were separated. At this stage, no good explanation can be offered, but the results suggest that corrosion tests on steel in brine environment without oil can lead to gross errors in estimating the solution corrosivity and the effectiveness of inhibitors.
Table 5. Effect of oil presence and temperature on free corrosion in sand free water (0.5% NaCl)
solution saturated with CO2 (pH = 3.6)
No. Steel Environment Velocity ft/sec
Temp oF
Uniform corrosion
mpy
Test time, Hrs
100, 102 X65 0% oil 1.2 140 290, 180 159
133, 134 10% oil 140 365, 266 100
129, 130 200 484, 485 126
Effect of Test Temperature Within the pH range of the experiments presented in this report, the effect of temperature on the type and formation of corrosion scale can be ignored. Thus, the effect of temperature on corrosion rate is thought to be primarily due to its effect on CO2 solubility. The results presented in Tables 4 and 5 show that corrosion rates increase, as would be predicted, by increasing temperature. Using an Arrhenius relationship, the effect of temperature can be expressed as follows:
Where: CR1 and CR2 are corrosion rates at temperatures T1 and T2, respectively T1 and T2 are the absolute temperatures in oK = 273 + T (oC) For temperatures ranging from 32 to 170°F, de Waard-Milliams (1975) equation suggests that the value of A is 4000. The results of tests at temperature 73 and 140°F suggest that the value is A is about 3200 for X65 steel and 9100 for 1/2% Cr. The results for temperatures 140 to 200°F, when oil was present in solution, suggest that the value of A is about 1600.
Effect of Flow Velocity It is suggested that the corrosion rate is diffusion controlled at low flow velocities and charge transfer controlled at higher velocities. Since the diffusion rate increases with flow rate while charge transfer reaction is independent of flow rate (Eriksrud and Sontvedt, 1985), it is suggested that corrosion rate is velocity independent for velocities above 0.32 m/sec (Ikeda, et al, 1985). The results in Table 6 show
exp )T1 -
T1A(
2
121 =
CRCR (6)
11
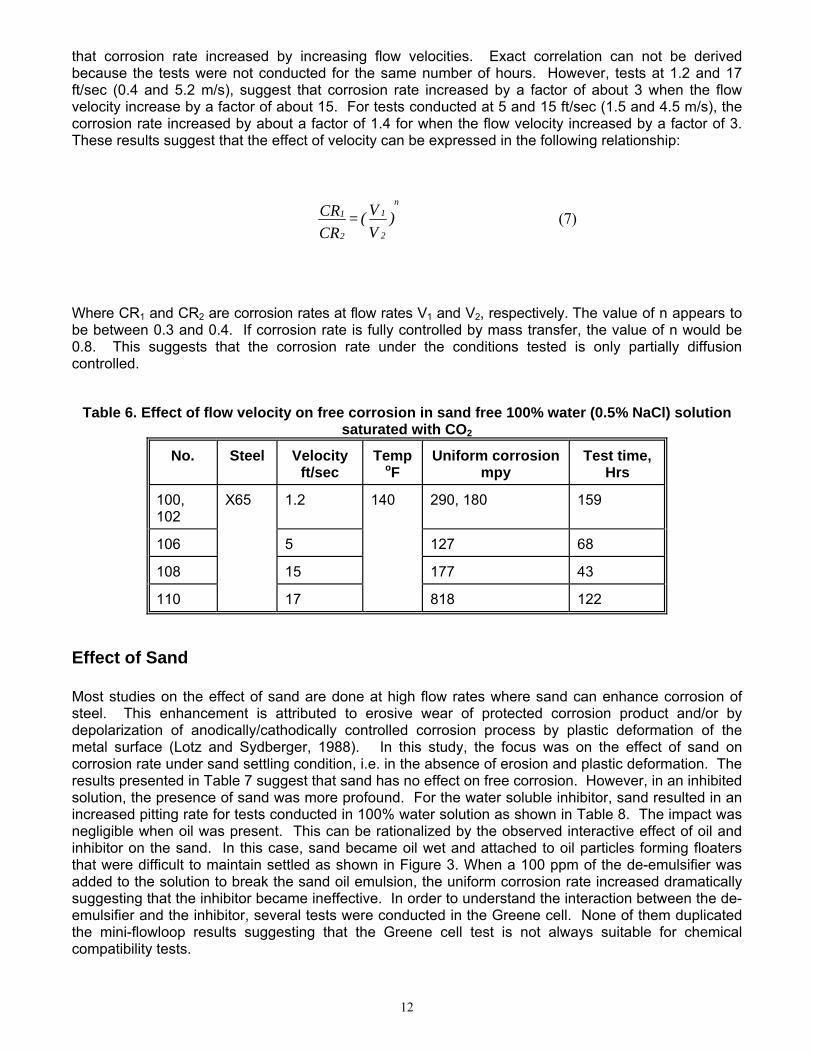
that corrosion rate increased by increasing flow velocities. Exact correlation can not be derived because the tests were not conducted for the same number of hours. However, tests at 1.2 and 17 ft/sec (0.4 and 5.2 m/s), suggest that corrosion rate increased by a factor of about 3 when the flow velocity increase by a factor of about 15. For tests conducted at 5 and 15 ft/sec (1.5 and 4.5 m/s), the corrosion rate increased by about a factor of 1.4 for when the flow velocity increased by a factor of 3. These results suggest that the effect of velocity can be expressed in the following relationship:
Where CR1 and CR2 are corrosion rates at flow rates V1 and V2, respectively. The value of n appears to be between 0.3 and 0.4. If corrosion rate is fully controlled by mass transfer, the value of n would be 0.8. This suggests that the corrosion rate under the conditions tested is only partially diffusion controlled.
Table 6. Effect of flow velocity on free corrosion in sand free 100% water (0.5% NaCl) solution saturated with CO2
No. Steel Velocity ft/sec
Temp oF
Uniform corrosion mpy
Test time, Hrs
100, 102
X65 1.2 140 290, 180 159
106 5 127 68
108 15 177 43
110 17 818 122
Effect of Sand Most studies on the effect of sand are done at high flow rates where sand can enhance corrosion of steel. This enhancement is attributed to erosive wear of protected corrosion product and/or by depolarization of anodically/cathodically controlled corrosion process by plastic deformation of the metal surface (Lotz and Sydberger, 1988). In this study, the focus was on the effect of sand on corrosion rate under sand settling condition, i.e. in the absence of erosion and plastic deformation. The results presented in Table 7 suggest that sand has no effect on free corrosion. However, in an inhibited solution, the presence of sand was more profound. For the water soluble inhibitor, sand resulted in an increased pitting rate for tests conducted in 100% water solution as shown in Table 8. The impact was negligible when oil was present. This can be rationalized by the observed interactive effect of oil and inhibitor on the sand. In this case, sand became oil wet and attached to oil particles forming floaters that were difficult to maintain settled as shown in Figure 3. When a 100 ppm of the de-emulsifier was added to the solution to break the sand oil emulsion, the uniform corrosion rate increased dramatically suggesting that the inhibitor became ineffective. In order to understand the interaction between the de-emulsifier and the inhibitor, several tests were conducted in the Greene cell. None of them duplicated the mini-flowloop results suggesting that the Greene cell test is not always suitable for chemical compatibility tests.
)VV( =
CRCR
2
1n
2
1 (7)
12
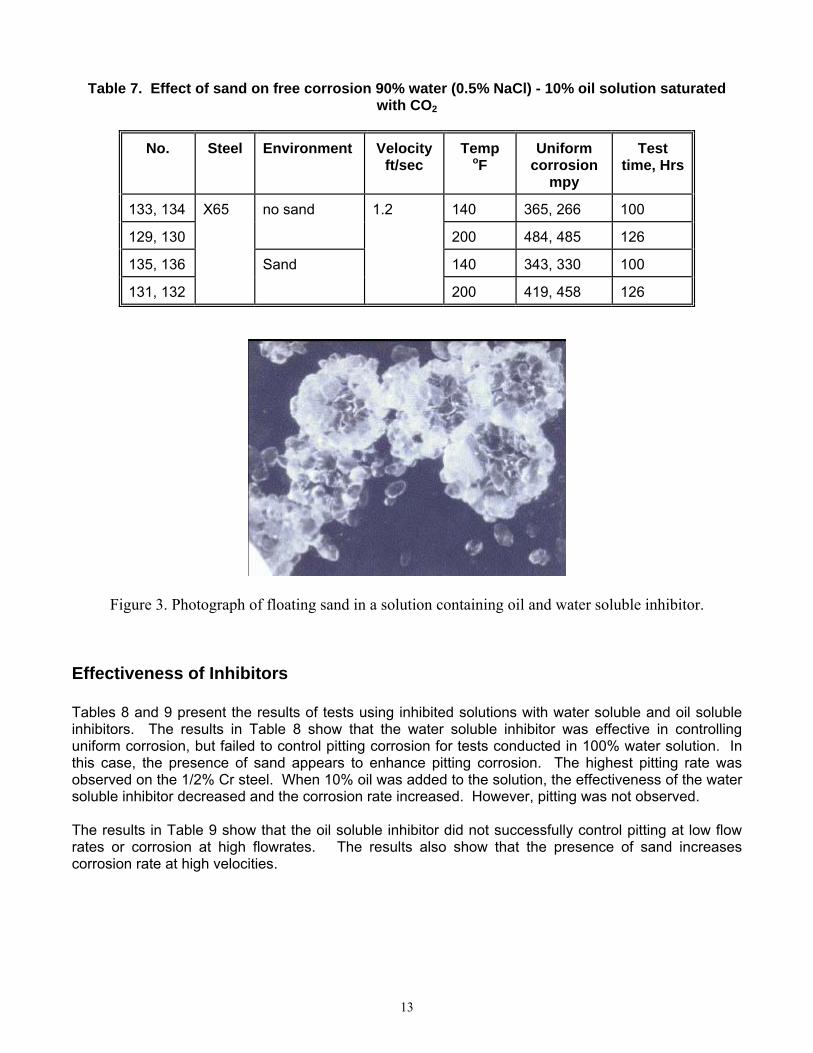
Table 7. Effect of sand on free corrosion 90% water (0.5% NaCl) - 10% oil solution saturated with CO2
No. Steel Environment Velocity ft/sec
Temp oF
Uniform corrosion
mpy
Test time, Hrs
133, 134 X65 no sand 1.2 140 365, 266 100
129, 130 200 484, 485 126
135, 136 Sand 140 343, 330 100
131, 132 200 419, 458 126
Figure 3. Photograph of floating sand in a solution containing oil and water soluble inhibitor.
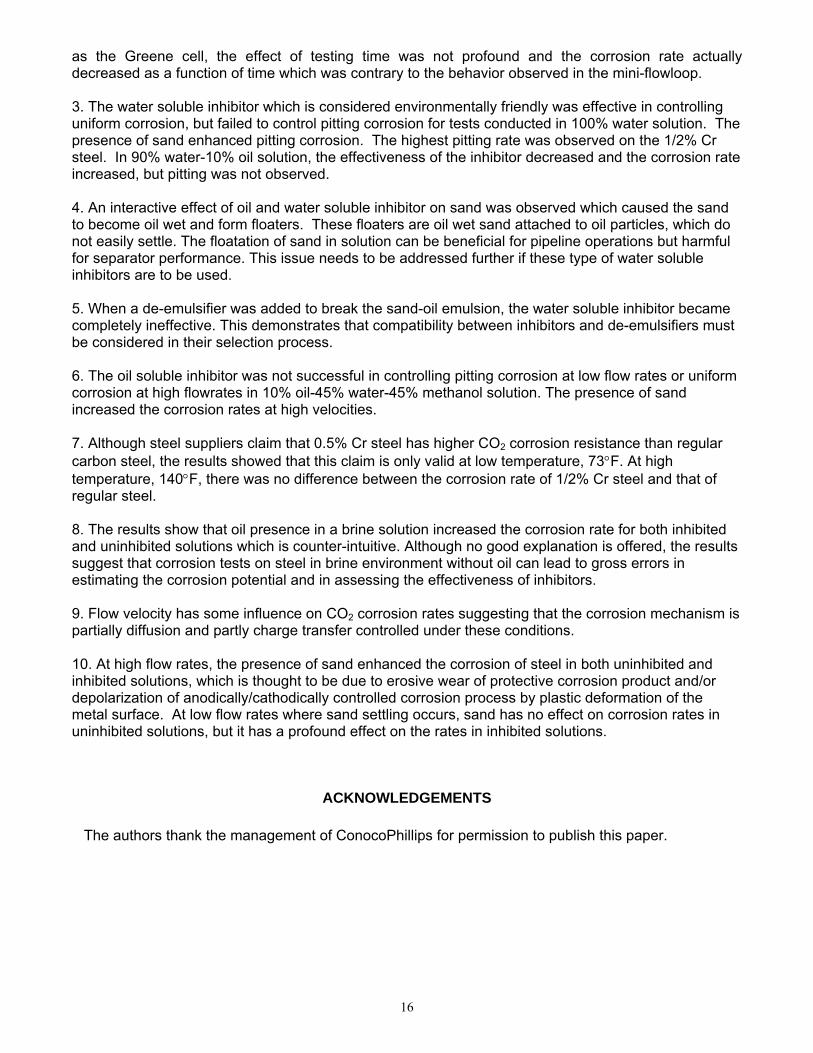
Effectiveness of Inhibitors Tables 8 and 9 present the results of tests using inhibited solutions with water soluble and oil soluble inhibitors. The results in Table 8 show that the water soluble inhibitor was effective in controlling uniform corrosion, but failed to control pitting corrosion for tests conducted in 100% water solution. In this case, the presence of sand appears to enhance pitting corrosion. The highest pitting rate was observed on the 1/2% Cr steel. When 10% oil was added to the solution, the effectiveness of the water soluble inhibitor decreased and the corrosion rate increased. However, pitting was not observed. The results in Table 9 show that the oil soluble inhibitor did not successfully control pitting at low flow rates or corrosion at high flowrates. The results also show that the presence of sand increases corrosion rate at high velocities.
13
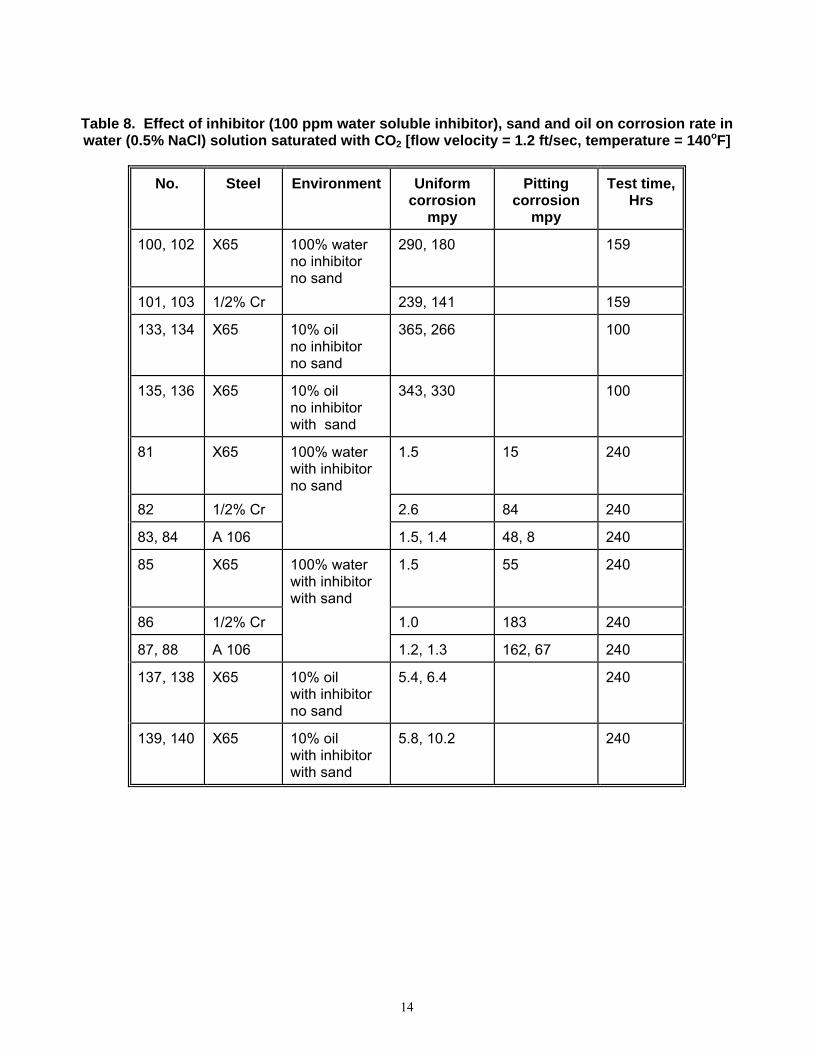
Table 8. Effect of inhibitor (100 ppm water soluble inhibitor), sand and oil on corrosion rate in water (0.5% NaCl) solution saturated with CO2 [flow velocity = 1.2 ft/sec, temperature = 140oF]
No. Steel Environment Uniform corrosion
mpy
Pitting corrosion
mpy
Test time, Hrs
100, 102 X65 100% water no inhibitor no sand
290, 180 159
101, 103 1/2% Cr 239, 141 159
133, 134 X65 10% oil no inhibitor no sand
365, 266 100
135, 136 X65 10% oil no inhibitor with sand
343, 330 100
81 X65 100% water with inhibitor no sand
1.5 15 240
82 1/2% Cr 2.6 84 240
83, 84 A 106 1.5, 1.4 48, 8 240
85 X65 100% water with inhibitor with sand
1.5 55 240
86 1/2% Cr 1.0 183 240
87, 88 A 106 1.2, 1.3 162, 67 240
137, 138 X65 10% oil with inhibitor no sand
5.4, 6.4 240
139, 140 X65 10% oil with inhibitor with sand
5.8, 10.2 240
14
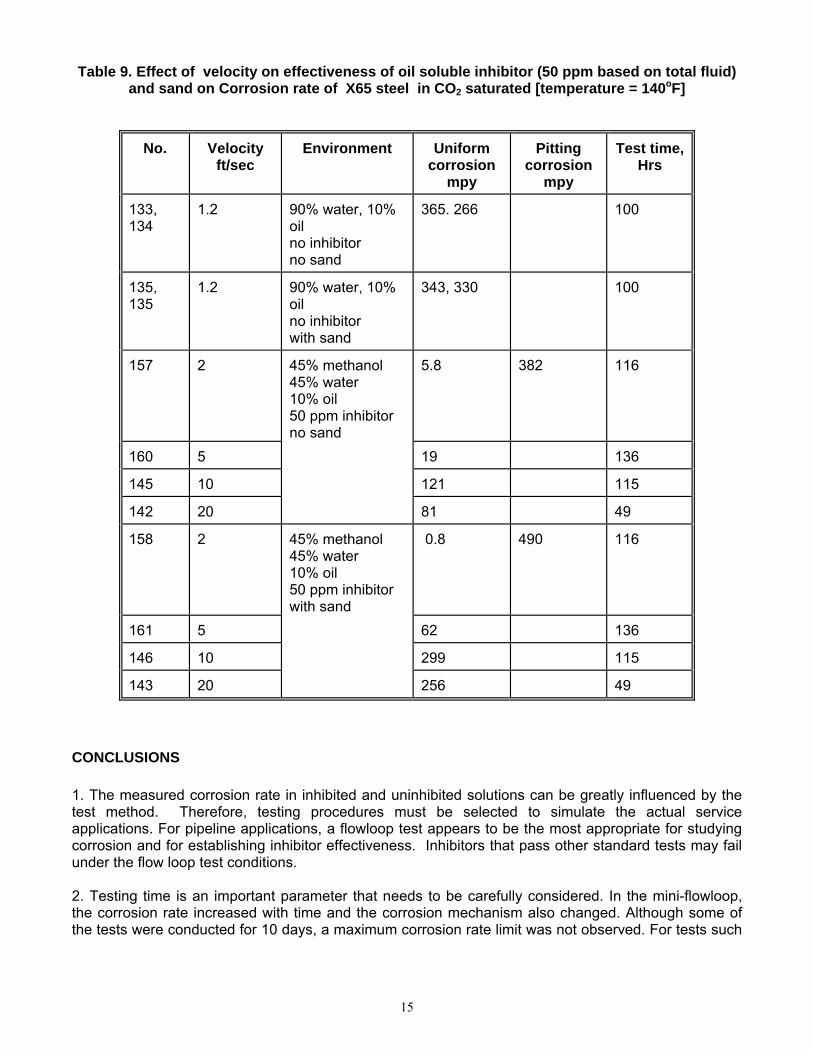
Table 9. Effect of velocity on effectiveness of oil soluble inhibitor (50 ppm based on total fluid)
and sand on Corrosion rate of X65 steel in CO2 saturated [temperature = 140oF]
No. Velocity ft/sec
Environment Uniform corrosion
mpy
Pitting corrosion
mpy
Test time, Hrs
133, 134
1.2 90% water, 10% oil no inhibitor no sand
365. 266 100
135, 135
1.2 90% water, 10% oil no inhibitor with sand
343, 330 100
157 2 45% methanol 45% water 10% oil 50 ppm inhibitor no sand
5.8 382 116
160 5 19 136
145 10 121 115
142 20 81 49
158 2 45% methanol 45% water 10% oil 50 ppm inhibitor with sand
0.8 490 116
161 5 62 136
146 10 299 115
143 20 256 49
CONCLUSIONS 1. The measured corrosion rate in inhibited and uninhibited solutions can be greatly influenced by the test method. Therefore, testing procedures must be selected to simulate the actual service applications. For pipeline applications, a flowloop test appears to be the most appropriate for studying corrosion and for establishing inhibitor effectiveness. Inhibitors that pass other standard tests may fail under the flow loop test conditions. 2. Testing time is an important parameter that needs to be carefully considered. In the mini-flowloop, the corrosion rate increased with time and the corrosion mechanism also changed. Although some of the tests were conducted for 10 days, a maximum corrosion rate limit was not observed. For tests such
15
as the Greene cell, the effect of testing time was not profound and the corrosion rate actually decreased as a function of time which was contrary to the behavior observed in the mini-flowloop. 3. The water soluble inhibitor which is considered environmentally friendly was effective in controlling uniform corrosion, but failed to control pitting corrosion for tests conducted in 100% water solution. The presence of sand enhanced pitting corrosion. The highest pitting rate was observed on the 1/2% Cr steel. In 90% water-10% oil solution, the effectiveness of the inhibitor decreased and the corrosion rate increased, but pitting was not observed. 4. An interactive effect of oil and water soluble inhibitor on sand was observed which caused the sand to become oil wet and form floaters. These floaters are oil wet sand attached to oil particles, which do not easily settle. The floatation of sand in solution can be beneficial for pipeline operations but harmful for separator performance. This issue needs to be addressed further if these type of water soluble inhibitors are to be used. 5. When a de-emulsifier was added to break the sand-oil emulsion, the water soluble inhibitor became completely ineffective. This demonstrates that compatibility between inhibitors and de-emulsifiers must be considered in their selection process.
6. The oil soluble inhibitor was not successful in controlling pitting corrosion at low flow rates or uniform corrosion at high flowrates in 10% oil-45% water-45% methanol solution. The presence of sand increased the corrosion rates at high velocities.
7. Although steel suppliers claim that 0.5% Cr steel has higher CO2 corrosion resistance than regular carbon steel, the results showed that this claim is only valid at low temperature, 73°F. At high temperature, 140°F, there was no difference between the corrosion rate of 1/2% Cr steel and that of regular steel.
8. The results show that oil presence in a brine solution increased the corrosion rate for both inhibited and uninhibited solutions which is counter-intuitive. Although no good explanation is offered, the results suggest that corrosion tests on steel in brine environment without oil can lead to gross errors in estimating the corrosion potential and in assessing the effectiveness of inhibitors. 9. Flow velocity has some influence on CO2 corrosion rates suggesting that the corrosion mechanism is partially diffusion and partly charge transfer controlled under these conditions. 10. At high flow rates, the presence of sand enhanced the corrosion of steel in both uninhibited and inhibited solutions, which is thought to be due to erosive wear of protective corrosion product and/or depolarization of anodically/cathodically controlled corrosion process by plastic deformation of the metal surface. At low flow rates where sand settling occurs, sand has no effect on corrosion rates in uninhibited solutions, but it has a profound effect on the rates in inhibited solutions.
ACKNOWLEDGEMENTS
The authors thank the management of ConocoPhillips for permission to publish this paper.
16
REFERENCES Dayalan, E., Johar, T., Shadley, J. R. and Shirazi, S. A. (1955), "Hydrodynamic Correlations between
Pipe Flow and Rotating Cylinder Electrode (RCE) for Oilfield Corrosion - Some Insights," Corrosion 95, paper 117, NACE, Houston, TX.
de Waard, C. and Milliams, D. E. (1975), "Carbonic Acid Corrosion of Steel," Corrosion, Vol. 31 (5), p.
177. Eriksrud, E. and Sontvedt, T. (1985), "Effect of Flow on CO2 Corrosion Rates in Real and Synthetic
Formation Waters," Advances in CO2 Corrosion, p. 20, NACE, Houston, TX Lotz, U. and Sydberger, T. (1988), "CO2 Corrosion of C Steel and 13 Cr Steel in Particle Laden Fluid,"
Corrosion, Vol. 44 (11), p. 800 Silverman, D. C. (1990), "Rotating Cylinder Electrode - An Approach for Predicting Velocity Sensitive
Corrosion," Corrosion/90, paper no. 13, NACE, Houston, TX.
17