
09/04/2014 ADVANCES IN MODELLING METHODS FOR …
27
SAFER, SMARTER, GREENER DNV GL © 2013 ADVANCES IN MODELLING METHODS FOR ULTRA- DEEPWATER MOORINGS AND RISERS Alex Argyros 09/04/2014 9 March 2014 1 Madrid, Spain
Transcript of 09/04/2014 ADVANCES IN MODELLING METHODS FOR …
DNV GL © 2013 SAFER, SMARTER, GREENER DNV GL © 2013
ADVANCES IN MODELLING METHODS FOR ULTRA-DEEPWATER MOORINGS AND RISERS
Alex Argyros
09/04/2014
9 March 2014 1
Madrid, Spain

DNV GL © 2013
CONTENT
9 March 2014 2
MCEDD 2014 Theme
Demand – Deepwater field development
Incidents/integrity
Need for testing
Innovation
DNV GL © 2013
DEEPWATER FIELD DEVELOPMENT - DEMAND
9 March 2014 3
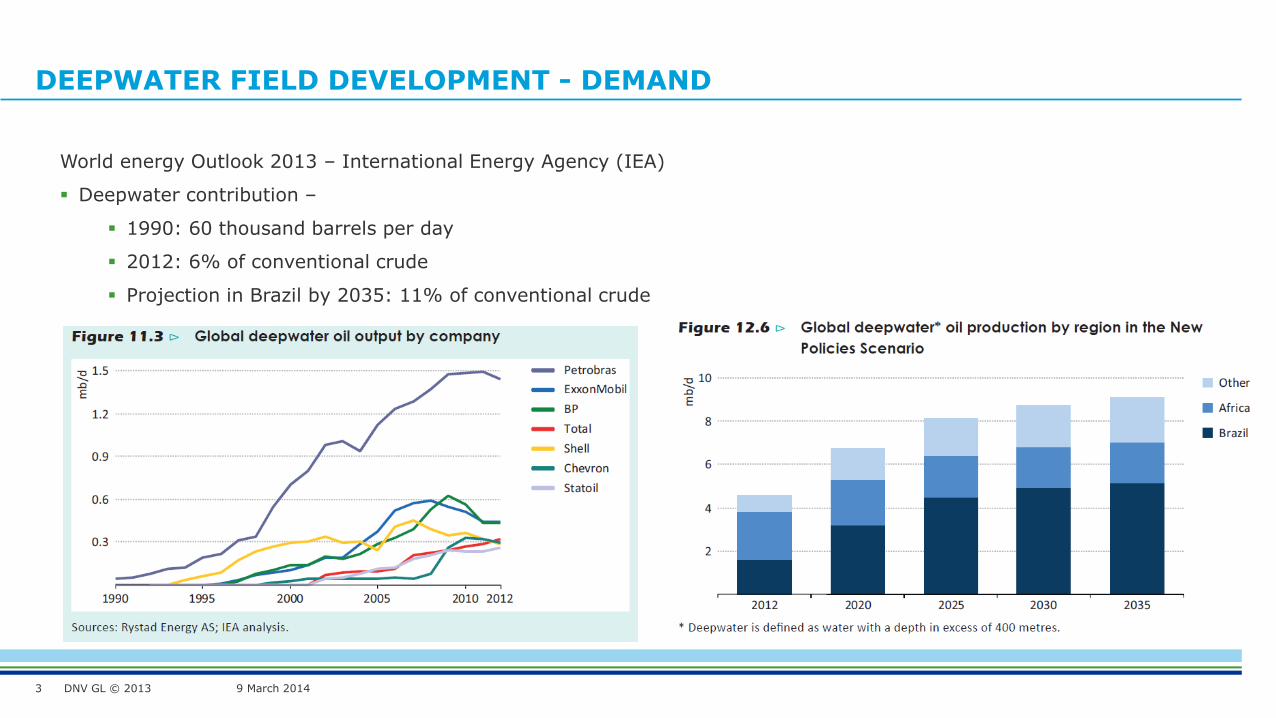
World energy Outlook 2013 – International Energy Agency (IEA)
Deepwater contribution –
1990: 60 thousand barrels per day
2012: 6% of conventional crude
Projection in Brazil by 2035: 11% of conventional crude
DNV GL © 2013
MOORING INCIDENTS - INTEGRITY
9 March 2014 4
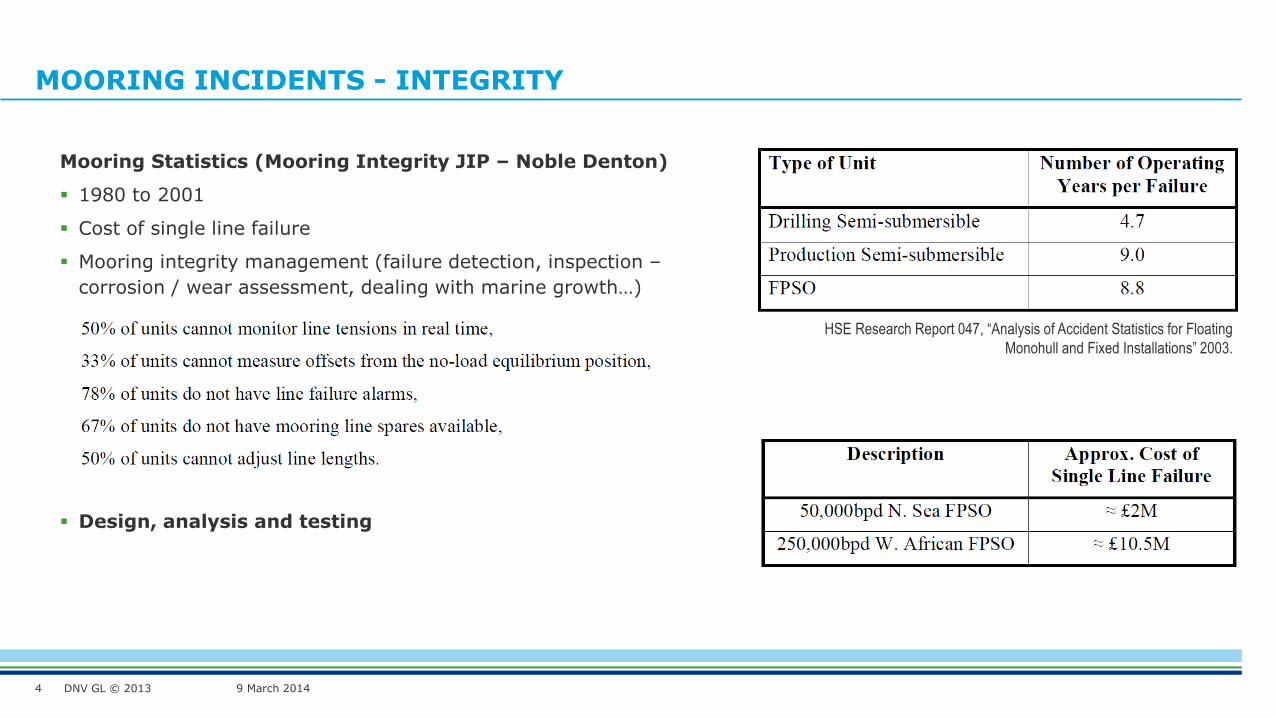
Mooring Statistics (Mooring Integrity JIP – Noble Denton)
1980 to 2001
Cost of single line failure
Mooring integrity management (failure detection, inspection –
corrosion / wear assessment, dealing with marine growth…)
Design, analysis and testing
HSE Research Report 047, “Analysis of Accident Statistics for Floating
Monohull and Fixed Installations” 2003.
DNV GL © 2013
ULTRA-DEEPWATER MODEL TESTING
9 March 2014 5
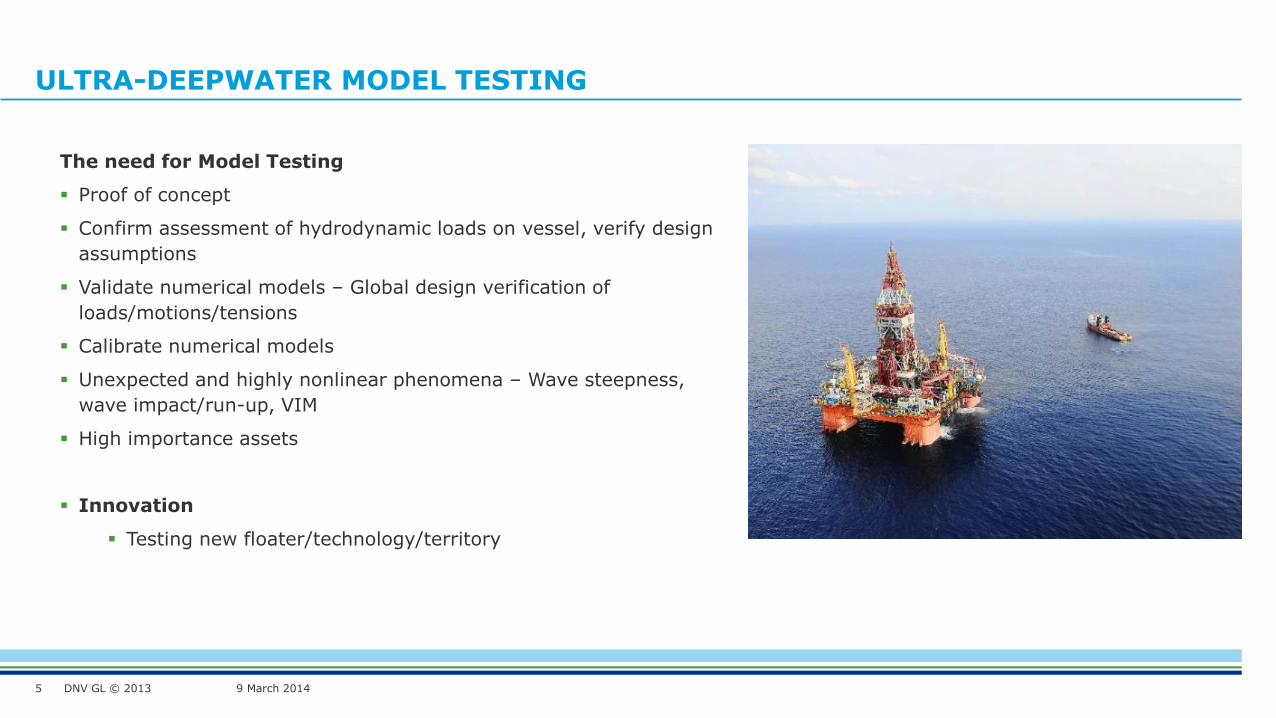
The need for Model Testing
Proof of concept
Confirm assessment of hydrodynamic loads on vessel, verify design
assumptions
Validate numerical models – Global design verification of
loads/motions/tensions
Calibrate numerical models
Unexpected and highly nonlinear phenomena – Wave steepness,
wave impact/run-up, VIM
High importance assets
Innovation
Testing new floater/technology/territory
DNV GL © 2013
MOTIVATION
9 March 2014 6
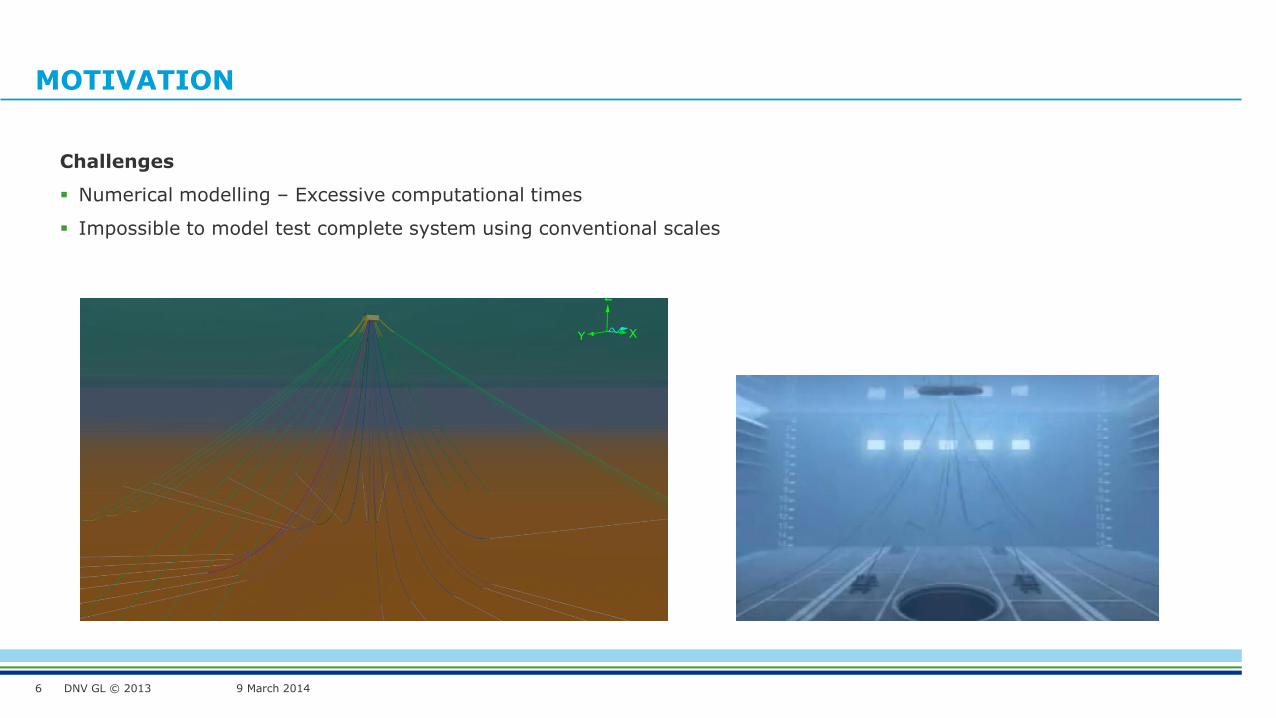
Challenges
Numerical modelling – Excessive computational times
Impossible to model test complete system using conventional scales
DNV GL © 2013
TRUNCATION
9 March 2014 7
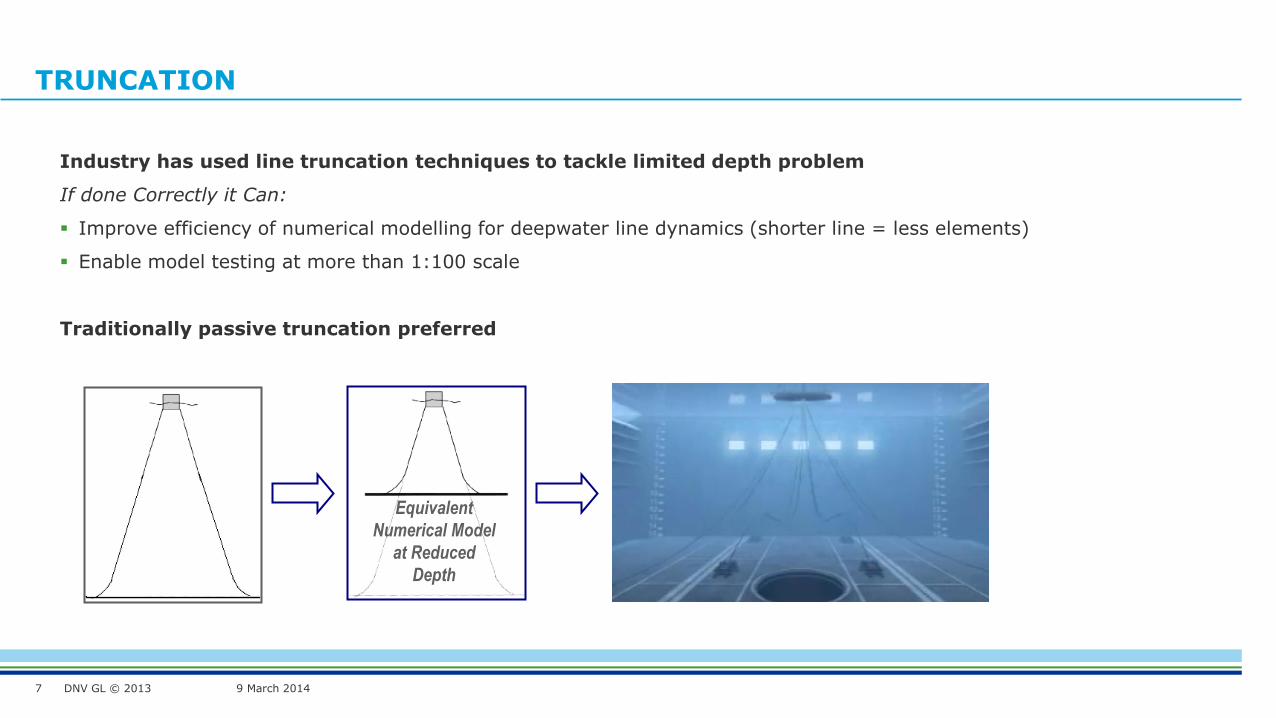
Industry has used line truncation techniques to tackle limited depth problem
If done Correctly it Can:
Improve efficiency of numerical modelling for deepwater line dynamics (shorter line = less elements)
Enable model testing at more than 1:100 scale
Traditionally passive truncation preferred
Equivalent
Numerical Model
at Reduced
Depth
DNV GL © 2013
PASSIVE TRUNCATION
9 March 2014 8
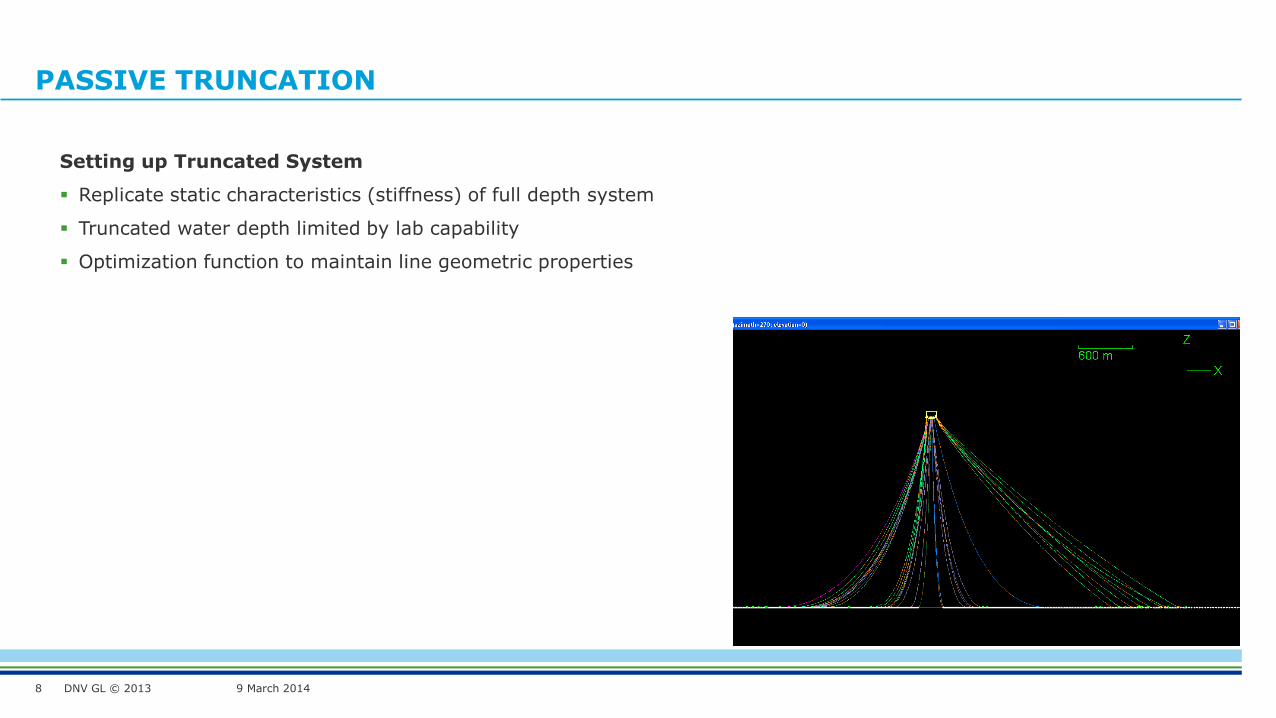
Setting up Truncated System
Replicate static characteristics (stiffness) of full depth system
Truncated water depth limited by lab capability
Optimization function to maintain line geometric properties
DNV GL © 2013
PASSIVE TRUNCATION
9 March 2014 9
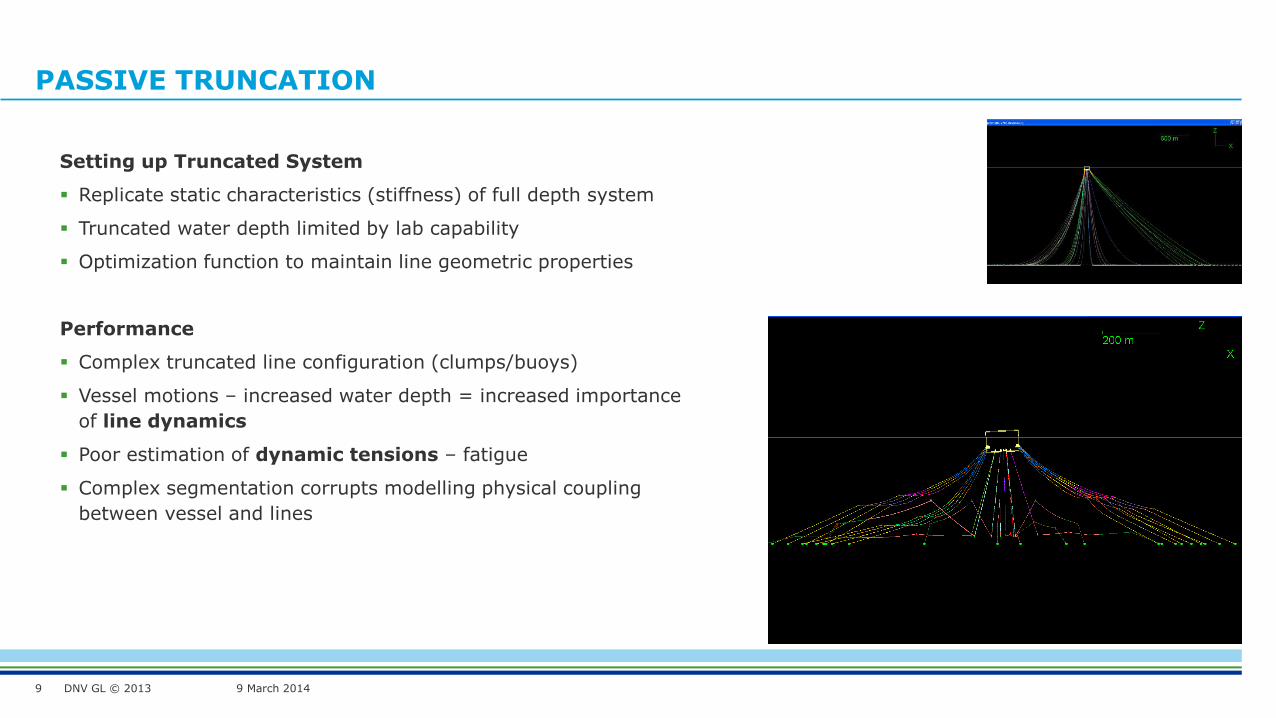
Setting up Truncated System
Replicate static characteristics (stiffness) of full depth system
Truncated water depth limited by lab capability
Optimization function to maintain line geometric properties
Performance
Complex truncated line configuration (clumps/buoys)
Vessel motions – increased water depth = increased importance
of line dynamics
Poor estimation of dynamic tensions – fatigue
Complex segmentation corrupts modelling physical coupling
between vessel and lines

DNV GL © 2013
MOORING DAMPING
9 March 2014 10
5 10 15 20 25 30 35 40 45 500
5
10
15
20
25
30
35
40
45
50
Amplitude of LF motion (m)
Da
mp
ing
ra
tio o
f mo
ori
ng
s
%
LF only
Superimposed WF A2mT10s
Superimposed WF A4mT10s
Superimposed WF A4mT15s
Superimposed WF A4mT20s
Superimposed WF A8mT20s
Ref – Zhengqiang Xu, Strathclyde University
Turret moored FPSO – LF and superimposed WF motions
DNV recommendation for CD
WF motions will dramatically increase mooring damping
Riser damping comparable to mooring damping. Riser damping less
sensitive to WF motions
DNV GL © 2013
MOORING DAMPING
9 March 2014 11
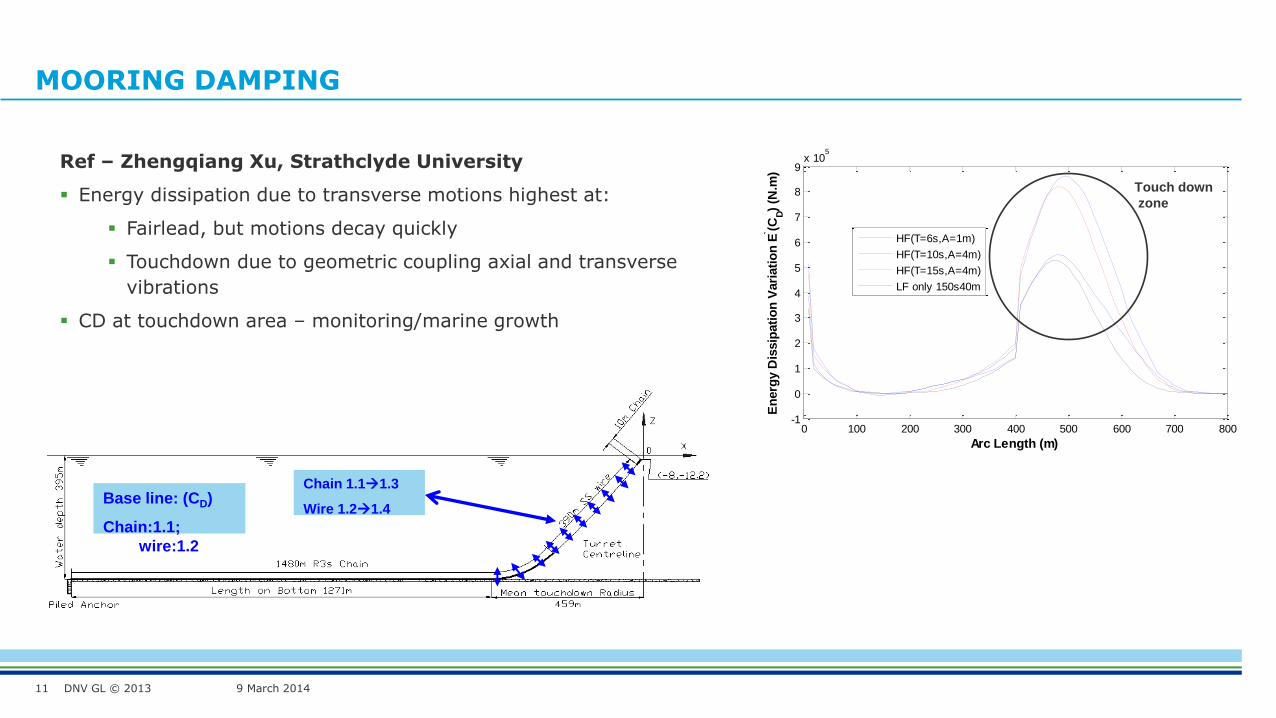
Ref – Zhengqiang Xu, Strathclyde University
Energy dissipation due to transverse motions highest at:
Fairlead, but motions decay quickly
Touchdown due to geometric coupling axial and transverse
vibrations
CD at touchdown area – monitoring/marine growth
Base line: (CD)
Chain:1.1;
wire:1.2
Chain 1.11.3
Wire 1.21.4
0 100 200 300 400 500 600 700 800-1
0
1
2
3
4
5
6
7
8
9x 10
5
Arc Length (m)
En
erg
y D
issip
ati
on
Vari
ati
on
E` (C
D)
(N.m
)
HF(T=6s,A=1m)
HF(T=10s,A=4m)
HF(T=15s,A=4m)
LF only 150s40m
Touch down
zone
DNV GL © 2013
LOCALIZED TRUNCATION
9 March 2014 12
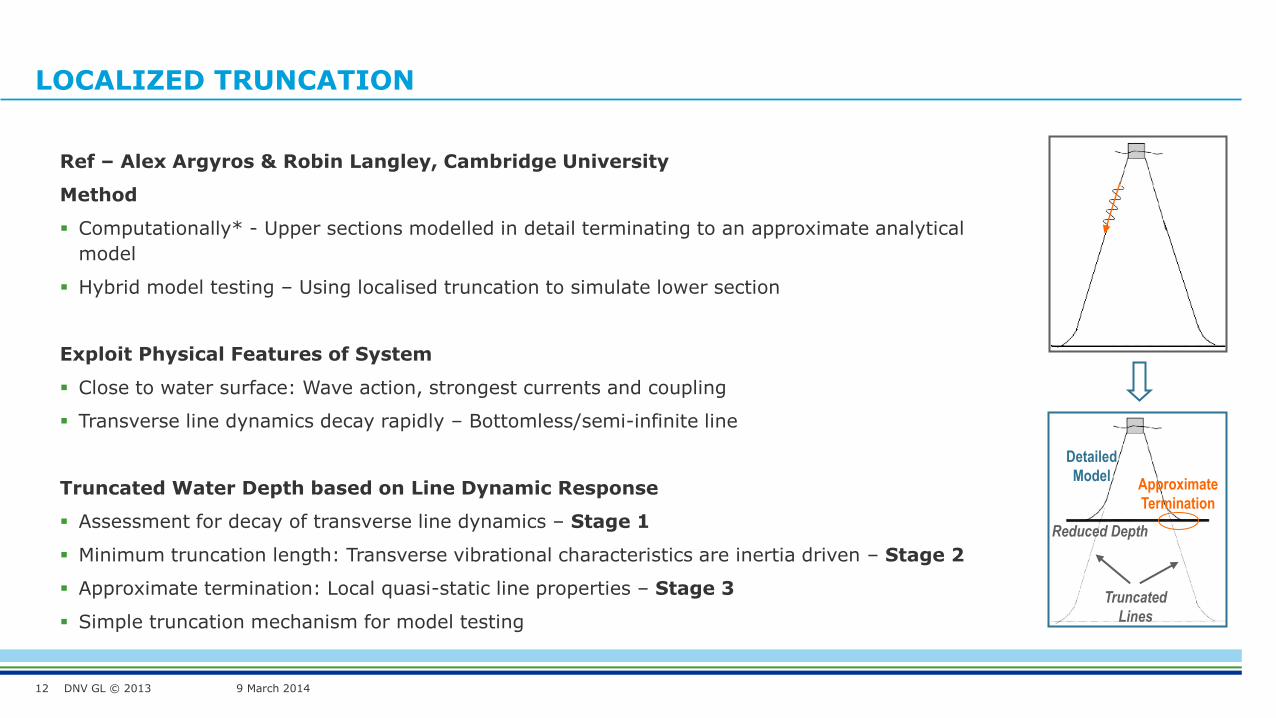
Ref – Alex Argyros & Robin Langley, Cambridge University
Method
Computationally* - Upper sections modelled in detail terminating to an approximate analytical
model
Hybrid model testing – Using localised truncation to simulate lower section
Exploit Physical Features of System
Close to water surface: Wave action, strongest currents and coupling
Transverse line dynamics decay rapidly – Bottomless/semi-infinite line
Truncated Water Depth based on Line Dynamic Response
Assessment for decay of transverse line dynamics – Stage 1
Minimum truncation length: Transverse vibrational characteristics are inertia driven – Stage 2
Approximate termination: Local quasi-static line properties – Stage 3
Simple truncation mechanism for model testing
Truncated
Lines
Detailed
Model Approximate
Termination
Reduced Depth
DNV GL © 2013
EXAMPLE TRUNCATION
9 March 2014 13
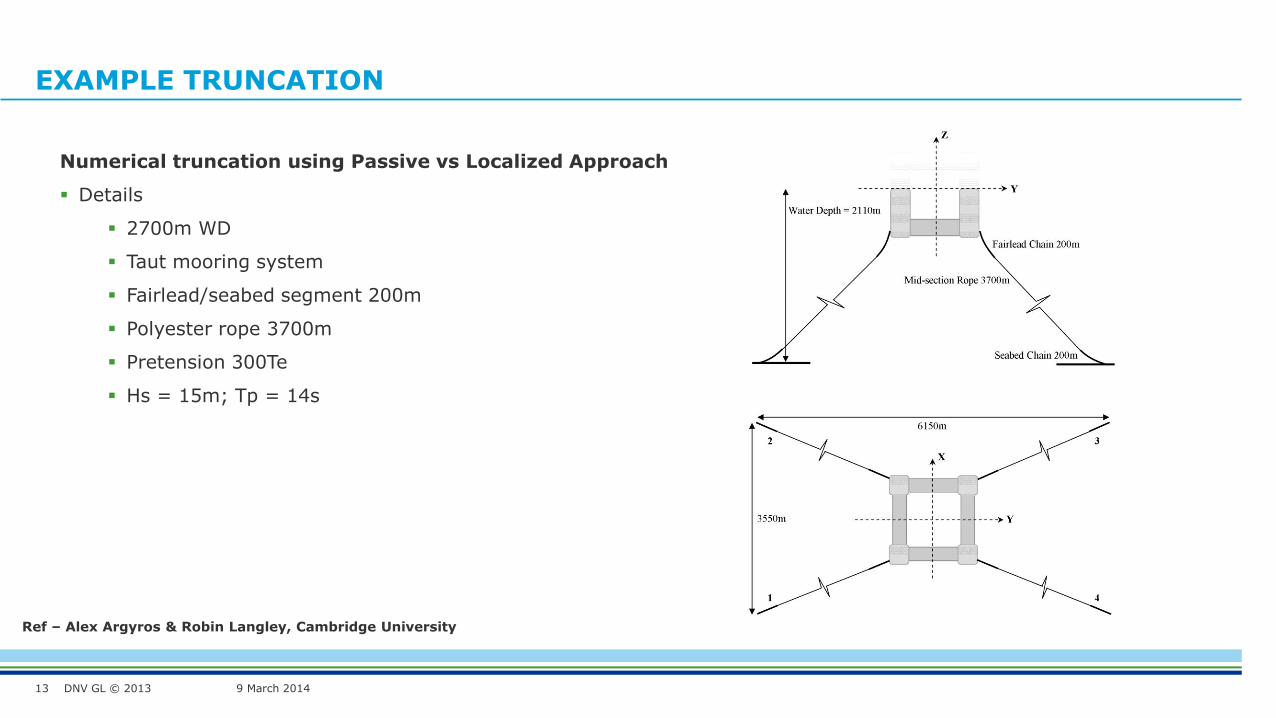
Numerical truncation using Passive vs Localized Approach
Details
2700m WD
Taut mooring system
Fairlead/seabed segment 200m
Polyester rope 3700m
Pretension 300Te
Hs = 15m; Tp = 14s
Ref – Alex Argyros & Robin Langley, Cambridge University

DNV GL © 2013
EXAMPLE TRUNCATION
9 March 2014 14
Numerical truncation using Passive vs Localized Approach
Ref – Alex Argyros & Robin Langley, Cambridge University

DNV GL © 2013
EXAMPLE TRUNCATION
9 March 2014 15
Numerical truncation using Passive vs Localized Approach
Passive Truncation
6 segments – 3 line types
2 buoys + 1 clump weight
Localized Truncation
Stages 1 & 2 – Truncation within rope segment with minimum d:dT
~ 1:4.5
Upper section modelled exactly as the full depth line
End termination – 3 non-linear coupled springs in X, Y, Z
Ref – Alex Argyros & Robin Langley, Cambridge University
DNV GL © 2013
EXAMPLE TRUNCATION
9 March 2014 16
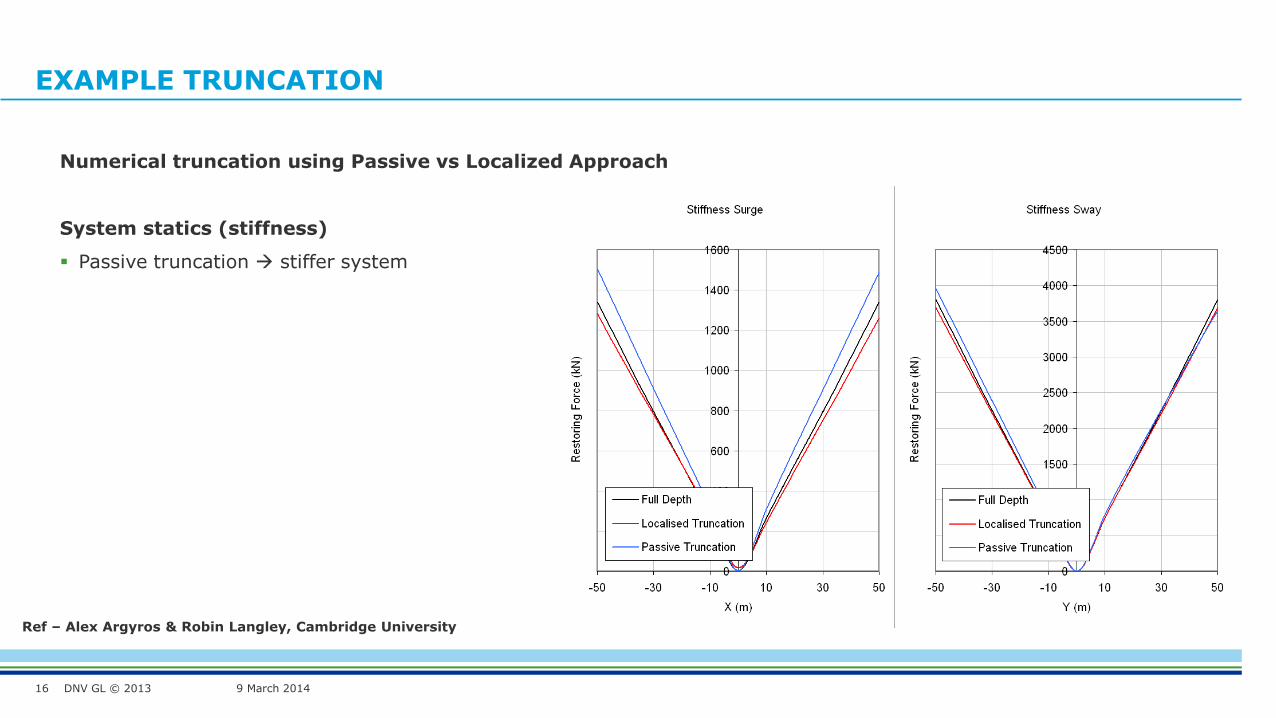
Numerical truncation using Passive vs Localized Approach
System statics (stiffness)
Passive truncation stiffer system
Ref – Alex Argyros & Robin Langley, Cambridge University
DNV GL © 2013
EXAMPLE TRUNCATION
9 March 2014 17
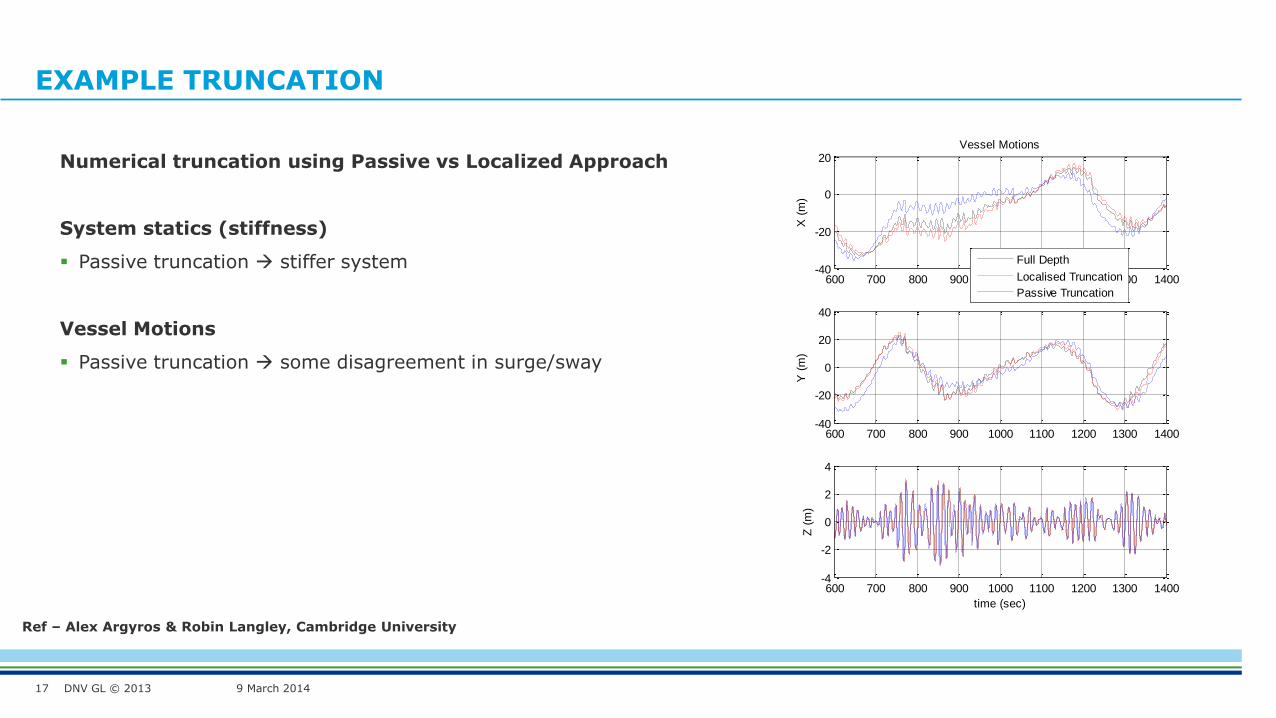
Numerical truncation using Passive vs Localized Approach
System statics (stiffness)
Passive truncation stiffer system
Vessel Motions
Passive truncation some disagreement in surge/sway
Ref – Alex Argyros & Robin Langley, Cambridge University
600 700 800 900 1000 1100 1200 1300 1400-40
-20
0
20
X (
m)
Vessel Motions
600 700 800 900 1000 1100 1200 1300 1400-40
-20
0
20
40
Y (
m)
600 700 800 900 1000 1100 1200 1300 1400-4
-2
0
2
4
Z (
m)
time (sec)
Full Depth
Localised Truncation
Passive Truncation
DNV GL © 2013
EXAMPLE TRUNCATION
9 March 2014 18
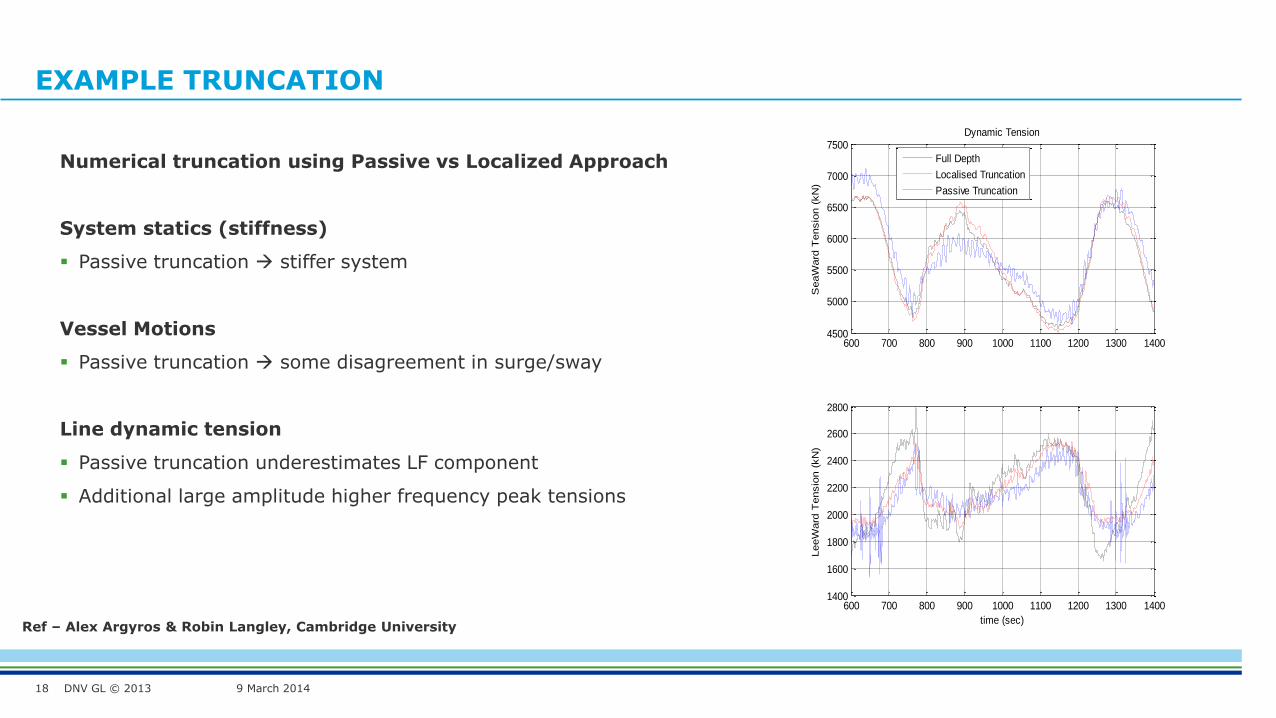
Numerical truncation using Passive vs Localized Approach
System statics (stiffness)
Passive truncation stiffer system
Vessel Motions
Passive truncation some disagreement in surge/sway
Line dynamic tension
Passive truncation underestimates LF component
Additional large amplitude higher frequency peak tensions
Ref – Alex Argyros & Robin Langley, Cambridge University
600 700 800 900 1000 1100 1200 1300 14004500
5000
5500
6000
6500
7000
7500
SeaW
ard
Tensio
n (
kN
)
Dynamic Tension
600 700 800 900 1000 1100 1200 1300 14001400
1600
1800
2000
2200
2400
2600
2800
time (sec)
LeeW
ard
Tensio
n (
kN
)
Full Depth
Localised Truncation
Passive Truncation

DNV GL © 2013
EXAMPLE TRUNCATION
9 March 2014 19
Numerical truncation using Passive vs Localized Approach
System statics (stiffness)
Passive truncation stiffer system
Vessel Motions
Passive truncation some disagreement in surge/sway
Line dynamic tension
Passive truncation underestimates LF component
Additional large amplitude higher frequency peak tensions
Simulation of only WF motions reveals error in WF tension ~
100%
Ref – Alex Argyros & Robin Langley, Cambridge University
600 700 800 900 1000 1100 1200 1300 14003100
3200
3300
3400
3500
3600
3700
SeaW
ard
Tensio
n (
kN
)
Dynamic Tension
600 700 800 900 1000 1100 1200 1300 14003000
3100
3200
3300
3400
3500
time (sec)
LeeW
ard
Tensio
n (
kN
)
Passive Truncation
Full Depth
Localised Truncation

DNV GL © 2013
EXAMPLE TRUNCATION
9 March 2014 20
Numerical truncation using Passive vs Localized Approach
System statics (stiffness)
Passive truncation stiffer system
Vessel Motions
Passive truncation some disagreement in surge/sway
Line dynamic tension
Passive truncation underestimates LF component
Additional large amplitude higher frequency peak tensions
Simulation of only WF motions reveals error in WF tension ~
100%
Ref – Alex Argyros & Robin Langley, Cambridge University
800 820 840 860 880 900
3350
3400
3450
3500
3550
3600
3650
SeaW
ard
Tensio
n (
kN
)
Dynamic Tension
800 820 840 860 880 900
3050
3100
3150
3200
3250
3300
time (sec)
LeeW
ard
Tensio
n (
kN
)
Full Depth
Localised Truncation
Passive Truncation

DNV GL © 2013
CD VARIATION
9 March 2014 21
Ref – Zhengqiang Xu, Strathclyde University
Numerical modelling (coupled analysis) of moored FPSO
CD varied by factor of 2.0
Reduction of LF motion near natural frequency
Reduction of LF tension
Increase of WF tension
0 0.02 0.04 0.06 0.08 0.1 0.120
1
2
3
4
5
6x 10
6
Frequency (Hz)
Sp
ectr
al d
en
sity o
f lin
e fo
rce
(kN
2/H
z)
CD1
of moorings
CD2
of moorings
DNV GL © 2013
CD VARIATION
9 March 2014 22
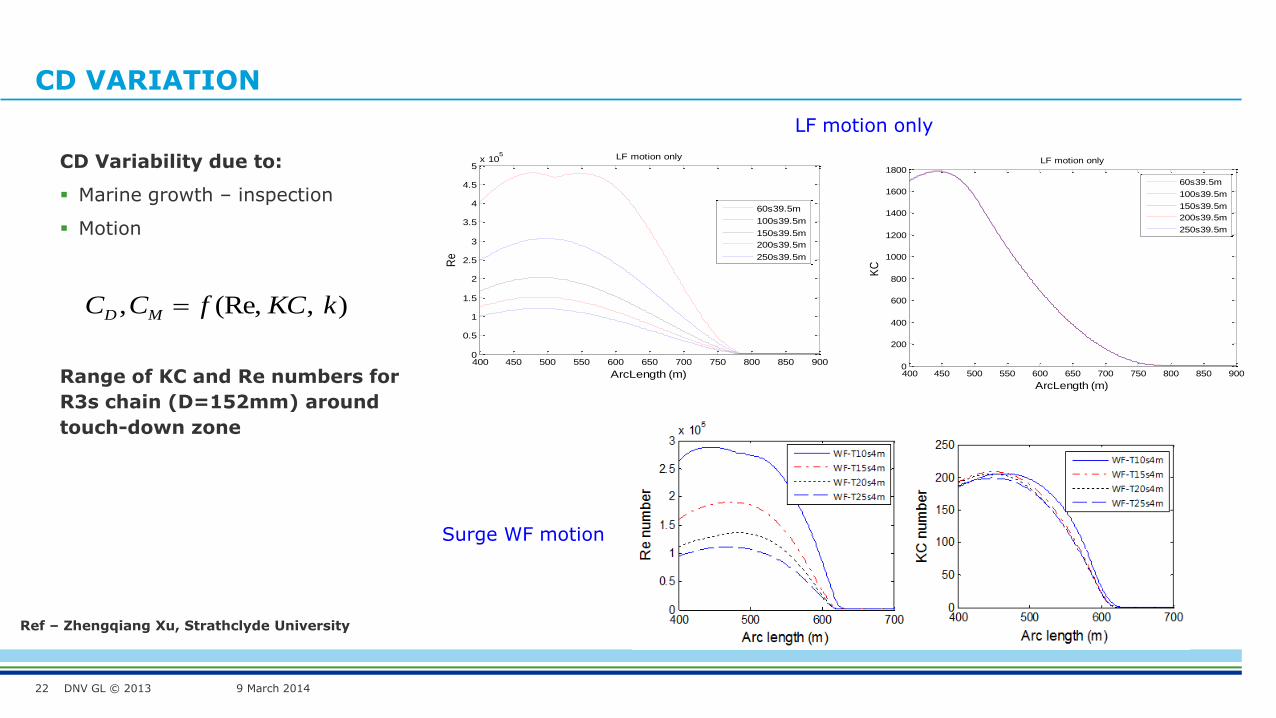
CD Variability due to:
Marine growth – inspection
Motion
Ref – Zhengqiang Xu, Strathclyde University
),(Re,, kKCfCC MD
400 450 500 550 600 650 700 750 800 850 9000
200
400
600
800
1000
1200
1400
1600
1800
ArcLength (m)
KC
LF motion only
60s39.5m
100s39.5m
150s39.5m
200s39.5m
250s39.5m
400 450 500 550 600 650 700 750 800 850 9000
0.5
1
1.5
2
2.5
3
3.5
4
4.5
5x 10
5
ArcLength (m)
Re
LF motion only
60s39.5m
100s39.5m
150s39.5m
200s39.5m
250s39.5m
LF motion only
Surge WF motion
Range of KC and Re numbers for
R3s chain (D=152mm) around
touch-down zone
DNV GL © 2013
CD DETERMINATION BY CFD
9 March 2014 23
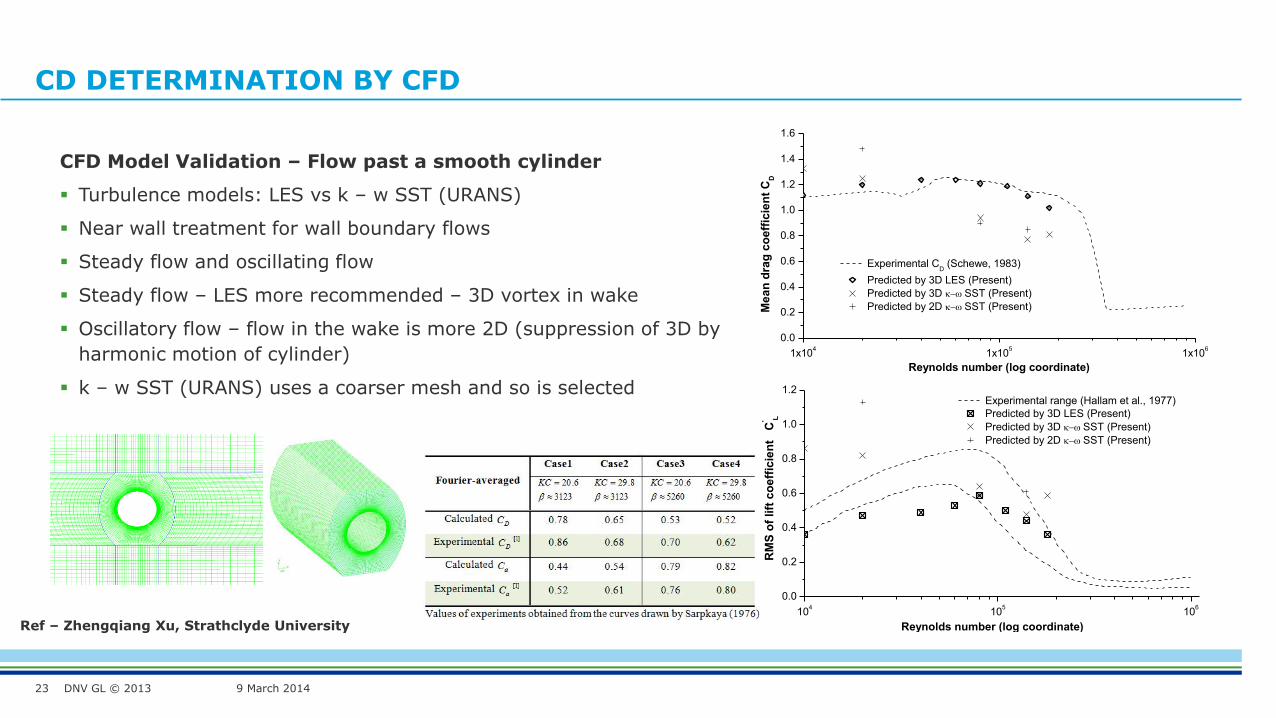
CFD Model Validation – Flow past a smooth cylinder
Turbulence models: LES vs k – w SST (URANS)
Near wall treatment for wall boundary flows
Steady flow and oscillating flow
Steady flow – LES more recommended – 3D vortex in wake
Oscillatory flow – flow in the wake is more 2D (suppression of 3D by
harmonic motion of cylinder)
k – w SST (URANS) uses a coarser mesh and so is selected
Ref – Zhengqiang Xu, Strathclyde University
1x10⁴
1x10⁵
1x10⁶
0.0
0.2
0.4
0.6
0.8
1.0
1.2
1.4
1.6
Me
an
dra
g c
oe
ffic
ien
t C
D
Reynolds number (log coordinate)
Experimental CD (Schewe, 1983)
Predicted by 3D LES (Present)
Predicted by 3D SST (Present)
Predicted by 2D SST (Present)
104
105
106
0.0
0.2
0.4
0.6
0.8
1.0
1.2
RM
S o
f lift
co
eff
icie
nt
C
' L
Reynolds number (log coordinate)
Experimental range (Hallam et al., 1977)
Predicted by 3D LES (Present)
Predicted by 3D SST (Present)
Predicted by 2D SST (Present)

DNV GL © 2013
CD DETERMINATION BY CFD
9 March 2014 24
Chain Numerical Models
2 links (1 full & 2 half)
Periodic boundary conditions
No slip wall
Inlet/outflow boundaries
Symmetry in lateral sides
8 million cells
Ref – Zhengqiang Xu, Strathclyde University
DNV GL © 2013
CD DETERMINATION BY CFD
9 March 2014 25
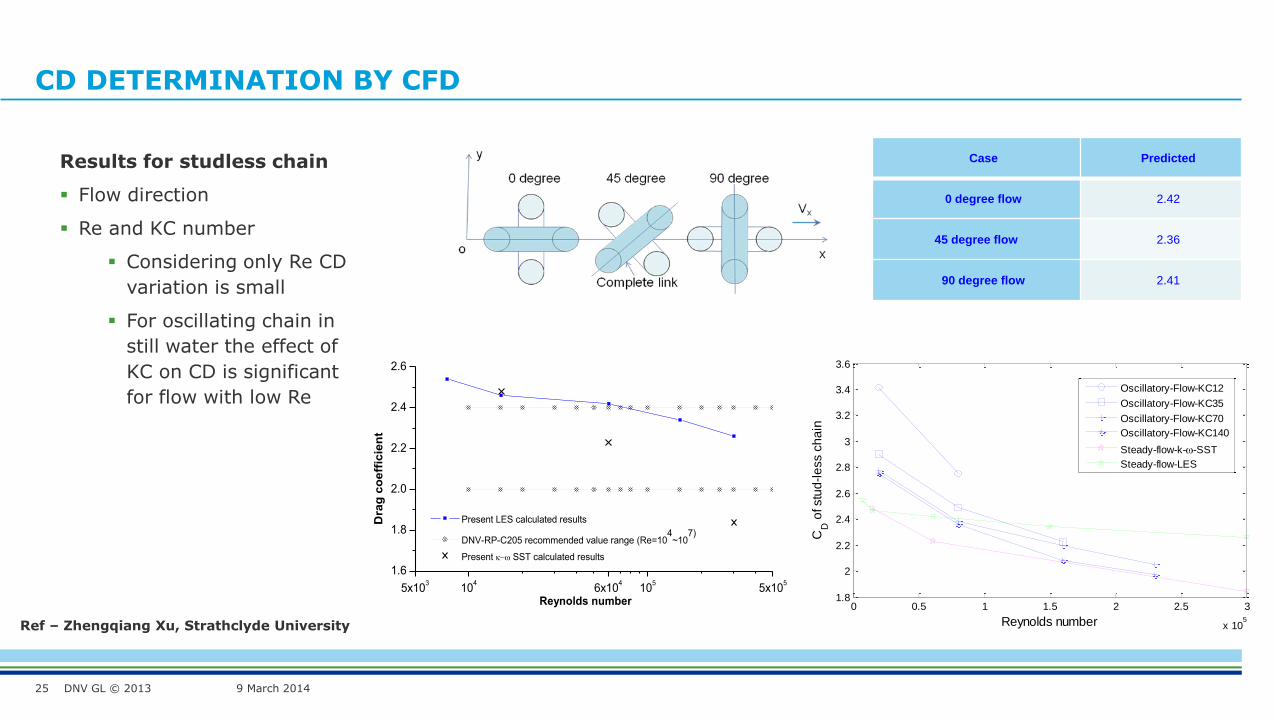
Results for studless chain
Flow direction
Re and KC number
Considering only Re CD
variation is small
For oscillating chain in
still water the effect of
KC on CD is significant
for flow with low Re
Ref – Zhengqiang Xu, Strathclyde University
Case Predicted
0 degree flow 2.42
45 degree flow 2.36
90 degree flow 2.41
5x10³
104
6x10⁴
105
5x10⁵
1.6
1.8
2.0
2.2
2.4
2.6D
rag
co
eff
icie
nt
Reynolds number
Present LES calculated results
DNV-RP-C205 recommended value range (Re=104~10
7)
Present SST calculated results
0 0.5 1 1.5 2 2.5 3
x 105
1.8
2
2.2
2.4
2.6
2.8
3
3.2
3.4
3.6
Reynolds number
CD
of stu
d-l
ess c
ha
in
Oscillatory-Flow-KC12
Oscillatory-Flow-KC35
Oscillatory-Flow-KC70
Oscillatory-Flow-KC140
Steady-flow-k--SST
Steady-flow-LES

DNV GL © 2013
SUMMARY
9 March 2014 26
Need for deepwater/model testing
Present difficulties and challenges
Innovative method for truncation
Line dynamics
LF damping
Zones of importance
Motions and tensions
CD determination using CFD
DNV GL © 2013
SAFER, SMARTER, GREENER
www.dnvgl.com
Thank you
9 March 2014 27
Alex Argyros
Naval Architect
DNV GL


![Advances in Stochastic Mortality Modelling[Toczydlowska and Peters, 2017]considered stochastic projection methods of dimensionality reduction)Probabilistic Principal Component Analysis](https://static.fdocuments.in/doc/165x107/61207bccc7108002d73aba5b/advances-in-stochastic-mortality-modelling-toczydlowska-and-peters-2017considered.jpg)


![ADVANCES IN MODELLING, HEALTH-MONITORING, … · 2020. 9. 21. · [ultimo aggiornamento: 26 luglio 2019 ore 15:00] advances in modelling, health-monitoring, infrastructures, geomatics,](https://static.fdocuments.in/doc/165x107/607783e536336f13a100ce7f/advances-in-modelling-health-monitoring-2020-9-21-ultimo-aggiornamento.jpg)

