
09 LCFS 2nd 15-day Att H Air Quality Chapter
42
ATTACHMENT H UPDATES TO THE AIR QUALITY CHAPTER OF THE INITIAL STATEMENT OF REASONS
Transcript of 09 LCFS 2nd 15-day Att H Air Quality Chapter

ATTACHMENT H
UPDATES TO THE AIR QUALITY CHAPTER OF THE INITIAL STATEMENT OF REASONS

ATTACHMENT H
Updates to the Air Quality Chapter of the Initial Statement of Reasons
New deletions and additions to the originally proposed Air Quality chapter (Chapter V) to the Initial Statement of Reasons (published on March 6, 2018) that are made public with the “Second Notice of Public Availability of Modified Text and Availability of Additional Documents and Information” are shown in strikethrough and underline format, respectively.

H-1
V. AIR QUALITY This chapter summarizes the potential air quality and public health impacts in California related to increased production and consumption of alternative fuels, changes in feedstock sources, and implementation of carbon capture and sequestration (CCS) and petroleum-based projects that are driven by the LCFS in response to the proposed amendments. Below are descriptions of the pollutants of interest in this chapter.
• Criteria Air Pollutants: Criteria air pollutants are determined to be hazardous to human health and are regulated under U.S. EPA’s National Ambient Air Quality Standards. The 1970 amendments to the Clean Air Act require U.S. EPA to describe the health and welfare impacts of a pollutant as the “criteria” for inclusion in the regulatory regime. Both the California and federal governments have adopted health-based standards for the criteria pollutants that include ozone, particulate matter (PM10, PM2.5), carbon monoxide (CO), oxides of nitrogen (NOx), oxides of sulfur (SOx), and volatile organic compounds (VOC).
• Toxic Air Pollutants: Toxic air pollutants (also referred to as toxic air contaminants [TAC], or air toxics) are those pollutants which may cause or contribute to an increase in mortality or serious illness, or which may pose a hazard to human health but are not regulated as criteria pollutants. Air toxics are usually present in minute quantities in the ambient air. However, their high toxicity or health risk may pose a threat to public health even at very low concentrations. The toxic air pollutant of most concern in this analysis is the particulate matter from diesel-fueled heavy-duty trucks (diesel PM).
In this chapter, staff first provides an overview of the air quality analysis and major air quality findings in section A. Next, in section B, staff presents baseline conditions for the analysis including fossil and alternative fuel volumes and estimated emissions for existing California fuel production facilities and mobile sources. Following this discussion, in section C, staff provides a description of staff’s Illustrative Compliance Scenario, which focuses on the major changes from the baseline condition. In section D, staff describes the changes of emissions relative to the baseline, including tailpipe emissions from use of biodiesel and renewable diesel, alternative fuel production emissions, petroleum-based project emissions, and aviation emissions from use of alternative jet fuel (AJF). Staff then describes the health impacts analysis for NOx and PM emission changes in Section E. In Section F, staff describes the health risk assessment for a potential California biofuel facility. Finally, staff gives a brief summary in section G of a similar analysis performed using a business-as-usual scenario where the LCFS remains at 10 percent post 2020. A. Overview of the Air Quality Analysis and Major Findings The analysis of the potential air quality impacts of the proposed LCFS amendments was conducted in a manner similar to the analysis of the GHG benefits of alternative fuels

H-2
and petroleum-based projects presented in chapter IV of the ISOR. This analysis examines potential changes in air emissions in California from: the transportation of feedstocks to the biofuel production facility; the production of biofuels; the transportation of biofuels to the blending terminal; and finally the combustion of biofuels in vehicles or aircraft. Also analyzed were the effects on emissions of petroleum-based projects such as the implementation of solar steam projects for crude oil production and refinery investment projects.1 The proposed amendments are expected to result in improvements to California’s air quality. The net NOx and PM2.5 emissions impact of the proposed amendments relative to a 2016 baseline are presented in Figures V-1 and V-2, respectively. As shown, the total NOx and PM2.5 emissions are estimated to be lower in each year from 2019 through 2030. The annual NOx and PM2.5 emission reductions represent less than one percent of total statewide emissions.
Figure V-1: Estimated Statewide NOx Emissions Impact of the Proposed LCFS Amendments Relative to 2016 Baseline (tons/year)
1 All calculations are provided in the spreadsheet titled LCFS Amendments Air Quality Calculations (August 15, 2018).

H-3

H-4
Figure V-2: Estimated Statewide PM2.5 Emissions Impact of the Proposed LCFS Amendments Relative to 2016 Baseline (tons/year)

H-5
As shown in Figure V-2, the estimated PM2.5 benefits associated with the increased use of biodiesel and renewable diesel initially increase, peaking in year 2022, and then decrease through 2030. This trend results from the competing impacts of an increase in the use of biodiesel and renewable diesel (which both reduce PM2.5 emissions relative to conventional diesel) coupled with an expected increase in the use of diesel particulate filters (which reduce the benefits of biodiesel and renewable diesel as compared to conventional diesel). As discussed in section E of this chapter, improvements in California air quality under the proposed amendments are anticipated to result in statewide health benefits for California individuals, including avoided premature deaths, hospitalizations, and emergency room visits. However, due to the complexity of possible LCFS compliance responses, staff cannot fully rule out the possibility of localized impacts due to LCFS-related activities under worst-case assumptions. B. Baseline Condition In order to determine the effects of the proposed LCFS amendments on California air quality, it is first necessary to establish the baseline conditions that currently exist from the production and use of transportation fuels in California. This section describes the existing conditions in response to the current LCFS regulation. The year 2016 was

H-6
chosen as the “current conditions” baseline for the proposed amendments as 2016 provides the latest complete year of data prior to initiating the air quality assessment.
1. 2016 Fossil and Alternative Fuel Volumes Table V-1 presents the 2016 baseline transportation fuel volumes, which includes both fossil and alternative fuels. Also shown are the quantity of credits generated by petroleum-based projects incented by the LCFS.
Table V-1: 2016 Baseline of Fossil and Alternative Fuel Quantities and Petroleum-Based Project Credits
Fuel Units Volume
CARBOB mm gal 14,05313,967 CARB Diesel mm gal 3,3823,421 Starch Ethanol mm gal 1,5675 Sugar Ethanol mm gal 312 Electricity for LDVs MWH 710 Biodiesel mm gal 163 Renewable Diesel mm gal 256248 Renewable Natural Gas mm DGE 9087 Conventional Natural Gas mm DGE 55 Electricity for Rail/Forklift/etc. MWH 1,2313 Innovative Crude Credits MMT 0.001 LC/LEU Refinery MMT 0.15 Refinery Investment Credits MMT 0 Refinery Renewable Hydrogen Credits MMT 0
2. Existing Major California Fuel Production Facilities
a. Petroleum Refineries and Crude Oil Production
Fifteen petroleum refineries produce conventional high-carbon transportation fuel in California.2 Five of those facilities reside in the Bay Area Air Quality Management District (AQMD), seven reside in the South Coast AQMD, and three reside in the San Joaquin Valley Unified Air Pollution Control District (APCD). A list of the 15 refineries is
2 California’s Oil Refineries, California Energy Commission. http://energy.ca.gov/almanac/petroleum_data/refineries.html

H-7
presented in Table V-2. The list has been updated from the CEC list to reflect the current refinery owners. In total, California refineries process approximately 600 million barrels (25 billion gallons) of crude oil each year, producing gasoline, diesel, and jet fuel for consumption in California and export to surrounding states.
Table V-2: Currently Operating Petroleum Refineries in California that Produce Transportation Fuel
Facility Name Location
Delek US (formerly ALON USA), Bakersfield Refinery Bakersfield Chevron U.S.A. Inc. El Segundo Chevron U.S.A. Inc. Richmond PBF Energy, Inc. Torrance Kern Oil & Refining Company Bakersfield Paramount Petroleum Corporation Paramount Phillips66 Company Wilmington Phillips66 Company Rodeo San Joaquin Refining Company Inc. Bakersfield Shell Oil Products US Martinez Andeavor (formerly Tesoro Refining & Marketing Company) Carson Andeavor (formerly Tesoro Refining & Marketing Company) Martinez Andeavor (formerly Tesoro Refining & Marketing Company) Wilmington Valero (Ultramar) Wilmington Valero Benicia Refinery Benicia
Approximately one-third (200 million barrels) of the oil refined in California is produced in the State. This oil is primarily produced in six air districts: Monterey Bay Unified APCD, San Joaquin Valley Unified APCD, San Luis Obisbo County APCD, Santa Barbara County APCD, South Coast AQMD, and Ventura County APCD. CARB compiles each of the local districts’ estimates of emissions from stationary sources within its jurisdiction.3 There are six subcategories that have been used to estimate emissions associated with petroleum refining and crude oil production in each district. These subcategories are: oil and gas production (combustion), petroleum refining (combustion), oil and gas production, petroleum refining, petroleum marketing, and “other” (petroleum production and marketing). Table V-3 shows the estimated emissions from petroleum refining and crude oil production for 2016. The projected emissions are based on the 2012 base year inventory and the growth and control data maintained by the CARB and Districts. The applied control data reflects only adopted rules.
3 CARB’s Emissions Inventory: CEPAM: 2016 SIP - Standard Emission Tool. Available at: https://www.arb.ca.gov/app/emsinv/fcemssumcat/fcemssumcat2016.php

H-8
Table V-3: Estimated 2016 California Petroleum Refining and Crude Oil Production Emissions (tons/year)
Air District TOG ROG CO NOX SOX PM PM10 PM2.5
Bay Area AQMD 27,224 5,877 3,795 4,151 2,579 1,217 1,109 1,071 Santa Barbara County APCD 4,912 1,351 662 622 131 41 41 41 San Joaquin Valley Unified APCD 43,188 6,990 2,239 1,194 272 675 652 648 San Luis Obispo County APCD 442 248 46 163 232 27 26 26 South Coast AQMD 27,444 8,898 3,973 4,299 2,240 1,576 1,219 1,133 Monterey Bay County APCD 2,214 1,103 12 137 11 33 33 33 Ventura County APCD 8,927 917 475 65 13 12 10 9 Total 114,352 25,385 11,202 10,631 5,479 3,580 3,089 2,960
Even though there is expected to be a significant reduction in petroleum-based gasoline and diesel consumption by 2030 in response to fuel economy standards, VMT reduction efforts, and displacement by alternative fuels, staff conservatively assumes, for purposes of calculating air quality benefits of the proposed amendments, that refineries will not operate at a lower capacity in 2030 as compared to 2016.
b. Ethanol Facilities There are currently five permitted ethanol facilities in California, all of which use enzymatic fermentation of starches and sugars. The four largest facilities utilize starch grains as a feedstock while the smallest uses beverage waste. Table V-4 summarizes the location, feedstock, and capacities of these facilities.
Table V-4: Ethanol Facilities in California
Facility Name Location Feedstock Capacity (MMgpy)
Aemetis Advanced Fuels Ceres sorghum, corn 73.5 Pacific Ethanol Stockton corn 64.5 Pacific Ethanol Madera corn 43 Pixley Ethanol LLC (Calgren) Pixley sorghum, corn 58 Parallel Products Rancho Cucamonga beverage waste 4
The following emissions from ethanol facilities in California were obtained from CARB’s Emissions Inventory.4
4 CARB Facility Search Engine at https://www.arb.ca.gov/app/emsinv/facinfo/facinfo.php?dd=

H-9
Table V-5: Reported 2015 Emissions from Ethanol Facilities in California (tons/year)
Facility Name Air
Basin TOG ROG CO NOX SOX PM PM10 PM2.5
Aemetis Advanced Fuels SJV 21.46 16.84 9.62 16.56 3.75 17.96 11.6 8.59 Pacific Ethanol Stockton SJV 6.13 4.02 11.14 3.05 1.51 8.46 5.31 4.07 Pacific Ethanol Madera SJV 15.69 12.98 1.03 2.45 0.91 22.94 8.40 2.64 Pixley Ethanol LLC (Calgren) SJV 2.43 2.21 0.91 0.34 0.02 8.88 2.71 0.24 Parallel Products SC 2.66 2.13 1.24 1.73 0.03 13.83 9.78 6.01
c. Biodiesel Facilities
California biodiesel facilities currently in operation use the fatty-acid methyl ester (FAME) transesterification process to convert waste oils and vegetable oils to biodiesel. There are currently nine operating biodiesel facilities in California. Table V-6 summarizes the location, feedstock source, and estimated capacities for these facilities.
Table V-6: Biodiesel Facilities in California
Facility Name Location Feedstock Estimated Capacity (MMgpy)
Imperial Western Products Coachella Multi-feedstock 10.5 Community Fuels Stockton Multi-feedstock 25.0 Crimson Renewable Energy Bakersfield Multi-feedstock 30.0 Simple Fuels Biodiesel Inc. Chilcoot Used Cooking Oil 1.0 Western Iowa Energy (formerly Agron Bioenergy LLC) Watsonville Multi-feedstock 15.0
GeoGreen Biofuels Vernon Used Cooking Oil 3.0 New Leaf Biofuel San Diego Used Cooking Oil 6.0 Buster Biofuels LLC Escondido Used Cooking Oil 5.0 Biodico Westside Five Points Multi-feedstock 18.0
The following emissions from biodiesel facilities in California were obtained from CARB’s Emissions Inventory.5 Emissions data was available for only three of the nine biodiesel facilities.
Table V-7: Reported 2015 Emissions from Biodiesel Facilities in California (tons/year)
Facility Name Air
Basin TOG ROG CO NOX SOX PM PM10 PM2.5
Imperial Western Products, Inc. SC 1.70 1.50 2.19 1.32 0.02 0.20 0.20 0.20 American Biodiesel (Community Fuels) SJV 6.85 5.17 0.02 0.08 0.03 0.08 0.08 0.08 Crimson Renewable Energy, LP SJV 13.95 12.01 0.00 0.11 0.16 0.11 0.11 0.11
5 Ibid.

H-10
d. Renewable Diesel Facilities There are currently two renewable diesel facilities in California, both of which use hydrotreating to convert waste oils to renewable diesel. Table V-8 summarizes the location, feedstock, and capacities of these facilities. The renewable diesel production at both Kern Oil and Refining Company and AltAir Paramount, LLC is part of larger petroleum refining operations at both facilities. Therefore, emissions data specific to renewable diesel production at these facilities is not available, but is included in Table V-3.
Table V-8: Renewable Diesel Facilities in California
Facility Name Location Feedstock Estimated Capacity (MMgpy)
Kern Oil and Refining Co. Bakersfield Tallow 3.45 AltAir Paramount, LLC Paramount Multi-feedstock 42
e. Other Biofuel Facilities
There is one landfill and one food and green waste digester in California that are providing renewable natural gas for use as transportation fuel. Emissions data are not available for these facilities. There are currently no dairy digesters operating in California to provide transportation fuel.
f. Estimated Total Emissions from Biofuel Facilities Table V-10 shows the estimated total emissions for ethanol, biodiesel, and renewable diesel production in California for 2016. The emissions values in Table V-9 were estimated by multiplying the quantity of fuel produced in 2016 by average emission factors for production of each fuel. These average emission factors were derived from reported data for emissions and fuel production for the year 2015, shown in Tables V-6 and V-8. Since emissions data specific to renewable diesel production is not available, staff used overall petroleum and renewable diesel production data for Kern Oil and Refining Company, which is a simple refinery, as a proxy to estimate an emission factor for renewable diesel production. Table V-9: Estimated 2016 Total Emissions for Ethanol, Biodiesel, and Renewable
Diesel Production in California (tons/year)
Fuel TOG ROG CO NOX SOX PM PM10 PM2.5
Ethanol 46.60 36.78 23.07 23.52 5.98 69.46 36.43 20.77 Biodiesel 40.96 34.00 4.03 2.75 0.37 0.71 0.71 0.71 Renewable Diesel* 23.00 12.90 9.21 2.98 0.43 0.70 0.68 0.68 * Using Kern Oil and Refining Company (simple refinery) as a proxy for renewable diesel emissions

H-11
3. Mobile Sources
Table V-10 below shows 2016 emissions estimates for both on-road and other mobile sources from CARB’s emissions inventory.6 On-road includes emissions from all on-road vehicle classes (i.e. light duty, medium duty, heavy duty, motorcycle, buses, and motorhomes). Other includes emissions from aircraft, trains, ocean going vessels, commercial harbor craft, recreational boats, off-road equipment, and farm equipment. Mobile source emissions are expected to decrease substantially from 2016 through 2030 as a result of non-LCFS factors such as improvements in vehicle fuel economy, turnover to more advanced, lower emission engines, and installation of particulate filters.
Table V-10: Estimated 2016 Emissions for Mobile Sources in California (tons/year)
Mobile Source TOG ROG CO NOX SOX PM PM10 PM2.5
On-road 119,515 107,726 834,662 256,015 1,812 23,707 23,260 11,021 Other 106,697 94,749 698,682 155,644 2,839 12,071 11,622 10,325 Total 226,211 202,476 1,533,344 411,659 4,650 35,778 34,882 21,347
4. Total Transportation Emissions in 2016
Table V-11 below shows the total estimated emissions from transportation-related activities in California in the baseline year of 2016. This table includes emissions from crude oil production, petroleum refining, biofuel production, and mobile sources.
Table V-11: Estimated Total 2016 Emissions for Transportation (tons/year)
Emission Source TOG ROG CO NOX SOX PM PM10 PM2.5 Refining and Crude
Production 114,352 25,385 11,202 10,631 5,479 3,580 3,089 2,960
Biofuel Production 111 84 36 29 7 71 38 22 Mobile Sources 226,211 202,476 1,533,344 411,659 4,650 35,778 34,882 21,347
Total 340,674 227,945 1,544582 422,319 10,136 39,429 38,009 24,329 C. Illustrative Compliance Scenario As discussed in the economic analysis (see Chapter VIII of the ISOR) for the proposed amendments, staff conducted an in-depth scenario analysis that informed possible compliance schedules through 2030. Staff developed modeling tools that take into account feedstock supply, fuel prices, fuel incentives, and capacity constraints to assess the technical and economic feasibility of bringing low carbon fuels to California. Staff used these modeling tools, together with input from stakeholders and supply projections from subscription services such as Bloomberg New Energy Finance and Lux Research, to assess fuel supply variability and sensitivity to LCFS credit price and other 6 CARB’s Emissions Inventory: CEPAM: 2016 SIP - Standard Emission Tool at https://www.arb.ca.gov/app/emsinv/fcemssumcat/fcemssumcat2016.php.

H-12
uncertain market effects on a year-by-year basis. The following subsections discuss these changes, with a focus on the major changes from the baseline condition. Additional detail on the scenario analysis is provided in Appendix E of the ISOR. The scenario analysis described in Appendix E of the ISOR has been updated to incorporate regulation changes proposed in the 1st and 2nd Notices of Public Availability of Modified Text, as well as revised estimates for some credit and deficit generating pathways.7 The changes to the scenario analysis include:
• Changes to benchmark CI values;
• Addition of infrastructure credits for hydrogen and DC fast chargers;
• Revised estimate for refinery investment credits based on data provided by stakeholders; and
• Revised estimate of incremental crude deficits based on updated crude lookup table CI values and availability of crude volumes supplied to California refineries in 2017.
1. Increases in Alternative Fuel Volumes
Figure V-3 illustrates plausible quantities of alternative fuels through 2030 based on the scenario analysis described above. As the proposed amendments retain the market flexibility of the current LCFS, it is not possible to predict the exact path or fuels used for future compliance. Therefore, the projected fuel volumes and associated emission calculations in this chapter should be considered as illustrative only.
7 All calculations are provided in the spreadsheet titled LCFS Illustrative Compliance Scenario Calculator (August 15, 2018).

H-13
Figure V-3: Illustrative Fuel Volumes that Can Meet the Proposed Amendments (Proposed Amendments Scenario)
As shown in the figure, the proposed amendments could lead to an increase in consumption of renewable diesel, biodiesel, and alternative jet fuel. The proposed LCFS amendments could also lead to an increase in consumption of cellulosic ethanol from both bolt-on cellulosic processing units at conventional ethanol facilities and stand-alone processing plants. An increase in electricity, hydrogen, natural gas, and propane use for transportation is also expected to take place. Increased use of these fuels is primarily dependent upon adoption rates for alternative-fueled vehicles, and therefore, despite the value created for these fuels by the LCFS, staff assigns the air quality benefits of these increases to the ZEV regulation and other vehicle incentive programs and not to the LCFS amendments.
0
500
1000
1500
2000
2500
3000
3500
4000
2016 2017 2018 2019 2020 2021 2022 2023 2024 2025 2026 2027 2028 2029 2030
Volu
me
(mm
GGE
)
Alternative Jet Fuel
Biomethane
Starch Ethanol
Sugar Ethanol
Cellulosic Ethanol
Biodiesel
Renewable Diesel
Electricity
Hydrogen

H-14
2. Changes in Sources for Alternative Fuels
In addition to a potential increase in fuel volumes for alternative fuels, the proposed LCFS amendments could also lead to a change in feedstock sources for some fuels. For example, while the total natural gas vehicle growth is not attributed to the LCFS, the LCFS is assumed to drive the use of renewable natural gas instead of fossil natural gas, particularly the use of lowest-CI renewable natural gas, such as dairy gas. 3. Reduction in CI value for Alternative Fuels The proposed LCFS amendments could also result in adoption of technologies and process improvements leading to a reduction in CI value for alternative fuels. Staff expects that the proposed amendments could provide sufficient incentive for implementation of carbon capture and sequestration (CCS) at alternative fuel production facilities. For example, capturing CO2 emissions during ethanol production could further reduce the CI value of starch, sugar, and cellulosic ethanol and generate additional credits from the same volume of starch ethanol used.
4. Project-Based Credits The LCFS also includes provisions for crude oil producers or refiners to earn credits based on (1) producing crude oil in an innovative manner, (2) making qualifying, emissions-reducing improvements at refineries, and (3) producing renewable hydrogen at refineries. The proposed LCFS amendments could lead to the development and construction of CCS, solar steam generation, or solar/wind electricity generation projects under the Innovative Crude provision. The proposed LCFS amendments could also lead to the process efficiency projects, implementation of CCS, electrification of equipment, and replacement of fossil energy by renewable energy sources at refineries under the Refinery Investment and Refinery Renewable Hydrogen credit provisions. D. Changes of Emissions in Response to the Proposed Amendments The following air basins in California are not in attainment for the following pollutants:8
• Ozone9: Great Basin Valleys, Lake Tahoe, Mojave Desert, Mountain Counties, North Central Coast, Sacramento Valley, Salton Sea, San Diego, San Francisco Bay Area, San Joaquin Valley, South Central Coast, South Coast;
8 CARB, 2017. Area Designations (Activities and Maps) webpage. Available at: https://www.arb.ca.gov/desig/changes.htm. Page reviewed: October 18, 2017. 9 CARB. Source Date June 2017. “Area Designations for State Ambient Air Quality Standards - Ozone.” Webpage: https://www.arb.ca.gov/desig/adm/2016/state_o3.pdf

H-15
• PM2.510: Mojave Desert, Mountain Counties, Sacramento Valley, Salton Sea, San Diego, San Francisco Bay Area, San Joaquin Valley, South Coast;
• PM1011: Great Basin Valleys, Lake Tahoe, Mojave Desert, Mountain Counties, North Central Coast, North Coast, Northeast Plateau, Sacramento Valley, Salton Sea, San Diego, San Francisco Bay Area, San Joaquin Valley, South Central Coast, South Coast
Because California is in attainment for all criteria pollutants except for ozone, PM2.5, and PM10, staff focused on NOx, which is a precursor for ozone formation, and PM emissions in the following analysis.
1. Changes in Tailpipe Emissions
a. Increased use of Biodiesel and Renewable Diesel As shown for the illustrative scenario depicted in Figure V-3, staff expects an increased use of biodiesel and renewable diesel as a result of the proposed LCFS amendments. To determine the impact of this increase on tailpipe emissions, staff analyzed the NOx and PM changes (relative to the 2016 baseline) using the methodology described in the Supplemental Disclosure of Oxides of Nitrogen Potentially Caused by the Low Carbon Fuel Standard, included as Appendix G of the ISORthis Staff Report. For this analysis staff assumed that the ADF regulation in-use requirements for biodiesel used in off-road engines would not sunset in 2023 in the Proposed Amendments Scenario, as the ADF regulation is being amended in conjunction with these LCFS amendments.12 As illustrated in Figure V-4, staff found that biodiesel use attributed to the LCFS would result in a potential increase in NOx emissions relative to use of conventional diesel in all years from 2019 through 2030. Even though the consumption of biodiesel in California is expected to increase over time, the NOx emissions impact is expected to decrease as the result of NOx mitigation of higher biodiesel blend levels required by the ADF regulation and the turnover to lower-NOx engines. Staff also found that renewable diesel use attributed to the LCFS would result in a decrease in NOx emissions relative to use of conventional diesel for the same years. Also shown on this figure are the emissions changes for biodiesel and renewable diesel use in the baseline year of 2016. Overall, staff found that biomass-based diesel use attributed to the LCFS would result in a potential decrease in NOx emissions relative to the 2016 baseline in all years for the scenario evaluated. 10 CARB. Updated June 7, 2017. “Chronology of State PM2.5 Designations.” Webpage: https://www.arb.ca.gov/desig/changes/pm25.pdf. 11 CARB. Updated June 7, 2017. “Chronology of State PM10 Designations.” Webpage: https://www.arb.ca.gov/desig/changes/pm10.pdf. 12 In the first Notice of Public Availability of Modified Text (June 20, 2018), staff proposed to bifurcate the sunset provisions for on- and off-road diesel engine applications. Under the modified proposal, the sunset is triggered separately for on- and off-road applications when each reaches a threshold of 90 percent new technology diesel engines (NTDEs).

H-16
Figure V-4: Estimated Change in NOx Emissions Due to LCFS-Attributed Biodiesel and Renewable Diesel Use
-4000
-3000
-2000
-1000
0
1000
2000
3000
2019 2020 2021 2022 2023 2024 2025 2026 2027 2028 2029 2030
NO
x Em
issio
ns C
hang
e fo
r Inc
reas
ed U
se o
f Bio
dies
el a
nd
Rene
wab
le D
iese
l (to
ns/y
ear)
Year
Biodiesel Displacing Conventional DieselRenewable Diesel Displacing Conventional DieselNOx from BD Use in 2016 Attributed to LCFSNOx from RD Use in 2016 Attributed to LCFS

H-17
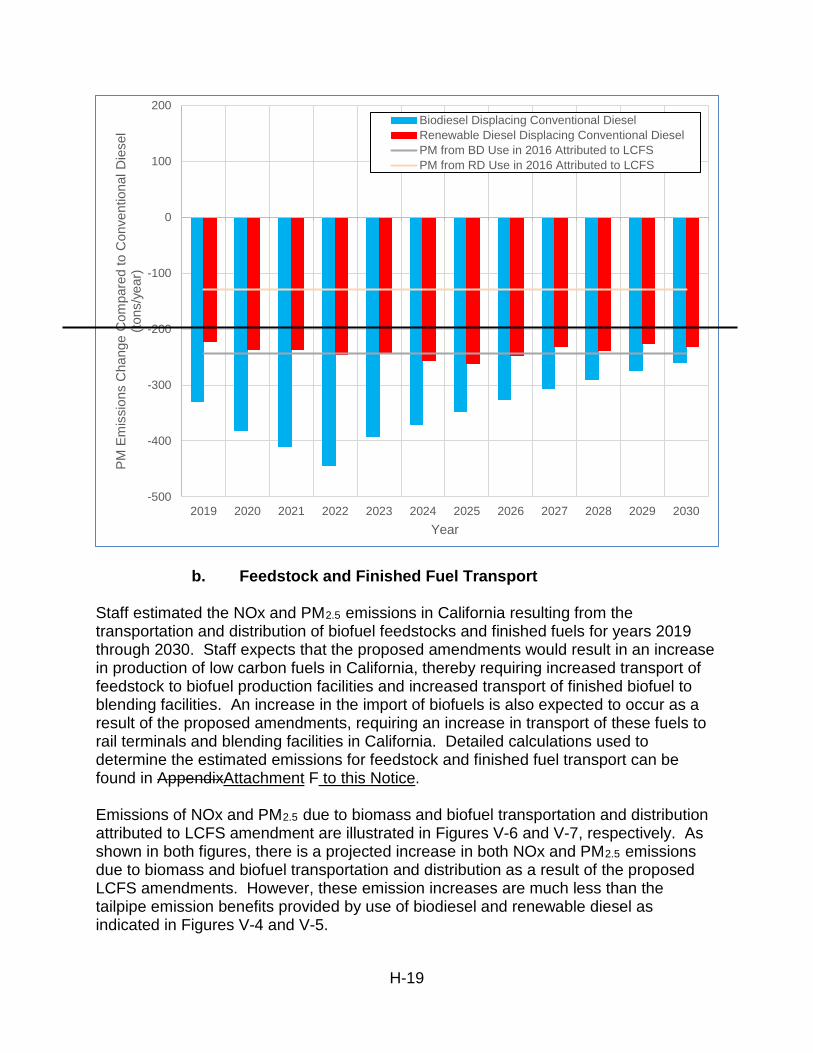
Staff also found that biodiesel and renewable diesel use attributed to the LCFS could result in a decrease in PM emissions relative to use of conventional diesel from 2019 through 2030. This is illustrated in Figure V-5. Also shown in the figure are the emissions changes attributable to biodiesel and renewable diesel use in the baseline year of 2016. Overall, staff found that biomass-based diesel use attributed to the LCFS could result in PM emissions decrease relative to the 2016 baseline in all years for the scenario evaluated.
-4000
-3000
-2000
-1000
0
1000
2000
3000
2019 2020 2021 2022 2023 2024 2025 2026 2027 2028 2029 2030
NO
x Em
issi
ons
Cha
nge
for I
ncre
ased
Use
of B
iodi
esel
and
R
enew
able
Die
sel (
tons
/yea
r)
Year
Biodiesel Displacing Conventional DieselRenewable Diesel Displacing Conventional DieselNOx from BD Use in 2016 Attributed to LCFSNOx from RD Use in 2016 Attributed to LCFS

H-18
Figure V-5: Estimated Change in PM Emissions Due to LCFS-Attributed Biodiesel and Renewable Diesel Use
-500
-400
-300
-200
-100
0
100
200
2019 2020 2021 2022 2023 2024 2025 2026 2027 2028 2029 2030
PM E
mis
sion
s C
hang
e C
ompa
red
to C
onve
ntio
nal D
iese
l (to
ns/y
ear)
Year
Biodiesel Displacing Conventional DieselRenewable Diesel Displacing Conventional DieselPM from BD Use in 2016 Attributed to LCFSPM from RD Use in 2016 Attributed to LCFS
H-19
b. Feedstock and Finished Fuel Transport Staff estimated the NOx and PM2.5 emissions in California resulting from the transportation and distribution of biofuel feedstocks and finished fuels for years 2019 through 2030. Staff expects that the proposed amendments would result in an increase in production of low carbon fuels in California, thereby requiring increased transport of feedstock to biofuel production facilities and increased transport of finished biofuel to blending facilities. An increase in the import of biofuels is also expected to occur as a result of the proposed amendments, requiring an increase in transport of these fuels to rail terminals and blending facilities in California. Detailed calculations used to determine the estimated emissions for feedstock and finished fuel transport can be found in AppendixAttachment F to this Notice. Emissions of NOx and PM2.5 due to biomass and biofuel transportation and distribution attributed to LCFS amendment are illustrated in Figures V-6 and V-7, respectively. As shown in both figures, there is a projected increase in both NOx and PM2.5 emissions due to biomass and biofuel transportation and distribution as a result of the proposed LCFS amendments. However, these emission increases are much less than the tailpipe emission benefits provided by use of biodiesel and renewable diesel as indicated in Figures V-4 and V-5.
-500
-400
-300
-200
-100
0
100
200
2019 2020 2021 2022 2023 2024 2025 2026 2027 2028 2029 2030
PM E
mis
sion
s C
hang
e C
ompa
red
to C
onve
ntio
nal D
iese
l (to
ns/y
ear)
Year
Biodiesel Displacing Conventional DieselRenewable Diesel Displacing Conventional DieselPM from BD Use in 2016 Attributed to LCFSPM from RD Use in 2016 Attributed to LCFS

H-20
Figure V-6: Estimated Change in NOx Emissions for Biofuel Feedstock and Finished Fuel Transportation and Distribution Relative to 2016 Baseline
0
50
100
150
200
250
300
350
400
2019 2020 2021 2022 2023 2024 2025 2026 2027 2028 2029 2030
NO
x Em
issio
ns o
f Bio
mas
s and
Bio
fuel
Tr
ansp
orta
tion
and
Dist
ribut
ion
(tons
/yea
r)
Year
0
50
100
150
200
250
300
350
400
2019 2020 2021 2022 2023 2024 2025 2026 2027 2028 2029 2030
NO
x Em
issi
ons
of B
iom
ass
and
Biof
uel
Tran
spor
tatio
n an
d D
istri
butio
n (to
ns/y
ear)
Year

H-21
Figure V-7: Estimated Change in PM2.5 Emissions for Biofuel Feedstock and Finished Fuel Transportation and Distribution Relative to 2016 Baseline
2. Changes in Emissions at California Alternative Fuel Facilities and Petroleum-Based Projects
Staff expects the proposed amendments would result in an increase in production and/or expansion at California alternative fuel facilities, which would result in increased
0.00
1.00
2.00
3.00
4.00
5.00
6.00
2019 2020 2021 2022 2023 2024 2025 2026 2027 2028 2029 2030
PM2.
5 Em
issio
ns o
f Bio
mas
s and
Bio
fuel
Tr
ansp
orta
tion
and
Dist
ribut
ion
(tons
/yea
r)
Year
0
1
2
3
4
5
6
2019 2020 2021 2022 2023 2024 2025 2026 2027 2028 2029 2030
PM2.
5 Em
issi
ons
of B
iom
ass
and
Biof
uel
Tran
spor
tatio
n an
d D
istri
butio
n (to
ns/y
ear)
Year

H-22
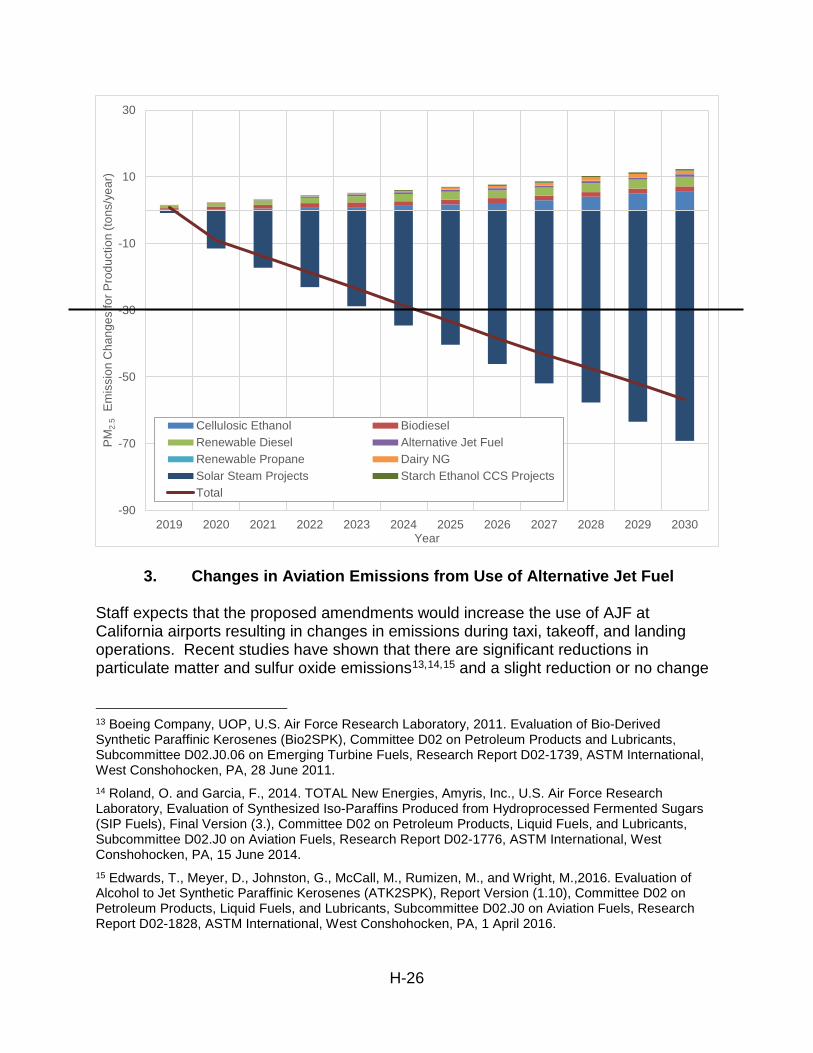
NOx and PM2.5 emissions at these facilities. Increases in in-state production are expected to occur for biodiesel, renewable diesel, alternative jet fuel, renewable propane, cellulosic ethanol and dairy digester gas. Although staff does not expect a significant change in in-state production of starch ethanol, CCS may be implemented at ethanol facilities resulting in increased demand for electricity for CO2 compression. The LCFS also provides opportunities to reduce the carbon intensity in conventional petroleum supply chains. One of these opportunities is to produce crude oil using innovative methods, such as implementation of CCS, solar steam, and renewable electricity projects at oil fields. Another is implementation of process efficiency and other innovative emission reduction projects at refineries. Staff expects the proposed amendments would further incentivize the use of these innovative methods, and, in particular, solar steam projects in San Joaquin Valley and process efficiency projects at refineries may potentially be a significant source of LCFS credits through 2030. Detailed calculations for changes in emissions at alternative fuel production facilities and refineries and for solar steam generation at oil fields can be found in Appendix Attachment F to this Notice. Estimated changes in NOx and PM2.5 emissions for years 2019 through 2030 for alternative fuel production facilities and refineries and solar steam projects are shown in Figures V-8 and V-9, respectively. As shown in both figures, there is a projected net decrease in both NOx and PM2.5 emissions on a statewide basis due to the large reduction in emissions from refinery process efficiency projects and from natural gas-fired steam generators as solar steam projects are implemented. The emission reductions from process efficiency projects at refineries are expected to primarily occur in the San Francisco Bay and South Coast air basins. The emission reductions from implementation of solar steam at oil fields are expected to primarily occur in the San Joaquin Valley air basin. Other air basins are expected to experience small net increases in emissions from alternative fuel production. Staff assumed that future increases in biofuel production would likely occur in the same air basins where current biofuel production is occurring; including South Coast, San Francisco Bay, San Joaquin Valley, San Diego, and Salton Sea.

H-23
Figure V-8: Estimated Change in NOx Emissions from Alternative Fuel Production Facilities and Petroleum-Based Projects Relative to 2016 Baseline
-290
-240
-190
-140
-90
-40
10
60
2019 2020 2021 2022 2023 2024 2025 2026 2027 2028 2029 2030
NO
x Em
issio
n Ch
ange
s for
Pro
duct
ion
(tons
/yea
r)
Year
Cellulosic Ethanol BiodieselRenewable Diesel Alternative Jet FuelRenewable Propane Dairy NGStarch Ethanol CCS Projects Solar Steam ProjectsRefinery Investment Projects Total

H-24
-100
-80
-60
-40
-20
0
20
40
60
2019 2020 2021 2022 2023 2024 2025 2026 2027 2028 2029 2030
NO
x Em
issi
on C
hang
es fo
r Pro
duct
ion
(tons
/yea
r)
Year
Cellulosic Ethanol BiodieselRenewable Diesel Alternative Jet FuelRenewable Propane Dairy NGSolar Steam Projects Starch Ethanol CCS ProjectsTotal

H-25
Figure V-9: Estimated Change in PM2.5 Emissions from Alternative Fuel Production Facilities and Petroleum-Based Projects Relative to 2016 Baseline
-130
-110
-90
-70
-50
-30
-10
10
30
2019 2020 2021 2022 2023 2024 2025 2026 2027 2028 2029 2030
PM2.
5 E
miss
ion
Chan
ges f
or P
rodu
ctio
n (to
ns/y
ear)
Year
Cellulosic Ethanol BiodieselRenewable Diesel Alternative Jet FuelRenewable Propane Dairy NGStarch Ethanol CCS Projects Solar Steam ProjectsRefinery Investment Projects Total
H-26
3. Changes in Aviation Emissions from Use of Alternative Jet Fuel
Staff expects that the proposed amendments would increase the use of AJF at California airports resulting in changes in emissions during taxi, takeoff, and landing operations. Recent studies have shown that there are significant reductions in particulate matter and sulfur oxide emissions13,14,15 and a slight reduction or no change
13 Boeing Company, UOP, U.S. Air Force Research Laboratory, 2011. Evaluation of Bio-Derived Synthetic Paraffinic Kerosenes (Bio2SPK), Committee D02 on Petroleum Products and Lubricants, Subcommittee D02.J0.06 on Emerging Turbine Fuels, Research Report D02-1739, ASTM International, West Conshohocken, PA, 28 June 2011. 14 Roland, O. and Garcia, F., 2014. TOTAL New Energies, Amyris, Inc., U.S. Air Force Research Laboratory, Evaluation of Synthesized Iso-Paraffins Produced from Hydroprocessed Fermented Sugars (SIP Fuels), Final Version (3.), Committee D02 on Petroleum Products, Liquid Fuels, and Lubricants, Subcommittee D02.J0 on Aviation Fuels, Research Report D02-1776, ASTM International, West Conshohocken, PA, 15 June 2014. 15 Edwards, T., Meyer, D., Johnston, G., McCall, M., Rumizen, M., and Wright, M.,2016. Evaluation of Alcohol to Jet Synthetic Paraffinic Kerosenes (ATK2SPK), Report Version (1.10), Committee D02 on Petroleum Products, Liquid Fuels, and Lubricants, Subcommittee D02.J0 on Aviation Fuels, Research Report D02-1828, ASTM International, West Conshohocken, PA, 1 April 2016.
-90
-70
-50
-30
-10
10
30
2019 2020 2021 2022 2023 2024 2025 2026 2027 2028 2029 2030
PM2.
5Em
issi
on C
hang
es fo
r Pro
duct
ion
(tons
/yea
r)
Year
Cellulosic Ethanol BiodieselRenewable Diesel Alternative Jet FuelRenewable Propane Dairy NGSolar Steam Projects Starch Ethanol CCS ProjectsTotal

H-27
in nitrogen oxides (NOX)16,17,18 emissions when AJFs replace conventional jet fuel. A detailed discussion of the methodology used to determine the estimated changes in aviation emissions from the use of AJF can be found in AppendixAttachment F to this Notice. Estimated changes in emissions of NOx and PM2.5 from use of AJF are illustrated in Figures V-10 and V-11, respectively.
Figure V-10: Estimated Change in NOx Emissions from Use of Alternative Jet Fuel Relative to 2016 Baseline
16 Corporan,E., DeWitt,M.J., Klingshirn,C.D., Anneken,D., 2010. Alternative Fuels Tests on a C-17 Aircraft: Emissions Characteristics, Air Force Research Laboratory, Interim Report, AFRL-RZ-WP-TR-2011-2004, Wright-Patterson Air Force Base, OH, December 2010. 17 Carter, Nicholas A., Stratton, R.W., Bredehoeft, M.K., and Hileman, 2011. J.I. Energy and Environmental Viability of Select Alternative Jet Fuel Pathways, 47th AIAA/ASME, SAE, ASEE Joint Propulsion Conference & Exhibit, San Diego, CA, AIAA 2011I5968, 31 July – 03 August 2011. 18 Lobo et al., 2012. Impact of Alternative Fuels on Emissions Characteristics of a Gas Turbine Engine − Part 1: Gaseous and Particulate Matter Emissions. Environmental Science & Technology 2012 46 (19), 10805-10811. DOI: 10.1021/es301898u
-275
-225
-175
-125
-75
-25
25
2019 2020 2021 2022 2023 2024 2025 2026 2027 2028 2029 2030
NO
x Em
issio
ns fr
om U
se o
f Alte
rnat
ive
Jet
Fuel
(ton
s/ye
ar)
Year

H-28
Figure V-11: Estimated Change in PM2.5 Emissions from Use of Alternative Jet Fuel Relative to 2016 Baseline
-325
-275
-225
-175
-125
-75
-25
25
2019 2020 2021 2022 2023 2024 2025 2026 2027 2028 2029 2030
NO
x Em
issi
ons
from
Use
of A
ltern
ativ
e Je
t Fu
el (t
ons/
year
)
Year
-25
-20
-15
-10
-5
0
2019 2020 2021 2022 2023 2024 2025 2026 2027 2028 2029 2030
PM2.
5 Em
issio
ns fr
om U
se o
f Alte
rnat
ive
Jet F
uel (
tons
/yea
r)
Year

H-29
5. Qualitative Summary of Changes in Other Emissions and Tools to Deal with Local Impacts
As discussed previously, the proposed amendments could result in the increased production of ethanol, biodiesel, renewable diesel and biomethane in California, as well as the use of CCS at biofuel and fossil fuel refineries. Viewed in isolation, some of these activities may raise concerns about increases in emissions of air pollutants associated with feedstock transport to production facilities, production of biofuels, and transport of finished fuels to blending facilities. Staff has shown quantitatively the cumulative impact of the two criteria pollutants of most concern statewide (NOx and PM2.5) are likely reduced by the proposed amendments. However, these are not the only pollutants of concern at the local level and, even with respect to NOx and PM2.5, small emission increases may occur at a localized level near feedstock and finished fuel transportation routes and near production facilities. Other air emissions may be of greater concern at the local level. Since not all impacts can be quantified and some qualitative benefits could be significant, staff provides a qualitative summary of these impacts in this section before turning to health benefits of the quantitative analysis both statewide and for an example bio refinery. CARB and the State generally are prepared to address any local emission issues using a variety of policy tools. First, emissions from stationary sources are regulated by air districts to minimize the negative impacts from the increased production. Any new biofuel production facilities would be required to follow all State and local emission standards to protect public health and the environment, and could employ the strategies
-25
-20
-15
-10
-5
0
2019 2020 2021 2022 2023 2024 2025 2026 2027 2028 2029 2030
PM2.
5 Em
issi
ons
from
Use
of A
ltern
ativ
e Je
t Fu
el (t
ons/
year
)
Year

H-30
in CARB’s biorefinery siting facility guidance document to reduce possible impacts.19 CARB continues to drive down emissions from mobile sources, including those that would serve biorefineries. Under State Implementation Plans (SIPs), states are required to provide comprehensive plans to attain the NAAQS set by the U.S. EPA. CARB reviews and approves local area districts and other agencies SIP elements and ensures they achieve the State’s criteria pollution targets. Additionally, AB 617 directs CARB to cooperate with local air districts to implement criteria pollutant reduction programs in high exposure communities. AB 617 requires CARB to establish and maintain a database of the best-available retrofit control technology for criteria pollutants. The programs, standards, and plans specified under the SIPs and AB 617 will ensure that any increase in emissions from increased activity due to the proposed amendments will be controlled to minimize the impacts on California residents, especially in areas with poor air quality. CCS projects have the potential to contribute to additional criteria pollutant and air toxics emissions from activities related with CO2 capture, compression, transport, and injection. The amount and scale of potential air pollutant emissions from CCS projects can vary widely, from reductions in emissions to large emissions increases based on the industrial process from which CO2 is captured and the technology used to capture the CO2. Since CCS generally requires substantial amounts of energy use, additional air pollutant emissions are expected from the implementation of most types of CCS projects. A study by the European Environmental Agency has shown that increases in criteria and air toxics emissions are well correlated with the magnitude of the energy demands of the CCS process.20 Carbon capture tends to be by far the most energy intensive and expensive step in a CCS project. CCS projects involving processes that produce low purity CO2 would require far greater energy demand than CCS projects involving high purity CO2.21 Accordingly, the greater the CCS project’s CO2 purity, the lower the expected increases in criteria and air toxics emissions. In the near term, most potential CCS projects would likely occur in processes that already produce high purity CO2 streams, such as ethanol production and certain forms of steam methane reforming. These projects do not require a CO2 capture step and are expected to occur sooner due to their lower cost. Therefore, these near term projects are likely to incur minimal changes in criteria and toxics emissions as a result of CO2 compression, transport, and injection. For CCS projects that produce low purity CO2 streams such as power plants, the CO2 capture technology would likely be primarily based on chemical adsorption using amine-based solvents such as monoethanolamine (MEA).22 Because
19 See https://www.arb.ca.gov/fuels/lcfs/bioguidance/biodocs/finalbiorefineryguidenov2011.pdf. Adopted in November 2011. 20 European Environmental Agency. "Air pollution impacts from carbon capture and storage (CCS)." EEA Technical report No 14/2011 (2011). 21 High purity CO2 is CO2 that only requires dehydration, ~98%. Low purity can be anywhere from as low as ~400ppm (atmospheric CO2) to ~15% (industrial processes and coal power production) 22 Capture technologies such as pre-combustion capture, other solvents or sorbents, or entirely new power cycles, may have different emissions impacts but have not yet been demonstrated commercially.

H-31
amine-based solvents used in carbon capture systems would be recycled in a closed system, emissions of amine-based solvents associated with carbon capture systems would be minimal. The potential substitution from fossil fuels to electricity, hydrogen, natural gas and liquid biofuels could result in decreases in other criteria pollutants and toxics associated with gasoline tailpipe emissions and refueling infrastructure. Fossil fuels contain BTEX compounds, benzene, toluene, ethyl benzene, and xylenes, which can be emitted to the air and also contaminate soil and water. Gasoline-engine exhaust contains benzene, 1,3-butadiene, formaldehyde, and acetaldehyde. Diesel-engine exhaust contains not only diesel particulate matter, which is a TAC, but also poly-nuclear (polycyclic) aromatic hydrocarbons (PAHs). Generally, all exhaust from the combustion of hydrocarbon fuels contains benzene as a product of incomplete combustion (PIC). Staff expects a decrease in use of fossil fuels to result in decreases in these criteria pollutants and toxics in regions with heavy use of motor vehicles and diesel engines, such as big population centers (e.g., South Coast) and areas with heavy truck use (San Joaquin Valley). The substitution from fossil jet fuel to alternative jet fuel might also contribute to a decrease in the emission of other criteria pollutants and toxics, especially around airports with heavy air traffic. Alternative jet fuels derived from hydrotreating of vegetable oils and animal fats do not contain aromatic compounds (benzene, naphthalene, and methylnaphthalene),23 and emit less sulfur oxides (SOx) when compared to fossil jet fuel. However, it is unclear whether alternative jet fuels emit less or more CO or unburned hydrocarbons than fossil jet fuels24,25. The U.S. EPA National Ambient Air Quality Standards (NAAQS) include standards for CO, and California is in attainment for all air basins. Given California is in attainment and the small volumes of alternative jet fuel anticipated to be used as a result of the proposed amendments, any impacts on CO emissions are expected to be negligible. E. Health Impacts Analysis Improvements in California air quality under the proposed amendments are anticipated to result in health benefits for California individuals. The proposed amendments will 23 Boeing Company, UOP, U.S. Air Force Research Laboratory, 2011. Evaluation of Bio-Derived Synthetic Paraffinic Kerosenes (Bio2SPK), Committee D02 on Petroleum Products and Lubricants, Subcommittee D02.J0.06 on Emerging Turbine Fuels, Research Report D02-1739, ASTM International, West Conshohocken, PA, 28 June 2011. 24 Edwards, Tim, Meyer, D., Johnston, G., McCall, M., Rumizen, M., Wright, M., “Evaluation of Alcohol to Jet Synthetic Paraffinic Kerosenes (ATJ-SPKs),” Report Version (1.10), Committee D02 on Petroleum Products, Liquid Fuels, and Lubricants, Subcommittee D02.J0 on Aviation Fuels, Research Report D02 1828, ASTM International, West Conshohocken, PA, 1 April 2016. 25 Corporan, Edwin, Edwards, T., Shafer, L., DeWitt, M.J., Klingshirn, C.D., Zabarnick, S., West, Z., Striebich, R., Graham, J.,Klein, J. Chemical, Thermal Stability, Seal Swell, and Emissions Studies of Alternative Jet Fuels. Energy & Fuels, 25, 955-966, 2011.

H-32
affect air quality through three main categories of emissions: 1) tailpipe emissions reductions for on-road and off-road vehicles, 2) aircraft emissions reductions at and near airports, and 3) changes in emissions at stationary sources from alternative fuel production, efficiency improvement projects at refineries, and steam production at oil fields.26,27
CARB analyzed changes in five health outcomes: cardiopulmonary28 mortality, hospitalizations for cardiovascular29 illness, hospitalizations for respiratory30 illness, emergency room (ER) visits for respiratory illness, and ER visits for asthma. Staff selected these health outcomes because U.S. EPA has identified these as having a causal or likely causal relationship with exposure to PM2.5.31 The U.S. EPA examined other health endpoints such as cancer, reproductive and developmental effects, but determined there was only suggestive evidence for a relationship between these outcomes and PM exposure, and insufficient data to include these endpoints in the national health assessment analyses routinely performed by U.S. EPA. The U.S. EPA has determined that both long-term and short-term exposure to PM2.5 plays a causal role in premature mortality, meaning that a substantial body of scientific evidence shows a relationship between PM2.5 exposure and increased risk of death. This relationship persists when other risk factors such as smoking rates, poverty and other factors are taken into account.32 While other mortality endpoints could be
26 Emissions from alternative fuel production facilities and other stationary sources were multiplied by 0.2 to account for the difference in the way those emissions affect exposed populations compared to on-road vehicle emissions. Emissions from production facilities, which are released from tall stacks relatively distant from residential areas, are expected to result in lower impacts than emissions from motor vehicles at ground level, on roadways that run through residential neighborhoods. The factor of 0.2 was derived by comparing the intake fraction (IF) of the two sources. IF is the fraction of total emissions of air pollutant that is inhaled by a receptor population during a certain time period, and is estimated by combining air pollutant concentration enhancement and population distribution near the source. The current study estimates IF of PM2.5 from three major refineries located in Los Angeles County using the U.S. EPA approved AERMOD model. The IF for refineries is then compared against published estimates of the IF of on-road diesel vehicles in the South Coast Air Basin to obtain the ratio of 20 percent. 27 Marshall, J.D., Teoh, S., and Nazaroff, W. 2003. Intake fraction of primary pollutants: motor vehicle emissions in the South Coast Air Basin. Atmospheric Environment 37 (2003) 3455–3468. Available at: http://uctc.berkeley.edu/research/papers/772.pdf. 28 Outcomes related to the heart or lungs 29 Outcomes related to the heart or blood vessels 30 Respiratory illness such as chronic obstructive pulmonary disease, and respiratory infection 31 U.S. EPA, 2010. Quantitative Health Risk Assessment for Particulate Matter (Final Report). https://www3.epa.gov/ttn/naaqs/standards/pm/data/PM_RA_FINAL_June_2010.pdf. 32 U.S. EPA, 2009. Integrated Science Assessment (ISA) for Particulate Matter (Final Report, Dec 2009). U.S. Environmental Protection Agency, Washington, DC, EPA/600/R-08/139F. http://ofmpub.epa.gov/eims/eimscomm.getfile?p_download_id=494959.

H-33
analyzed, the strongest evidence exists for cardiopulmonary mortality.33 The greater scientific certainty for this effect, along with the greater specificity of the endpoint, leads to an effect estimate for cardiopulmonary deaths that is both higher and more precise than that for all-cause mortality.34 The U.S. EPA has also determined a causal relationship between non-mortality cardiovascular effects and short and long-term exposure to PM2.5, and a likely causal relationship between non-mortality respiratory effects (including worsening asthma) and short and long-term PM2.5 exposure.35 These outcomes lead to hospitalizations and ER visits, and are included in this analysis. In general, health studies have shown that populations with low socioeconomic standings are more susceptible to health problems from exposure to air pollution.36,37 However, the models currently used by U.S. EPA and CARB do not have the granularity to account for this impact. The location and magnitude of projected emission reductions resulting from many proposed regulations are not known with sufficient accuracy to account for socioeconomic impacts, and an attempt to do so would produce uncertainty ranges so large as to make conclusions difficult. Staff acknowledges this limitation.38 Table V-12 shows the estimated avoided mortality and morbidity incidence as a result of the proposed amendments scenario for 2019 through 2030 by California air basin. Values in parenthesis represent the 95 percent confidence intervals of the central estimate. The proposed amendments scenario is estimated to reduce overall emissions of PM2.5 and NOX in all years, and leads to a net statewide health benefit.
33 U.S. EPA, 2009. Integrated Science Assessment (ISA) for Particulate Matter (Final Report, Dec 2009). U.S. Environmental Protection Agency, Washington, DC, EPA/600/R-08/139F. http://ofmpub.epa.gov/eims/eimscomm.getfile?p_download_id=494959. 34 CARB, 2010. Estimate of Premature Deaths Associated with Fine Particle Pollution (PM2.5) in California Using a U.S. Environmental Protection Agency Methodology. https://www.arb.ca.gov/research/health/pm-mort/pm-report_2010.pdf. 35 U.S. EPA, 2009. Integrated Science Assessment (ISA) for Particulate Matter (Final Report, Dec 2009). U.S. Environmental Protection Agency, Washington, DC, EPA/600/R-08/139F. http://ofmpub.epa.gov/eims/eimscomm.getfile?p_download_id=494959. 36 Krewski et al., 2009. Extended Follow-Up and Spatial Analysis of the American Cancer Society Study Linking Particulate Air Pollution and Mortality. Health Effects Institute Research Report 140. https://ephtracking.cdc.gov/docs/RR140-Krewski.pdf. 37 Gwynn, RC and Thurston, GD.,2001. The burden of air pollution: impacts among racial minorities. Environmental Health Perspectives;109(4):501–6. https://www.ncbi.nlm.nih.gov/pmc/articles/PMC1240572/. 38 A detailed summary of the health modeling methodology is included in Appendix A of the CARB Proposed Regulatory Amendments to the Heavy-Duty Vehicle Inspection Program and Periodic Smoke Inspection Program SRIA. CARB, 2017. Proposed Regulatory Amendments to the Heavy-Duty Vehicle Inspection Program and Periodic Smoke Inspection Program SRIA. http://www.dof.ca.gov/Forecasting/Economics/Major_Regulations/documents/CARB%20HDVIP%20PSIP%20SRIA.pdf.

H-34
The majority of health benefits estimated in the proposed amendments scenario are concentrated in the South Coast and San Joaquin Valley air basins, with minor health benefits distributed among other regions. Because the LCFS does not specify the blend levels of alternative fuels used at different locations within the State and does not specify how or where the changing supplies of transportation fuels will be produced, the projections of the spatial distribution of emission reductions and associated health impacts from the proposed amendments is highly uncertain. This source of uncertainty is not accounted for in the 95 percent confidence intervals.
Table V-12: Incremental (Relative to the 2016 Baseline) Regional and Statewide Avoided Mortality and Morbidity Incidences from 2019 to 2030 under the
Proposed Amendments Scenario*39
39 The method used to quantify health benefits was used for CARB’s on-road diesel regulations. Jet fuel emissions are treated the same as on-road diesel. This is an upper bound estimate. Fuel production emissions were discounted by a factor of 0.2 compared to diesel. In other words, PM emissions from this category were multiplied by 0.2. This factor is based on dispersion modeling work by Research Division, which suggests that the ratio of intake fractions of PM from refineries in Los Angeles to on-road diesel is approximately 1/5.
RegionGreat Basin Valleys
Lake County Lake Tahoe
Mojave DesertMountain Counties North Central Coast
North CoastNortheast PlateauSacramento Valley
Salton SeaSan Diego CountySan Francisco Bay
San Joaquin Valley South Central Coast
South CoastStatewide
* Values in parenthesis represent the 95% confidence interval. Totals may not add due to rounding
128(100-156) 18(2-43) 55(35-76)310(248-380) 46(6-106) 130(82-176)
16(13-20) 3(0-6) 7(4-10)
8(6-9) 1(0-3) 3(1-4)76(60-93) 10(1-23) 32(20-43)46(37-56) 8(1-19) 19(13-28)
24(18-29) 4(0-8) 9(6-12)6(4-7) 0(0-2) 2(1-2)
1(1-1) 0(0-0) 0(0-0)0(0-1) 0(0-0) 0(0-0)
1(1-1) 0(0-0) 0(0-0)2(1-2) 0(0-1) 1(1-1)
0(0-0) 0(0-0) 0(0-0)5(4-7) 1(0-2) 2(2-3)
0(0-0) 0(0-0) 0(0-0)1(0-1) 0(0-0) 0(0-0)
Avoided Premature Deaths Avoided Hospitalizations Avoided ER Visits

H-35
F. Localized Health Risk Assessment for a Potential California Biofuel Facility When analyzing the health impacts of re-adopting the LCFS in 2015, staff conducted a health risk assessment (HRA) study to evaluate the localized health impacts associated with toxic air contaminants that could be emitted from a typical biofuel facility within California. In order to estimate the potential cancer risk associated with a newly established biofuel facility, staff developed a prototype biofuel facility for a case study of Health Risk Assessment. Based on the size of some in-state biofuel facilities, staff assumed the prototype facility to be located in a square 400-meter by 400-meter fence line. The emission sources from the facility include natural gas or biomass boilers and turbines. Diesel PM emissions are generally generated by the heavy-duty trucks that are used to transport feedstocks and finished biofuels. Staff analyzed emission source characterization and parameters, collected meteorological data, conducted air dispersion modeling, and assessed potential cancer risks associated with the prototype biofuel facility based on The Air Toxics Hot Spots Program Risk Assessment Guidelines40 published by the California Office of Environmental Health Hazard Assessment (OEHHA). The results of the health risk assessment indicated that, the area with the greatest impact has an estimated potential cancer risk of approximately 0.8 chances in a million, surrounding the fence lines. About 200 yards from the facility boundaries, the estimated cancer risks decrease to about 0.4 chances per million. The estimated potential cancer risks further decrease to about 0.2 chances per million at about 400 yards from the facility boundaries.
40 Office of Environmental Health Hazard Assessment. February 2015. Air Toxics Hot Spots Program Risk Assessment Guidelines. Available at: http://oehha.ca.gov/air/hot_spots/pdf/HRAguidefinal.pdf
Region Avoided Premature Deaths Avoided Hospitalizations Avoided ER VisitsGreat Basin Valleys 0 (0-0) 0 (0-0) 0 (0-0)
Lake County 1 (1-1) 0 (0-0) 0 (0-0)Lake Tahoe 0 (0-0) 0 (0-0) 0 (0-0)
Mojave Desert 8 (6-10) 1 (0-3) 4 (2-5)Mountain Counties 1 (1-1) 0 (0-0) 0 (0-0)North Central Coast 2 (2-3) 0 (0-1) 1 (1-1)
North Coast 1 (1-1) 0 (0-0) 0 (0-0)Northeast Plateau 0 (0-1) 0 (0-0) 0 (0-0)Sacramento Valley 26 (21-32) 4 (1-9) 10 (6-14)
Salton Sea 8 (6-9) 1 (0-3) 2 (2-3)San Diego County 21 (17-26) 4 (0-8) 9 (6-13)San Francisco Bay 43 (34-53) 8 (1-18) 19 (12-26)
San Joaquin Valley 86 (67-105) 11 (1-25) 36 (22-49)South Central Coast 8 (6-10) 1 (0-3) 3 (2-4)
South Coast 141 (111-173) 20 (3-47) 61 (38-83)Statewide 348 (272-426) 51 (6-118) 146 (92-200)
*Values in parenthesis represent the 95% confidence interval. Totals may not add due to rounding

H-36
Staff also estimated the health impact associated with the combined onsite and offsite emissions of the prototype biofuel facility. The area with the greatest impact has an estimated potential cancer risk of approximately 5 chances in a million, mostly occurring directly adjacent to the main truck route that connects the prototype biofuel facility and the major freeway. At about 200 yards from the truck route, the estimated cancer risk drops to about 2 chances per million. At about 500 yards from the truck routes, the estimated cancer risk further decreases to about 1 chance per million. For additional details, please see Chapter IV of the 2015 ISOR of the LCFS41. G. Analysis Performed Relative to Low Carbon Fuel Standard Targets Remaining Constant at 10 Percent Reduction from 2021 to 2030 For the purposes of full disclosure, staff performed the same analysis comparing the proposed amendments to the projected emissions impact of a LCFS program that remains at 10 percent CI reduction post 2020. This represents a comparison to a business-as-usual scenario that may occur without adoption of the proposed amendments. More details on the business-as-usual scenario, including estimated volumes of alternative fuels and implementation of petroleum projects, are presented in Appendix E of the Staff Report. The net NOx and PM2.5 emissions impact of the proposed amendments relative to the 10 percent LCFS scenario are presented in Figures V-12 and V-13, respectively. The total statewide NOx and PM2.5 emissions are estimated to be lower in each year from 2019 through 2030. More details on this analysis including a discussion of the health impacts is presented in Appendix E.
41 Staff Report: Initial Statement of Reasons for Rulemaking: Proposed Re-adoption of the Low Carbon Fuel Standard Regulation.” December 31 (2014). Available at: https://www.arb.ca.gov/regact/2015/lcfs2015/lcfs15isor.pdf

H-37
Figure V-12: Estimated Statewide NOx Emissions Impact of the Proposed LCFS Amendments Relative to the LCFS at 10 Percent (tons/year)

H-38

H-39
Figure V-13: Estimated Statewide PM2.5 Emissions Impact of the Proposed LCFS Amendments Relative to the LCFS at 10 Percent (tons/year)

H-40


