Welcome to Tripura Board of Secondary Education | Tripura ...
Upload
sri-rice-international-programs-cals-cornell-universityCategory
view
2.127download
0
RIPURA STATE: THE ROLE OF GOVERNMENT AND PANCHYATI RAJ INSTITUTIONS IN LARGE-
SCALE ADOPTION
OF SRI
r. Baharul Majumdar
ept. of Agriculture, Agartala

WELCOME
To
TRIPURA
3
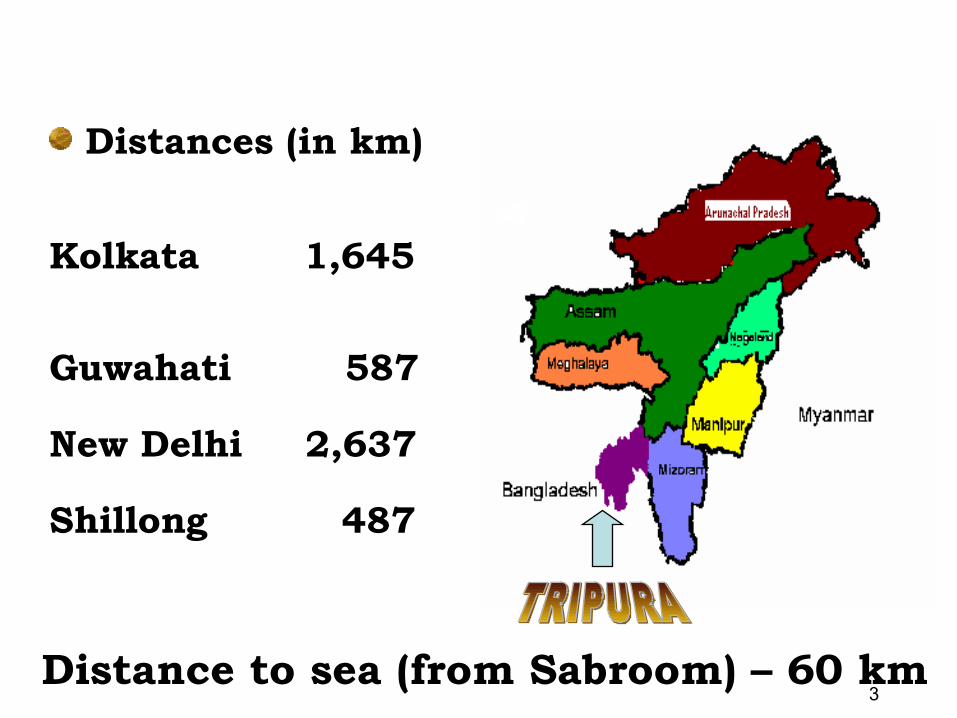
Distances (in km)
Kolkata 1,645
Guwahati 587
New Delhi 2,637
Shillong 487
Distance to sea (from Sabroom) – 60 km

4
Geographical Location
Agartala-Kolkata distance went from 350 km before Partition, to 1,645 km
Kolkata

5
Brief ProfileUnion Territory on 1st July, 1953; State
from 21st January, 1972 → 3rd smallest Indian State, after Goa and Sikkim
Long international border (856 km)Forest land: officially 60% of total area4 Districts, 17 Sub-Divisions, 40 Blocks,
and 1 Autonomous District Council
Princely State merged in October, 19494 Zilla Parishads, 513 Gram Panchayats,
527 ADC Villages, 1 Municipal Council, and 12 Nagar Panchayats

PERSPECTIVE PLAN: PERSPECTIVE PLAN: OBJECTIVES 2001-10OBJECTIVES 2001-10
State Government commitments:State Government commitments:
Self-sufficiency in food grainsSelf-sufficiency in food grains
Improvement in farmers’ Improvement in farmers’ economic conditioneconomic condition

PERSPECTIVE PLAN IMPLEMENTATION
• After 7 years of implementation of the Perspective Plan, food grain production up only from 5.13 lakh tons to 6.35 lakh tons
• There remained a shortfall in foodgrains of about 1.50 ~ 1.60 lakh tons
• Growth in food grain production cannot be achieved without adoption of proper system for improvement of crop management
• Advent of SRI in 2005 came at right time

Shrinkage in Cultivable Area
Diversion of agricultural land for non-agricultural purposes, i.e.,
• Domestic and other developmental uses
• Area for fencing along border• Road construction• Brick kilns• Plantation crops like rubber, etc.

Rice is the growth engine of the State’s economy
Two-pronged strategy was adopted to increase the rice production per unit land per unit time
• Crop management – through SRI• Varietal technology – hybrid rice
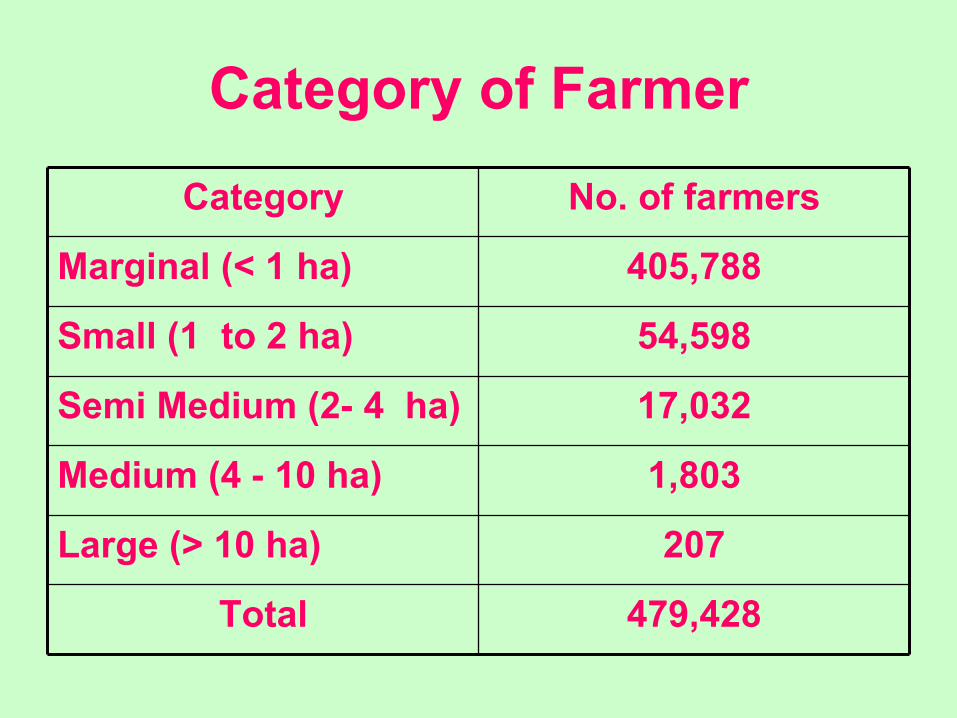
Category of Farmer
Category No. of farmers
Marginal (< 1 ha) 405,788
Small (1 to 2 ha) 54,598
Semi Medium (2- 4 ha) 17,032
Medium (4 - 10 ha) 1,803
Large (> 10 ha) 207
Total 479,428

Operational HoldingsFarmers Operational
holdings (%)Area operated
(%)Average size of
holding (ha)TRIPURA ALL-
INDIATRIPURA ALL-
INDIATRIPURA ALL-
INDIA
Marginal (Below 1 Ha)
84.6% 63% 47% 19% 0.3 0.40
Small (1 to 2 Ha)
11.4% 19% 28% 20% 1.4 1.41
Semi Medium (2-4 ha)
3.6% 12% 16% 24% 2.6 2.72
Medium ( 4 - 10 Ha)
0.4% 5% 3% 24% 5.2 5.80
Large (above 10 ha)
0.04% 1% 6% 13% 78.8 17.18
Total 100% 100% 100% 100% 0.56 1.32

ORGANISATIONAL SET-UP
DEPARTMENT OF AGRICULTURE
MINISTER OF AGRICULTURE
PRINCIPLE SECRETERY OF AGRICULTURE
DIRECTOR OF AGRICULTUREDIRECTOR OF HORTICULTURE
AND SOIL CONSERVATION
DIRECTOR STATE LAND USE BOARD (SLUB)
DDA (Estt.)
I/C Section
(Non-Gazetted)
DDA (Seed)I/C CropSection
JDA(PP)I/C
Plant Protection
Section
JDA(Plan)
I/CPlann-
Ing Section
PrincipalI/C
Upgraded Gram Sevak
Training Centre
DDA (S & QC)
I/C Ferti. &Estt. Section
(Gazetted)
Dy. Director of Agriculture I/C/ of respective Districts (Total 4 – Districts)
DDA (Training) I/CTraining & Development
DDA (Marketing)I/CMarketing Section
Credit Planning OfficerI/C Statistical Section
Senior Agronomist I/C Agri. Research Wing, A.I. Unit
Superintendent of Agriculture, I/C Agri. Sub Division (Total 20 Nos.)
Agriculture Sector Officer, I/C Sector (Agri) (Total = 78 Nos.)
V.L.W. Store, I/C Input Stores
DISTRICT LEVEL W. Tripura = 1S. Tripura=1N. Tripura=1Dhalai = 1
Agri. Sub-Division Level (Coterminous with Block)
West = 158 Nos. South = 106 Nos.North = 72 Nos. Dhalai = 41 Nos.
W Dist = 8S Dist = 5N Dist = 4Dhalai Dist =3
Agricultural Farm
(Total 21 Nos.)
West = 5South = 8North= 3Dhalai =5
Circle V.L.Ws I/C V.L.W.CircleTotal = 704West = 265South = 208North = 138,Dhalai = 93
Power Tiller Hiring Centre West = 35South = 26North = 12Dhalai = 7

Institutional approach for Promotion of SRI – 2002-06
SRI
SUB DIVISION22 no
FARMERS FIELD
DISTRICT4 no
Department of Agriculture
AGRI SECTOR78 no
VILLAGE LEVEL CIRCLE1040 no
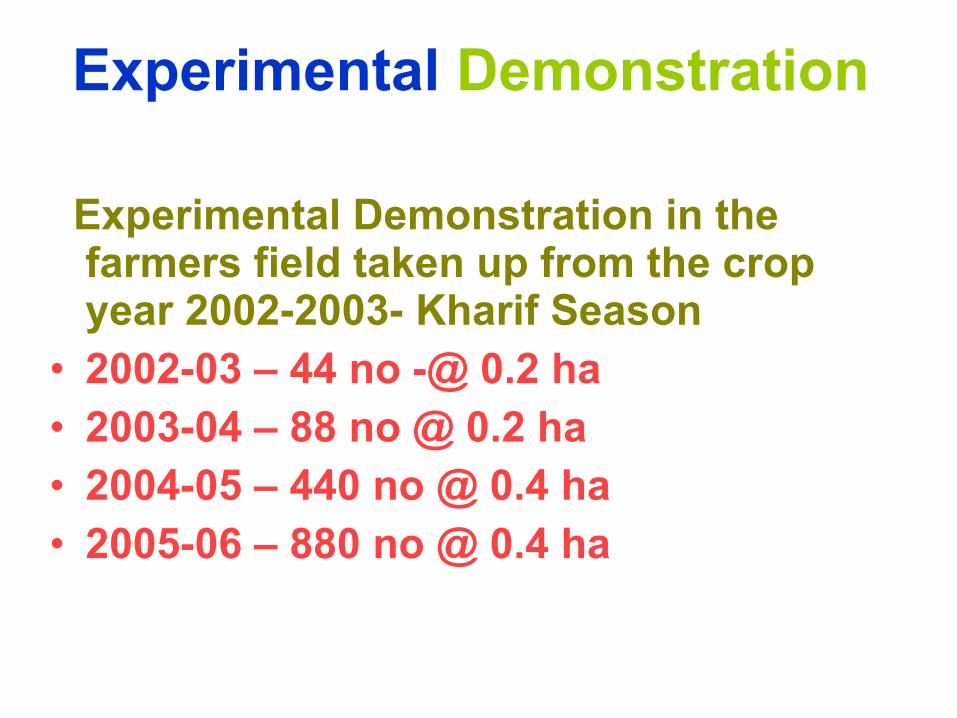
Experimental Demonstration Experimental Demonstration in the
farmers field taken up from the crop year 2002-2003- Kharif Season
• 2002-03 – 44 no -@ 0.2 ha• 2003-04 – 88 no @ 0.2 ha• 2004-05 – 440 no @ 0.4 ha• 2005-06 – 880 no @ 0.4 ha

• Criticism• Resistance• Opposition

Visit of Mrs. Radha Singh, IAS, Former Secretary. MOA, GOI

Visit of Dr. M.S. Swaminathan

MASS MOVEMENT
SRI MOVEMENT
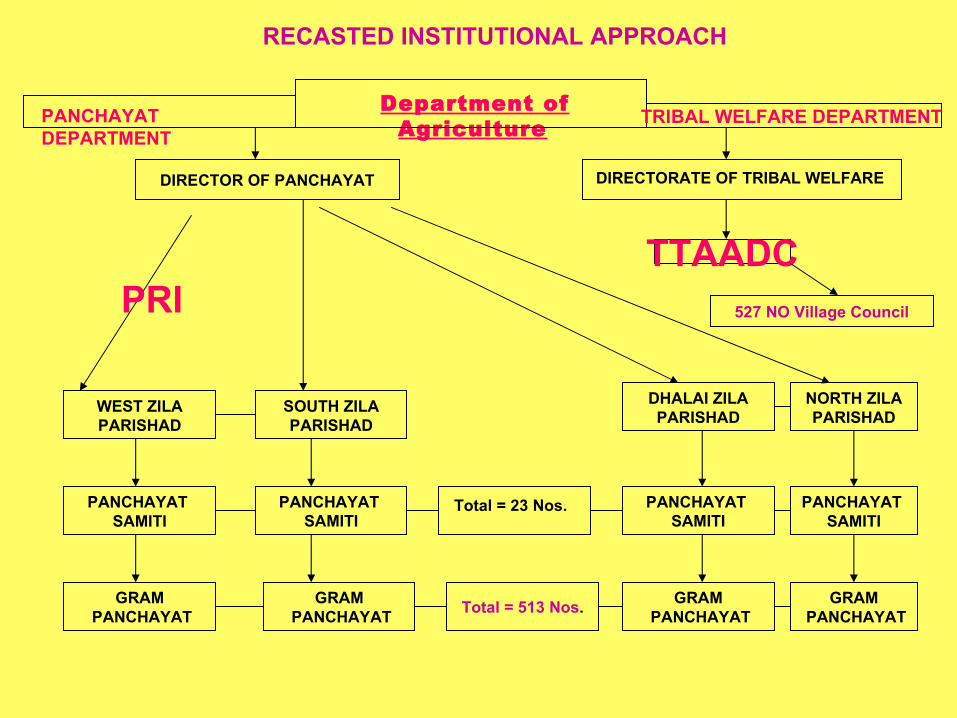
Department of Agriculture
TRIBAL WELFARE DEPARTMENT
DIRECTOR OF PANCHAYAT
TTAADC527 NO Village Council
PANCHAYAT DEPARTMENT
DIRECTORATE OF TRIBAL WELFARE
GRAM PANCHAYAT
PANCHAYAT SAMITI
SOUTH ZILAPARISHAD
WEST ZILAPARISHAD
PANCHAYAT SAMITI
GRAM PANCHAYAT
PANCHAYAT SAMITI
DHALAI ZILAPARISHAD
Total = 513 Nos.GRAM
PANCHAYAT
NORTH ZILAPARISHAD
GRAM PANCHAYAT
PANCHAYAT SAMITI
Total = 23 Nos.
PRI
RECASTED INSTITUTIONAL APPROACH
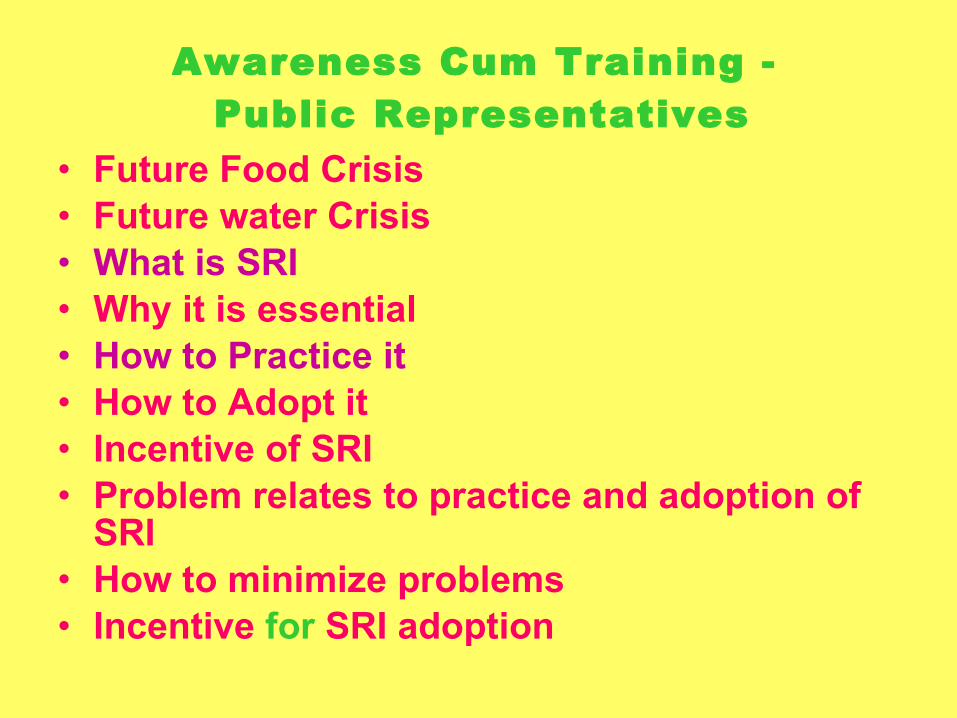
Awareness Cum Training - Public Representatives
• Future Food Crisis • Future water Crisis• What is SRI• Why it is essential• How to Practice it• How to Adopt it• Incentive of SRI• Problem relates to practice and adoption of
SRI• How to minimize problems• Incentive for SRI adoption

Large Scale Adoption of SRI
PRI TTAADC
AGRIDEPTT
SRI

PRI’s / TTAADC Contribution
• Farmers Mobilization• Weeder• Marker• Labour Cost – 20 – 25 mandays• Drainage and Irrigation Channel
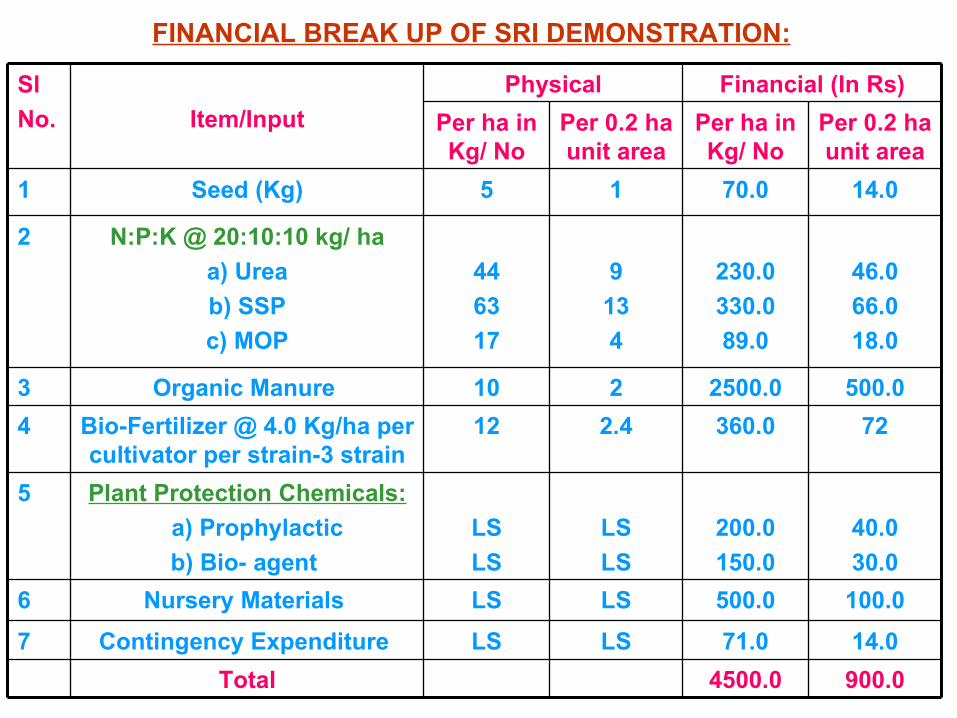
FINANCIAL BREAK UP OF SRI DEMONSTRATION: Sl
No. Item/Input
Physical Financial (In Rs)
Per ha in Kg/ No
Per 0.2 ha unit area
Per ha in Kg/ No
Per 0.2 ha unit area
1 Seed (Kg) 5 1 70.0 14.0
2 N:P:K @ 20:10:10 kg/ ha
a) Urea
b) SSP
c) MOP
44
63
17
9
13
4
230.0
330.0
89.0
46.0
66.0
18.0
3 Organic Manure 10 2 2500.0 500.0
4 Bio-Fertilizer @ 4.0 Kg/ha per cultivator per strain-3 strain
12 2.4 360.0 72
5 Plant Protection Chemicals:
a) Prophylactic
b) Bio- agent
LS
LS
LS
LS
200.0
150.0
40.0
30.0
6 Nursery Materials LS LS 500.0 100.0
7 Contingency Expenditure LS LS 71.0 14.0
Total 4500.0 900.0
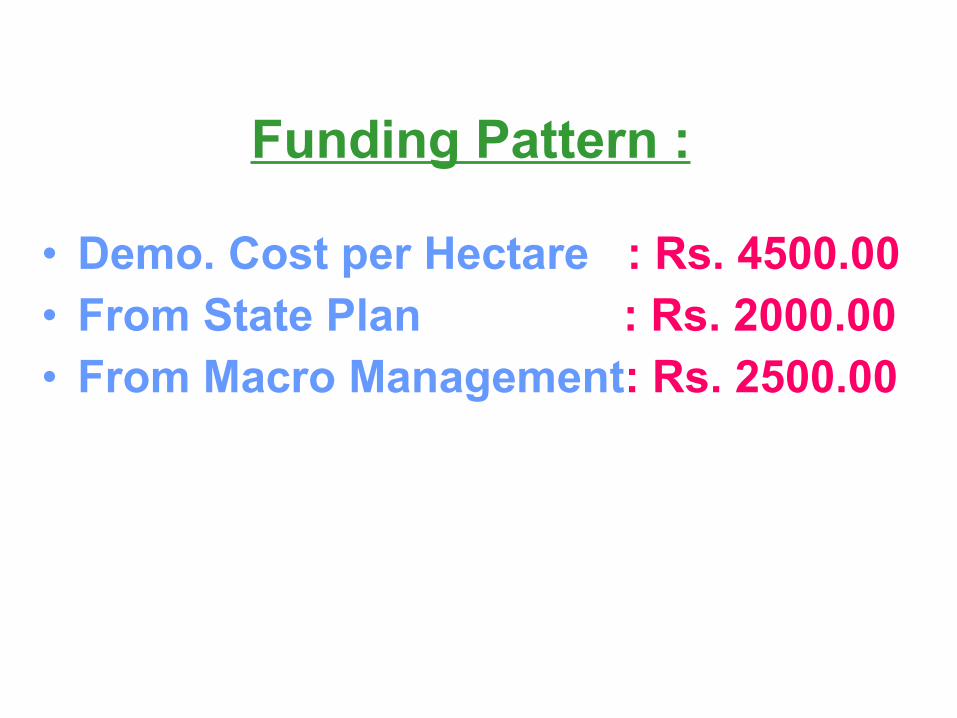
Funding Pattern :
• Demo. Cost per Hectare : Rs. 4500.00• From State Plan : Rs. 2000.00• From Macro Management: Rs. 2500.00

Rate of Adoption of SRI in Tripura
YEAR
Area covered through SRI (ha)
Total paddy
area (ha)
Covered through SRI (%)
Farmers involved
(no.)
2002-03 8.8 239,670 0.003 44
2003-04 17.6 242,110 0.007 88
2004-05 176 238,950 0.07 440
2005-06 352 237,150 0.14 880
2006-07 14,678 235,272 6.23 73,390
2007-08 32,497 235,938 13.77 162,485
2008-09 50,000 235,500 21.23 250,000

Rate of SRI Adoption in TripuraYear Area
Covered through
SRI
Total area
under paddy
Percent covered through SRI (%)
No. of farmers
involved
2006-
07
14,678 ha 235,272 6.23 % 73,390
2007-
08
32,497 ha 235,938 13.77% 162,485
2008-
09
24,782 ha(Kharif only)
192,000 12.90%(Kharif only)
123,910 (Kharif only)
Total SRI target for 2008-09 is 50,000 ha Achievement shown is only for Kharif Season 2008

Productivity of Rice – Tripura vs. All-India
Year
Yield (tons/ha)
All-India Tripura SRI in Tripura
Increase over
present practice
2003-04 2.077 2.396 5.360 2.964
2004-05 1.984 2.352 5.025 2.673
2005-06 2.102 2.383 4.690 2.307
2006-07 2.084 2.503 4.271 1.768
2007-08 N.A. 2.550 4.321 1.771

Increase in foodgrains production through adoption of SRI
Year Projected foodgrains
requirement
Likely production
with present trend
Additional production
through adoption of
SRI
Projected production
2008-09 8.09 6.74 0.50 7.242009-10 8.22 6.88 0.75 7.632010-11 8.34 7.03 0.90 7.932011-12 8.48 7.17 1.00 8.17
in Lakh tons
Per ha average yield increase through SRI – 1 Mt