
0812 Cruise Ship Discharge Assess
162
EPA842-R-07-005 Cruise Ship Discharge Assessment Report U.S. Environmental Protection Agency Oceans and Coastal Protection Division Office of Wetlands, Oceans, and Watersheds Office of Water 1200 Pennsylvania Avenue, NW Washington, D.C. 20460 December 29, 2008
Transcript of 0812 Cruise Ship Discharge Assess

EPA842-R-07-005
Cruise Ship Discharge Assessment Report
U.S. Environmental Protection Agency
Oceans and Coastal Protection Division Office of Wetlands, Oceans, and Watersheds
Office of Water
1200 Pennsylvania Avenue, NW Washington, D.C. 20460 December 29, 2008

ACKNOWLEDGMENTS AND DISCLAIMER Today's Cruise Ship Discharge Assessment Report (Assessment Report) does not substitute for any statute or regulation, nor is it a regulation itself. The document assesses five primary cruise ship waste streams: sewage, graywater, oily bilge water, solid waste, and hazardous waste. For each waste stream, the Assessment Report discusses the nature and volume of the waste stream generated; existing federal regulations applicable to the waste stream; environmental management, including treatment, of the waste stream; potential adverse environmental impacts of the waste stream; on-going actions by the federal government to address the waste stream; and a wide range of options and alternatives to address the waste stream from cruise ships in the future. Discussion of existing regulations in this Assessment Report does not represent the consummation of the Agency's decision-making on the matters discussed. By its terms, the Assessment Report itself does not impose binding requirements on any party. The regulations themselves, not the Assessment Report, govern parties’ legal obligations.
The primary contact regarding questions or comments on this document is:
Laura S. Johnson U.S. Environmental Protection Agency
Oceans and Coastal Protection Division, OWOW (4504T) 1200 Pennsylvania Avenue, NW
Washington, DC 20460
(202) 566-1273 (telephone) (202) 566-1546 (fax)

TABLE OF CONTENTS
Section 1: Introduction 1.1 Overview ....................................................................................................................1-1 1.2 Other EPA Cruise Ship Efforts ..................................................................................1-2 1.3 Applicable International Conventions and Related U.S. Laws and Regulations .......1-4 1.4 Federal Environmental Enforcement History Regarding Cruise Ships ......................1-6 1.5 Cruise Lines International Association’s Commitment to Reduce Potential Environmental Impacts ...............................................................................................1-7 1.6 Possible Options and Alternatives to Generally Address Cruise Ship Discharges.....1-8 References .........................................................................................................................1-11
Section 2: Sewage
2.1 What is sewage from vessels and how much is generated on cruise ships? ...............2-1 2.2 What federal laws apply to sewage from cruise ships? .............................................2-2 2.3 What technologies are available to treat sewage from cruise ships? .........................2-7 2.4 What are the potential environmental impacts associated with sewage from cruise ships? ......................................................................................................2-23 2.5 What action is the federal government taking to address sewage from cruise ships?...........................................................................................................................2-41 2.6 Possible Options and Alternatives to Address Sewage from Cruise Ships ................2-43 References .........................................................................................................................2-46
Section 3: Graywater
3.1 What is graywater and how much is generated on cruise ships? ...............................3-1 3.2 What federal laws apply to graywater from cruise ships? .........................................3-4 3.3 Characterization of Untreated Graywater ...................................................................3-5 3.4 What are the potential environmental impacts associated with untreated graywater from cruise ships? .....................................................................................3-19 3.5 What action is the federal government taking to address graywater waste streams from cruise ships? .........................................................................................3-30 3.6 Possible Options and Alternatives to Address Graywater from Cruise Ships ............3-32 References .........................................................................................................................3-34
Section 4: Oily Bilge Water
4.1 What is bilge water and how much is generated on cruise ships? .............................4-1 4.2 What federal laws apply to bilge water from cruise ships? .......................................4-3 4.3 What technologies are available to manage oily bilge water from cruise ships? ...............................................................................................................4-7 4.4 What are the potential environmental impacts associated with inadequately treated bilge water from cruise ships? .......................................................................4-11 4.5 What action is the federal government taking to address oily bilge water from cruise ships? ...............................................................................................................4-14

4.6 Possible Options and Alternatives to Address Oily Bilge Water from Cruise Ships ................................................................................................................4-16 References .........................................................................................................................4-19
Section 5: Solid Waste 5.1 What is solid waste and how much is generated on cruise ships? .............................5-1 5.2 What federal laws apply to solid waste from cruise ships? .......................................5-3 5.3 What practices are available to manage solid wastes generated on cruise ships? .....5-8 5.4 What are the potential environmental impacts associated with solid waste from cruise ships? ......................................................................................................5-10 5.5 What action is the federal government taking to address solid waste from cruise ships? ...............................................................................................................5-12 5.6 Possible Options and Alternatives to Address Solid Waste from Cruise Ships .........5-14 References .........................................................................................................................5-17
Section 6: Hazardous Waste
6.1 What is RCRA hazardous waste and how much is landed by cruise ships to the United States? ......................................................................................................6-1 6.2 What federal laws apply to hazardous waste on cruise ships? ...................................6-4 6.3 What practices are available to manage hazardous wastes generated on cruise ships? ...............................................................................................................6-9 6.4 What are the potential environmental impacts associated with hazardous waste from cruise ships? ............................................................................................6-10 6.5 What action is the federal government taking to address hazardous waste from cruise ships? ......................................................................................................6-11 6.6 Possible Options and Alternatives to Address Hazardous Waste from Cruise Ships ................................................................................................................6-12 References .........................................................................................................................6-15

LIST OF FIGURES, TABLES, AND APPENDICES
Figure 2-1. Per Capita Sewage Generation as Reported in EPA’s 2004 Cruise Ship Survey .......................................................................................................................2-2
Figure 2-2. Sewage Generation by Persons Onboard as Reported in EPA’s 2004 Cruise Ship Survey ..................................................................................................2-2
Figure 2-3. Simplified Schematic of Traditional Type II Marine Sanitation Device Using Biological Treatment and Chlorine Disinfection .......................................2-8
Table 2-1. Comparison of Traditional Type II MSD Effluent Concentrations to Untreated Domestic Wastewater -- Conventional Pollutants and Other Common Analytes ............................................................................................................2-9
Table 2-2. Traditional Type II MSD Effluent Concentrations -- Metals ..............................2-10 Table 2-3. Traditional Type II MSD Effluent Concentrations -- Volatile and
Semivolatile Organics .......................................................................................................2-11 Table 2-4. Comparison of Traditional Type II MSD Effluent Concentrations
to Untreated Domestic Wastewater -- Ammonia ..............................................................2-11 Table 2-5. AWT Effluent Concentrations and Removals -- Pathogen Indicators ................2-15 Table 2-6. AWT Effluent Concentrations and Removals -- Conventional Pollutants
and Other Common Analytes ............................................................................................2-16 Table 2-7. AWT Effluent Concentrations and Removals -- Metals .....................................2-18 Table 2-8. AWT Effluent Concentrations and Removals -- Volatile and Semivolatile
Organics ............................................................................................................................2-19 Table 2-9. AWT Effluent Concentrations and Removals -- Nutrients .................................2-20 Table 2-10. AWT Waste Biomass Concentrations for Selected Analytes ............................2-22 Table 2-11. Comparison of AWT and Traditional Type II MSD Effluent to
Wastewater Discharge Standards ......................................................................................2-24 Table 2-12. National Recommended Water Quality Criteria for Bacteria ...........................2-27 Table 2-13. Narrative National Recommended Water Quality Criteria for
Conventional Pollutants and Other Common Analytes ....................................................2-28 Table 2-14. Seasonal Coastal Water Temperatures in °C Across the United States ............2-30 Table 2-15. Comparison of Traditional Type II MSD and AWT Effluent to
Numeric National Recommended Water Quality Criteria for Total Residual Chlorine .............................................................................................................................2-31
Table 2-16. Comparison of AWT Effluent to National Recommended Water Quality Criteria for Metals ................................................................................................2-32
Table 2-17. Comparison of Traditional Type II MSD Effluent to National Recommended Water Quality Criteria for Semivolatile and Volatile Organics ...............2-32
Table 2-18. Comparison of AWT Effluent to National Recommended Water Quality Criteria for Semivolatile and Volatile Organics ..................................................2-33
Table 2-19. Ammonia Concentration in Traditional Type II MSD and AWT Effluent .............................................................................................................................2-34
Table 2-20. Calculated Ammonia NRWQC for Some Cruise Ship Ports of Call in the United States ...........................................................................................................2-34
Table 2-21. Hawaii Nutrient Criteria Values Which the Geometric Mean of Samples Is Not to Exceed .................................................................................................2-36

Table 3-1. Graywater Definitions ..........................................................................................3-1 Table 3-2. Common Sources and Characteristics of Graywater ...........................................3-2 Figure 3-1. Per Capita Graywater Generation as Reported in EPA's 2004 Cruise
Ship Survey .......................................................................................................................3-3 Figure 3-2. Graywater Generation by Persons Onboard as Reported in EPA's
2004 Cruise Ship Survey ..................................................................................................3-3 Table 3-3. Comparison of Untreated Graywater Concentrations to Untreated
Domestic Wastewater -- Pathogen Indicators ...................................................................3-7 Table 3-4. Comparison of Untreated Graywater Concentrations to Untreated
Domestic Wastewater -- Conventional Pollutants and Other Common Analytes ............3-9 Table 3-5. Untreated Graywater Concentrations -- Metals ...................................................3-12 Table 3-6. Untreated Graywater Concentrations -- Volatile and Semivolatile
Organics ............................................................................................................................3-16 Table 3-7. Comparison of Untreated Graywater Concentrations to Untreated
Domestic Wastewater -- Nutrients ....................................................................................3-18 Table 3-8. Comparison of Untreated Cruise Ship Graywater to Wastewater
Discharge Standards ..........................................................................................................3-19 Table 3-9. National Recommended Water Quality Criteria for Bacteria .............................3-21 Table 3-10. EPA and ACSI Untreated Cruise Ship Graywater Pathogen
Indicator Data.....................................................................................................................3-22 Table 3-11. Narrative National Recommended Water Quality Criteria for
Conventional Pollutants and Other Common Analytes ....................................................3-22 Table 3-12. Seasonal Coastal Water Temperatures in °C Across the United
States .................................................................................................................................3-24 Table 3-13. Comparison of Untreated Cruise Ship Graywater to Numeric
National Recommended Water Quality Criteria for Total Residual Chlorine ..................3-25 Table 3-14. Comparison of Untreated Cruise Ship Graywater to National
Recommended Water Quality Criteria for Metals ............................................................3-26 Table 3-15. Comparison of Untreated Cruise Ship Graywater to National
Recommended Water Quality Criteria for Semivolatile and Volatile Organics ...............3-27 Table 3-16. Ammonia Concentration in Untreated Graywater .............................................3-28 Table 3-17. Calculated Ammonia NRWQC for Some Cruise Ship Ports of
Call in the United States ...................................................................................................3-28
Table 4-1. Maximum Daily Volume of Bilge Water Production .........................................4-3 Table 4-2. Oily Water Separator Technologies ....................................................................4-9 Table 4-3. Description of Oil Types and the Interaction When Released into the Marine
Environment.......................................................................................................................4-12 Table 5-1. Some Types and Specific Examples/Descriptions of Solid Waste Generated
on Cruise Ships ..................................................................................................................5-2 Table 5-2. Estimates of Solid Waste Generated Per Vessel per Week .................................5-2

Table 5-3. Estimates of Solid Waste Generated per Person per Day on a Cruise Ship ...................................................................................................................................5-3
Table 5-4. Summary of Garbage Discharge Restrictions for Vessels ..................................5-5 Table 5-5. Waste Management Practices as Reported by Royal Caribbean Cruises ............5-9 Table 6-1. Types of Potentially Hazardous Waste Generated Aboard Cruise
Ships ..................................................................................................................................6-2 Table 6-2. Estimates of Hazardous Waste Generated Per Week Onboard Cruise
Ship Fleets..........................................................................................................................6-3 Table 6-3. Estimates of Hazardous Waste and Solid Waste Generated Onboard as
Reported by Carnival Cruise Lines....................................................................................6-4 Table 6-4. Classification System and Accumulation Limits for Hazardous
Waste Generators ..............................................................................................................6-7 Appendix A. List of Acronyms..............................................................................................7-1 Appendix B. State Efforts to Address Discharges from Cruise Ships...................................7-5

December 29, 2008
Section 1: Introduction
1.1 Overview Cruise ships operate in every ocean worldwide, often in pristine coastal waters and sensitive marine ecosystems. Cruise ship operators provide amenities to their passengers that are similar to those of luxury resort hotels, including pools, hair salons, restaurants, and dry cleaners. As a result, cruise ships have the potential to generate wastes similar in volume and character to those generated by hotels. The cruise industry is one of the world’s fastest growing tourism sectors, with the number of cruise ship passengers growing nearly twice as fast as any other travel sector over the last 10 years (CELB, 2003). In addition, average ship size has been increasing at the rate of roughly 90 feet every five years over the past two decades (Bell, 2007). Larger cruise ships can accommodate even more passengers, as well as the crew necessary to service the passengers and maintain the ships. According to Macleod (2007), the next generation of ships, the first of which will be ready in 2009, will carry more than 8000 passengers. As the cruise industry continues to expand, there is an increasing concern about the impacts cruise ships may have on the marine environment, including water quality and other marine resources. In March 2000, an environmental advocacy group called the Bluewater Network, representing 53 environmental organizations, submitted a petition to the U.S. Environmental Protection Agency (EPA) requesting that EPA identify and take regulatory action on measures to address pollution by cruise ships. Specifically, the petition requested an in-depth assessment of the volumes and characteristics of cruise ship waste streams; analysis of their potential impact on water quality, the marine environment, and human health; examination of existing federal regulations governing cruise ship waste streams; and formulation of recommendations on how to better control and regulate these waste streams. The petition also included specific requests related to sewage, graywater, oily bilge water, solid wastes, and hazardous wastes, as well as monitoring, record-keeping, and reporting. In addition, the petition requested that EPA prepare a report of the requested assessment. In August 2000, the Bluewater Network submitted an addendum to the petition regarding air pollution from cruise ships. EPA subsequently denied this portion of the petition as unnecessary, in light of the Agency’s pending Clean Air Act actions for marine diesel engines. This Cruise Ship Discharge Assessment Report (Assessment Report) concludes EPA’s response to the petition from Bluewater Network. This Assessment Report examines five primary cruise ship waste streams -- sewage, graywater, oily bilge water, solid waste, and hazardous waste. For each waste stream, the Assessment Report discusses (1) what the waste stream is and how much is generated; (2) what laws apply to the waste stream; (3) how the waste stream is managed; (4) potential environmental impacts of the waste stream; (5) on-going actions by the federal government to address the waste stream; and (6) a wide range of options and alternatives to address the waste stream from cruise ships in the future. Though this report includes discussion of some proprietary treatment technologies for the abatement of pollution from cruise ships, that
1-1

December 29, 2008
discussion in no way constitutes an endorsement by EPA of any non-federal entity, its products, or its services. The most significant new analysis provided in this Assessment Report relates to the generation and treatment of sewage and graywater onboard cruise ships. Pursuant to federal legislation entitled “Certain Alaskan Cruise Ship Operations” (33 U.S.C. 1901 Note), EPA has carried out a multi-year project to determine whether revised or additional standards for sewage and graywater discharges from large cruise ships operating in Alaska are warranted under that legislation. Much of the information and data collected for the Alaska effort are summarized in this Assessment Report. There are a number of other waste streams that may be generated onboard cruise ships, some of which may be considered incidental to the normal operation of a vessel (e.g., ballast water, deck runoff, hull coat leachate). This Assessment Report does not present an assessment of any of these other waste streams. However, as part of a separate effort, on December 19, 2008, EPA finalized a Vessel General Permit (VGP) under section 402 of the Clean Water Act (CWA) for discharges incidental to the normal operation of a vessel. On July 31, 2008, the President signed legislation (Pub. L. 110-299) that, except for ballast water, exempts commercial fishing vessels (of any length) and other commercial vessels shorter than 79 feet from CWA permitting for such discharges for a period of two years (during which time EPA has been directed to conduct further study and analysis). Under a court decision, effective December 19, 2008, absent a statutory exclusion such as provided by Pub. L. 110-299, discharges incidental to the normal operation of commercial vessels will no longer be excluded from CWA permitting requirements. Thus, the VGP will include discharges incidental to the normal operation of cruise ships 79 feet or more in length, and such discharges will become subject to CWA permitting requirements as of December 19, 2008. 1.2 Other EPA Cruise Ship Efforts In addition to developing this Assessment Report, EPA has engaged in a number of activities addressing the potential environmental impacts of cruise ships. These efforts are summarized below. Cruise Ship White Paper, August 2000 This White Paper provided preliminary information regarding cruise ship discharges and waste management practices in response to the petition submitted by the Bluewater Network on March 17, 2000. The White Paper can be accessed at: www.epa.gov/owow/oceans/cruise_ships/white_paper.pdf. Cruise Ship Public Hearings, September 2000 As part of its effort to gather information on cruise ship discharges and waste management practices, EPA, together with the Coast Guard and other federal agencies, solicited public input from industry officials, government agencies, environmental groups, and concerned citizens through three regional public information hearings in Los Angeles, CA (September 6, 2000);
1-2
December 29, 2008
Juneau, AK (September 8, 2000); and Miami, FL (September 12, 2000). Summaries and transcripts of these public hearings can be accessed at: www.epa.gov/owow/oceans/cruise_ships/publichearings.html. Cruise Ship Plume Tracking Survey, Summer 2001 EPA conducted a survey to study the dilution of discharges from cruise ships in June 2001. This survey tracked plumes of water containing Rhodamine WT dye released through normal wastewater effluent discharge systems in ships operating off the Florida coast to provide information on dilution of cruise ship discharges in offshore waters. This survey also provided preliminary information on whether cruise ship treated sewage or graywater discharge plumes behave as predicted by a model developed for Alaska waters. The Cruise Ship Plume Tracking Survey Report can be accessed at: www.epa.gov/owow/oceans/cruise_ships/plumerpt2002/plumereport.pdf. The Cruise Ship Plume Tracking Survey Plan can be accessed at: www.epa.gov/owow/oceans/cruise_ships/surveyplan.pdf. Cruise Ship Hazardous Waste Tracking System, December 2001 On December 4, 2001, EPA Headquarters requested that the Agency’s Regions assign a single tracking number for each cruise ship entering waters of multiple states for purposes of the Resource Conservation and Recovery Act (RCRA). RCRA imposes management requirements on generators, transporters, and other handlers of hazardous waste. Cruise ships regularly use chemicals for operations ranging from routine maintenance to passenger services, such as dry cleaning, beauty parlors, and photography labs. Thus, cruise ships are potentially subject to RCRA requirements to the extent those chemicals result in the generation of hazardous wastes. Under RCRA, each state assigns a hazardous waste tracking number to each cruise ship that enters its waters. However, assignment of tracking numbers by multiple states can result in a single ship having several different tracking numbers for the same waste. Assigning a single tracking number for each cruise ship entering waters of multiple states for purposes of RCRA should result in improved tracking of hazardous wastes generated on cruise ships, increased compliance with RCRA requirements, as well as reduce paperwork for the cruise ships. The EPA memorandum of December 4, 2001, can be accessed at: www.epa.gov/owow/oceans/cruise_ships/haz_tracking.html. Evaluation of Standards for Sewage and Graywater Discharges from Cruise Ships in Alaska On December 12, 2000, Congress passed HR 4577, “Departments of Labor, Health and Human Services, and Education, and Related Agencies Appropriations Act, 2001,” which contained Title XIV, a section called “Certain Alaskan Cruise Ship Operations” (33 U.S.C. 1901 Note) (Title XIV). Title XIV established enforceable discharge standards for sewage and graywater from large cruise ships (those authorized to carry 500 or more passengers for hire) while operating in the Alexander Archipelago and the navigable waters of the United States in the State of Alaska and within the Kachemak Bay National Estuarine Research Reserve. This law authorizes EPA to develop revised and/or additional standards for these discharges in Alaska. Pursuant to Title XIV, EPA has carried out a multi-year project to determine whether revised and/or additional standards for sewage and graywater discharges from large cruise ships operating in Alaska are warranted under that law. EPA sampled wastewater from four cruise
1-3

December 29, 2008
ships that operated in Alaska during the summers of 2004 and 2005. The purpose of this sampling was to characterize graywater and sewage generated onboard and to evaluate the performance of various advanced sewage and graywater treatment systems. EPA also distributed a “Survey Questionnaire to Determine the Effectiveness, Costs, and Impacts of Sewage and Graywater Treatment Devices for Large Cruise Ships Operating in Alaska” to all cruise ships authorized to carry 500 or more passengers for hire that operated in Alaska in 2004. The information collected by the survey includes general vessel information; sources of graywater and sewage; ship-board plumbing systems; data on the effectiveness of sewage and graywater treatment systems in removing pollutants; and costs of these systems. Using these sampling results, survey responses, and other relevant information, EPA is performing environmental, economic, and engineering analyses to determine whether revised or additional standards in Alaska are warranted under Title XIV. EPA anticipates announcing its determination and making its analyses publicly available in 2009. Much of the information and data collected for EPA’s effort under Title XIV are summarized in this Assessment Report. Additionally, as part of this effort, EPA in conjunction with the Alaska Department of Environmental Conservation, conducted a scientific survey in July 2008 using EPA’s Ocean Survey Vessel Bold to (1) measure the dilution of Advanced Wastewater Treatment (AWT) discharges from stationary cruise ships, and (2) evaluate the potential environmental impact of nutrients in AWT discharges. EPA anticipates making the results of these studies publicly available in 2009. More information, including EPA’s 2004 and 2005 Alaska cruise ship sampling results, EPA’s Generic Sampling and Analysis Plan, and EPA’s cruise ship survey questionnaire, can be accessed at: www.epa.gov/owow/oceans/cruise_ships/sewage_gray.html. 1.3 Applicable International Conventions and Related U.S. Laws and Regulations Because of the international nature of maritime commerce, many of the customs, practices, rules, and regulations associated with vessel operations including manning, construction, design, equipment, safety, and pollution prevention are developed through uniform international agreements and conventions. A majority of cruise ships operating in United States waters are flagged in foreign nations, and application of domestic laws proceeds from an international agreement to which the United States is a party. In 1948, the United Nations established the predecessor to the International Maritime Organization, which entered into full force in 1958, to promote cooperation among governments and the shipping industry, to improve maritime safety, and to prevent marine pollution. One of the major international agreements relevant to cruise ship pollution is the International Convention for the Prevention of Pollution from Ships, as modified by the Protocol of 1978, also known as MARPOL 73/78, or simply MARPOL. Six Annexes of the Convention cover various sources of pollution from ships and provide a framework for international objectives. However, these Annexes are only in force when ratified and implemented by the flag state. The vast majority of cruise lines operating in United States ports are foreign flag vessels. Cruise ships flagged under countries that are signatories to MARPOL are subject to its requirements, regardless of where they sail, and member nations are responsible for vessels registered under their respective nationalities.
1-4

December 29, 2008
The Act to Prevent Pollution from Ships (APPS; 33 U.S.C. § 1901 et seq.) is the federal law implementing those provisions of MARPOL that have been ratified by the United States. APPS applies to all U.S. flagged ships anywhere in the world, and to all foreign flagged vessels while operating in the navigable waters of the United States or while at a port or terminal under the jurisdiction of the United States. Additionally, MARPOL Annex V requirements are applicable in the exclusive economic zone. The Coast Guard generally has the primary responsibility to prescribe and enforce the regulations necessary to implement APPS in the United States. This report provides detail regarding relevant MARPOL provisions in subsequent chapters; MARPOL includes annexes addressing, among other things, oil pollution, sewage, and garbage. MARPOL is implemented domestically through APPS (33 U.SC. 1901 et seq.), and the regulations found at 33 CFR Subchapter O -- Pollution. Additionally, the International Convention for the Safety of Life at Sea (SOLAS), which addresses maritime safety with a wide range of measures to improve vessel safety including design, construction, and equipment standards, includes provisions for a vessel to have a pollution prevention policy as part of its Safety Management System (SMS). A vessel operating internationally under the flag of a country that is a party to SOLAS must develop and maintain onboard an SMS. SMS documents are developed consistent with the International Safety Management (ISM) Code. The functional requirements of the SMS include, among other things, procedures for internal audits on the operation of the SMS, as well as procedures and processes for management review of company internal audit reports and correction of non-conformities that are reported by these or other reports (33 CFR 96.240(f) and (g)). The SMS also documents the responsible person’s safety and pollution prevention policy (33 CFR 96.220(a)(1)). Domestically, large passenger vessels that operate internationally are required to develop and retain such SMS documents onboard (46 U.S.C. §§ 3203-05 and 33 CFR Part 96). If the vessel does not have a Safety Management Certificate or copy of the Document of Compliance (DOC), the vessel is subject to detention, civil penalty, and if trying to enter the port, denial of port entry (33 CFR 96.380(b) and (c) and 96.390). In addition, the Coast Guard can board a vessel to ensure that crew and personnel are following the procedures of the SMS while a vessel is operating in U.S. waters (33 CFR 96.380(a)(2)). If a vessel’s crew or shore-based personnel do not follow the SMS plan, a vessel may be detained in port or, in some cases, denied entry (46 U.S.C. § 3205(d); 33 CFR 96.380-.390). Substantial non-compliance of a ship’s SMS to the requirements of the ISM Code is indicative of a major non-conformity (ISM Code 1.1.10). By definition, a major non-conformity is a deviation from SMS requirements that poses a serious threat to personnel or ship safety, or a serious risk to the environment; it requires immediate corrective action. For U.S. vessels, the SMS and DOC certificates are subject to revocation for non-compliance (33 U.S.C. § 3205(c)). Though failure to maintain SMS documents onboard a vessel is subject to a civil penalty, United States Code does not provide for administrative, civil, or criminal penalties, or injunctive remedies, for failure to follow the SMS plan. Several cruise ships with robust environmental standards as part of their SMS have been criminally prosecuted for deliberate substantive MARPOL and CWA violations, as well as for negligent violations.
1-5

December 29, 2008
Each flag state is responsible for ensuring that vessels operating under its flag are in compliance with their SMS. Often, flag states establish criteria and procedures for third party organizations to act on their behalf to perform safety management audits and certification functions that otherwise would be conducted by the flag state (as mentioned above, the Coast Guard has done this for U.S. flagged ships; see 33 CFR 96.400(a)). Cruise lines sometimes rely on third party verification companies (also known as classification societies) such as Det Norske Veritas, Lloyds Register, and the American Bureau of Shipping to certify that SMS documents conform with applicable requirements. If a foreign vessel (most cruise ships) has a major non-conformity under the ISM Code, the vessel is subject to detention and denial of port entry (33 CFR 96.380). 1.4 Federal Environmental Enforcement History Regarding Cruise Ships As part of a wide-ranging vessel pollution initiative begun in 1993, the U.S. Department of Justice, in conjunction with the Coast Guard and Environmental Protection Agency’s Criminal Investigation Division, has worked on a vessel pollution enforcement initiative designed to detect, investigate, and prosecute illegal vessel discharges of oily wastes, plastics, and other wastes that are in violation of U.S. environmental laws, including those implementing international treaties, as well as related criminal violations. Relevant federal environmental statutes include CWA, APPS, RCRA, the Ports and Waterways Safety Act, and recent legislation addressing Certain Alaskan Cruise Ship Operations, several of which are discussed further in this Assessment Report. The federal enforcement effort has resulted in numerous criminal convictions of every segment of the maritime industry, including the cruise ship industry, for knowing violations of these environmental statutes. All large cruise ships calling on U.S. ports are subject to the requirements of MARPOL and APPS, and are required to have an SMS addressing pollution prevention. However, the lack of enforcement of these requirements by individual cruise ships has resulted in criminal violations of the law. Convictions for environmental pollution by cruise lines were obtained in 1995, 1998, 1999, 2000, 2001, 2002, 2004, and most recently in 2006. The United States has obtained convictions for deliberate environmental crimes, false statements, and obstruction of justice by the largest cruise lines operating the largest cruise ships, as well as some smaller cruise lines operating smaller vessels. The most common violations consist of the knowing and willful making of materially false statements in a ship’s Oil Record Books (a log in which all overboard discharges are required to be recorded) in order to conceal intentional discharges made in violation of MARPOL (see subsection 4.2.1). The cruise ship prosecutions have involved as much as hundreds of thousands of gallons of oil-contaminated waste per ship per year, and in some cases have involved violations of multiple ships in a fleet. Other convictions have involved the deliberate discharge of pollutants without a permit within the navigable waters of the United States, including specifically, waste oil, plastics, sewage, and hazardous chemicals such as dry cleaning solvents, printing solvents, and photochemicals discharged through graywater systems in violation of CWA. In most cases, environmental violations, including cruise ships with falsified logs and use of equipment and procedures to bypass treatment systems, were not previously discovered during
1-6

December 29, 2008
prior, numerous inspections by port states, the vessel’s flag state, or classification society. These prosecutions are widely credited with helping to raise awareness within the cruise ship industry of the importance of environmental compliance, and have led to the installation of new equipment on many ships. Convicted companies were placed on probation and required to develop and implement enhanced environmental compliance measures, including additional outside audits. 1.5 Cruise Lines International Association’s Commitment to Reduce Potential
Environmental Impacts The Cruise Lines International Association (CLIA) is a trade association formed in 1975 to promote the benefits of cruising. According to CLIA, it is now the world's largest cruise association, comprising 24 major cruise lines serving North America and representing 97% of the cruise capacity marketed from North America. CLIA reports that member companies have agreed to adopt voluntary CLIA environmental standards for their cruise ships. According to CLIA, these environmental standards exceed the requirements of U.S. and international laws (CLIA, 2003). CLIA reports that the standards address, among others, the following waste streams: graywater and blackwater (sewage) discharges; bilge and oily water residues; incinerator ash; hazardous chemical waste such as photo processing fluid and dry-cleaning chemicals; unused and outdated pharmaceuticals; used batteries; burned out fluorescent and mercury vapor lamps; and glass, cardboard, and aluminum and steel cans. The CLIA standards entitled, “Cruise Industry Waste Management Practices and Procedures,” include an attachment reflecting a 2006 revision (CLIA, 2006). Implementation of the CLIA membership commitment to address these waste streams is intended to occur via incorporation of the CLIA environmental protection policies into responsible persons’ SMS documents. CLIA has acknowledged violations of environmental laws by cruise lines, and believes that these violations have served as an important warning for the industry. As a result of the violations and associated penalties, CLIA member lines have strengthened their environmental policies and procedures. CLIA reports, for example, that its members have committed to the following principles: Designing, constructing, and operating vessels to minimize their impact on the
environment; Developing improved technologies to exceed current requirements for protection of the
environment; Implementing a policy goal of zero discharge of MARPOL Annex V solid waste products
(garbage) by use of more comprehensive waste minimization procedures to significantly reduce shipboard-generated waste;
Expanding waste reduction strategies to include reuse and recycling to the maximum extent possible, to deposit smaller quantities of waste products ashore;
Improving processes and procedures for collection and transfer of hazardous waste; and Strengthening comprehensive programs for monitoring and auditing of onboard
environmental practices and procedures, in accordance with the ISM Code for the Safe Operation of Ships and for Pollution Prevention.
1-7

December 29, 2008
The CLIA environmental standards are designed to increase compliance with regulatory regimes, and in some cases incorporate voluntary standards and procedures that go beyond what is required by law or regulation. CLIA does not describe the manner in which the voluntary standards are to be implemented into a company’s SMS, or impose consequences for failing to incorporate the standards into a member line vessel’s SMS, or comply with the standards once incorporated. Further, the standards do not provide for a CLIA-sponsored inspection or verification mechanism. All cruise ships that were criminally convicted had incorporated environmental standards into their SMS. Although CLIA standards are discussed in the subsequent sections of this report, EPA does not have an independent basis to determine the nature and extent of compliance by CLIA member lines, which is not required by state or federal law. Nevertheless, EPA appreciates efforts by the cruise ship industry and regulated community to improve the environmental compliance by CLIA member lines, and hopes that the waste management measures undertaken by the cruise line industry will benefit the environment and will set an example for cruise ship operators that are not members of CLIA. 1.6 Possible Options and Alternatives to Generally Address Cruise Ship Discharges Based on the public comments received on the draft of this report as well as other information gathered, listed below are a wide range of options and alternatives that address cruise ship waste streams generally, rather than any particular waste stream (i.e., sewage, gray water, oily bilge water, solid waste, or hazardous waste) specifically. Identification of any particular option does not imply any EPA recommendation or preference for future action, or that EPA has determined that any of these options are necessary or feasible, or that EPA believes a change to the status quo is warranted, or that EPA or any other entity has the legal authority to implement that option. Research
Establish a detailed nationwide sampling, testing, and monitoring program to gather data on the volume of discharges, concentration of pollutants or effluent, and locations of most frequent discharges in terms of volume and/or toxicity.
Conduct a programmatic environmental review of the cruise industry under the National Environmental Policy Act to assess the full breadth of environmental and cumulative impacts from cruise ships on the marine environment and human health.
Increase studies on the detriment to human health and the effect on the nation’s coastal zones and marine protected areas, including analysis of cumulative impacts, from cruise ships.
Continue research and development on promising treatment technologies for the management of cruise ship waste steams.
Engage the cruise ship industry to conduct more research directed at cruise ship discharges.
Direct research to geographic areas that may be impacted by cruise ship discharges. Require additional analyses to further understand ship discharge impacts on the beach-
going public. Direct future assessments of cruise ship discharges to the potential cumulative impacts
from multiple cruise ships, the impacts of discharges from stationary cruise ships, and the
1-8

December 29, 2008
impacts of discharges on enclosed and low-flushing environments, such as bays and harbors.
Design cruise ships to be “environmentally friendly.” Enforcement and Compliance
Improve monitoring and inspections. Strengthen established enforcement mechanisms. Reward passengers who aid in the detection of illegal activities by alerting authorities. Provide instruction regarding duties, responsibilities, and operation of the various
equipment and waste management systems to those directly responsible for processing wastes. Actions to train employees and increase passenger awareness should include:
o announcements over the public address system and notices in ship newsletters that caution against throwing any waste overboard;
o signage and posters placed in crew and passenger areas that encourage environmental awareness and protection;
o placing safety and environmental information booklets in crew cabins and crew lounges; and
o regular meetings of ship safety and environmental committees consisting of officers and crew from all departments to review methods of improving performance, including better and more effective environmental practices.
Charge a passenger fee to put a marine engineer onboard cruise ships, especially when sailing in pristine waters, to observe ship waste treatment practices, verify logbook entries, examines discharges, and ensure that the ships are maintaining their waste water treatment systems.
Allow for state personnel to inspect cruise ship pollution control equipment, in addition to Coast Guard inspections.
Encourage a uniform national approach for environmental regulations pertaining to cruise ship discharges to reduce conflicting regulations as cruise ships travel from port to port.
Encourage discussions with the Coast Guard and industry to ensure that proposals for new regulations are operationally feasible and will not compromise vessel safety.
Require cruise ships to immediately report discharges (both intentional and accidental) of wastes into state waters or into waters immediately adjacent to state waters.
Industry Standards Development for Cruise Lines
Work with CLIA and/or other cruise ship trade associations or individual cruise lines to further develop waste management practices and procedures to be incorporated into Safety Management System plans. Enhanced practice and procedures could include:
o establishing discharge standards stricter than presently required; o setting voluntary standards where none exist now; and o regular sharing of information with the public on environmental performance.
Encourage cruise line trade associations to develop verification mechanisms that assure industry standards, practices, and procedures for pollution abatement are implemented faithfully, as well as specify and enforce adverse consequences for inadequate implementation of those standards.
Offer public recognition to cruise ships that implement environmentally-friendly practices beyond what is currently required. The voluntary program could include:
1-9

December 29, 2008
o discharge standards stricter than required (for sewage, gray water, oily bilge water, and others);
o setting voluntary standards where none exist now; o requirements for the use of low-sulfur fuel and emission control technologies; o an agreement to prohibit the discharge of any solid waste to the marine
environment; o collection and sharing of data on characteristics and volumes of discharges and
environmental impacts; o independent third-party verification of implementation of waste management
practices; and o a Code of Conduct or incentives program to encourage pollution prevention
conduct. Other
Encourage verifiable “beyond compliance” agreements between states and individual cruise lines pertaining to cruise ship discharges into state waters.
Encourage verifiable “beyond compliance” agreements between individual port authorities and individual cruise lines pertaining to cruise ship discharges into waters near ports.
Facilitate cooperative efforts to increase the availability of port reception facilities for all waste types.
Establish an interagency Cruise Ship Pollution Prevention and Enforcement Program: o assign a lead agency to implement the program, including on-board inspections; o work within existing regulatory and enforcement programs through cross-media
coordination; and o assess a regulatory fee to fund the program.
Charter and convene a cruise ship Federal Advisory Committee Act committee (perhaps consisting of EPA, Coast Guard, industry, public interest groups, states, and other appropriate shareholders) to develop improved environmental performance by cruise ships.
1-10

December 29, 2008
1-11
References Bell, Tom. 2007 (September 28). Experts: Mega-berth needed for cruise ships. Portland Press
Herald. (www.pressherald.mainetoday.com/story_pf.php?id=137059&ac=PHnws) Center for Environmental Leadership in Business (CELB). 2003. A Shifting Tide: Environmental
Challenges and Cruise Industry Responses. Washington, DC. (www.celb.org/ImageCache/CELB/content/travel_2dleisure/cruise_5finterim_5fsummary_2epdf/v1/cruise_5finterim_5fsummary.pdf)
Cruise Lines International Association (CLIA). 2003. ICCL Media Statement on Pending
California Legislation. ICCL News Release Archives. Arlington, Virginia. (http://www.cruising.org/press/press-kits/news/CLIA-ICCL_archivesArticle.cfm?type=a&pressID=14)
Cruise Lines International Association (CLIA). 2006. CLIA Industry Standard: Cruise Industry
Waste Management Practices and Procedures. Fort Lauderdale, FL. (www.cruising.org/industry/PDF/CLIAWasteManagementAttachment.pdf and www.cruising.org/industry/PDF/CLIAWasteManagement.pdf)
Macleod, Andrew. 2007. Cruise on down to our dumping ground.
(http://www.straight.com/article-86446/cruise-on-down-to-our-dumping-ground)

December 29, 2008
Section 2: Sewage Sewage from vessels, also known as “black water,” generally means human body wastes and the wastes from toilets and other receptacles intended to receive or retain body wastes. On most cruise ships, sewage is treated using a marine sanitation device that biologically treats and disinfects the waste prior to discharge. Some cruise ships, especially many of those traveling to Alaska, have installed Advanced Wastewater Treatment systems (AWTs) to treat sewage and often graywater. These AWTs provide higher levels of biological treatment, solids removal, and disinfection as compared to traditional marine sanitation devices. This section discusses the current state of information about vessel sewage, the laws regulating sewage discharges from vessels, the types of equipment used to treat sewage generated on cruise ships and how well they remove various pollutants, the potential environmental impacts of cruise ship sewage discharges, and federal actions taken to address sewage from cruise ships. The conclusion of this section lists a wide range of options and alternatives that could be considered when addressing sewage from cruise ships. 2.1 What is sewage from vessels and how much is generated on cruise ships? Sewage from vessels, also known as “black water,” generally means human body wastes and the wastes from toilets and other receptacles intended to receive or retain body wastes. On some ships, medical sink and medical floor drain wastewater is commingled with sewage for treatment. Cruise ship sewage systems generally use fresh water to reduce corrosion, and vacuum flushing and conveyance to reduce water use. According to responses to EPA’s survey of 29 cruise ships operating in Alaska in 2004, the average amount of water needed per toilet flush is 0.3 gallons. Only one of the ships surveyed uses seawater in their sewage system; this gravity system uses 1 gallon of seawater per toilet flush. For comparison, the latest water-saving, high-efficiency domestic toilets for land-based use typically use about 1.3 gallons per flush. Estimated sewage generation rates reported in response to EPA’s 2004 survey ranged from 1,000 to 74,000 gallons/day/vessel or 1.1 to 27 gallons/day/person. Sewage generation rates generally are not measured, and EPA is not able to independently confirm the accuracy of these estimated rates. It is not clear why reported rates would vary to this degree. Average reported sewage generation rates were 21,000 gallons/day/vessel and 8.4 gallons/day/person (see Figure 2-1). There appears to be no relationship between per capita sewage generation rates and number of persons onboard (see Figure 2-2).
2-1

December 29, 2008
0
2
4
6
8
10
12
<5 5-10 10-15 15-20 20-25 25-30
Per Capita Sewage Generation (gal/day/pers)
8.6 ± 1.1 gal/day/pers (mean ± SE)n = 29
0
5
10
15
20
25
30
0 1,000 2,000 3,000 4,000 5,000
Persons Onboard (passengers + crew)
Figure 2-1. Per Capita Sewage Generation
as Reported in EPA’s 2004 Cruise Ship Survey
Figure 2-2. Sewage Generation by Persons Onboard as Reported in EPA’s 2004
Cruise Ship Survey During EPA’s 2004 sampling of four ships with AWTs, sewage generation was measured on one ship at 17 gallons/day/person (EPA, 2006a). On other ships, measurements were made of sewage plus graywater sources treated by the AWT (see Section 3 for more information on graywater). Treated sewage discharge rates are nearly equivalent to sewage generation rates. Differences between these two rates are attributed to the volume of biomass, if any, that is removed during wastewater treatment (see subsection 2.3.3 below). Cruise ship capacity to hold untreated (or treated) sewage varies significantly. According to responses to EPA’s 2004 cruise ship survey, sewage holding capacity ranges from 0.5 to 170 hours, with an average holding capacity of 62 hours. 2.2 What federal laws apply to sewage from cruise ships? 2.2.1 Clean Water Act Section 312 Section 312 of the Clean Water Act (CWA; 33 U.S.C. § 1322) requires that vessels with installed toilet facilities be equipped with an operable marine sanitation device (MSD), certified by the Coast Guard to meet EPA performance standards, in order to operate on the navigable waters of the United States (which extend seaward 3 nautical miles from shore for the purpose of this statute). CWA section 312 also establishes procedures for the designation of no-discharge zones (NDZs) for vessel sewage. Section 312 of the CWA is implemented jointly by EPA and the Coast Guard. EPA is responsible for developing performance standards for MSDs and working with states to establish NDZs. EPA established performance standards for MSDs in the mid 1970s; EPA and states continue to establish NDZs on an on-going basis. The Coast Guard is
2-2
December 29, 2008
responsible for certification of MSDs prior to sale, introduction or delivery into interstate commerce, or import into the United States for sale or resale. States may not adopt or enforce any statute or regulation of the state or a political subdivision with respect to the design, manufacture, installation or use of MSDs (except on houseboats), but may establish sewage NDZs in conjunction with EPA under certain circumstances (see below). The Coast Guard and states are vested with authority to enforce the requirements of CWA section 312. Persons who tamper with certified MSDs or sell non-certified MSDs, or who operate vessels required to have MSDs but do not, are subject to statutory civil penalties of up to $5,000 and $2,000, respectively, for each violation. While CWA section 312 provides for such civil penalties, it does not provide for either administrative or criminal enforcement. Marine Sanitation Devices The term “marine sanitation device” (MSD) means equipment for installation onboard a vessel which is designed to receive, retain, treat, or discharge sewage, and any process to treat such sewage. CWA section 312(a)(6) defines sewage as human body waste and the wastes from toilets and other receptacles intended to receive or retain body waste. There are three types of MSDs recognized by the Coast Guard:
Type I MSDs are flow-through treatment devices that commonly use maceration and disinfection for treatment of the sewage. Type I devices may be used only on vessels less than or equal to 65 feet in length. EPA’s performance standard for Type I MSDs is an effluent with a fecal coliform count not to exceed 1000 per 100 milliliters of water, with no visible floating solids.
Type II MSDs also are flow-through treatment devices, generally employing biological treatment and disinfection. Some Type II MSDs use maceration and disinfection. Type II MSDs may be used on vessels of any size. EPA’s performance standard for Type II MSDs is an effluent with a fecal coliform count not to exceed 200 per 100 milliliters of water and total suspended solids no greater than 150 milligrams per liter of water.
Type III MSDs are holding tanks, where sewage is stored until it can be properly disposed of at a shore-side pumpout facility or out at sea (beyond three miles from shore). Type III MSDs also may be used on vessels of any size. EPA is not aware of any cruise vessels that use Type III MSDs exclusively. However, a Type II MSD may be equipped with installed holding tanks which can be used to store treated sewage until reaching a pumpout facility or discharged overboard when the vessel is beyond three nautical miles from land.
The Coast Guard is responsible for certification of MSDs based on EPA’s performance standards (listed above). The Coast Guard can certify a product line of MSDs for vessel installation and use if that product line complies with Coast Guard design and testing criteria (33 CFR Part 159), as confirmed by testing conducted at a qualified independent laboratory. After Coast Guard review and approval, each MSD model is designated an approval number (“certification”), typically valid for five years. MSDs manufactured before the certification expiration date are deemed to have met Coast Guard standards and may be installed on vessels; MSDs manufactured after the expiration date do not meet Coast Guard approval. Under Coast Guard policy, foreign-flagged vessels may use MSDs that have received a compliance test certificate under Annex IV of MARPOL (discussed below). During routine inspections, Coast Guard inspectors examine the MSD to ensure its operation and condition meet all requirements of 33 CFR Part 159. The
2-3

December 29, 2008
Coast Guard inspector verifies that the MSD is in good and serviceable condition – that the MSD is properly approved, installed, and performing as intended. If the Coast Guard inspector suspects or finds clear grounds that the MSD is not in good and serviceable condition, the inspector may require that the vessel owner have the MSD effluent tested by a qualified wastewater laboratory, with results reported to the Coast Guard. No-Discharge Zones CWA section 312(f) authorizes the establishment of no-discharge zones (NDZs), areas in which discharges from vessels of any sewage, whether treated or not, are prohibited. States may establish an NDZ for some or all of their waters if EPA determines that adequate facilities for the safe and sanitary removal and treatment of the sewage are reasonably available. States also may request that EPA establish NDZs by rulemaking (1) if EPA determines that the protection and enhancement of the quality of the waters require such a prohibition, or (2) to prohibit the discharge of vessel sewage into a drinking water intake zone. There are currently 67 NDZs in the United States covering 115 waterbodies; 64 of these NDZs were established by states. 2.2.2 The International Convention for the Prevention of Pollution from Ships The principal international convention addressing discharge standards for vessel sewage is Annex IV to the International Convention for the Prevention of Pollution from Ships (known as MARPOL 73/78, or simply MARPOL). Although Annex IV was adopted in 1973, it did not come into effect until September 2003, after ratification by the requisite number of states (and corresponding shipping fleet tonnage). Subsequent amendments entered into force on August 1, 2005. Annex IV applies to countries that are a party to the Annex, and all vessels operating under their flags. MARPOL Annex IV contains regulations regarding the discharge of sewage into the sea, ships' equipment and systems for the control of sewage discharge, a provision for facilities at ports and terminals for the reception of sewage, and requirements for survey and certification. Annex IV defines sewage as drainage and other wastes from any form of toilets and urinals; drainage from medical premises (dispensary, sick bay, etc.) via wash basins, wash tubs and scuppers located in such premises; drainage from spaces containing living animals; or other waste waters when mixed with the drainages defined above. MARPOL Annex IV generally requires ships to be equipped with either a sewage treatment plant, a sewage comminuting and disinfecting system, or a sewage holding tank. More specifically, the discharge of sewage into the sea is prohibited except when the ship has in operation an approved sewage treatment plant or is discharging comminuted and disinfected sewage using an approved system at a distance of more than three nautical miles (nm) from the nearest land; or is discharging sewage which is not comminuted or disinfected at a distance of more than 12 nm from the nearest land. There is a standard for the maximum rate of discharge of untreated sewage from holding tanks when at a distance equal or greater than 12 nm from the nearest land. Annex IV also establishes certain sewage reception facility standards and responsibilities for ports. Vessels that comply with Annex IV are issued an International Sewage Pollution Prevention Certificate (ISPPC).
2-4

December 29, 2008
The United States is not a party to MARPOL Annex IV. Under existing Coast Guard policy, vessels registered in the United States that engage in international voyages with installed and operational Coast Guard certified Type II MSDs are deemed equivalent to MARPOL Annex IV using effluent standards in MEPC.2(VI) and thus eligible to receive a Coast Guard certificate of equivalency. This certificate takes the place of the ISPPC and is issued to only U.S. vessels. Similarly, under a separate Coast Guard policy, any vessel flagged or registered outside the United States that holds a valid endorsed Certificate of Type Test issued by their flag administration in accordance with MARPOL Annex IV indicating the installed sewage treatment plant complies with Annex IV as amended by resolution MEPC.2(VI) will be accepted by the Coast Guard as being in compliance with U.S. regulations in 33 CFR Part 159 while operating in waters subject to the jurisdiction of the United States. Both Coast Guard policies are currently in the process of being updated to reflect the recent changes to MARPOL Annex IV. In any case, the Coast Guard is responsible for verifying that a vessel is in substantial compliance with the conventions, a determination made if the sewage system is in good and serviceable condition. 2.2.3 Certain Alaskan Cruise Ship Operations On December 12, 2000, Congress enacted an omnibus appropriation that included new statutory requirements for certain cruise ship discharges occurring in Alaska (Departments of Labor, Health and Human Services, and Education, and Related Agencies Appropriations Act, 2001, Pub. L. No. 106-554, 114 Stat. 2763, enacting into law Title XIV of Division B of H.R. 5666, 114 Stat. 2763A-315, and codified at 33 U.S.C. § 1901 Note). Title XIV set discharge standards for sewage and graywater from certain cruise ships (those authorized to carry 500 or more passengers for hire) while operating in the Alexander Archipelago and the navigable waters of the United States in the State of Alaska and within the Kachemak Bay National Estuarine Research Reserve (referred to here as “Alaskan waters”). This federal law, referred to here as “Title XIV,” also authorized EPA to develop revised or additional standards for discharges of sewage and graywater from cruise ships operating in Alaskan waters, if appropriate. In developing revised or additional standards, EPA must take into account the best available scientific information on the environmental effects of the regulated discharges and the availability of new technologies for wastewater treatment, and ensure that the standards are, at a minimum, consistent with all relevant State of Alaska water quality standards. Before this law was passed, there was considerable concern about cruise ships discharging untreated sewage and graywater into areas within the Alexander Archipelago (a chain of islands in Southeast Alaska), but beyond three miles from any shore. In these areas, known as doughnut holes, the discharge of sewage was unregulated. Title XIV prohibited discharges of untreated sewage from cruise vessels and set requirements for discharges of treated sewage and graywater from cruise vessels into Alaskan waters, including the doughnut holes. Specifically, Title XIV requires that discharges within one nautical mile of shore or discharges in any Alaskan waters when the ship is traveling under six knots meet stringent standards for fecal coliform (geometric mean of samples taken during any 30-day period does not exceed 20 fecal coliform/100 ml and not more than 10% of the samples exceed 40 fecal coliforms/100 ml) and chlorine (total chlorine residual does not exceed 10.0 micrograms/liter), and meet secondary treatment standards for biochemical oxygen demand, suspended solids, and pH (found at 40 CFR
2-5

December 29, 2008
133.102). Title XIV requires that discharges of treated sewage outside of one nautical mile from shore from vessels traveling at least six knots meet EPA’s CWA section 312 performance standards for Type II MSDs (no more than 200 fecal coliforms per 100 ml and no more than 150 milligrams total suspended solids per liter). Title XIV requires the Coast Guard to incorporate an inspection regime into the commercial vessel examination program sufficient to verify compliance with the Act, authorizes the Coast Guard to conduct unannounced inspections and to require logbooks of all sewage and graywater discharges, and provides EPA and the Coast Guard with authority to gather information to verify compliance with the Act. Title XIV provides a range of enforcement response authorities, including administrative orders, civil and criminal penalties, injunctive relief, and in rem liability. Title XIV also authorizes Alaska to petition EPA to establish NDZs for sewage and graywater from cruise ships. Pursuant to Title XIV, EPA has carried out a multi-year project to determine whether revised or additional standards for sewage and graywater discharges from large cruise ships operating in Alaska are warranted under that legislation. EPA sampled wastewater from four cruise ships that operated in Alaska during the summer of 2004. The purpose of this sampling was to characterize graywater and sewage generated onboard and to evaluate the performance of various advanced sewage and graywater treatment systems. EPA also distributed a “Survey Questionnaire to Determine the Effectiveness, Costs, and Impacts of Sewage and Graywater Treatment Devices for Large Cruise Ships Operating in Alaska” to all cruise ships authorized to carry 500 or more passengers for hire that operated to Alaska in 2004. Using these sampling results, survey responses, and other relevant information, EPA is performing environmental, economic, and engineering analyses to determine whether revised or additional standards in Alaska are warranted. EPA anticipates announcing its determination and making its analyses publicly available in 2009. Much of the information and data collected for EPA’s effort under Title XIV are summarized in this Assessment Report. Though not a federal law, a law was passed by the State of Alaska in 2001 (AS 46.03.460 - AS 46.03.490) that set standards and sampling requirements for the discharge of sewage and graywater from large (250+ passengers) and small (50-249 passengers) passenger vessels. This law also addresses off-loading and/or disposal of non-hazardous solid wastes and hazardous wastes in Alaska. In August 2006, Alaskan voters approved a ballot measure that added new requirements for cruise ships. The owners/operators of large commercial passenger vessels must now obtain a wastewater discharge permit in order to discharge any treated sewage, graywater, or other wastewater into marine waters of the state. Please see Appendix B for more information on state cruise ship efforts. 2.2.4 National Marine Sanctuaries Act The National Marine Sanctuaries Act (NMSA; 16 U.S.C. § 1431 et seq.), as amended, established a national program to designate certain areas of marine environments as areas of special national significance that warrant heightened care. The primary purpose of the law is to protect marine resources and ecosystems, such as coral reefs, sunken historical vessels, or unique
2-6

December 29, 2008
habitats, from degradation while facilitating public or private uses compatible with resource protection. NMSA authorizes the National Oceanic and Atmospheric Administration (NOAA) to designate as National Marine Sanctuaries areas of the marine environment that have special aesthetic, ecological, historical, or recreational qualities, and to provide comprehensive and coordinated conservation management for such areas. The National Marine Sanctuary Program manages 13 sanctuaries and the Papahānaumokuākea Marine National Monument (together referred to as “sites”). Designated sites are managed according to site-specific management plans developed by NOAA that typically prohibit by regulation the discharge or deposit of most material. Discharges of graywater and treated vessel sewage, however, are sometimes allowed provided they are authorized under the Clean Water Act. In some sanctuaries the discharge of sewage is prohibited in special zones to protect fragile habitat, such as coral. NMSA also provides for civil penalties for violations of its requirements or the permits issued under it. 2.3 What technologies are available to treat sewage from cruise ships? As discussed above, any ship greater than 65 feet in length must use either a Type II (flow through treatment device) or Type III (holding tank) MSD. An increasing number of cruise ships are using more effective and expensive Type II MSDs, referred to as “Advanced Wastewater Treatment systems” (AWTs), to treat both sewage and graywater (generally wastewater from sinks, baths, showers, laundry, and galleys; see Section 3 for more information on graywater). One recent estimate by the cruise industry is that roughly 40% of the International Council of Cruise Lines (ICCL) members’ 130 ships (which make up two-thirds of the world fleet) have installed AWTs, with 10 to 15 more systems added each year (Choi, 2007). (ICCL merged with the Cruise Lines International Association (CLIA) in 2006; see Section 1.5 for more information.) In 2006, 23 of 28 large cruise ships that operated in Alaskan waters had AWTs in order to meet the more stringent discharge requirements in effect there (see subsection 2.2.3 above). This subsection provides information on the types of MSDs most often used by cruise ships: traditional Type II MSDs (2.3.1) and AWTs (2.3.2). Specifically, it discusses how these systems work and how well they remove various pollutants from the waste stream. Subsection 2.4 (below) discusses potential environmental impacts of sewage from cruise ships. 2.3.1 Traditional Type II Marine Sanitation Devices How it works On most cruise ships with traditional Type II MSDs, sewage is treated using biological treatment and chlorination. Some cruise ships do not treat their sewage biologically, but instead use maceration and chlorination. Of the nine large cruise ships with traditional Type II MSDs that operated in Alaskan waters in 2004, six used biological treatment and chlorination, and three used maceration and chlorination.
2-7

December 29, 2008
Biological-chlorination MSDs operate similarly to land-based biological treatment systems for municipal wastewater treatment. The treatment system typically includes aerobic biological treatment to remove biochemical oxygen demand and some nutrients, clarification and filtration to remove solids, and final chlorine disinfection to destroy pathogens (see Figure 2-3). The system also may include screening to remove grit and debris. Cruise ships typically install up to four systems, allowing one or two to be placed off-line for maintenance at any one time (ADEC, 2000b).
S C R E E N
Untreated Sewage
Sludge
Aerobic Bacteria
Digestion
Biosolid Return
Clarification & Filtration
Chlorine Contact Disinfection
Treated Effluent
Air & Heat
Figure 2-3. Simplified Schematic of Traditional Type II Marine Sanitation Device Using Biological Treatment and Chlorine Disinfection
Maceration-chlorination systems use screening to remove grit and debris, maceration for solids size reduction, and chlorine disinfection to oxidize and disinfect the waste. Chlorine is either added (sodium hypochlorite) or generated by mixing the sewage with sea water and then passing this solution between electrolytic cells to produce hypochlorite. How well it works in practice Data Collection The primary information available on discharges from tradition Type II MSDs is from a voluntary sampling effort in Alaska in 2000 by the Alaska Cruise Ship Initiative (ADEC, 2001). These data are no longer representative of cruise ships operating in Alaska, which have mostly installed AWTs, but they may be indicative of the discharges from vessels with Type II MSDs operating in other waters. Twice during the 2000 cruise season, samples were collected from each sewage and graywater discharge port from each of the 21 large cruise ships operating in Alaska. (All except two of the sampled vessels treated sewage using traditional Type II MSDs. The other two vessels treated mixed sewage and graywater using prototype reverse osmosis AWTs. Data from all 21 vessels, including the two vessels with reverse osmosis systems, are included in this summary, because in most cases, it was not possible to identify results from the two vessels with reverse osmosis systems.) The Alaska Cruise Ship Initiative (ACSI) sampling was scheduled randomly at various ports of call on all major cruise routes in Alaska. Individual discharge samples characterized different
2-8

December 29, 2008
types of wastewater depending on ship-specific discharge configurations. As a result, individual samples characterized one or more graywater sources, treated sewage, or combined graywater and treated sewage. Analytes included total suspended solids, biochemical oxygen demand, chemical oxygen demand, pH, fecal coliform, total residual chlorine, free residual chlorine, and ammonia for all samples, and priority pollutants (metals, hydrocarbons, organochlorines) for one sample per ship. Samples were not taken of the influent to the treatment systems; therefore, percent removals achieved by these systems cannot be determined. The results of this ACSI sampling are discussed in more detail below, but in summary, 43% of the samples for fecal coliform met the MSD standard of 200 fecal coliform per 100 ml, 32% of the samples for total suspended solids met the MSD standard of 150 mg/l, and only 1 blackwater sample out of 70 samples met both the total suspended solids and fecal coliform standards (ADEC, 2001).
The Coast Guard inspected six of the cruise ships with poor effluent samples and found that five out of the six were either operating the MSDs improperly or failing to maintain them (ADEC, 2000a). Pathogen Indicators Based on data collected by ACSI in 2000, the average fecal coliform concentration in traditional Type II MSD effluent was 2,040,000 MPN/100 ml (total of 92 samples, calculation used detection limits for nondetected results). The range was from nondetect (detection limit of 2) to 24,000,000 MPN/100 ml. Of the 92 samples, 51 were greater than 200 MPN/100 ml, 35 were greater than 100,000, and 22 were greater than 1,000,000. This compares to typical fecal coliform concentrations in untreated domestic wastewater of 10,000 to 100,000 MPN/100 ml (Metcalf & Eddy, 1991). Fecal coliform is the only pathogen indicator analyzed by ACSI. As mentioned above, these data are primarily for traditional Type II MSDs, but two of the 21 vessels sampled were using prototype reverse osmosis treatment systems. Conventional Pollutants and Other Common Analytes Table 2-1 shows ACSI sampling results for some conventional pollutants and other common analytes in MSD effluent, as well as typical concentrations in untreated domestic wastewater. These key analytes are commonly used to assess wastewater strength. Table 2-1. Comparison of Traditional Type II MSD Effluent Concentrations to Untreated
Domestic Wastewater -- Conventional Pollutants and Other Common Analytes
Analyte Average Conc. (± SE) of Cruise
Ship Type II MSD Effluent1 Concentration in Untreated
Domestic Wastewater2
Total Suspended Solids (mg/l) 627 (±94.3) (21 detects out of 21 samples)
100 to 350
Biochemical Oxygen Demand (5-Day) (mg/l)
133 (±15.2) (21 detects out of 21 samples)
110 to 400
2-9

December 29, 2008
Chemical Oxygen Demand (mg/l) 1,040 (±271) (3 detects out of 3 samples)
250 to 1,000
pH 90.5% of the pH samples are between 6.0 and 9.0
(21 detects out of 21 samples)
between 6.0 and 9.0
Total residual chlorine (μg/l) 1,070* (±499) (12 detects out of 18 samples)
No data
1 Based on data collected by ACSI in 2000; of 21 vessels sampled, 19 had traditional Type II MSDs and 2 had prototype reverse osmosis treatment systems.
2 Metcalf & Eddy, 1991. * Average includes at least one nondetect value; this calculation uses detection limits for nondetected results. Metals ACSI sampled for 13 priority pollutant metal analytes, of which 8 were detected in greater than 10% of the Type II MSD effluent samples (less frequent detection of analytes is considered not representative of the waste stream; in fact, of the metal analytes detected in any samples, none were detected in fewer than 10% of the samples) (see Table 2-2). Copper and zinc were detected in the greatest amounts.
Table 2-2. Traditional Type II MSD Effluent Concentrations -- Metals
Analyte Average Conc. (± SE) of Cruise Ship Type II MSD Effluent1
Cadmium (Total) (μg/l) 0.0624* (±0.0205) (3 detects out of 24 samples)
Chromium (Total) (μg/l) 5.99* (±2.50) (8 detects out of 24 samples)
Copper (Total) (μg/l) 954* (±398) (19 detects out of 24 samples)
Lead (Total) (μg/l) 6.94* (±2.72) (7 detects out of 24 samples)
Mercury (Total) (μg/l) 0.206* (±0.0574) (8 detects out of 22 samples)
Nickel (Total) (μg/l) 15.8* (±7.34) (5 detects out of 22 samples)
Silver (Total) (μg/l) 0.527* (±0.166) (9 detects out of 22 samples)
Zinc (Total) (μg/l) 514* (±97.3) (19 detects out of 22 samples) 1 Based on data collected by ACSI in 2000; of 21 vessels sampled, 19 had traditional Type II MSDs and 2 had
prototype reverse osmosis treatment systems. * Average includes at least one nondetect value; this calculation uses detection limits for nondetected results. Volatile and Semivolatile Organics ACSI sampled for almost 140 volatile and semivolatile organic analytes. Of these, 16 were detected in at least 10% of effluent samples (less frequent detection of analytes is considered not representative of cruise ship effluent; analytes that were detected in fewer than 10% of samples were detected in only one or two samples). Table 2-3 presents the average volatile and semivolatile organic concentrations in Type II MSD effluent for these 16 analytes. Some of the analytes in this table with the highest concentrations are chlorine byproducts, likely generated by sewage chlorination.
2-10

December 29, 2008
Table 2-3. Traditional Type II MSD Effluent Concentrations -- Volatile and Semivolatile Organics
Analyte Average Conc. (± SE) of Cruise Ship Type II MSD Effluent1
1,2-Dichloroethane (μg/l) 0.879* (±0.0666) (8 detects out of 21 samples)
1,4-Dichlorobenzene (μg/l) 17.4* (±16.6) (4 detects out of 21 samples)
Bis(2-ethylhexyl) phthalate (μg/l) 3.45* (±0.837) (16 detects out of 21 samples)
Bromodichloromethane (μg/l) 2 33.7* (±12.7) (14 detects out of 21 samples)
Bromoform (μg/l) 2 43.6* (±21.9) (13 detects out of 22 samples)
Carbon tetrachloride (μg/l) 1.96* (±1.12) (5 detects out of 24 samples)
Chloroform (μg/l) 2 111* (±63.3) (21 detects out of 24 samples)
Chloromethane (μg/l) 24.4* (±12.9) (5 detects out of 22 samples)
Dibromochloromethane (μg/l) 2 27.4* (±12.0) (11 detects out of 24 samples)
Diethyl phthalate (μg/l) 1.00* (±0.204) (5 detects out of 24 samples)
Di-n-butyl phthalate (μg/l) 2.65* (±0.445) (13 detects out of 24 samples)
Ethylbenzene (μg/l) 0.624* (±0.181) (5 detects out of 24 samples)
Methylene chloride (μg/l) 4.02* (±1.81) (3 detects out of 22 samples)
Phenol (μg/l) 26.5* (±13.5) (7 detects out of 22 samples)
Tetrachloroethylene (μg/l) 12.5* (±10.5) (3 detects out of 22 samples)
Toluene (μg/l) 0.620* (±0.0771) (5 detects out of 22 samples) 1 Based on data collected by ACSI in 2000; of 21 vessels sampled, 19 had traditional Type II MSDs and 2 had
prototype reverse osmosis treatment systems. 2 Trihalomethanes are water system disinfection byproducts. * Average includes at least one nondetect value; this calculation uses detection limits for nondetected results. Nutrients Table 2-4 shows average ammonia concentration in effluent from traditional Type II MSDs, as well as typical concentrations in untreated domestic wastewater. Table 2-4. Comparison of Traditional Type II MSD Effluent Concentrations to Untreated
Domestic Wastewater -- Ammonia
Analyte Average Conc. (± SE) of Cruise Ship Traditional Type II MSD Effluent1
Concentration in Untreated Domestic Wastewater2
Ammonia as Nitrogen (mg/l) 145 (±36.7) (21 detects out of 21 samples)
12 to 50
1 Based on data collected by ACSI in 2000; of 21 vessels sampled, 19 had traditional Type II MSDs and 2 had prototype reverse osmosis treatment systems.
2 Metcalf & Eddy, 1991.
2-11

December 29, 2008
2.3.2 Advanced Wastewater Treatment Systems How it works On some cruise vessels, especially many of those traveling to Alaska (see subsection 2.2.3 above), sewage and often graywater are treated using AWTs. AWTs generally provide improved screening, biological treatment, solids separation (using filtration or flotation), and disinfection (using ultraviolet light) as compared to traditional Type II MSDs. The AWTs currently used by cruise ships operating in Alaskan waters are discussed in this subsection. Hamworthy’s Membrane Bioreactor (MBR) system uses aerobic biological treatment followed by ultrafiltration and ultraviolet (UV) disinfection. One example of this system is in operation on the Princess Cruises vessel Island Princess. On this vessel, the Hamworthy MBR system treats wastewater from accommodations and sewage. Wastewater is first treated in screen presses to remove paper and other coarse solids. Next, the wastewater enters a two-stage bioreactor, where bacteria digest the organic matter in the waste. Following biological treatment, the wastewater is filtered through tubular ultrafiltration membranes to remove particulate matter and biological mass, which are returned to the bioreactors. In the final stage of treatment, the wastewater undergoes UV disinfection to reduce pathogens. See EPA, 2006c, for more detailed information on this system. ROCHEM’s ROCHEM LPRO and ROCHEM Bio-Filt® system treats high concentration and low concentration waste streams with different processes. One example of this system is in operation on the Holland America Line vessel Oosterdam. On this vessel, the ROCHEM LPRO part of the system treats wastewater from laundry and accommodations (low concentration waste streams) while the ROCHEM Bio-Filt® treats wastewater from galley and sewage, as well as the membrane concentrate from the ROCHEM LPRO system (high concentration waste streams). The ROCHEM LPRO system uses screens to remove fibers and hair, reverse osmosis membranes to remove particulates and dissolved solids, and UV disinfection to reduce pathogens. The ROCHEM Bio-Filt® system uses vibratory screens to remove coarse solids, bioreactors to biologically oxidize the waste, ultrafiltration membranes to remove particulate matter and biological mass (which are returned to the bioreactors), and UV disinfection to reduce pathogens. See EPA, 2006d, for more detailed information on this system. The Zenon ZeeWeed® MBR system uses aerobic biological oxidation followed by ultrafiltration and UV disinfection. One example of this system is in operation on the Holland America Line vessel Veendam. On this vessel, graywater from the laundry, galley, accommodations, and food pulper combines with sewage and flows through two coarse screens into a collection tank. From the collection tank, the wastewater is pumped to an aerated bioreactor. After the bioreactor, the wastewater flows through the proprietary ZeeWeed® hollow-fiber ultrafiltration membrane system under a vacuum. In the final stage of treatment, the combined wastewater from the membranes undergoes UV disinfection to reduce pathogens. The Zenon system is the only system that EPA sampled that treats all graywater and sewage sources. See EPA, 2006a, for more detailed information on this system.
2-12

December 29, 2008
The Scanship treatment system uses aerobic biological oxidation followed by dissolved air flotation and UV disinfection. One example of the Scanship system is in operation on the Norwegian Cruise Line vessel Star. On this vessel, sewage and graywater from the galley, accommodations, and laundry combine in one graywater and sewage holding tank. The combined wastewater is pumped through a coarse drum filter and then through two separate aerated bioreactors. Each bioreactor contains free-floating plastic beads to support biological growth, eliminating the need for recycled biological mass. After aeration, the wastewater is pumped to two dissolved air flotation (DAF) units to separate solids. From the DAF units, the wastewater is pumped to polishing screen filters. In the final stage of treatment, the wastewater undergoes UV disinfection to reduce pathogens. See EPA, 2006b, for more detailed information on this system. The Hydroxyl CleanSea® system uses aerobic biological oxidation followed by dissolved air flotation and UV disinfection. Sewage and graywater are combined and pumped to a fine wedgewire screen for coarse solids removal. Next, the wastewater enters the ACTIVECELL™ biological reactors where free-floating plastic beads support biological growth without the need for recycled biological mass. The wastewater then enters the ACTIVEFLOAT™ dissolved air flotation units for solids separation. Final treatment steps include polishing filters and UV disinfection to reduce pathogens (Hydroxyl Systems, 2007). None of the ships that EPA sampled in 2004 and 2005 used the Hydroxyl CleanSea® system. Through 2007, EPA is not aware of any ships using the Hydroxyl system that have been approved for continuous discharge in Alaskan waters; in 2008, one ship using the Hydroxyl system was approved for continuous discharge in Alaska. How well it works in practice In 2004 and 2005, EPA sampled wastewater from four cruise ships that operated in Alaska to characterize graywater and sewage generated onboard and to evaluate the performance of the Zenon, Hamworthy, Scanship, and ROCHEM AWTs (see EPA, 2006 a-e). EPA also has evaluated cruise ship compliance monitoring data for AWT effluent provided by the Alaska Department of Environmental Conservation (ADEC) and the Coast Guard for 2003 through 2005, and self-monitoring data for AWT effluent submitted by the cruise industry in response to EPA’s 2004 cruise ship survey. These sampling results, which are described in greater detail below, indicate that AWTs are very effective in removing pathogens, oxygen demanding substances, suspended solids, oil and grease, and particulate metals. AWTs remove some of the dissolved metals (37 to 50%). Most volatile and semi-volatile organics are removed to levels below detection limits, while others show moderate removal. AWTs achieve moderate nutrient removals, likely resulting from nutrient uptake by the microorganisms in the bioreactors. Data Collection EPA Sampling: In 2004 and 2005, EPA analyzed the effluent from Zenon, Hamworthy, Scanship, and ROCHEM AWTs (see EPA, 2006 a-e) for over 400 analytes, including pathogen
2-13

December 29, 2008
indicators, suspended and dissolved solids, biochemical oxygen demand, oil and grease, dissolved and total metals, organics, and nutrients. ADEC/Coast Guard Sampling: AWT effluent data are collected through compliance monitoring required by state and federal law for all cruise ships that discharge in Alaskan waters. Since 2001, Alaska state law requires a minimum of two discharge samples per year for large cruise ships. Both samples are analyzed for fecal coliform and other common pollutants, and one sample is also analyzed for priority pollutants. This program is managed by the Alaska Department of Environmental Conservation (ADEC). Additionally, the federal law entitled “Certain Alaska Cruise Ship Operations” requires compliance monitoring of discharges from vessels approved for continuous discharge in Alaskan waters (see subsection 2.2.3 above). Sampling frequency and analytes are at the discretion of the Captain of the Port (COTP). The COTP requires discharge sampling twice per month for fecal coliform and other common pollutants. Although AWT compliance monitoring data are available beginning in 2001, EPA is using data collected beginning in 2003 as representative of AWT discharges due to sampling constraints prior to 2003. Data from EPA’s 2004 Cruise Ship Survey: EPA’s 2004 cruise ship survey asked cruise ships operating in Alaska in 2004 to submit any additional monitoring data collected in Alaska that was not previously provided to EPA through ADEC or the Coast Guard. EPA received a small amount of additional AWT effluent monitoring data from six ships in response to this request. These data comprise less than 2% of the data summarized below. To date, all available AWT effluent monitoring data are from four AWT systems: Hamworthy MBR; ROCHEM LPRO and ROCHEM Bio-Filt®; Zenon ZeeWeed® MBR; and Scanship. This is because these were the only AWT systems certified for continuous discharge in Alaska through 2005. All four of these AWTs treat sewage and at least some graywater sources. Therefore, these results apply to graywater treatment as well. Pathogen Indicators EPA analyzed both the influent and the effluent from AWTs (mixed graywater and sewage), as well as the influent to UV disinfection, for the pathogen indicators fecal coliform, enterococci, and E. coli. Fecal coliform were analyzed for comparison to the MSD and Title XIV standards. EPA chose to sample for E. coli and enterococci because epidemiological studies suggest a positive relationship between high concentrations of E. coli and enterococci in ambient waters and incidents of gastrointestinal illnesses associated with swimming (EPA, 1984b, and EPA, 1983). ADEC/Coast Guard analyzed for fecal coliform to assess compliance with the fecal coliform discharge standards. EPA also received some fecal coliform data in response to the survey. Sampling data indicate that AWTs remove pathogen indicators to levels below detection (>99% removal) (see Table 2-5). Over 96% of pathogen indicators were removed by the bioreactors and solids separation units; any remaining pathogen indicators were generally removed by UV disinfection to levels below detection (overall system efficiency >99%). When detected, pathogen indicators were generally at levels close to the detection limit.
2-14

December 29, 2008
Responses to EPA’s 2004 cruise ship survey did not provide sufficient information on the UV dose used by these treatment systems to enable a determination regarding whether the systems would inactivate viruses. EPA did not conduct sampling to assess the potential impact of holding on AWT effluent. Holding treated effluent in tanks for later discharge potentially could result in re-growth of pathogens.
Table 2-5. AWT Effluent Concentrations and Removals -- Pathogen Indicators
Analyte Unit
Average Concentration in Cruise Ship AWT
Influent1
Average Concentration after bioreactors but
before UV Disinfection1
Average Concentration in Cruise Ship AWT
Effluent2
Overall AWT
Percent Removal1
CFU / 100 ml
103,000,000* (61 detects
out of 62 samples)
25,500# (39 detects
out of 56 samples)
14.5* (26 detects
out of 285 samples)
>99 Fecal Coliform
MPN / 100 ml
10.1* (47 detects
out of 320 samples)
E. coli MPN / 100 ml
12,700,000 (63 detects
out of 63 samples)
727* (38 detects
out of 55 samples)
1.98* (6 detects
out of 59 samples)
>99
Enterococci MPN / 100 ml
4,940,000* (63 detects
out of 64 samples)
97.4# (33 detects
out of 54 samples)
1.28* (9 detects
out of 58 samples)
>99
1 Based on data collected by EPA in 2004. 2 Based on data collected by ADEC/Coast Guard from 2003 to 2005; data collected by EPA in 2004; and data
collected through EPA’s 2004 cruise ship survey. * Average includes at least one nondetect value; this calculation uses detection limits for nondetected results. # Average includes at least one nondetect value (calculation uses detection limits for nondetected results) and at
least one result flagged by the laboratory as not diluted sufficiently. The “>” symbol indicates a minimum level of removal. Conventional Pollutants and Other Common Analytes Table 2-6 presents AWT effluent sampling data for various common analytes including conventional pollutants (other than fecal coliform), chlorine, and temperature. Each of the three data sources (sampling by ADEC/Coast Guard from 2003 to 2005; sampling by EPA in 2004; sampling data collected through EPA’s 2004 cruise ship survey) includes data for some of these analytes; however, not all sources analyzed for all of them. At a minimum, all three data sources analyzed the key analytes commonly used to assess wastewater strength: biochemical oxygen demand, chemical oxygen demand, and total suspended solids. The AWTs remove almost all biochemical oxygen demand, chemical oxygen demand, and total organic carbon. The systems also remove settleable residue and total suspended solids to levels at or near detection.
2-15

December 29, 2008
Table 2-6. AWT Effluent Concentrations and Removals -- Conventional Pollutants and Other Common Analytes
Analyte Unit Average Concentration in
Cruise Ship AWT Influent1 Average Conc. (± SE) in Cruise Ship AWT Effluent2
Percent Removal1
Alkalinity mg/l CaCO
325 (25 detects out of 25 samples)
178 (±9.61) (127 detects out of 127 samples)
32 to 78
Biochemical Oxygen Demand (5-day)
mg/l 526 (24 detects out of 24 samples)
7.99* (±0.798) (358 detects out of 568 samples)
>99
Chemical Oxygen Demand
mg/l 1,140 (50 detects out of 50 samples)
69.4* (±4.03) (139 detects out of 147 samples)
>93 to 97
Chloride μg/l 294 (25 detects out of 25 samples)
389 (±93.9) (20 detects out of 20 samples)
NC to 16
Conductivity umhos/cm 1,450 (±268) (105 detects out of 105 samples)
Hardness mg/l 135 (25 detects out of 25 samples)
120 (±30.5) (20 detects out of 20 samples)
Hexane extractable material (HEM)
mg/l 95.6 (25 detects out of 25 samples)
5.74* (±0.154) (13 detects out of 127 samples)
>91 to >96
pH SU 99.5% of samples within range of 6.0 to 9.0
(921 detects out of 921 samples)
Residual Chlorine, Free mg/l 0.249* (±0.0993) (22 detects out of 511 samples)
Residual Chlorine, Total mg/l 0.338* (±0.129) (41 detects out of 547 samples)
Salinity ppt 1.93* (±0.606) (76 detects out of 77 samples)
Silica Gel Treated Hexane Extractable Material (SGT-HEM)
mg/l 22.1* (17 detects out of 25 samples)
ND (0 detects out of 20 samples)
NC to >92
Temperature °C 31.3 (±0.198) (403 detects out of 403 samples)
Total Dissolved Solids mg/l 776 (25 detects out of 25 samples)
819 (±169) (20 detects out of 20 samples)
NC to 34
Total Organic Carbon mg/l 169 (25 detects out of 25 samples)
19.0* (±1.20) (123 detects out of 127 samples)
86 to 94
Total Settleable Solids ml/l 33.5* (23 detects out of 24 samples)
0.141* (±0.0385) (3 detects out of 83 samples)
>99
Total Suspended Solids mg/l 545 (50 detects out of 50 samples)
4.49* (±0.193) (73 detects out of 587 samples)
>99
2-16

December 29, 2008
Average Conc. (± SE) in Average Concentration in Percent Analyte Unit Cruise Ship AWT Influent1 Cruise Ship AWT Effluent2 Removal1
Turbidity NTU 2.31* (±0.894) (62 detects out of 76 samples)
1 Based on data collected by EPA in 2004 and 2005. 2 Based on data collected by ADEC/Coast Guard from 2003 to 2005; data collected by EPA in 2004 and 2005; and
data collected through EPA’s 2004 cruise ship survey. “NC” indicates that percent removal was not calculated because the effluent concentration was greater than the
influent concentration or the analyte was not detected in the influent samples from one or more sampled ships. “ND” indicates not detected. * Average includes at least one nondetect value; this calculation uses detection limits for nondetected results. The “>” symbol indicates a minimum level of removal. Metals EPA sampled for 54 total and dissolved metal analytes. ADEC/Coast Guard analyzed for priority pollutant metal analytes (total and dissolved). Survey respondents provided some priority pollutant metals data. Table 2-7 presents AWT effluent sampling data for priority pollutant metals that were detected in greater than 10% of influent and/or effluent samples (less frequent detection of analytes is considered not representative of the waste stream). Copper, nickel, and zinc, which showed the highest concentrations, are common components of ship piping. Metals are present in both particulate and dissolved forms in the influents to the treatment systems. Metals in the effluent are predominantly in the dissolved form. This suggests that the treatment systems are very efficient in removing particulate metals, as would be expected for membrane and dissolved air flotation solids separation systems (and as supported by nearly complete removal of settleable solids and total suspended solids). Sampling results indicate that AWTs remove 37 to 50% of dissolved metals on average.
2-17

December 29, 2008
Table 2-7. AWT Effluent Concentrations and Removals -- Metals
Analyte1 Unit Average Concentration in
Cruise Ship AWT Influent2 Average Conc. (± SE) in
Cruise Ship AWT Effluent3 Percent
Removal2
Antimony, Total μg/l ND 2.38* (±0.219) (15 detects out of 71 samples)
Antimony, Dissolved μg/l 4.0* (1 detect out of 25 samples)
2.38* (±0.219) (11 detects out of 71 samples)
Arsenic, Total μg/l 2.2* (3 detects out of 25 samples)
2.51* (±0.203) (22 detects out of 71 samples)
NC to >3.8
Arsenic, Dissolved μg/l ND 2.28* (±0.166) (19 detects out of 71 samples)
NC
Cadmium, Total μg/l 0.45* (13 detects out of 25 samples)
0.824* (±0.147) (2 detects out of 71 samples)
>0.6 to 78
Chromium, Total μg/l 6.64* (24 detects out of 25 samples)
4.29* (±0.992) (27 detects out of 71 samples)
>44 to 95
Chromium, Dissolved μg/l 1.51* (15 detects out of 25 samples)
3.71* (±0.786) (28 detects out of 71 samples)
49 to 67
Copper, Total μg/l 519 (25 detects out of 25 samples)
16.6* (±2.74) (69 detects out of 71 samples)
96 to 98
Copper, Dissolved μg/l 81.5 (25 detects out of 25 samples)
13.7* (±2.40) (65 detects out of 71 samples)
62 to 94
Lead, Total μg/l 9.25* (22 detects out of 25 samples)
1.50* (±0.135) (27 detects out of 71 samples)
42 to >84
Lead, Dissolved μg/l 2.36* (13 detects out of 25 samples)
1.35* (±0.138) (20 detects out of 71 samples)
NC to >30
Mercury, Total4 μg/l 0.310* (21 detects out of 25 samples)
0.165* (±0.00895) (10 detects out of 70 samples)
60 to 92
Mercury, Dissolved4 μg/l 0.120* (10 detects out of 25 samples)
0.176* (±0.00941) (10 detects out of 68 samples)
NC to 32
Nickel, Total μg/l 22.4 (25 detects out of 25 samples)
13.6* (±2.01) (70 detects out of 71 samples)
NC to 48
Nickel, Dissolved μg/l 17.1 (25 detects out of 25 samples)
13.3* (±1.96) (69 detects out of 71 samples)
NC to 32
Selenium, Total μg/l 9.68* (13 detects out of 25 samples)
5.86* (±1.20) (33 detects out of 71 samples)
12 to 38
Selenium, Dissolved μg/l 8.39* (10 detects out of 25 samples)
6.14* (±1.48) (29 detects out of 71 samples)
NC to 24
Silver, Total μg/l 1.70* (14 detects out of 25 samples)
1.15* (±0.109) (17 detects out of 71 samples)
>0.5 to >74
Silver, Dissolved μg/l ND 1.00* (±0.0844) (10 detects out of 71 samples)
NC
Thallium, Total μg/l 0.860* (2 detects out of 25 samples)
1.02* (±0.194) (11 detects out of 71 samples)
NC to 3.2
Zinc, Total μg/l 986 (25 detects out of 25 samples)
198* (±22.7) (69 detects out of 71 samples)
NC to 86
Zinc, Dissolved μg/l 209 (25 detects out of 25 samples)
185* (±21.4) (70 detects out of 71 samples)
NC
2-18

December 29, 2008
1 Priority pollutant metal analytes detected in at least 10% of AWT influent and/or effluent samples. 2 Based on data collected by EPA in 2004. 3 Based on data collected by ADEC/Coast Guard from 2003 to 2005; data collected by EPA in 2004; and data
collected through EPA’s 2004 cruise ship survey. 4 Because it was not possible to incorporate “clean” sampling and analysis methodologies for mercury when
sampling onboard ships, there is no way for EPA to determine whether mercury reported here is present in AWT influent and effluent or if the mercury was the result of contamination from nearby metal or sources of airborne contamination.
“NC” indicates that percent removal was not calculated because the effluent concentration was greater than the influent concentration or the analyte was not detected in the influent samples from one or more sampled ships.
“ND” indicates not detected. * Average includes at least one nondetect value; this calculation uses detection limits for nondetected results. Volatile and Semivolatile Organics EPA’s volatile and semivolatile organics analyte list includes 84 volatile and semivolatile organics and focuses primarily on priority pollutants. ADEC/Coast Guard’s volatile and semivolatile organic analytes include approximately 135 organics (including all 84 analytes on EPA’s list) and is nearly identical to that analyzed for during the 2000 voluntary sampling program. Survey respondents also provided some organics data. Table 2-8 presents AWT effluent sampling data for priority pollutant volatile and semivolatile organics that were detected in greater than 10% of influent and/or effluent samples (less frequent detection of analytes is considered not representative of the waste stream). AWTs generally remove volatile and semivolatile organics to below detection limits.
Table 2-8. AWT Effluent Concentrations and Removals -- Volatile and Semivolatile Organics
Analyte1 Unit Average Concentration in
Cruise Ship AWT Influent2 Average Conc. (± SE) in Cruise
Ship AWT Effluent3 Percent
Removal2
2,4-Dichlorophenol μg/l ND 8.48* (±1.08) (8 detects out of 71 samples)
Bis(2-ethylhexyl) phthalate
μg/l 46.1* (21 detects out of 25 samples)
6.66* (±0.721) (2 detects out of 71 samples)
>37 to >90
Chloroform μg/l 10.1* (5 detects out of 25 samples)
3.74* (±0.351) (27 detects out of 71 samples)
NC to >67
Diethyl phthalate μg/l 13.1* (8 detects out of 25 samples)
8.57* (±1.06) (7 detects out of 71 samples)
NC to >51
Di-n-butyl phthalate μg/l ND 8.32* (±1.07) (8 detects out of 71 samples)
Phenol μg/l 75.0* (24 detects out of 25 samples)
20.7* (±3.00) (25 detects out of 71 samples)
25 to 45
Tetrachloroethylene μg/l 255* (8 detects out of 25 samples)
5.59* (±1.05) (10 detects out of 71 samples)
>44 to 97
Toluene μg/l 7.67* (5 detects out of 25 samples)
3.44* (±0.346) (10 detects out of 71 samples)
>1.4 to >17
Trichloroethene μg/l 15.1* (5 detects out of 25 samples)
3.54* (±0.337) (1 detects out of 71 samples)
>75
2-19

December 29, 2008
1 Priority pollutant volatile and semivolatile organics detected in at least 10% of AWT influent and/or effluent samples.
2 Based on data collected by EPA in 2004. 3 Based on data collected by ADEC/Coast Guard from 2003 to 2005; data collected by EPA in 2004; and data
collected through EPA’s 2004 cruise ship survey. “NC” indicates that percent removal was not calculated because the effluent concentration was greater than the
influent concentration or the analyte was not detected in the influent samples from one or more sampled ships. “ND” indicates not detected. * Average includes at least one nondetect value; this calculation uses detection limits for nondetected results. The “>” symbol indicates a minimum level of removal.
Nutrients EPA sampled for nutrients in 2004 and found that some of the 2004 results for nitrogen compounds were anomalous. Therefore, EPA performed additional nutrient sampling in 2005 onboard the same four cruise vessels. ADEC/Coast Guard also monitor nutrients, and survey respondents provided some nutrient data. Table 2-9 presents AWT effluent sampling data for nutrients. AWTs reduce ammonia, total Kjeldahl nitrogen, and total phosphorus by moderate amounts. Nitrate/nitrite levels were low and remained relatively unchanged by treatment. Nitrogen and phosphorus are likely taken up by microorganisms in the bioreactor and removed from the system in the waste biomass. It is unlikely that ammonia is removed by nitrification, as nitrification would have resulted in an increase in nitrate/nitrite concentration, but these levels remained relatively unchanged.
Table 2-9. AWT Effluent Concentrations and Removals -- Nutrients
Analyte Unit Average Concentration in
Cruise Ship AWT Influent1 Average Conc. (± SE) in Cruise
Ship AWT Effluent2 Percent
Removal1
Ammonia As Nitrogen
mg/l 78.6 (35 detects out of 35 samples)
36.6* (±5.50) (136 detects out of 138 samples)
58 to 74
Nitrate/Nitrite as Nitrogen
mg/l 0.325* (26 detects out of 50 samples)
3.32* (±0.653) (66 detects out of 152 samples)
NC
Total Kjeldahl Nitrogen
mg/l 111 (50 detects out of 50 samples)
32.5* (±3.27) (169 detects out of 170 samples)
70 to 76
Total Phosphorus
mg/l 18.1 (25 detects out of 25 samples)
5.05* (±0.460) (146 detects out of 154 samples)
41 to 98
1 Based on data collected by EPA in 2004 and 2005. 2 Based on data collected by ADEC/Coast Guard from 2003 to 2005; data collected by EPA in 2004 and 2005; and
data collected through EPA’s 2004 cruise ship survey. “NC” indicates that percent removal not was calculated because the effluent concentration was greater than the
influent concentration or the analyte was not detected in the influent samples from one or more sampled ships. “ND” indicates not detected. * Average includes at least one nondetect value; this calculation uses detection limits for nondetected results. Pesticides EPA analyzed for 121 organohalide and organophosphorus pesticides in AWT influent (pesticides were not analyzed for in AWT effluent). Simazine was the only pesticide detected (concentration of 0.96 g/l in one sample). EPA lists simazine as a General Use Pesticide that has
2-20

December 29, 2008
been used to control broad-leaved weeds and annual grasses in fields, berry fruit, and vegetables. Simazine is classified by EPA to be slightly toxic to practically non-toxic. In the past, simazine has been used to control algae in swimming pools, hot tubs, and whirlpools. (Extoxnet, 1996). ADEC also analyzed for organophosphorus pesticides in AWT effluent in 2003. None were detected. 2.3.3 Marine Sanitation Device Wastewater Residuals Waste Biomass In addition to the treated sewage discharge generated by cruise ships, waste biomass (excess biological mass from the bioreactors) is generated in varying amounts by all vessels that use biological treatment, including traditional Type II MSDs and AWTs. Waste biomass contains organic material, often with high concentrations of bacteria and viruses, unless treated further. In biological treatment, microorganisms (e.g., bacteria) consume the biological matter in sewage, which produces biological mass (e.g., more bacteria). The biological mass is then separated from the treated effluent using a solids separation step such as clarification and/or filtration. A portion or all of the biological mass is recycled to the bioreactors to treat additional sewage. Of the six large cruise ships with traditional biological Type II MSDs that operated in Alaskan waters in 2004, all recycle all of their separated biological mass to the bioreactors. This means that excess biological mass typically exits these systems entrained in the treated effluent. (Treated effluent is disinfected prior to discharge to reduce pathogens.) However, for three of the six systems, excess biological mass also accumulates in the bioreactors to unacceptable levels over time. Once or twice per month, a portion of the biological mass is removed from the bioreactors of these systems. According to responses to EPA’s 2004 cruise ship survey, this waste biomass is discharged without treatment outside 12 nm from shore. EPA has no sampling data for waste biomass from traditional Type II MSDs. In AWTs, improved biological treatment results in the generation of large amounts of biological mass, while improved solids separation does not allow for the entrainment of biological mass in the treated effluent. Biological mass is recycled to the bioreactors; however, excess biological mass is removed from the AWT bioreactors on a daily or weekly basis. On all four ships sampled by EPA in 2004 and 2005, excess waste biomass is pumped to a double-bottom holding tank for discharge without treatment outside 12 nm from shore. The volume of waste biomass discharged by these four ships ranged from 370 to 6,600 gallons/day. EPA collected one-time grab samples of waste biomass from three of the four vessels sampled in 2004 (see Table 2-10). Most of the analytes detected in the waste biomass also were detected in the influent to treatment. For many analytes, concentrations in the waste biomass exceeded those in the influent to treatment, suggesting that these analytes accumulate in the system until removed in the waste biomass stream. In particular, there were elevated metals concentrations in the waste biomass. This is expected as the AWTs are highly efficient in removing particulate metals from the effluent and retaining them in the bioreactors.
2-21

December 29, 2008
Table 2-10. AWT Waste Biomass Concentrations for Selected Analytes
Analyte Unit Average Concentration in
Cruise Ship AWT Influent1
Average Concentration in Cruise Ship AWT Waste
Biomass1
Average Concentration in Cruise Ship AWT Screening Solids1
Conventional Pollutants
Biochemical Oxygen Demand (5-Day)
mg/l 526 (24 detects out of 24 samples)
3,870 (1 detect out of 1 sample)
6,610 (1 detect out of 1 sample)
Chemical Oxygen Demand
mg/l 1,140 (50 detects out of 50 samples)
9,840 (3 detects out of 3 samples)
46,200 (3 detects out of 3 samples)
Metals
Chromium, Total μg/l 6.64* (24 detects out of 25 samples)
200 (3 detects out of 3 samples)
565 (3 detects out of 3 samples)
Copper, Total μg/l 519 (25 detects out of 25 samples)
10,800 (3 detects out of 3 samples)
22,700 (3 detects out of 3 samples)
Lead, Total μg/l 9.25* (22 detects out of 25 samples)
177 (3 detects out of 3 samples)
49.9* (2 detects out of 3 samples)
Nickel, Total μg/l 22.4 (25 detects out of 25 samples)
245 (3 detects out of 3 samples)
537 (3 detects out of 3 samples)
Zinc, Total μg/l 986 (25 detects out of 25 samples)
19,400 (3 detects out of 3 samples)
33,600 (3 detects out of 3 samples)
Volatile and Semivolatile Organics
Bis (2-ethylhexyl) phthalate
μg/l 46.1* (21 detects out of 25 samples)
40.0 (2 detects out of 2 samples)
6,250* (2 detects out of 3 samples)
Phenol μg/l 75.0* (24 detects out of 25 samples)
628 (2 detects out of 2 samples)
563* (2 detects out of 3 samples)
Tetrachloroethylene μg/l 255* (8 detects out of 25 samples)
5.83* (2 detects out of 3 samples)
6.19* (2 detects out of 3 samples)
Trichloroethene μg/l 15.1* (5 detects out of 25 samples)
3.74* (1 detect out of 3 samples)
ND (0 detects out of 3 samples)
Nutrients
Ammonia as Nitrogen
mg/l 78.6 (35 detects out of 35 samples)
58.2 (2 detects out of 2 samples)
170 (2 detects out of 2 samples)
Total Kjeldahl Nitrogen
mg/l 111 (50 detects out of 50 samples)
1,030 (3 detects out of 3 samples)
740 (3 detects out of 3 samples)
Nitrate/Nitrite as Nitrogen
mg/l 0.325* (26 detects out of 50 samples)
3.51* (2 detects out of 3 samples)
1.24* (2 detects out of 3 samples)
Total Phosphorus mg/l 18.1 (25 detects out of 25 samples)
173 (3 detects out of 3 samples)
341 (3 detects out of 3 samples)
1 Based on data collected by EPA in 2004. * Average includes at least one nondetect value; this calculation uses detection limits for nondetected results.
2-22

December 29, 2008
Screening Solids Most sewage treatment systems use coarse screens or presses to remove paper and other coarse solids from sewage. Depending on the specific type of screening technology used, the resulting screening solids waste varies in water content. For the four ships that EPA sampled in 2004 and 2005, two generated relatively dry screening solids and incinerated them onboard. The other two ships generated relatively wet screening solids. One of these ships disposed of the solids on shore. The other stored the solids in double-bottom holding tanks for discharge without treatment outside 12 nm from shore (50 gallons/day of screening solids). EPA collected one-time grab samples of screening solids from three of the four vessels sampled in 2004 (see Table 2-10). 2.3.4 What additional non-treatment measures are available to manage sewage from
cruise ships? For ships that do not have AWTs traveling regularly on itineraries beyond territorial coastal waters, Cruise Lines International Association (CLIA) standards provide that discharge will take place only when the ship is more than four miles from shore and when the ship is traveling at a speed of not less than six knots (for vessels operating under sail, or a combination of sail and motor propulsion, the speed shall not be less than four knots). For vessels whose itineraries are fully within U.S. territorial waters, CLIA standards provide that discharge shall comply fully with U.S. and individual state legislation and regulations. 2.4 What are the potential environmental impacts associated with sewage from
cruise ships? In order to evaluate the potential environmental impacts of sewage waste streams from cruise ships, EPA compared the effluent from traditional Type II MSDs and AWTs discussed in subsection 2.3 (above) to (1) current wastewater discharge standards for ships and land-based sewage treatment plants and (2) EPA’s National Recommended Water Quality Criteria. The mixing and dilution that occurs following discharge, which is discussed in subsection 2.4.3 below, also is relevant to an evaluation of potential environmental impact. Information about potential treatment technologies is discussed in subsection 2.4.4 below. 2.4.1 Comparison to wastewater discharge standards
Table 2-11 shows the comparison of average effluent analyte concentrations from traditional Type II MSDs and from AWTs to:
EPA’s standards for discharges from Type II MSDs on vessels; EPA’s standards for secondary treatment of sewage from land-based sewage
treatment plants; and Alaska cruise ship discharge standards under “Certain Alaskan Cruise Ship
Operations” (also referred to as “Title XIV”).
2-23

December 29, 2008
Traditional Type II MSD effluent concentrations exceeded the EPA standards for discharges from Type II MSDs (see Table 2-11). In addition, traditional Type II MSD effluent concentrations exceeded most wastewater discharge standards under Title XIV for continuous discharge and for secondary treatment from land-based sewage treatment plants. (Traditional Type II MSD effluent concentrations are not required to meet, nor are the devices designed to meet, the Title XIV continuous discharge standards or the secondary treatment discharge standards.) In contrast to traditional Type II MSD effluent, the average effluent concentrations from AWTs are lower than all of the discharge standards presented in Table 2-11, with the exception of total residual chlorine. Chlorination is used to disinfect potable water produced underway or bunkered in port. From 2003 through 2005, many cruise vessels in Alaska converted from chlorine disinfection of treated sewage and graywater to UV disinfection methods during treatment system upgrades from traditional Type II MSDs to AWTs. The switch to UV disinfection resulted in a decline in the frequency and magnitude of detected total residual chlorine in cruise effluent from AWTs. Based on the change in disinfection methods for AWTs, the likely source for occasional detection of total residual chlorine in AWT effluent is residual chlorine in potable water. Another factor contributing to the exceedance of the total residual chlorine standard is the difference between the total residual chlorine discharge standard of 10 μg/l and the minimum detection limit reported by most analytical labs of 100 μg/l. The average concentrations presented in Table 2-11 are calculated using the detection limit for samples where chlorine is not detected. Therefore, although total residual chlorine was detected in only 41 of 547 samples, the average is weighted higher due to the use of the detection limit (which is high relative to the standard) for nondetect samples. ADEC uses the 100 μg/l minimum detection level as the compliance evaluation level for total residual chlorine. Therefore, cruise ships reporting nondetect values with a detection limit of 100 μg/l are considered in compliance with the Title XIV continuous discharge standards. Based on this evaluation criterion, effluent concentrations from AWT seldom exceed the minimum detection level.
Table 2-11. Comparison of AWT and Traditional Type II MSD Effluent to Wastewater Discharge Standards
Analyte
Average Concentration
in AWT Effluent1
Average Concentration in Traditional Type II MSD
Effluent2
Performance Standards for Type II
MSDs (33 CFR Part 159
Subpart C)
Secondary Treatment Discharge
Standards for Sewage from Land-
based Sewage Treatment Plants (40 CFR 133.102)
Title XIV Standard for Continuous Discharge in
Alaskan waters(33 CFR Part
159 Subpart E)
Fecal coliform (fecal coliform/ 100 ml)
14.5* 2,040,000* MPN / 100 ml
<200 <203
Total residual chlorine (μg/l)
338*^ 1,070* <10
2-24

December 29, 2008
Secondary Performance Title XIV Treatment
Analyte
Average Concentration
in AWT Effluent1
Average Concentration in Traditional Type II MSD
Effluent2
Standards for Type II
MSDs (33 CFR Part 159
Subpart C)
Discharge Standard for Standards for Continuous
Sewage from Land- Discharge in based Sewage Alaskan waters
Treatment Plants (33 CFR Part (40 CFR 133.102) 159 Subpart E)
Biochemical oxygen demand (5-day) (mg/l)
7.99* 133
<454
<305 <454
<305
Total suspended solids (mg/l)
4.49* 627
<150 <454
<305 <454
<305
pH 99.5% of pH samples between
6.0 and 9.0
90.5% of pH samples between
6.0 and 9.0
between 6.0 and 9.0
between 6.0 and 9.0
1 Based on data collected by ADEC/Coast Guard from 2003 to 2005; data collected by EPA in 2004; and data collected through EPA’s 2004 cruise ship survey.
2 Based on data collected by the Alaska Cruise Ship Initiative (ACSI) in 2000; of 21 vessels sampled, 19 had traditional Type II MSDs and 2 had prototype reverse osmosis treatment systems.
3 The geometric mean of the samples from the discharge during any 30-day period does not exceed 20 fecal coliform per 100 milliliters (ml) and not more than 10% of the samples exceed 40 coliform per 100 ml.
4 The 7-day average shall not exceed this value. 5 The 30-day average shall not exceed this value. In addition, the 30-day average percent removal shall not be less
than 85%. * Average includes at least one nondetect value; this calculation uses detection limits for nondetected results. ^ The minimum detection limit reported for total residual chlorine was generally 100 μg/l. Because chlorine was not
detected in most AWT effluent samples (total residual chlorine was detected in only 41 of 547 samples), the average presented here is weighted higher due to the use of the detection limit for nondetect samples. See section 2.4.1 for further discussion.
2.4.2 Comparison to EPA’s National Recommended Water Quality Criteria EPA compared average effluent concentrations from traditional Type II MSDs and from AWTs (discussed in subsection 2.3 above) to EPA’s 2006 National Recommended Water Quality Criteria (NRWQC) for saltwater aquatic life and for human health (for the consumption of organisms only), and for pathogen indicators, compared these effluent concentrations to criteria for the protection of human health from incidental ingestion during recreational activities (e.g., swimming and surfing) and to criteria for consumption of shellfish. Analytes that exceed the NRWQC are discussed in greater detail in this subsection. EPA’s NRWQC are recommended concentrations of analytes in a waterbody that are intended to protect human health and aquatic organisms and their uses from unacceptable effects from exposures to these pollutants. The NRWQC are not directly comparable to analyte concentrations in a discharge for a number of reasons. First, NRWQC not only have a concentration component, but also a duration and frequency component. Second, it is not always necessary to meet all water quality criteria within the discharge pipe to protect the integrity of a waterbody (EPA, 1991). Sometimes it is appropriate to allow for ambient concentrations above
2-25

December 29, 2008
the criteria in small areas near outfalls. These are called mixing zones. To ensure mixing zones do not impair the integrity of the waterbody, it should be determined that the mixing zone will not cause lethality to passing organisms and, considering likely pathways of exposure, that there are not significant human health risks. Third, under EPA’s water quality permitting regulations (40 CFR 122.44(d)(1)(ii)), when determining whether a discharge causes, has the reasonable potential to cause, or contributes to an in-stream excursion above a narrative or numeric criteria within a state water quality standard, the permitting authority is directed to use procedures which account for, among other things, the dilution of the effluent in the receiving water, where appropriate. Nevertheless, comparison of cruise ship wastewater discharges to NRWQC provides a conservative screen of whether these discharges might cause, have the potential to cause, or contribute to non-attainment of the water quality standards in a given receiving water. If the concentration of a given analyte in cruise ship wastewater is less than the NRWQC, the wastewater should not cause, have the potential to cause, or contribute to non-attainment of a water quality standard based on that criterion. If the concentration of a particular analyte in cruise ship wastewater is greater than the NRWQC, additional analysis would determine whether the discharge would cause, have the potential to cause, or contribute to non-attainment of a water quality standard in a given receiving water. Such an analysis may be more difficult for mobile sources such as vessels than for stationary sources, but in general, greater mixing and dilution would be expected for mobile sources. Pathogen Indicators Sewage may host many pathogens of concern to human health, including Salmonella, shigella, hepatitis A and E, and gastro-intestinal viruses (National Research Council, 1993). Sewage contamination in swimming areas and shellfish beds pose potential risks to human health and the environment by increasing the rate of waterborne illnesses (Pruss, 1998; Rees, 1993; National Research Council, 1993). Shellfish feed by filtering particles from the water, concentrate bacteria and viruses from the water column, and pose the risk of disease in consumers when eaten raw (National Research Council, 1993; Wu, 1999). The NRWQC for pathogen indicators references the bacteria standards in EPA’s 1986 Quality Criteria for Water, commonly known as the Gold Book. The Gold Book standard for bacteria is described in terms of three different waterbody use criteria: freshwater bathing, marine water bathing, and shellfish harvesting waters. The marine water bathing and shellfish harvesting waterbody use criteria, shown in Table 2-12, were used for comparison with cruise ship discharge concentrations.
2-26

December 29, 2008
Table 2-12. National Recommended Water Quality Criteria for Bacteria
Waterbody Use Gold Book Standard for Bacteria
Marine Water
Bathing
Based on a statistically sufficient number of samples (generally not less than 5 samples equally spaced over a 30-day period), the geometric mean of the enterococci densities should not exceed 35 per 100 ml; no sample should exceed a one-sided confidence limit (C.L.) using the following as guidance: 1) Designated bathing beach 75% C.L. 2) Moderate use for bathing 82% C.L. 3) Light use for bathing 90% C.L. 4) Infrequent use for bathing 95% C.L.
based on a site-specific log standard deviation, or if site data are insufficient to establish a log standard deviation, then using 0.7 as the log standard deviation.
Shellfish Harvesting
Waters
The median fecal coliform bacterial concentration should not exceed 14 MPN per 100 ml with not more than 10% of samples exceeding 43 MPN per 100 ml for the taking of shellfish.
Enterococci data were unavailable for traditional Type II MSD effluent. Fecal coliform data for Type II MSD effluent consistently exceeded the NRWQC for shellfish harvesting waters. Fecal coliform concentrations in traditional Type II MSD effluent averaged 2,040,000 MPN/100 ml (total of 92 samples, calculation used detection limits for nondetected results) and ranged from 0 to 24,000,000 MPN/100 ml. Over 50% of the collected samples exceeded 43 MPN/100 ml. Given the consistent exceedance of the NRWQC for bacteria, traditional Type II MSD effluent may cause, have the potential to cause, or contribute to non-attainment of water quality standards in a given receiving water. Effluent bacteria concentrations from AWTs are consistently below the pathogen standards in Table 2-12 and therefore should not cause, have the potential to cause, or contribute to non-attainment of water quality standards in a given receiving water. Conventional Pollutants and Other Common Analytes Conventional pollutants and other common analytes that have a saltwater aquatic life or human health (for the consumption of organisms) narrative NRWQC include oil and grease, settleable residue, total suspended solids (see Table 2-13), and temperature (see Tables 2-13 and 2-14). In addition, the NRWQC include a numeric standard for total residual chlorine (see Table 2-15).
2-27

December 29, 2008
Table 2-13. Narrative National Recommended Water Quality Criteria for Conventional
Pollutants and Other Common Analytes
Analyte Gold Book Standard
Oil and Grease For aquatic life: (1) 0.01 of the lowest continuous flow 96-hour LC50 to several important freshwater and marine species, each having a demonstrated high susceptibility to oils and petrochemicals. (2) Levels of oils or petrochemicals in the sediment which cause deleterious effects to the biota should not be allowed. (3) Surface waters shall be virtually free from floating nonpetroleum oils of vegetable or animal origin, as well as petroleum-derived oils.
Settleable and Suspended Solids
Freshwater fish and other aquatic life: Settleable and suspended solids should not reduce the depth of the compensation point for photosynthetic activity by more than 10% from the seasonally established norm for aquatic life.
Temperature Marine Aquatic Life: In order to assure protection of the characteristic indigenous marine community of a waterbody segment from adverse thermal effects, the maximum acceptable increase in the weekly average temperature resulting from artificial sources is 1°C (1.8 °F) during all seasons of the year, providing the summer maxima are not exceeded; and daily temperature cycles characteristic of the waterbody segment should not be altered in either amplitude or frequency. Summer thermal maxima, which define the upper thermal limits for the communities of the discharge area, should be established on a site-specific basis.
Oil and Grease Annual worldwide estimates of petroleum input to the sea exceed 1.3 million metric tonnes (about 380 million gallons) (National Research Council, 2003). Levels of oil and grease of any kind can cause a variety of environmental impacts including the drowning of waterfowl because of loss of buoyancy, preventing fish respiration by coating their gills, asphyxiating benthic organisms from surface debris settling on the bottom, and reducing the natural aesthetics of waterbodies (EPA, 1986). EPA does not have information on traditional Type II MSD or AWT effluent that would allow us to directly evaluate the narrative NRWQC for oil and grease. Oil and grease data were unavailable for traditional Type II MSD effluent. Oil and grease (as measured by Hexane Extractable Material or HEM) was detected in about 10% of the samples from AWT effluent, with detected amounts ranging between 5.2 and 19 mg/l. EPA did not observe any floating oils in their effluent samples; therefore, it is unlikely that there would be floating oils in the receiving water. (ADEC/Coast Guard did not provide a visual description of their samples to indicate if floating oils were observed.) Based on the limited amount of information available, it seems unlikely that AWT effluent would cause, have the potential to cause, or contribute to non-attainment of water quality standards in a given receiving water.
2-28

December 29, 2008
Settleable and Suspended Solids Levels of solids, either settleable or suspended, in untreated or inadequately treated sewage may harm marine organisms by reducing water clarity and available oxygen levels in the water column. In addition, solids can directly impact fish and other aquatic life by preventing the successful development of eggs and larva, blanketing benthic populations, and modifying the environment such that natural movements and migration patterns are altered (EPA, 1986). EPA did not directly evaluate traditional Type II MSD or AWT effluent against the narrative NRWQC for settleable and suspended solids because the criterion is based on conditions in a specific waterbody. Total suspended solids were detected in traditional Type II MSD effluent at levels ranging from 200 to 1,480 mg/l, with an average of 627 mg/l. The detected values are substantially higher than the discharge standards for sewage from land-based sewage treatment plants (7-day average shall not exceed 45 mg/l). A site-specific evaluation would determine if these discharge concentrations would cause, have the potential to cause, or contribute to non-attainment of water quality standards in a given receiving water. In contrast, the majority of effluent data from AWTs were nondetect values for both settleable solids and total suspended solids. It is unlikely that effluent from AWTs would cause or contribute to an exceedance of water quality standards in a given receiving water. Temperature Temperature changes can directly affect aquatic organisms by altering their metabolism, ability to survive, and ability to reproduce effectively. Increases in temperature are frequently linked to acceleration in the biodegradation of organic material in a waterbody, which increases the demand for dissolved oxygen and can stress local aquatic communities. EPA did not directly evaluate traditional Type II MSD or AWT effluent against the narrative NRWQC for temperature because the criterion is based on conditions in a specific waterbody, such as flushing and the factors that influence flushing. The average temperature from AWT effluent measured in Alaska was 31.3 °C (temperature data were not available for traditional Type II MSD effluent). Local waterbody temperatures would be needed to determine if the temperature from AWT effluent would cause, have the potential to cause, or contribute to non-attainment of water quality standards in a given receiving water. Table 2-14 provides a few examples of the water temperatures observed in various coastal waters across the United States. The average temperature for AWT effluent is similar to the summer temperatures at some of these locations, and exceeds the winter temperatures by around 10 to 30 °C. A site-specific evaluation would determine if the cruise ship discharge volume is significant enough to alter the temperature of a given waterbody. However, considering the size of coastal waterbodies where cruise ships operate, it is unlikely that cruise ship effluent temperatures would cause an increase in waterbody temperature that would exceed the NRWQC.
2-29

December 29, 2008
Table 2-14. Seasonal Coastal Water Temperatures in °C Across the United States
Location State Jan Feb March April May June July Aug Sept Oct Nov Dec
Boston Harbor MA 4.44 2.22 5.00 7.22 12.22 16.11 18.89 20.00 18.89 14.44 10.56 5.56
Baltimore MD 4.44 2.78 6.11 10.56 16.11 21.11 25.00 26.11 25.00 18.89 12.22 6.11
Miami Beach FL 21.67 22.78 23.89 25.56 26.67 28.89 30.00 30.00 28.89 28.33 24.44 22.78
Key West FL 20.56 21.11 23.89 26.11 27.78 30.00 30.56 30.56 30.00 28.33 24.44 22.22
Seattle WA 8.33 7.78 7.78 8.89 10.00 11.67 12.78 13.33 13.33 12.22 10.56 9.44
Los Angeles CA 14.44 14.44 15.56 15.56 16.11 16.67 18.33 20.00 19.44 18.89 17.78 15.56
Galveston TX 12.22 12.78 16.11 21.67 25.56 28.33 30.00 30.00 28.33 23.89 19.44 15.00
Juneau AK 2.22 2.22 2.78 4.44 7.78 10.56 11.11 10.56 9.44 6.67 4.44 3.33
Honolulu HI 24.44 24.44 24.44 24.44 25.56 26.11 26.67 26.67 27.22 27.22 26.11 25.00
Source: National Oceanographic Data Center Coast Water Temperature Guide (www.nodc.noaa.gov/dsdt/wtg12.html)
Total Residual Chlorine Chlorine is extremely toxic to aquatic organisms. Chlorine concentrations as low as 3 μg/l can result in a high mortality rate for some species (EPA, 1984a). In fish, exposure to low levels of total residual chlorine (<1,000 μg/l) can cause avoidance behavior, respiratory problems, and hemorrhaging (Vetrano, 1998). Fish may recover once removed from the chlorine environment, but the severity of the reaction and chance of death increases as the concentration of total residual chlorine increases (Booth et al., 1981). Studies have shown that continuous chlorination can lead to a shift in the composition of phytoplankton communities, thus altering the benthic and fish communities that feed on them (Sanders and Ryther, 1980). Both traditional Type II MSD and AWT effluent concentrations exceed the NRWQC for total residual chlorine at the end of the pipe (see Table 2-15). A site-specific evaluation would determine if these discharge concentrations would cause, have the potential to cause, or contribute to non-attainment of water quality standards in a given receiving water. As discussed in subsection 2.4.1 above, this may be less of a concern for AWTs because detection limits for these samples are generally higher than the NRWQC (the minimum detection limit reported by most analytical labs was 100 μg/l). This may artificially increase the average concentration from AWTs because the detection limit was used for nondetect samples when calculating an average, and the majority of samples from AWTs were nondetect samples (total residual chlorine was detected in only 41 of 547 samples in Alaska). Detection limits do not pose a similar issue for traditional Type II MSD discharges, as total residual chlorine was detected in 12 of 18 traditional Type II MSD effluent samples at concentrations above the minimum detection limit. The source for total residual chlorine in traditional Type II MSD effluent is the chlorination step in wastewater treatment. Chlorination is used in traditional Type II MSDs to meet fecal coliform and total suspended solids standards by killing pathogens in the wastewater.
2-30

December 29, 2008
Table 2-15. Comparison of Traditional Type II MSD and AWT Effluent to Numeric
National Recommended Water Quality Criteria for Total Residual Chlorine
Analyte
Average Concentration in Traditional Type II MSD Effluent1
Average Concentration in AWT Effluent2
NRWQC Criteria
Maximum Concentration
(CMC)3
NRWQC Criterion
Continuous Concentration
(CCC)3
Total Residual Chlorine (μg/l) 1,070* 338*^ 13 7.5 1 Based on data collected by the Alaska Cruise Ship Initiative (ACSI) in 2000; of 21 vessels sampled, 19 had
traditional Type II MSDs and 2 had prototype reverse osmosis treatment systems. 2 Based on data collected by ADEC/Coast Guard from 2003 to 2005; data collected by EPA in 2004; and data
collected through EPA’s 2004 cruise ship survey. 3 The National Recommended Water Quality Criteria for chlorine in marine waters are expressed as chlorine-
produced oxidants (CPOs) as measured by total residual chlorine. * Average includes at least one nondetect value; this calculation uses detection limits for nondetected results. ^ The minimum detection limit reported for total residual chlorine was generally 100 μg/l. Because chlorine was not
detected in most AWT effluent samples (total residual chlorine was detected in only 41 of 547 samples), the average presented here is weighted higher due to the use of the detection limit for nondetect samples. See section 2.4.1 for further discussion.
Metals In the aquatic environment, elevated concentrations of metals can be toxic to many species of algae, crustaceans, and fish. Exposure to metals at toxic levels can cause a variety of changes in biochemical, physiological, morphological, and behavioral patterns in aquatic organisms. One of the key factors in evaluating metal toxicity is the bioavailability of the metal in a waterbody. Some metals have a strong tendency to adsorb to suspended organic matter and clay minerals, or to precipitate out of solution, thus removing the metal from the water column. The tendency of a given metal to adsorb to suspended particles is typically controlled by the pH and salinity of the waterbody. If the metal is highly sorbed to particulate matter, then it is likely not in a form that organisms can process. Therefore, a high concentration of a metal measured in the total form may not be an accurate representation of the toxic potential to aquatic organisms. Accordingly, NRWQC for the protection of aquatic life for metals are typically expressed in the dissolved form. In contrast, human health criteria (for the consumption of organisms) for metals are commonly expressed in the total metal form. The use of total metals for human health criteria is because human exposure to pollutants is assumed to be through the consumption of organisms, where the digestive process is assumed to transform all forms of metals to the dissolved phase, thus increasing the amount of biologically available metals. ACSI did not report any dissolved metal data for traditional Type II MSD effluent. ACSI data for total metals in traditional Type II MSD effluent were consistently below the NRWQC for human health (for the consumption of organisms). AWT effluent data show most metals at levels below the NRWQC for human health and aquatic life. Several dissolved metals that are common components of ship piping -- copper, nickel, and zinc -- were found at levels approximately one to four times above NRWQC for aquatic life (see Table 2-16). A site-specific evaluation would determine if these discharge concentrations would cause, have the potential to cause, or contribute to non-attainment of water quality standards in a given receiving water.
2-31

December 29, 2008
However, as discussed in section 2.4.3 on Mixing and Dilution below, these analytes would likely meet NRWQC after initial mixing (about 1 to 7 meters from the ship) even when a vessel is at rest.
Table 2-16. Comparison of AWT Effluent to National Recommended Water Quality Criteria for Metals
Analytes that Exceed One or More
NRWQC1
Average Concentration in Cruise Ship AWT
Effluent2
NRWQC Criteria
Maximum Concentration
(CMC)
NRWQC Criterion
Continuous Concentration
(CCC)
Copper (Dissolved) (μg/l) 13.7* 4.8 3.1
Nickel (Dissolved) (μg/l) 13.3* 74 8.2
Zinc (Dissolved) (μg/l) 185* 90 81 1 Analytes are not listed in this table if the number of detects was not considered representative of cruise ship
effluent (i.e., less than 10% of samples), if the data were not in the correct form for comparison with NRWQC, or if the average concentration was driven by detection limits.
2 Based on data collected by ADEC/Coast Guard from 2003 to 2005; data collected by EPA in 2004; and data collected through EPA’s 2004 cruise ship survey.
* Average includes at least one nondetect value; this calculation uses detection limits for nondetected results. Semivolatile and Volatile Organics Tables 2-17 and 2-18 present the organic compounds detected in traditional Type II MSD and AWT effluent that exceed NRWQC. Note that effluent from traditional Type II MSDs was not tested for all organic compounds that have a NRWQC. The magnitude of the exceedances of NRWQC for the semivolatile and volatile organic compounds discussed in this subsection ranged from one to four times the standard. A site-specific evaluation would determine if effluent from traditional Type II MSDs or AWTs would cause, have the potential to cause, or contribute to non-attainment of water quality standards in a given receiving water. However, as discussed in section 2.4.3 below, these analytes would likely meet NRWQC after initial mixing (about 1 to 7 meters from the ship) even when a vessel is at rest.
Table 2-17. Comparison of Traditional Type II MSD Effluent to National Recommended Water Quality Criteria for Semivolatile and Volatile Organics
Analytes that Exceed One or More NRWQC1,2
Average Concentration in Traditional Type II MSD Effluent3
NRWQC Human Health
(for the Consumption of
Organisms)
Bis(2-ethylhexyl) phthalate (μg/l) 3.5* 2.2
Carbon tetrachloride (μg/l) 2.0* 1.6
Bromodichloromethane (μg/l) 34* 17
Dibromochloromethane (μg/l) 27* 13
Tetrachloroethylene (μg/l) 13* 3.3
2-32

December 29, 2008
1 Analytes are not listed in this table if the number of detects was not considered representative of cruise ship effluent (i.e., less than 10% of samples), if the data were not in the correct form for comparison with NRWQC, or if the average concentration was driven by detection limits.
2 Traditional Type II MSD effluent data were not available for all analytes that have a NRWQC. Therefore, this table may not include all analytes that exceed NRWQC.
3 Based on data collected by ACSI in 2000; of 21 vessels sampled, 19 had traditional Type II MSDs and 2 had prototype reverse osmosis treatment systems.
* Average includes at least one nondetect value; this calculation uses detection limits for nondetected results.
Table 2-18. Comparison of AWT Effluent to National Recommended Water Quality Criteria for Semivolatile and Volatile Organics
Analytes that Exceed One or More NRWQC1
Average Concentration in Cruise Ship AWT
Effluent2
NRWQC Human Health
(for the Consumption of
Organisms)
Tetrachloroethylene (μg/l) 5.59* 3.3 1 Analytes are not listed in this table if the number of detects was not considered representative of cruise ship
effluent (i.e., less than 10% of samples), if the data were not in the correct form for comparison with NRWQC, or if the average concentration was driven by detection limits.
2 Based on data collected by ADEC/Coast Guard from 2003 to 2005; data collected by EPA in 2004; and data collected through EPA’s 2004 cruise ship survey.
* Average includes at least one nondetect value; this calculation uses detection limits for nondetected results. Bis(2-ethylhexyl) phthalate is a manufactured chemical that is commonly added to plastics to make them flexible and can be found in a variety of common products such as wall coverings, tablecloths, floor tiles, furniture upholstery, and shower curtains. Carbon tetrachloride is used as an industrial and chemical solvent in a variety of applications such as household cleaning fluids and as a degreaser in industrial settings. Bromodichloromethane and dibromochloromethane are chlorine byproducts that are generated when chlorine used to disinfect drinking water and wastewater reacts with natural organic matter and/or bromide in water. Tetrachloroethylene is widely used in dry cleaning and for metal-degreasing. Nutrients Sewage contains nutrients, such as nitrogen and phosphorus, which are important elements for aquatic plant and algae growth. The influx of excess nutrients can negatively affect marine ecosystems, resulting in diebacks of corals and seagrasses, eutrophication (oxygen-depleted “dead” zones), and increases in harmful algal blooms that can alter the seasonal progression of an ecosystem and choke or poison other plants and wildlife (National Research Council, 1993). Ammonia is the only nutrient for which there is a numeric saltwater or human health (for the consumption of organisms) NRWQC. In the aquatic environment, ammonia exists in the unionized (NH3) and ionized (NH4
+) form. Unionized ammonia is the more toxic form of the two with several factors such as pH, temperature, and salinity determining the toxicity to aquatic organisms. Acute levels of NH3 that are toxic to fish can a cause a loss of equilibrium,
2-33

December 29, 2008
hyperexcitability, and increased breathing, cardiac output, and oxygen uptake (WHO, 1986). Extreme concentrations can cause convulsions, coma, and even death. The marine NRWQC references EPA’s1989 Ambient Water Quality Criteria for Ammonia (Saltwater) document, which includes a matrix table for ammonia standards based on the pH, temperature, and salinity of a waterbody. Table 2-19 presents the average concentration of ammonia in traditional Type II MSD and AWT effluent. Table 2-20 presents examples of the ammonia NRWQC calculated from pH, temperature, and salinity for some cruise ship ports of call in the United States.
Table 2-19. Ammonia Concentration in Traditional Type II MSD and AWT Effluent
Analyte
Average Concentration in Traditional Type II MSD Effluent1
Average Concentration in
Cruise Ship AWT Effluent2
Ammonia (NH3-N μg/l) 145,000 36,600* 1 Based on data collected by ACSI in 2000; of 21 vessels sampled, 19 had traditional Type II MSDs and 2 had
prototype reverse osmosis treatment systems. 2 Based on data collected by ADEC/Coast Guard from 2003 to 2005; data collected by EPA in 2004; and data
collected through EPA’s 2004 cruise ship survey. * Average includes at least one nondetect value; this calculation uses detection limits for nondetected results.
Table 2-20. Calculated Ammonia NRWQC for Some Cruise Ship Ports of Call in the United States
Location State pH
Average Temperature
(°C) Salinity
(psu)
Ammonia NRWQC Criteria Maximum
Concentration (CMC) (NH3-N μg/l)4
Ammonia NRWQC Criterion Continuous Concentration (CCC)
(NH3-N μg/l)4
Galveston Bay1 TX 8.1 29.0 14.0 2,140 321
Honolulu Harbor1 HI 8.0 25.5 34.4 4,110 617
Los Angeles Harbor1 CA 8.1 17.4 32.6 7,110 1,110
Port of Miami2 FL 8.0 25.3 32.0 4,110 617
Monterey Harbor1 CA 8.1 15.3 32.9 6,860 1,070
New York Harbor1 NY 7.5 22.1 22.9 11,500 2,960
Southeast Alaska3 AK 7.8 12.5 20.0 15,600 2,340
Portland Harbor1 ME 7.8 19.4 29.6 9,040 1,400 1 Data source: EPA’s EMAP National Coastal Database (http://oaspub.epa.gov/coastal/coast.search) 2 Data source: South Florida Water Management District Monitoring Stations
(http://glades.sfwmd.gov/pls/dbhydro_pro_plsql/water_quality_interface.main_page) 3 Data source: Draft State of Alaska Department of Environmental Conservation Large Commercial Passenger
Vessel Wastewater Discharge General Permit No. 2007DB0002 (www.dec.state.ak.us/water/cruise_ships/pdfs/PN%20Version%20LPV%20WWGP%20-%20DRAFT.pdf)
2-34

December 29, 2008
4 Ammonia standards were calculated based on pH, temperature, and salinity values for each waterbody using the matrix table provided in EPA’s 1989 Ambient Water Quality Criteria for Ammonia (Saltwater) document. In cases where measured values fell between column and row headings for pH and temperature the standard was approximated based on the closest value. In addition, the ammonia standards were converted from μg-NH3/l to μg-NH3-N/l by multiplying the standard by 0.822.
Average effluent concentrations of ammonia from traditional Type II MSDs and AWTs exceed all of the waterbody ammonia standards presented in Table 2-20. Although ammonia standards can vary from waterbody to waterbody, there is only a small range of pH, temperature, and salinity values that result in an ammonia standard that traditional Type II MSD and AWT average effluent concentrations will not exceed. This suggests that ammonia concentrations in traditional Type II MSDs and AWTs effluent at the end-of-pipe are likely to exceed NRWQC regardless of the receiving water parameters used to calculate the criterion. A site-specific evaluation would determine if these discharge concentrations would cause, have the potential to cause, or contribute to non-attainment of water quality standards in a given receiving water. In addition to the ammonia standard, EPA has established criteria for the general category of nutrients. The NRWQC references EPA’s nutrient ecoregional criteria documents for lakes and reservoirs, rivers and streams, and wetlands. At this time, EPA has not developed ecoregional criteria for estuarine or marine systems; however, EPA has developed a guidance manual for establishing nutrient criteria in estuarine and marine waters. In the 2001 Nutrient Criteria Technical Guidance Manual for Estuarine and Coastal Marine Waters, EPA states that:
[N]utrient criteria need to be established on an individual estuarine or coastal water system basis and must be appropriate to each waterbody type. They should not consist of a single set of national numbers or values because there is simply too much natural variation from one part of the country to another. Similarly, the expression of nutrient enrichment and its measurement vary from one waterbody type to another. For example, streams do not respond to phosphorus and nitrogen in the same way that lakes, estuaries or coastal waters.
To account for the extreme variations in residence time, salinity, and density profiles observed in estuaries and coastal waters, EPA recommends using a reference condition approach for setting nutrient criteria in marine waters (EPA, 2001). A reference condition is defined as the comprehensive representation of data, such as median total nitrogen, total phosphorus, and chlorophyll values, from minimally impacted or “natural” sites on a waterbody or from within a similar class of waterbodies (EPA, 2001). Once a reference condition is established, modeling and local expert analysis of the data are used to establish a criterion for each nutrient (e.g., total nitrogen and total phosphorus) to reflect the optimal nutrient condition for the waterbody in the absence of cultural impacts. Although there are no national standards for nutrient criteria in coastal waters, some states have established waterbody-specific or state-wide standards for nutrients based on site-specific evaluations. For example, Hawaii has established nutrient criteria for several different categories of coastal waters, such as estuaries, embayments, open coastal waters, oceanic waters, and specifically for Pearl Harbor. Nutrient criteria in Hawaii include limitations on total nitrogen,
2-35

December 29, 2008
ammonia, nitrate/nitrite, total phosphorus, chlorophyll, and turbidity. Hawaiian nutrient criteria are expressed as follows: criteria values which the geometric mean of samples is not to exceed, criteria values which sample values are not to exceed more than 10% of the time, and criteria values which sample values are not to exceed more than 2% of the time. This tiered approach to nutrient criteria allows for the natural variability in nutrient concentrations in the environment. Table 2-21 provides a subset of the criteria values for the different waterbody classifications in Hawaii. Stakeholders interested in site-specific nutrient criteria should consult their state water quality standards for additional information on state-wide or waterbody-specific nutrient criteria.
Table 2-21. Hawaii Nutrient Criteria Values Which the Geometric Mean of Samples Is Not to Exceed
Analyte
All Estuaries Except Pearl
Harbor Pearl
Harbor Embayments Open Coastal
Waters Oceanic Waters
Total Nitrogen (μg/l) 200 300 2001 1502
1501 1102
50
Ammonia Nitrogen (μg N/l)
6 10 61 3.52
3.51 22
1
Nitrate + Nitrite (μg N/l)
8 15 81 52
51 3.52
1.5
Total Phosphorus (μg p/l)
25 60 251 202
201 162
10
Chlorophyll (μg/l)
2 3.5 1.51 0.52
0.31 0.152
0.06
Turbidity (NTU)
1.5 4 1.51 0.42
0.51 0.22
0.03
1 Wet criteria apply when the average fresh water inflow from the land equals or exceeds 1% of the embayment volume per day.
2 Dry criteria apply when the average fresh water inflow from the land is less than 1% of the embayment volume per day.
2.4.3 Mixing and Dilution Although average analyte concentrations in Type II MSD and AWT discharges from cruise ships exceed several NRWQC at the end-of-pipe, the mixing and dilution that occurs following discharge also is relevant to an evaluation of potential environmental impact. Dilution at Rest A Science Advisory Panel created by the ACSI used the Cornell Mixing Zone Expert System model to estimate dilution of effluent achieved when a vessel is at rest. Their modeling showed that a discharge rate of 50 m3/hr yields a dilution factor of 36 at a distance of about 4.5 m from the ship, and a dilution factor of 50 at 7 m from the ship after 43 seconds (ADEC, 2002, Appendix 8, footnote 50).
2-36

December 29, 2008
The ADEC modeled the dilution of large cruise ship effluent during stationary discharge under a very conservative scenario (a neap tide in Skagway Harbor), using the Visual Plumes model. Their modeling showed the dilution factors ranging from 5 to 60, which would occur between 1 and 7 meters from the ship (ADEC, 2004). Such dilution factors may not necessarily apply to situations where the discharge port faces a dock, pilings, or other obstruction. The initial dilution estimated by ACSI and ADEC for a vessel at rest suggests that most of the pollutants in traditional Type II MSD effluent that were above NRWQC at the end-of-pipe would likely meet NRWQC after initial mixing when the vessel is at rest. However, for three pollutants -- fecal coliform (see Table 2-12 and discussion below), total residual chlorine (see Table 2-15), and ammonia (see Tables 2-19 and 2-20) -- end-of-pipe discharge levels are high enough that they may not meet NRWQC after initial mixing when the vessel is at rest. A site specific evaluation would determine if these discharge concentrations would cause, have the potential to cause, or contribute to non-attainment of water quality standards in a given receiving water. As discussed in subsection 2.4.2 above, a few dissolved metals, tetrachloroethylene, chlorine, and ammonia in the effluent from AWTs may exceed certain NRWQC at the end-of-pipe. In the case of the metals and tetrachloroethylene, the exceedances at the end-of-pipe were approximately one to four times the NRWQC. Therefore, these analytes would likely meet NRWQC after initial mixing when the vessel is at rest, based on the initial dilution factors discussed above. In the case of chlorine, the exceedance was 45 times the most stringent NRWQC. However, the detection limit for chlorine is generally about 13 times greater than the NRWQC, and thus may artificially increase the average concentration from AWTs (because the detection limit is used for nondetect samples and chlorine was only detected in 41 of 547 samples). Therefore, chlorine from AWT effluent also may meet NRWQC after initial mixing in most cases. The NRWQC for ammonia depends on pH, temperature, and salinity of the waterbody, resulting in a large range of potential values for cruise ship ports around the country (see Table 2-20). Consequently, the amount of potential exceedance from AWTs at the end-of-pipe varies, but the range based on the values presented in Table 2-20 is 2 to 114 times, and in most cases is less than 34 times the calculated NRWQC. Therefore, ammonia from AWTs would likely meet most water quality standards after initial mixing when the vessel is at rest, based on the initial dilution factors discussed above. It is important to note that the initial mixing estimates discussed above are based on ship-specific and waterbody-specific input parameters such as discharge port size, effluent flow, waterbody temperature, and salinity. Therefore, they are not necessarily representative of the dilution factors that would be achieved by cruise ships in other ports of call in the United States. Site-specific and ship-specific calculations would be needed to determine the dilution for ships in other locations. Dilution Underway For vessels underway, there is significant additional dilution due to movement of the vessel and mixing by ship propellers. In 2001, EPA conducted dye dispersion studies behind four large
2-37

December 29, 2008
cruise ships while underway off the coast of Miami, Florida. The results of this study indicate that dilution of discharges behind cruise ships moving at between 9.1 and 17.4 knots are diluted by a factor of between 200,000:1 and 640,000:1 immediately behind the boat (EPA, 2002). Based on these dilution factors, effluent from traditional Type II MSDs and AWTs would likely meet all NRWQC while underway. Using this information, the ACSI Science Advisory Panel (ADEC, 2002) determined that the dilution for a ship underway is a function of the speed of the cruise ship, the rate of wastewater discharge, the beam (i.e., width) of the cruise ship, and the draft (i.e., depth) of the cruise ship, according to the following equation: Initial Dilution Factor = 4 * (Ship Width [m] • Ship Draft [m] • Ship Speed [m/sec]) for Ships Underway Volume Discharge Rate [m3/sec] For example, using a typical large cruise ship (ship width = 31 m; ship draft = 7.8 m) discharging from an AWT (volume discharge rate = 0.00707 m3/sec or 25 m3/hr) and traveling at 6 knots (3.09 m/sec) would result in a dilution factor of 420,000. 2.4.4 Potential Treatment Technologies in Addition to AWTs As part of its assessment of the large cruise ship sewage and graywater discharge standards in Alaska, EPA is evaluating upgrades to AWTs and technologies that could be added on to AWTs that would improve the quality of the treated effluent in terms of nutrients, metals, and temperature. These technologies have not been used or tested on cruise ships for the treatment of sewage or graywater. However, EPA believes these technologies are potentially feasible for this application because they currently are used in other shipboard applications or because they currently are used in land-based wastewater treatment facilities and could be adapted for shipboard application. Use of these technologies onboard large cruise ships would require engineering studies to adapt existing designs and materials selection (e.g., metallurgy, membrane and resin selection, loading rates, reliability, space constraints), operating parameters (e.g., pressures, temperatures, service and maintenance cycles), and training for operating personnel to ensure effective and consistent performance and minimize operating costs. Nutrient Removal Technologies Ammonia Removal by Biological Nitrification Biological nitrification is a two-step process that converts ammonia to nitrate using nitrifying autotrophic bacteria (nitrosomonas and nitrobacter) in the aerobic activated sludge process. The equation below shows the two-step conversion of ammonia to nitrate in the treatment process (Metcalf & Eddy, 1991).
Step 1: NH4+ + 3/2O2 NO2
- + 2H+ + H2O Step 2: NO2
- + 1/2O2 NO3-
2-38

December 29, 2008
All activated sludge processes, including those sampled on the cruise ships, have nitrifying bacteria present, although their numbers are much lower than the typical microorganisms that use organic carbon (measured as BOD5) as their food source. To enhance ammonia removal in the combined carbon oxidation and nitrification process, land-based sewage treatment plants (publicly owned treatment works (POTWs)) have made both equipment modications and operational changes. These enhancements have allowed POTWs to achieve ammonia nitrogen levels much less than one mg/l, with a corresponding increase in effluent nitrate concentration. Cruise ships would require equipment modifications and operational changes to enhance existing AWTs. Possible equipment modifications would include increased hydraulic retention time and additional aeration equipment to increase the amount of oxygen transferred to the activated sludge process. Possible operational modifications would include longer sludge retention times and optimized temperature, pH, and alkalinity control. Nitrification converts ammonia to nitrate, but does not reduce total nitrogen. Total Nitrogen Removal by Ion Exchange Ion exchange for ammonia removal from cruise ship effluent is a process in which effluent from the UV disinfection system would be passed through a cylindrical tank containing a weak-acid ion exchange resin. Ammonium ions (NH4
+) present at neutral pH would become bound to the resin due to the negative charge on the resin. When the resin is fully saturated with ammonium ions, it could be either regenerated onboard using a highly-concentrated salt solution or regenerated shore side by a waste management company. Theoretically, ion exchange could remove 100% of ammonia. However, wastes generated from resin regeneration onboard would have to be appropriately managed, including an assessment against the Resource Conservation and Recovery Act (RCRA) hazardous waste regulations at 40 CFR 262.11 (see Section 6 for further discussion). The costs and potential environmental concerns associated with management of these wastes would need to be considered as part of the assessment of this technology. Cruise ships would need to either purchase and install the add-on ion exchange technology and all necessary ancillary equipment, or rent ion exchange canisters from a vendor (who would handle resin regeneration) and purchase and install all necessary ancillary equipment. Operating and maintenance costs would include rental and labor for exchange of the rental units (if applicable), labor and salt brine costs for onboard regeneration (if applicable), operating labor, electrical costs, and maintenance equipment costs. Ion exchange would remove ammonia from the wastewater, thereby reducing total nitrogen in the effluent. (This compares to biological nitrification, which does not reduce total nitrogen but instead converts one form of nitrogen to another -- relatively toxic ammonia to relatively nontoxic nitrate.) This cation exchange technology would not remove other forms of nitrogen, such as nitrogen oxyanions and nonionic organic nitrogen. However, these forms are present at only low concentrations in AWT effluent. The average nitrate/nitrite concentration in AWT
2-39

December 29, 2008
effluent is 3.32 mg/l, which is less than one-tenth the concentration of ammonia. There is little or no organic nitrogen in the AWT effluent as the concentration of total Kjeldahl nitrogen (which measures organic nitrogen plus ammonia) is almost the same as the concentration of ammonia. Phosphorus Removal by Chemical Precipitation Phosphorus is typically removed at sewage treatment plants by one of two methods: enhanced biological uptake or chemical precipitation. Since enhanced biological uptake is a complex process that would require significant modifications to the existing AWT, EPA instead evaluated chemical precipitation. Chemical precipitation of phosphorus is performed at sewage treatment plants by adding ferric chloride, ferrous chloride, or aluminum sulfate (alum) to the aeration tanks of the activated sludge plants. The precipitated iron or aluminum phosphate is removed with the biological sludge. One advantage of ferric or ferrous chloride over alum is that ferric or ferrous chloride typically achieves the same removal as alum using a lower dosage. On average, phosphorus precipitation at sewage treatment plants reduces total phosphorus levels to 0.8 mg/l in the effluent. Cruise ships would need to purchase and install a chemical feed system to add ferric or ferrous chloride to the AWT bioreactors. Operating and maintenance costs for the chemical feed system would include operating labor, energy, chemicals, and maintenance equipment. Metals Removal Technologies Metals Removal by Ion Exchange Ion exchange for metals removal from cruise ship effluent is a process in which effluent from the UV disinfection system would be passed through a cylindrical tank containing a chelating resin. Metal ions would become bound to the resin. When the resin is fully saturated with metal ions, it could be regenerated onboard with an acid solution. The resulting regeneration solution from metals removal would contain the target metals and have a pH less than two. Alternatively, the resin canister could be regenerated shore-side by a waste management company. Theoretically, ion exchange could remove 100% of metals such as copper, nickel, zinc and mercury. However, wastes generated from resin regeneration onboard would have to be appropriately managed, including an assessment against the RCRA hazardous waste regulations at 40 CFR 262.11 (see Section 6 for further discussion). The costs and potential environmental concerns associated with management of these wastes would need to be considered as part of the assessment of this technology. Cruise ships would need to either purchase and install the add-on ion exchange technology and all necessary ancillary equipment, or rent ion exchange canisters from a vendor (who would handle resin regeneration) and purchase and install all necessary ancillary equipment. Operating and maintenance costs would include rental and labor for exchange of the rental units (if applicable), labor and regeneration solution costs for onboard regeneration (if applicable), operating labor, electrical costs, and maintenance equipment costs.
2-40
December 29, 2008
Metals Removal by Reverse Osmosis Reverse osmosis is a process in which dissolved ions would be removed from AWT effluent using pressure to force the water through a semipermeable membrane element, which would pass the water but reject most of the dissolved materials. This membrane separation process is expected to remove more than 90% of copper, nickel, zinc, and mercury from AWT effluent (FILMTEC, 1998). Reverse osmosis also would remove other metals and other analytes in cruise ship effluent, including other chlorinated solvents, phenol- and benzene-based organic compounds, and possibly pharmaceuticals and personal care products. Reverse osmosis is expected to generate a concentrate stream that is approximately 15% of the total influent flow. This concentrate stream would have to be appropriately managed, including an assessment against the RCRA hazardous waste regulations at 40 CFR 262.11 (see Section 6 for further discussion). The costs and potential environmental concerns associated with management of this waste would need to be considered as part of the assessment of this technology. Cruise ships would need to purchase and install the add-on reverse osmosis technology and all necessary ancillary equipment. Operating and maintenance would include operating labor, electricity, membrane replacement, and membrane cleaning chemicals. Temperature Control One method of reducing temperature would be to install a shell and tube heat exchanger that transfers heat from the AWT effluent to a recirculating cold water system. Shell and tube heat exchangers are simply designed, able to operate under varying heat loads, and easily serviced. The recirculating cold water that passes through the heat exchanger to reduce the effluent temperature could be provided by either the vessel’s existing chilled water system or by a separate chilled water system designed specifically for heat removal from the final effluent. Cruise ships would need to purchase and install the add-on heat exchanger, as well as a new chiller if the existing chiller does not provide a sufficient volume of cold water to cool the effluent. Operating and maintenance costs for the heat exchanger system would include operating labor (e.g., start-up and shut-down maintenance at the start and end of the Alaska cruise season), electricity, and maintenance equipment. 2.5 What action is the federal government taking to address sewage from cruise ships? EPA is evaluating the performance of advanced sewage and graywater treatment systems. EPA is evaluating the performance of various advanced sewage and graywater treatment systems as part of its effort to assess whether revised or additional standards for sewage and graywater discharges from large cruise ships operating in Alaska are warranted under Title XIV (see subsection 2.2.3). Some of the results of this intensive effort, including sampling four different AWTs and a survey questionnaire for all cruise ships operating in Alaska in 2004, are
2-41

December 29, 2008
summarized in this Assessment Report. EPA anticipates making these full analyses publicly available in 2009. As part of this effort, EPA, in conjunction with the ADEC, conducted a scientific survey in July 2008 using EPA’s Ocean Survey Vessel Bold to (1) measure the dilution of AWT discharges from stationary cruise ships, and (2) evaluate the potential environmental impact of nutrients in AWT discharges. EPA anticipates making the results of these studies publicly available in 2009. Coast Guard has developed regulations implementing the monitoring requirements of Title XIV. Under Title XIV, the Coast Guard has implemented an inspection regime that includes sampling of cruise ship sewage and graywater discharges in Alaskan waters. In July 2001, the Coast Guard published a final rule (33 CFR 159.301-321) that outlines its oversight of cruise ship sampling in Alaskan waters. Coast Guard is conducting a review of its inspection and enforcement policies. The Coast Guard has started a review of their inspection and enforcement policies and regulations for cruise ship environmental practices. This review includes a survey of inspectors from Coast Guard regions, focusing on MSDs, oil/water separators, and the effectiveness and feasibility of various inspection practices. California National Marine Sanctuaries propose to prohibit cruise ship sewage discharges. Under the National Marine Sanctuaries Act (16 U.S.C. § 1431 et seq.), the Monterey Bay, Gulf of the Farallones, and Cordell Bank National Marine Sanctuaries have proposed regulations to prohibit the discharge of treated and untreated sewage from large vessels, including cruise ships (71 FR 59050, Oct. 6, 2006; 71 FR 59338, Oct. 6, 2006; 71 FR 59039, Oct. 6, 2006). NOAA is currently reviewing the comments on these proposed rules. The Channel Islands National Marine Sanctuary has published a proposed rule (73 CFR 16580, March 28, 2008) to revise a proposed action concerning vessel discharges (71 FR 29096, Oct. 5, 2006). The proposed rule containing the revision includes a prohibition on treated and untreated sewage from cruise ships. NOAA is currently reviewing the comments on this proposed rule. National Park Service manages cruise ship waste streams in Glacier Bay National Park. The National Park Service (NPS) manages cruise ship waste streams indirectly in Glacier Bay National Park through competitively awarded concession contracts. The NPS has jurisdiction over the submerged lands and marine waters of Glacier Bay National Park up to 3 miles from the mean high tide line and including all of Glacier Bay proper. Glacier Bay is a well known, very popular attraction for the cruise ship industry in Alaska. Recent environmental reviews and decisions allow up to two cruise ship entries per day into Glacier Bay proper during the primary visitor season. Cruise ship operations in the park are authorized under concession contracts, which are awarded under a competitive solicitation and prospectus process. Impact on park resources is a general standard selection criterion for park concessions. The NPS uses waste stream management as one of a number of selection criteria in this regard. In the past, cruise ship operators have usually proposed to minimize the impact of waste streams by committing to a no-discharge policy while in the park (even if legal under applicable law) for sewage, graywater, ballast water, bilge water, cooling water, hazardous waste, and solid waste. If awarded a contract, companies must comply with their proposal. Typically cruise ships operate
2-42
December 29, 2008
in the park for 8-10 hours and then depart. Cruise ships do not dock or transfer any wastes to shore while in the park. 2.6 Possible Options and Alternatives to Address Sewage from Cruise Ships Based on the public comments received on the draft of this report as well as other information gathered, listed below are a wide range of options and alternatives that address sewage from cruise ships. Identification of any particular option does not imply any EPA recommendation or preference for future action, or that EPA has determined that any of these options are necessary or feasible, or that EPA believes a change to the status quo is warranted, or that EPA or any other entity has the legal authority to implement that option. Prevention & Reduction
Establish standards or best management practices for operation, maintenance and/or training that will decrease or eliminate the contaminants and/or volume of treated sewage effluent, untreated sewage, and/or wastewater residuals.
Control: Discharge Standards
Revise standards for the discharge of treated sewage effluent, for example, o to require attainment of national federal water quality criteria at point of
discharge. o to require attainment of national federal water quality criteria at edge of a mixing
zone. o to require attainment of state water quality standards. o to require attainment of secondary treatment standards for publicly owned
treatment works. o to require attainment of the effluent standards in MARPOL Annex IV. o to require the reduction attainable through application of the best available
technology economically achievable. o to require technology that would eliminate remaining pollutants of concern (i.e.,
reduce to level below concern). o to require use of Advanced Wastewater Treatment systems. o to apply Title XIV standards (which apply in certain Alaskan waters) nationwide. o to address additional parameters, e.g., additional pathogen indicators. o to account for potential bioaccumulation. o to require periodic sampling and testing. o to require attainment of CWA section 312 standards at point of discharge. o to require more stringent standards in areas frequented by multiple cruise ships.
Control: Geographic Restrictions on Discharge
Restrict discharge of treated sewage effluent, for example, o no discharge out to a certain distance (e.g., 3 miles from shore, 12 miles from
shore, 12 nautical miles from the 20-meter contour line). o no discharge in or within a certain distance (e.g., 0.5 nautical miles, 4 nautical
miles) of sensitive areas (e.g., shellfish, ports, coral reefs, bathing beaches, water
2-43

December 29, 2008
bodies with restricted circulation, flushing or inflow, marine protected areas, breeding grounds, near large population centers).
o shoreside discharge of all treated sewage effluent. o withhold discharge when a system upset occurs. o establish specific sensitive areas (e.g., Glacier Bay National Park waters) as NDZs
for large cruise ships pursuant to CWA Section 312. Restrict discharge of untreated sewage, for example,
o no discharge out to a certain distance (e.g., 12 miles from shore). o no discharge in any U.S. waters. o treatment of all sewage when in U.S. waters.
Restrict discharge of wastewater residuals, for example, o no discharge out to a certain distance (e.g., 12 miles from shore). o no discharge in any U.S. waters. o shore-side discharge only (off-load to approved land-based facility). o require ports where cruise ships call to accept off-loading of wastes.
Enforcement & Compliance Assurance: Monitoring
Require sampling and testing of MSD/AWT effluent to ensure that it meets applicable standards
o by government agencies with enforcement authority. o by third-parties. o by cruise lines.
Require onboard observers to monitor all sampling, monitoring, and other effluent-related requirements/to oversee discharging practices, equipment operation and maintenance, and the completion and submittal of accurate logbooks.
Require rapid testing methods for pathogen indicators. Enforcement & Compliance Assurance: Reporting
Require certain reporting by cruise ship operators, for example, o immediate notification to appropriate agencies in the event of an MSD/AWT
malfunction or upset. o disclosure of implementation or non-implementation of pollution reduction and
prevention practices, including but not limited to MSDs and AWTs, in all advertisements in the U.S.
o advance notification from ships planning to discharge in U.S. waters. o notification to appropriate agencies of all discharges of treated sewage effluent,
untreated sewage, and wastewater residuals in U.S. waters. o notification of discharges in state waters to appropriate state agencies.
Require electronic transponders to signal land-based authorities when a discharge line is opened or closed.
Enforcement & Compliance Assurance: Inspections & Enforcement
Increase penalties for failure to meet MSD standards, including for tampering with MSDs or selling non-certified MSDs, and failing to install an approved MSD on a ship.
Increase inspections and inspection requirements.
2-44

December 29, 2008
Establish a funding mechanism based on the polluter-pays model that will provide revenues to develop and implement a comprehensive regulatory scheme.
Impose uniform requirements on all ships as a condition of port entry and within waters under the jurisdiction of the U.S. consistent with international law, regardless of flag state.
Prohibit or otherwise restrict noncompliant vessels (and sister ships, depending on the degree of involvement by parent companies) from operating in sensitive areas of the marine environment under U.S. jurisdiction.
2-45

December 29, 2008
References Alaska Department of Environmental Conservation (ADEC). 2000a (September 13). Alaska
Cruise Ship Initiative Interim Report; Memorandum to Governor Tony Knowles. Juneau, AK. (www.dec.state.ak.us/water/cruise_ships/pdfs/interimrep.pdf)
Alaska Department of Environmental Conservation (ADEC). 2000b. Alaska Cruise Ship
Initiative Part 1 Final Report. Juneau, AK. (www.dec.state.ak.us/water/cruise_ships/pdfs/finreportp10808.pdf)
Alaska Department of Environmental Conservation (ADEC). 2001. Alaska Cruise Ship Initiative
Part 2 Report. Juneau, AK. (www.dec.state.ak.us/water/cruise_ships/pdfs/acsireport2.pdf)
Alaska Department of Environmental Conservation (ADEC). 2002. The Impact of Cruise Ship
Wastewater Discharge on Alaska Waters. Juneau, AK. (www.dec.state.ak.us/water/cruise_ships/pdfs/impactofcruiseship.pdf)
Alaska Department of Environmental Conservation (ADEC). 2004. Assessment of Cruise Ship
and Ferry Wastewater Impacts in Alaska. Juneau, AK. (www.dec.state.ak.us/water/cruise_ships/assessreport04.htm)
Booth, P.M., Jr., Sellers, C.M., Jr., & Garrison, N.E. 1981. Effects of Intermittent Chlorination
on Plasma Proteins of Rainbow Trout (Salmo gairdneri). Bull. of Env. Contam. & Tox 26(2): 163-170.
Choi, Charles. 2007 (March 25). Cruise Ships Face Tough New Waste Disposal Limits -
Industry Says Its Self-Policing Negates Need for Crackdown. New York Times. (http://travel.nytimes.com/2007/03/25/travel/25heads.html?pagewanted=print) Cruise Lines International Association (CLIA). 2006. CLIA Industry Standard: Cruise Industry
Waste Management Practices and Procedures. Fort Lauderdale, FLr. (www.cruising.org/industry/PDF/CLIAWasteManagementAttachment.pdf and www.cruising.org/industry/PDF/CLIAWasteManagement.pdf)
Extoxnet. 1996. Pesticide Information Profiles: Simazine. Oregon State University.
(http://extoxnet.orst.edu/pips/simazine.htm) FILMTEC, Dow Chemical Company. 1998 (April). FILMTEC Membranes Fact Sheet:
Estimated Percent Rejection of Various Solutes by FILMTEC Membranes. Midland, MI. (http://www.h2ro.com/_FilmRemo.pdf)
Hydroxyl Systems, Inc. 2007. Hydroxyl CleanSea® Integrated Shipboard Wastewater Treatment
Process. Victoria, British Columbia. (http://www.hydroxyl.com/_pdfs/literature_cleansea.pdf)
2-46

December 29, 2008
Metcalf & Eddy. 1991. Wastewater Engineering: Treatment and Reuse, Third Edition. New York, NY: McGraw Hill.
National Research Council (NRC): Committee on Wastewater Management for Coastal Urban
Areas, Water Science and Technology Board, Commission on Engineering and Technical Systems. 1993. Managing Wastewater in Coastal Urban Areas. Washington, DC: National Academy Press. (http://www.nap.edu/catalog.php?record_id=2049#toc)
National Research Council (NRC): Committee on Oil in the Sea: Inputs, Fates, and Effects.
2003. Oil in the Sea III: Inputs, Fates, and Effects. Washington, DC: National Academy Press. (http://www.nap.edu/catalog.php?record_id=10388#toc)
Pruss, Annette. 1998. Review of epidemiological studies on health effects from exposure to
recreational water. International Journal of Epidemiology 27: 1-9. Rees, G. 1993. Health Implications of Sewage in Coastal Waters - the British Case. Marine
Pollution Bulletin 26(1): 14-19. Sanders, J.G., & Ryther J.H. 1980. Impact of chlorine on the species composition of marine
phytoplankton. In: R.L. Jolley, et al. (Eds.), Water Chlorination: Environmental Impact and Health Effects 3: 631. Ann Arbor, MI: Ann Arbor Science Publishers.
U.S. Coast Guard. 1999. Policy Guidance for Marine Sanitation Device Acceptance
(16714/159.015). Washington, DC. (http://www.uscg.mil/hq/gm/mse/regs/msdpolicy.html)
U.S. Environmental Protection Agency. 1983. Health Effects Criteria for Marine Recreational
Waters (EPA-600/1-80-031). Research Triangle Park, NC. (http://www.epa.gov/nerlcwww/mrcprt1.pdf)
U.S. Environmental Protection Agency. 1984a. Ambient Water Quality Criteria for Chlorine (EPA 440/5-84-030). Washington, DC. (http://www.epa.gov/ost/pc/ambientwqc/chlorine1984.pdf)
U.S. Environmental Protection Agency. (1984b). Health Effects Criteria for Fresh Recreational
Waters (EPA-600/1-84-004). Research Triangle Park, NC. (http://www.epa.gov/nerlcwww/frc.pdf)
U.S. Environmental Protection Agency. 1986. Quality Criteria for Water (EPA 440/5-86-001).
Washington, DC. (http://www.epa.gov/waterscience/criteria/goldbook.pdf) U.S. Environmental Protection Agency. 1989. Ambient Water Quality Criteria for Ammonia
(Saltwater)( EPA 440/5-88-004). Washington, DC. (http://www.epa.gov/waterscience/pc/ambientwqc/ammoniasalt1989.pdf)
2-47

December 29, 2008
2-48
U.S. Environmental Protection Agency. 1991. Technical Support Document for Water Quality-based Toxics Control (EPA 505-290-001). Washington, DC. (http://www.epa.gov/npdes/pubs/owm0264.pdf)
U.S. Environmental Protection Agency. 2001. Nutrient Criteria Technical Guidance Manual:
Estuarine and Coastal Marine Waters (EPA-822-B-01-003). Washington, DC. (http://www.epa.gov/waterscience/criteria/nutrient/guidance/marine/)
U.S. Environmental Protection Agency. 2002. Cruise Ship Plume Tracking Survey Report
(EPA842-R-02-001). Washington, DC. (http://www.epa.gov/owow/oceans/cruise_ships/plumerpt2002/plumereport.pdf)
U.S. Environmental Protection Agency. 2004. Survey Questionnaire to Determine the
Effectiveness, Costs, and Impacts of Sewage and Graywater Treatment Devices for Large Cruise Ships Operating in Alaska (EPA Form No. 7500-64). Washington, DC. (http://www.epa.gov/owow/oceans/cruise_ships/cruise_ship_survey.pdf)
U.S. Environmental Protection Agency. 2006a. Sampling Episode Report for Holland America
Veendam (Sampling Episode 6503). Washington, DC. (http://www.epa.gov/owow/oceans/cruise_ships/Veendam/VeendamSER.pdf)
U.S. Environmental Protection Agency. 2006b. Sampling Episode Report for Norwegian Star
(Sampling Episode 6504). Washington, DC. (http://www.epa.gov/owow/oceans/cruise_ships/FinalStar/FinalStarSERNCBI.pdf)
U.S. Environmental Protection Agency. 2006c. Sampling Episode Report for Princess Cruise
Lines – Island Princess (Sampling Episode 6505). Washington, DC. (http://www.epa.gov/owow/oceans/cruise_ships/Island/IslandSER.pdf)
U.S. Environmental Protection Agency. 2006d. Sampling Episode Report for Holland America
Oosterdam (Sampling Episode 6506). Washington, DC. (http://www.epa.gov/owow/oceans/cruise_ships/Oosterdam/OosterdamFinal.pdf)
U.S. Environmental Protection Agency. 2006e. Sampling Episode Report for Nitrogen
Compounds Characterization (Sampling Episodes 6517 Through 6520). Washington, DC. (http://www.epa.gov/owow/oceans/cruise_ships/nitrogen/nitrogen_NCBI.pdf)
Vetrano, K.M. 1998. Molecular Chlorine: Health and Environmental Effects. TRC
Environmental Corporation. Windsor, CT. World Health Organization (WHO). 1986. Ammonia Environmental Health Criteria 54. Geneva,
Switzerland. (http://www.inchem.org/documents/ehc/ehc/ehc54.htm) Wu, R.S.S. 1999. Eutrophication, Water Borne Pathogens and Xenobiotic Compounds:
Environmental Risks and Challenges. Marine Pollution Bulletin 39: 11-22.

December 29, 2008
3-1
Section 3: Graywater Graywater generally means wastewater from sinks, baths, showers, laundry, and galleys. On cruise ships using Advanced Wastewater Treatment systems (AWTs), one or more graywater sources are often treated with sewage (see Section 2 for more information). On other cruise ships, graywater generally is not treated. This section discusses the current state of information about vessel graywater, the laws regulating graywater discharges from vessels, the potential environmental impacts of untreated cruise ship graywater discharges, and federal actions taken to address graywater from cruise ships. The types of equipment used to treat graywater generated on some cruise ships, and how well they remove various pollutants, are discussed in Section 2. The conclusion of this section lists a wide range of options and alternatives that could be considered when addressing graywater from cruise ships. 3.1 What is graywater and how much is generated on cruise ships? Graywater generally means wastewater from sinks, baths, showers, laundry, and galleys (see Table 3-1). The source water for most graywater sources is potable water. Some common graywater sources and potential characteristics are listed in Table 3-2 below.
Table 3-1. Graywater Definitions
Source Graywater Definition Clean Water Act, 33 U.S.C. § 312(a)(11)
Galley, bath, and shower water
International Maritime Organization Guidelines for Implementation of Annex V of MARPOL (Sec. 1.7.8)
Drainage from dishwasher, shower, laundry, bath and washbasin drains and does not include drainage from toilets, urinals, hospitals, and animal spaces, as defined in regulation 1(3) of Annex IV, as well as drainage from cargo spaces
Title XIV – Certain Alaskan Cruise Ship Operations, 33 U.S.C. § 1901 Note (Sec. 1414(4))
Only galley, dishwasher, bath, and laundry waste water
Coast Guard regulations implementing MARPOL and the Act to Prevent Pollution from Ships, 33 CFR 151.05
Drainage from dishwasher, shower, laundry, bath, and washbasin drains and does not include drainage from toilets, urinals, hospitals, and cargo spaces

December 29, 2008
3-2
Table 3-2. Common Sources and Characteristics of Graywater
Water Source Characteristics Automatic Clothes Washer bleach, foam, high pH, hot water, nitrate, oil and grease, oxygen demand,
phosphate, salinity, soaps, sodium, suspended solids, turbidity Automatic Dish Washer bacteria, foam, food particles, high pH, hot water, odor, oil and grease,
organic matter, oxygen demand, salinity, soaps, suspended solids, turbidity Sinks, including kitchen bacteria, food particles, hot water, odor, oil and grease, organic matter,
oxygen demand, soaps, suspended solids, turbidity Bathtub and Shower bacteria, hair, hot water, odor, oil and grease, oxygen demand, soaps,
suspended solids, turbidity Source: ACSI, 2001
According to information gathered by EPA during ship visits and via responses to EPA’s survey of cruise ships operating in Alaska in 2004, the following waste streams also may be sent to the graywater system on some cruise ships: wastewater from bar and pantry sinks, salon and day spa sinks and floor drains, interior deck drains, shop sinks and deck drains in non-engine rooms (e.g., print shops, photo processing shops, dry cleaning areas, and chemical storage areas); refrigerator and air conditioner condensate; wastewater from laundry floor drains in passenger and crew laundries; dry cleaning condensate; wastewater from dishwashers, food preparation, galley sinks, floor drains, and the food pulper; wastewater from garbage room floor drains and from sinks in restaurants and cafes; wastewater from whirlpools; and wastewater from medical facility sinks and medical floor drains. Some of these waste streams do not fall within the statutory definitions of graywater listed above and thus would not be considered graywater for purposes of compliance with these statutes. The United States has successfully prosecuted violations of the Clean Water Act (CWA) for unpermitted discharges of hazardous materials from cruise ship dry cleaning operations, photographic chemicals from photographic processing equipment, solvents from print shop operations, as well as other chemicals, pollutants and waste streams, through the graywater system. Estimated graywater generation rates reported in response to EPA’s 2004 cruise ship survey ranged from 36,000 to 249,000 gallons/day/vessel or 36 to 119 gallons/day/person. Graywater generation rates generally are not measured, and EPA is not able to independently confirm the accuracy of these estimated rates. It is not clear why reported rates would vary this much. Average graywater generation rates were 170,000 gallons/day/vessel and 67 gallons/day/person (see Figure 3-1). There appears to be no relationship between per capita graywater generation rates and number of persons onboard (see Figure 3-2). Estimated graywater generation rates reported in response to EPA’s 2004 cruise ship survey indicate that approximately 52% of wastewater was from accommodations, 17% from laundries, and 31% from galleys.

December 29, 2008
3-3
0
5
10
15
20
<20 20-40 40-60 60-80 80-100 100-120
Per Capita Graywater Generation (gal/day/pers)
67.4 ± 3.3 gal/day/pers (mean ± SE)n = 29
Figure 3-1. Per Capita Graywater
Generation as Reported in EPA's 2004 Cruise Ship Survey
0
20
40
60
80
100
120
140
0 1,000 2,000 3,000 4,000 5,000
Persons Onboard (passengers + crew)
Figure 3-2. Graywater Generation by
Persons Onboard as Reported in EPA's 2004 Cruise Ship Survey
During EPA’s 2004 sampling of four ships with AWTs, graywater generation was measured on one ship at 45 gallons/day/person (EPA, 2006a). On other ships, measurements were made of sewage plus graywater sources treated by the AWTs. The Alaska Cruise Ship Initiative (ADEC, 2000) used a rule of thumb of 50 to 65 gallons of graywater generated per person per day. Residential graywater generation has been estimated at about 51 gallons per person per day (Mayer and DeOreo, 1998). On ships where graywater is treated, treated graywater discharge rates are nearly equivalent to graywater generation rates. Differences between these two rates are attributed to the volume of wastewater treatment sludge, if any, that is removed during wastewater treatment (see subsection 2.3.3). A typical graywater piping system may lead to several graywater holding tanks segregated by graywater source. On some ships, graywater sources may undergo limited treatment enroute to the holding tanks (e.g., gross particle filters or grease traps). Graywater from holding tanks can be sent to an AWTs for treatment, discharged immediately upon generation, or diverted to longer-term storage in one or more double bottom holding tanks for controlled discharge. Cruise vessel capacity to hold graywater varies significantly. According to responses to EPA’s 2004 cruise ship survey, graywater holding capacity ranges from 5 to 90 hours, with an average holding capacity of 56 hours. When graywater is discharged untreated, motor-driven centrifugal pumps force the wastewater overboard approximately five meters below the ship’s waterline via one or more discharge ports, approximately 140 mm in diameter.

December 29, 2008
3-4
3.2 What federal laws apply to graywater from cruise ships? 3.2.1 Clean Water Act Graywater discharges from commercial vessels operating in the Great Lakes are regulated under section 312 of the Clean Water Act (CWA), as discussed below. Graywater discharges from vessels operating elsewhere historically have been excluded from CWA permitting requirements through regulations at 40 CFR 122.3(a). However, as explained in section 1.1, a court order vacated that exclusion as of December 19, 2008, and as a result, except for the Great Lakes, graywater discharges into waters of the U.S. from cruise ships 79 feet or longer in length are subject to NPDES permitting. As noted in Section 2, CWA section 312 requires that vessels with installed toilet facilities be equipped with an operable marine sanitation device, certified by the Coast Guard to meet EPA performance standards, in order to operate on the navigable waters of the United States. Marine sanitation devices primarily treat vessel sewage. CWA section 312 also applies to graywater from a limited set of vessels because the statutory definition of sewage includes graywater with respect to commercial vessels on the Great Lakes (33 U.S.C. § 1322(a)(6)). For a full discussion of CWA section 312, see Section 2 (subsection 2.2.1). 3.2.2 Certain Alaskan Cruise Ship Operations
On December 12, 2000, Congress enacted an omnibus appropriation that included new statutory requirements for certain cruise ship discharges occurring in Alaska (Departments of Labor, Health and Human Services, and Education, and Related Agencies Appropriations Act, 2001, Pub. L. No. 106-554, 114 Stat. 2763, enacting into law Title XIV of Division B of H.R. 5666, 114 Stat. 2763A-315, and codified at 33 U.S.C. § 1901 Note). Title XIV sets discharge standards for sewage and graywater from certain cruise ships (those authorized to carry 500 or more passengers for hire) while operating in the Alexander Archipelago and the navigable waters of the United States in the State of Alaska and within the Kachemak Bay National Estuarine Research Reserve. For a full discussion of Title XIV, see Section 2 (subsection 2.2.3). 3.2.3 National Marine Sanctuaries Act The National Marine Sanctuaries Act (NMSA; 16 U.S.C. § 1431 et seq.), as amended, authorizes the National Oceanic and Atmospheric Administration (NOAA) to designate as National Marine Sanctuaries areas of the marine environment that have special aesthetic, ecological, historical, or recreational qualities, and to provide comprehensive and coordinated conservation management for such areas. The National Marine Sanctuary Program manages 13 sanctuaries and the Papahānaumokuākea Marine National Monument (together referred to as “sites”). Designated sites are managed according to site-specific management plans developed by NOAA that typically prohibit by regulation the discharge or deposit of most material. Discharges of graywater and treated vessel sewage, however, are sometimes allowed provided they are authorized under the CWA. In some sanctuaries the discharge of graywater, as well as sewage, is prohibited in special zones to protect fragile habitat, such as coral. NMSA also provides for civil penalties for violations of its requirements or the permits issued under it.

December 29, 2008
3-5
3.3 Characterization of Untreated Graywater Except in Alaska, graywater from cruise ships currently is not required to be treated before discharge. For ships traveling regularly on itineraries beyond the territorial waters of coastal states, Cruise Lines International Association (CLIA) environmental standards provide that the discharge of graywater should occur only while the ship is underway and proceeding at a speed of not less that six knots (for vessels operating under sail, or a combination of sail and motor propulsion, the speed shall not be less than four knots); that graywater should not be discharged in port and should not be discharged within four nautical miles from shore or such other distance as agreed to with authorities having jurisdiction or provided for by local law except in an emergency, or where geographically limited (CLIA, 2006). While some cruise ships are using AWTs to treat graywater (as well as sewage), detailed information on the effluent from AWTs can be found in Section 2 and will not be repeated here. The remainder of this subsection provides information on untreated graywater from two sources: EPA’s 2004 sampling of cruise ships operating in Alaska and a voluntary sampling effort in 2000 and 2001 by the Alaska Cruise Ship Initiative (ACSI). Data Collection EPA Sampling: EPA sampled wastewater in 2004 from four cruise ships that operated in Alaska to characterize graywater and sewage generated onboard and to evaluate the performance of the Zenon, Hamworthy, Scanship, and ROCHEM AWTs (see EPA, 2006 a-d). EPA analyzed individual graywater sources (accommodations, laundry, galley, and food pulper wastewater) on each ship for over 400 analytes, including pathogen indicators, suspended and dissolved solids, biochemical oxygen demand, oil and grease, dissolved and total metals, organics, and nutrients. In addition, laundry wastewater samples were analyzed for dioxins and furans, and galley wastewater samples were analyzed for organohalide and organophosphorus pesticides. Alaska Cruise Ship Initiative (ACSI) Sampling: Concerns over cruise ship wastewater discharges in Alaska led to a voluntary sampling effort in 2000 by the ACSI (ADEC, 2001). Twice during the 2000 cruise season, samples were collected from each sewage and graywater discharge port from each of the 21 large cruise ships operating in Alaska. Sampling was scheduled randomly at various ports of call on all major cruise routes in Alaska. Analytes included total suspended solids, biochemical oxygen demand, chemical oxygen demand, pH, fecal coliform, total residual chlorine, free residual chlorine, and ammonia for all samples, and priority pollutants (metals, hydrocarbons, organochlorines) for one sample per ship. Voluntary sampling continued at the start of the 2001 cruise ship season through July 1, 2001, when Alaska state graywater and sewage discharge regulations (AS 46-03.460 - 46.03.490) came into effect. Additional sampling of untreated graywater was done under these regulations during the remainder of the 2001 cruise season. Samples collected during both the voluntary and compliance monitoring sampling programs characterized different types of wastewater depending on ship-specific discharge configurations. The ACSI sampling results presented in this section include only those sampling points designated as “Mixed Graywater.” Mixed graywater samples were collected either as generated or following longer-term storage in double bottom holding tanks.

December 29, 2008
3-6
The results of these sampling efforts are discussed in greater detail below, but to summarize, the results of analyses of graywater demonstrated that the strength of the graywater, in terms of biological oxygen demand, chemical oxygen demand and total suspended solids, is variable and that it can have high levels of fecal coliform bacteria (ADEC, 2001). Pathogen Indicators EPA analyzed untreated graywater sources for the pathogen indicators fecal coliform, enterococci, and E. coli. Table 3-3 presents the graywater sampling data for the individual graywater sources. All three pathogen indicators were detected in all four food pulper samples and in the majority of galley and accommodations wastewater samples. EPA used flow rates for the individual graywater sources to calculate a flow-weighted average to represent untreated graywater, which resulted in an estimated fecal coliform concentration of 36,000,000 CFU/100mL. ACSI/Alaska Department of Environmental Conservation (ADEC) results indicated 2,950,000 MPN/100mL fecal coliform for untreated mixed graywater (see Table 3-3). These fecal coliform concentrations are one to three orders of magnitude greater than typical fecal coliform concentrations in untreated domestic wastewater of 10,000 to 100,000 MPN/100 mL (Metcalf & Eddy, 1991). Conventional Pollutants and Other Common Analytes Table 3-4 shows EPA’s and ACSI/ADEC’s sampling results for some conventional pollutants and other common analytes in untreated graywater, as well as typical concentrations in untreated domestic wastewater. Key analytes commonly used to assess wastewater strength are biochemical oxygen demand, chemical oxygen demand, and total suspended solids. Food pulper wastewater is the highest strength graywater source, with key analyte concentrations more than an order of magnitude greater than those in other graywater sources. The remaining graywater sources in order of decreasing wastewater strength are galley wastewater, accommodations wastewater, and laundry wastewater. Average untreated graywater strength is comparable or higher in strength than untreated domestic wastewater. Metals EPA sampled for 54 total and dissolved metal analytes (26 of which are priority pollutants) and ACSI sampled for 13 priority pollutant total metal analytes in untreated graywater. Table 3-5 presents graywater sampling data for priority pollutant metals that were detected in greater than 10% of either the EPA or ACSI/ADEC samples (less frequent detection of analytes is considered not representative of the waste stream). Copper, nickel, and zinc, which showed the highest concentrations, are common components of ship piping.

3-7
Table 3-3. Comparison of Untreated Graywater Concentrations to Untreated Domestic Wastewater -- Pathogen Indicators
Analyte Graywater
Source Units Average
Concentration1 Range
Number of Results
< 200
Number of Results 201 to
< 100,000
Number of Results
100,001 to < 1,000,000
Number of Results
>1,000,000 Accommodations MPN/
100 mL 83,500# ND(1.00) - 1,050,000
(17 detects out of 21 samples) 6 7 7 1
Laundry MPN/ 100 mL
1,930* ND(1.00) - 7,700 (5 detects out of 21 samples)
19 2 0 0
Galley MPN/ 100 mL
935,000# ND(1.00) - >24,200,000 (21 detects out of 22 samples)
1 10 7 4
Food Pulper MPN/ 100 mL
336,000** 17,300 - 2,420,000 (4 detects out of 4 samples)
0 3 0 1
E. Coli
Graywater2
MPN/ 100 mL
292,000#
Accommodations MPN/ 100 mL
532# ND(1.00) - >2,420 (16 detects out of 21 samples)
11 10 0 0
Laundry MPN/ 100 mL
253# ND(1.00) - >2,420 (7 detects out of 21 samples)
17 4 0 0
Galley MPN/ 100 mL
6,750** 95 – 51,700 (22 detects out of 22 samples)
3 19 0 0
Food Pulper MPN/ 100 mL
411,000** 10,400 – 1,600,000 (4 detects out of 4 samples)
0 3 0 1
Enterococci
Graywater2
MPN/ 100 mL
8,920#
Accommodations CFU/ 100 mL
36,700,000# 1,500 - 120,000,000 (18 detects out of 19 samples)
0 7 6 6
Laundry CFU/ 100 mL
7,940# ND(2.00) - >60,000 (11 detects out of 19 samples)
11 8 0 0
Galley CFU/ 100 mL
29,100,000** 1,900 - 910,000,000 (19 detects out of 19 samples)
0 4 6 9
Food Pulper CFU/ 100 mL
87,400 29,000 - 170,000 (4 detects out of 4 samples)
0 2 2 0
Graywater2
CFU/ 100 mL
36,000,000#
Fecal Coliform
Graywater (ASCI / ADEC Data)
MPN/ 100 mL
2,950,000#3 ND(2.00) – 32,000,000 (134 detects out of 156 samples)
36 29 42 49
1 Based on data collected by EPA in 2004 unless otherwise noted.

3-8
2 EPA used flow rates for the individual graywater sources to calculate a flow-weighted average to represent untreated graywater. 3 Based on data collected by ACSI/ADEC in 2000 and 2001. * Average includes at least one nondetect value; this calculation uses detection limits for nondetected results. ** Average includes at least one result flagged by the laboratory as not diluted sufficiently; therefore, this average represents a minimum value. # Average includes at least one nondetect value (calculation uses detection limits for nondetected results) and at least one result flagged by the laboratory as not
diluted sufficiently. The “>” symbol indicates that the laboratory flagged the sample as not diluted sufficiently; therefore, this represents a minimum value for the sample.

3-9
Table 3-4. Comparison of Untreated Graywater Concentraions to Untreated Domestic Wastewater -- Conventional Pollutants and Other Common Analytes
Analyte Unit
Average Concentration in Untreated Cruise Ship
Accommodations Wastewater (EPA Data) 1
Average Concentration in Untreated Cruise Ship
Laundry Wastewater (EPA Data) 1
Average Concentration in Untreated Cruise Ship
Galley Wastewater (EPA Data) 1
Average Concentration in Untreated Cruise Ship Food Pulper Wastewater (EPA Data) 1
Average Concentration in Untreated Cruise Ship Graywater
(EPA Data)2
Average Concentration in Untreated Cruise Ship Graywater
(ACSI/ADEC Data)3
Concentration in Untreated
Domestic Wastewater4
Alkalinity mg/l 48.1* (11 detects out of
12 samples)
71.6 (12 detects out of
12 samples)
57.7* (9 detects out of
12 samples)
ND(57.5) (0 detects out of 4
samples)
53.8* (32 detects out of
40 samples)
57.8 (4 detects out of 4
samples)
Biochemical Oxygen Demand (5-Day)
mg/l 260 (11 detects out of
11 samples)
83.8 (11 detects out of
11 samples)
1,490 (11 detects out of
11 samples)
30,500 (4 detects out of 4
samples)
1,140 (37 detects out of
37 samples)
354 (42 detects out of
42 samples)
110 to 400
Chemical Oxygen Demand
mg/l 723 (12 detects out of
12 samples)
257 (12 detects out of
12 samples)
1,830 (12 detects out of
12 samples)
26,400 (4 detects out of 4
samples)
1,890 (40 detects out of
40 samples)
1,000 (41 detects out of
41 samples)
250 to 1,000
Chloride mg/l 66.6 (12 detects out of
12 samples)
22.4 (12 detects out of
12 samples)
145 (12 detects out of
12 samples)
1,240 (4 detects out of 4
samples)
125 (40 detects out of
40 samples)
NC
Conductivity μS/cm 236 (43 detects out of
43 samples)
74.4 (43 detects out of
43 samples)
647 (48 detects out of
48 samples)
4,060 (7 detects out of 7
samples)
427 (141 detects out of
141 samples)
2,250 (21 detects out of
21 samples)
Free Residual Chlorine μg/l NR NR NR NR NR 0.256* (6 detects out of
43 samples)
Hardness mg/l 38.2 (12 detects out of
12 samples)
14.1 (12 detects out of
12 samples)
65.1 (12 detects out of
12 samples)
449 (3 detects out of 3
samples)
54.5 (39 detects out of
39 samples)
NC
Hexane Extractable Material
mg/l 37.6 (12 detects out of
12 samples)
13.4 (11 detects out of
11 samples)
172 (12 detects out of
12 samples)
1,960 (3 detects out of 3
samples)
149 (38 detects out of
38 samples)
78.0 Oil and Grease
(4 detects out of 4 samples)
pH 83.3% of pH samples are
between 6.0 and 9.0
(35 of 42 samples)
81.8% of pH samples are
between 6.0 and 9.0
(36 of 44 samples)
50.0% of pH samples are
between 6.0 and 9.0
(24 of 48 samples)
0% of the pH samples are
between 6.0 and 9.0
(0 of 8 samples)
66.9% of pH samples are
between 6.0 and 9.0
(95 of 142 samples)
76.7% of pH samples are
between 6.0 and 9.0
(33 out of 43
Between 6.0 and 9.0

3-10
Analyte Unit
Average Concentration in Untreated Cruise Ship
Accommodations Wastewater (EPA Data) 1
Average Concentration in Untreated Cruise Ship
Laundry Wastewater (EPA Data) 1
Average Concentration in Untreated Cruise Ship
Galley Wastewater (EPA Data) 1
Average Concentration in Untreated Cruise Ship Food Pulper Wastewater (EPA Data) 1
Average Concentration in Untreated Cruise Ship Graywater
(EPA Data)2
Average Concentration in Untreated Cruise Ship Graywater
(ACSI/ADEC Data)3
Concentration in Untreated
Domestic Wastewater4
samples)
Salinity ppt 1.72* (42 detects out of
43 samples)
1.26 (43 detects out of
43 samples)
2.56 (48 detects out of
48 samples)
6.05 (7 detects out of 7
samples)
2.08* (140 detects out of
141 samples)
NC
Settable Residue mg/l 4.43* (7 detects out of
11 samples)
0.432* (3 detects out of
11 samples)
18.7 (11 detects out of
11 samples)
728 (4 detects out of 4
samples)
25.6* (25 detects out of
37 samples)
1.10* (2 detects out of 4
samples)
Silica Gel Treated Hexane Extractable Material
mg/l ND(5.89) (0 detects out of
12 samples)
ND(5.37) (0 detects out of
11 samples)
8.39* (2 detects out of
12 samples)
821* (2 detects out of 3
samples)
36.6* (4 detects out of 38
samples)
NC
Sulfate mg/l 41.5 (12 detects out of
12 samples)
16.3 (12 detects out of
12 samples)
61.0 (12 detects out of
12 samples)
194 (4 detects out of 4
samples)
49.9 (40 detects out of
40 samples)
NC
Temperature °C 34.7 (42 detects out of
42 samples)
48.6 (44 detects out of
44 samples)
41.9 (48 detects out of
48 samples)
66.5 (8 detects out of 8
samples)
39.6 (142 detects out of
142 samples)
NC
Total Dissolved Solids mg/l 244 (12 detects out of
12 samples)
191 (12 detects out of
12 samples)
897 (12 detects out of
12 samples)
5,160 (3 detects out of 3
samples)
578 (39 detects out of
39 samples)
NC
Total Organic Carbon mg/l 78.9 (12 detects out of
12 samples)
60.2 (12 detects out of
12 samples)
358 (12 detects out of
12 samples)
21,300 (4 detects out of 4
samples)
535 (40 detects out of
40 samples)
481 (4 detects out of 4
samples)
Total Residual Chlorine mg/l NR NR NR NR NR 0.372* (9 detects out of
43 samples)
Total Suspended Solids mg/l 207 (12 detects out of
12 samples)
37.1 (12 detects out of
12 samples)
877 (12 detects out of
12 samples)
16,500 (3 detects out of 3
samples)
704 (39 detects out of
39 samples)
318 (43 detects out of
43 samples)
100 to 350
Turbidity NTU 186 (43 detects out of
43 samples)
20.9 (41 detects out of
41 samples)
408 (33 detects out of
33 samples)
NC 224 (117 detects out of
117 samples)
1 Based on data collected by EPA in 2004. 2 EPA used flow rates for the individual graywater sources to calculate a flow-weighted average to represent untreated graywater.
3-11
3 Based on data collected by ACSI/ADEC in 2000 and 2001. 4 Metcalf & Eddy, 1991. * Average includes at least one nondetect value; this calculation uses detection limits for nondetected results. “NC” indicates that this information was not collected. “NR” indicates that this information was not reported. Equipment used to measure free and total chlorine is not suitable for measuring low levels of chlorine and
is subject to interferences; accordingly, field measurements collected for the sole purpose determining sample preservation requirements are not reported.

3-12
Table 3-5. Untreated Graywater Concentrations -- Metals
Analyte Unit
Average Concentration in Untreated Cruise Ship
Accommodations Wastewater (EPA Data) 1
Average Concentration in Untreated Cruise Ship
Laundry Wastewater (EPA Data) 1
Average Concentration in Untreated Cruise Ship
Galley Wastewater (EPA Data) 1
Average Concentration in Untreated Cruise Ship Food Pulper Wastewater (EPA Data) 1
Average Concentration in Untreated Cruise Ship Graywater
(EPA Data)2
Average Concentration in Untreated Cruise Ship Graywater
(ACSI/ADEC Data)3
Antimony, Total μg/l ND(3.99) (0 detects out of 12
samples)
ND(3.99) (0 detects out of 12
samples)
ND(3.99) (0 detects out of 12
samples)
6.67* (3 detects out of 4
samples)
4.09* (3 detects out of 40
samples)
1.34* (4 detects out of 6
samples)
Arsenic, Total μg/l ND(2.16) (0 detects out of 12
samples)
ND(2.16) (0 detects out of 12
samples)
2.44* (3 detects out of 12
samples)
5.85* (1 detect out of 4
samples)
2.25* (4 detects out of 40
samples)
1.22 (6 detects out of 6
samples)
Beryllium, Total μg/l 0.0688* (1 detect out of 12
samples)
ND(0.0620) (0 detects out of 12
samples)
0.116* (2 detects out of 12
samples)
ND(0.0448) (0 detects out of 4
samples)
0.0736* (3 detects out of 40
samples)
0.0907* (4 detects out of 6
samples)
Cadmium, Total μg/l 0.463* (1 detect out of 12
samples)
0.270* (1 detects out of 12
samples)
0.391* (6 detects out of 12
samples)
1.29 (4 detects out of 4
samples)
0.452* (12 detects out of 40
samples)
0.541* (10 detects out of 30
samples)
Chromium, Total μg/l 22.4* (11 detects out of 12
samples)
2.25* (10 detects out of 12
samples)
7.03* (10 detects out of 12
samples)
16.7 (4 detects out of 4
samples)
16.7* (35 detects out of 40
samples)
4.17* (8 detects out of 30
samples)
Chromium, Dissolved μg/l 1.49* (9 detects out of 12
samples)
1.38* (6 detects out of 12
samples)
2.04* (10 detects out of 12
samples)
5.16 (3 detects out of 3
samples)
1.70* (28 detects out of 39
samples)
NC
Copper, Total μg/l 677 (12 detects out of 12
samples)
278 (12 detects out of 12
samples)
383 (12 detects out of 12
samples)
208 (4 detects out of 4
samples)
510 (40 detects out of 40
samples)
483* (20 detects out of 30
samples)
Copper, Dissolved μg/l 167 (12 detects out of 12
samples)
253 (12 detects out of 12
samples)
232 (12 detects out of 12
samples)
15.3 (3 detects out of 3
samples)
195 (39 detects out of 39
samples)
NC
Lead, Total μg/l 14.8* (9 detects out of 12
samples)
5.77* (9 detects out of 12
samples)
21.2* (10 detects out of 12
samples)
14.1* (3 detects out of 4
samples)
12.3* (31 detects out of 40
samples)
19.3* (11 detects out of 30
samples)
Lead, Dissolved μg/l 2.48* (5 detects out of 12
samples)
3.76* (8 detects out of 12
samples)
10.2* (7 detects out of 12
samples)
2.87* (1 detects out of 3
samples)
4.25* (21 detects out of 39
samples)
NC

3-13
Analyte Unit
Average Concentration in Untreated Cruise Ship
Accommodations Wastewater (EPA Data) 1
Average Concentration in Untreated Cruise Ship
Laundry Wastewater (EPA Data) 1
Average Concentration in Untreated Cruise Ship
Galley Wastewater (EPA Data) 1
Average Concentration in Untreated Cruise Ship Food Pulper Wastewater (EPA Data) 1
Average Concentration in Untreated Cruise Ship Graywater
(EPA Data)2
Average Concentration in Untreated Cruise Ship Graywater
(ACSI/ADEC Data)3
Mercury, Total4 μg/l 0.153* (8 detects out of 12
samples)
0.0518* (7 detects out of 12
samples)
0.0703* (6 detects out of 12
samples)
0.197* (2 detects out of 4
samples)
0.100* (23 detects out of 40
samples)
0.0733* (2 detects out of 24
samples)
Mercury, Dissolved4 μg/l 0.155* (5 detects out of 12
samples)
0.0895* (6 detects out of 12
samples)
0.108* (6 detects out of 12
samples)
0.143* (2 detects out of 3
samples)
0.122* (19 detects out of 39
samples)
NC
Nickel, Total μg/l 34.0 (12 detects out of 12
samples)
6.19 (12 detects out of 12
samples)
29.2 (12 detects out of 12
samples)
22.4 (4 detects out of 4
samples)
29.7 (40 detects out of 40
samples)
48.7* (12 detects out of 30
samples)
Nickel, Dissolved μg/l 17.2 (12 detects out of 12
samples)
4.85 (12 detects out of 12
samples)
26.4 (12 detects out of 12
samples)
31.1 (3 detects out of 3
samples)
18.2 (39 detects out of 39
samples)
NC
Selenium, Total μg/l 1.07* (4 detects out of 12
samples)
1.26* (3 detects out of 12
samples)
4.93* (9 detects out of 12
samples)
26.9 (4 detects out of 4
samples)
3.37* (20 detects out of 40
samples)
4.45* (4 detects out of 6
samples)
Selenium, Dissolved μg/l 1.05* (4 detects out of 12
samples)
1.02* (4 detects out of 12
samples)
4.74* (7 detects out of 12
samples)
22.1 (3 detects out of 3
samples)
3.04* (18 detects out of 39
samples)
NC
Silver, Total μg/l 2.07* (1 detect out of 12
samples)
1.73* (6 detects out of 12
samples)
1.13* (4 detects out of 12
samples)
1.04* (1 detect out of 4
samples)
1.82* (12 detects out of 40
samples)
0.880* (13 detects out of 30
samples)
Thallium, Total μg/l 1.13* (1 detects out of 12
samples)
ND(0.765) (0 detects out of 12
samples)
0.405* (2 detects out of 12
samples)
0.550* (3 detects out of 4
samples)
0.930* (6 detects out of 40
samples)
ND
Thallium, Dissolved μg/l ND(0.405) (0 detects out of 12
samples)
0.407* (1 detects out of 12
samples)
0.405* (4 detects out of 12
samples)
0.296* (1 detects out of 3
samples)
0.403* (6 detects out of 39
samples)
NC
Zinc, Total μg/l 3,130 (12 detects out of 12
samples)
345 (12 detects out of 12
samples)
1,460 (12 detects out of 12
samples)
6,380 (4 detects out of 4
samples)
2,540 (40 detects out of 40
samples)
790* (19 detects out of 30
samples)
Zinc, Dissolved μg/l 792 (12 detects out of 12
samples)
266 (12 detects out of 12
samples)
1,070 (12 detects out of 12
samples)
47,800 (3 detects out of 3
samples)
1,610 (39 detects out of 39
samples)
NC

3-14
1 Based on data collected by EPA in 2004. 2 EPA used flow rates for the individual graywater sources to calculate a flow-weighted average to represent untreated graywater. 3 Based on data collected by ACSI/ADEC in 2000 and 2001. 4 Because it was not possible to incorporate “clean” sampling and analysis methodologies for mercury when sampling onboard ships, there is no way for EPA to
determine whether mercury reported here is present in the graywater or if the mercury was the result of contamination from nearby metal or sources of airborne contamination.
* Average includes at least one nondetect value; this calculation uses detection limits for nondetected results. “NC” indicates that this information was not collected. “ND” indicates that the analyte was not detected (number in parentheses is detection limit).

3-15
Food pulper wastewater contained the highest average concentration of 10 of the 21 metal analytes listed in Table 3-5. Six metal analytes were detected in accommodations wastewater at the highest average concentration. Galley and laundry wastewater contained the highest average concentration of only three and two metal analytes, respectively. Total and dissolved copper, total and dissolved nickel, and total and dissolved zinc were detected in all EPA graywater samples. These six metal analytes also were detected at the highest average concentrations among the priority metal analytes. Total copper, total nickel, and total zinc were also the priority pollutant metal analytes detected at the highest average concentrations in ACSI/ADEC graywater samples. Volatile and Semivolatile Organics EPA tested for 84 volatile and semivolatile organics, of which approximately 85% are priority pollutants. ACSI/ADEC sampled for almost 140 priority pollutant and non priority pollutant volatile and semivolatile organic analytes. Table 3-6 presents untreated graywater sampling data for priority pollutant volatile and semivolatile organics that were detected in greater than 10% of either EPA or ACSI/ADEC samples (less frequent detection of analytes is considered not representative of the waste stream). Analytes listed in Table 3-6 that were detected at the highest average concentration and/or frequency include plasticizers (phthalates), chlorine byproducts (e.g., chloroform and bromodichloromethane), and compounds naturally produced in foods (phenol). Nutrients Table 3-7 shows average nutrient concentrations in untreated graywater, as well as typical concentrations in untreated domestic wastewater. Food pulper wastewater contains the highest average concentration of nutrients. Average nitrate/nitrite, total Kjeldahl nitrogen, and total phosphorus concentrations in untreated graywater are comparable to concentrations in untreated domestic wastewater. The average ammonia concentration in untreated graywater is much less than that in untreated domestic wastewater (because the presence of ammonia is indicative of human waste).

3-16
Table 3-6. Untreated Graywater Concentrations -- Volatile and Semivolatile Organics
Analyte Unit
Average Concentration in Untreated Cruise Ship
Accommodations Wastewater (EPA Data) 1
Average Concentration in Untreated Cruise Ship
Laundry Wastewater (EPA Data) 1
Average Concentration in Untreated Cruise Ship
Galley Wastewater (EPA Data) 1
Average Concentration in Untreated Cruise Ship Food Pulper Wastewater (EPA Data) 1
Average Concentration in Untreated Cruise Ship Graywater
(EPA Data)2
Average Concentration in Untreated Cruise Ship Graywater
(ACSI/ADEC Data)3
1,2-Dichloroethane μg/l ND(7.50) (0 detects out of 12
samples)
ND(7.50) (0 detects out of 12
samples)
ND(7.50) (0 detects out of 12
samples)
ND(5.24) (0 detects out of 4
samples)
ND(7.37) (0 detects out of 40
samples)
0.426* (4 detects out of 24
samples)
2,4-Dichlorophenol μg/l ND(11.2) (0 detects out of 12
samples)
ND(10.1) (0 detects out of 12
samples)
ND(10.4) (0 detects out of 12
samples)
ND(80.2) (0 detects out of 4
samples)
ND(11.9) (0 detects out of 40
samples)
0.275 (6 detects out of 6
samples)
Bis(2-ethylhexyl) phthalate μg/l 25.3* (11 detects out of
12 samples)
56.3 (12 detects out of
12 samples)
155* (11 detects out of
12 samples)
526* (2 detects out of 4
samples)
71.9* (36 detects out of 40
samples)
22.4* (21 detects out of 30
samples)
Bromodichloromethane μg/l ND(7.50) (0 detects out of 12
samples)
7.50* (1 detects out of 12
samples)
ND(7.50) (0 detects out of 12
samples)
ND(5.24) (0 detects out of 4
samples)
7.37* (1 detects out of 40
samples)
3.92* (15 detects out of 30
samples)
Bromoform μg/l ND(7.50) (0 detects out of 12
samples)
ND(7.50) (0 detects out of 12
samples)
ND(7.50) (0 detects out of 12
samples)
ND(5.24) (0 detects out of 4
samples)
ND(7.37) (0 detects out of 40
samples)
1.97* (9 detects out of 30
samples)
Butyl benzyl phthalate μg/l ND(10.3) (0 detects out of 12
samples)
ND(10.0) (0 detects out of 12
samples)
ND(10.0) (0 detects out of 12
samples)
ND(80.2) (0 detects out of 4
samples)
ND(11.4) (0 detects out of 40
samples)
7.74* (6 detects out of 30
samples)
Chloroform μg/l 7.53* (1 detect out of 12
samples)
48.6* (11 detects out of
12 samples)
7.99* (4 detects out of 12
samples)
ND(5.24) (0 detects out of 4
samples)
13.5* (16 detects out of 40
samples)
13.3* (20 detects out of 30
samples)
Dibromochloromethane μg/l ND(7.50) (0 detects out of 12
samples)
ND(7.50) (0 detects out of 12
samples)
ND(7.50) (0 detects out of 12
samples)
ND(5.24) (0 detects out of 4
samples)
ND(7.37) (0 detects out of 40
samples)
3.08* (11 detects out of 30
samples)
Diethyl phthalate μg/l 14.1* (5 detects out of 12
samples)
10.6* (3 detects out of 12
samples)
11.1* (1 detect out of
12 samples)
ND(80.2) (0 detects out of 4
samples)
14.1* (9 detects out of 40
samples)
5.41* (18 detects out of 30
samples)
Di-n-butyl phthalate μg/l ND(10.3) (0 detects out of 12
samples)
ND(10.0) (0 detects out of 12
samples)
ND(10.0) (0 detects out of 12
samples)
ND(80.2) (0 detects out of 4
samples)
ND(11.4) (0 detects out of 40
samples)
2.96* (15 detects out of 30
samples)

3-17
Analyte Unit
Average Concentration in Untreated Cruise Ship
Accommodations Wastewater (EPA Data) 1
Average Concentration in Untreated Cruise Ship
Laundry Wastewater (EPA Data) 1
Average Concentration in Untreated Cruise Ship
Galley Wastewater (EPA Data) 1
Average Concentration in Untreated Cruise Ship Food Pulper Wastewater (EPA Data) 1
Average Concentration in Untreated Cruise Ship Graywater
(EPA Data)2
Average Concentration in Untreated Cruise Ship Graywater
(ACSI/ADEC Data)3
Di-n-octyl phthalate μg/l ND(10.3) (0 detects out of 12
samples)
ND(10.0) (0 detects out of 12
samples)
ND(10.0) (0 detects out of 12
samples)
ND(80.2) (0 detects out of 4
samples)
ND(11.4) (0 detects out of 40
samples)
0.688 (6 detects out of 6
samples)
Ethylbenzene μg/l ND(7.50) (0 detects out of 12
samples)
ND(7.50) (0 detects out of 12
samples)
ND(7.50) (0 detects out of 12
samples)
ND(5.24) (0 detects out of 4
samples)
ND(7.37) (0 detects out of 40
samples)
0.563* (10 detects out of 30
samples)
Methylene chloride μg/l ND(7.50) (0 detects out of 12
samples)
ND(7.50) (0 detects out of 12
samples)
ND(7.50) (0 detects out of 12
samples)
ND(5.24) (0 detects out of 4
samples)
ND(7.37) (0 detects out of 40
samples)
1.31* (4 detects out of 30
samples)
Phenol μg/l 46.2* (9 detects out of 12
samples)
55.3* (11 detects out of
12 samples)
58.3 (12 detects out of
12 samples)
93.8* (2 detects out of 4
samples)
52.5* (34 detects out of 40
samples)
1.16* (5 detects out of 30
samples)
Tetrachloroethylene μg/l 18.1* (1 detect out of 12
samples)
ND(7.50) (0 detects out of 12
samples)
ND(7.50) (0 detects out of 12
samples)
ND(5.24) (0 detects out of 4
samples)
11.4* (1 detect out of 40
samples)
10.7* (9 detects out of 30
samples)
Toluene μg/l 28.0* (1 detects out of 12
samples)
ND(7.50) (0 detects out of 12
sample)
9.70* (5 detects out of 12
samples)
ND(5.24) (0 detects out of 4
samples)
21.3* (6 detects out of 40
samples)
0.589* (6 detects out of 30
samples)
Trichloroethene μg/l 10.2* (1 detect out of 12
sample)
ND(7.50) (0 detects out of 12
sample)
ND(7.50) (0 detects out of 12
sample)
ND(5.24) (0 detects out of 4
sample)
8.40* (1 detect out of 40
samples)
3.12* (4 detects out of 30
samples) 1 Based on data collected by EPA in 2004. 2 EPA used flow rates for the individual graywater sources to calculate a flow-weighted average to represent untreated graywater. 3 Based on data collected by ACSI/ADEC in 2000 and 2001. * Average includes at least one nondetect value; this calculation uses detection limits for nondetected results. “ND” indicates that the analyte was not detected (number in parentheses is detection limit).

3-18
Table 3-7. Comparison of Untreated Graywater Concetrations to Untreated Domestic Wastewater -- Nutrients
Analyte Unit
Average Concentration in Untreated Cruise Ship
Accommodations Wastewater (EPA Data) 1
Average Concentration in Untreated Cruise Ship
Laundry Wastewater (EPA Data) 1
Average Concentration in Untreated Cruise Ship
Galley Wastewater (EPA Data) 1
Average Concentration in Untreated Cruise Ship Food Pulper Wastewater (EPA Data) 1
Average Concentration in Untreated Cruise Ship Graywater
(EPA Data)2
Average Concentration in Untreated Cruise Ship Graywater
(ACSI/ADEC Data)3
Concentration in Untreated
Domestic Wastewater4
Ammonia - Nitrogen mg-N /l 0.383* (6 detects out of
12 samples)
0.439* (6 detects out of
12 samples)
2.93* (8 detects out of
12 samples)
17.5* (3 detects out of 4
samples)
2.13* (23 detects out of
40 samples)
2.21* (28 detects out of
30 samples)
12 to 50
Nitrate/Nitrite mg/l 0.0858* (9 detects out of
12 samples)
0.100 (12 detects out of 12 samples)
0.0477* (8 detects out of
12 samples)
0.335* (3 detects out of
4 samples)
0.0872* (32 detects out of
40 samples)
0.00900 (3 detects out of 3
samples)
0
Total Kjeldahl Nitrogen mg/l 15.2 (12 detects out of
12 samples)
4.14* (11 detects out of
12 samples)
38.8 (12 detects out of
12 samples)
188 (4 detects out of 4
samples)
26.2* (39 detects out of
40 samples)
11.1 (4 detects out of 4
samples)
20 to 85
Total Phosphorus mg/l 2.20 (12 detects out of
12 samples)
4.31 (12 detects out of
12 samples)
20.0 (12 detects out of
12 samples)
186 (4 detects out of 4
samples)
10.1 (40 detects out of
40 samples)
3.34 (4 detects out of 4
samples)
4 to 15
1 Based on data collected by EPA in 2004. 2 EPA used flow rates for the individual graywater sources to calculate a flow-weighted average to represent untreated graywater. 3 Based on data collected by ACSI/ADEC in 2000 and 2001. 4 Metcalf & Eddy, 1991. * Average includes at least one nondetect value; this calculation uses detection limits for nondetected results.

December 29, 2008
3-19
3.4 What are the potential environmental impacts associated with untreated graywater from cruise ships?
In order to evaluate the potential environmental impacts of untreated graywater waste streams from cruise ships, EPA compared data from untreated graywater discussed in subsection 3.3 above to (1) current wastewater discharge standards for ships and land-based sewage treatment plants and (2) EPA’s National Recommended Water Quality Criteria (NRWQC). Detailed information on treated graywater (that is, the effluent from Advanced Wastewater Treatment systems) can be found in Section 2, and will not be repeated here. Also relevant to an evaluation of potential environmental impact is the mixing and dilution that occurs following discharge; this is discussed in subsection 3.4.3 below. 3.4.1 Comparison to wastewater discharge standards
Table 3-8 shows the comparison of average analyte concentrations from EPA and ACSI/ADEC untreated graywater sampling to:
EPA’s standards for discharges from Type II MSDs on vessels; EPA’s standards for secondary treatment of sewage from land-based sewage
treatment plants; and Alaska cruise ship discharge standards under “Certain Alaskan Cruise Ship
Operations” (also referred to as “Title XIV”). Untreated cruise ship graywater concentrations exceeded the EPA standards for discharges from Type II MSDs (for fecal coliform and total suspended solids). In addition, untreated graywater concentrations exceeded all wastewater discharge standards under Title XIV for continuous discharge from cruise ships in Alaska, and secondary treatment discharge standards from land-based sewage treatment plants. (Graywater is not required to meet any of the standards shown in Table 3-8, with the exception that continuous graywater discharges in Alaska waters must achieve the Title XIV continuous discharge standards.)
Table 3-8. Comparison of Untreated Cruise Ship Graywater to Wastewater Discharge Standards
Analyte
Average Concentration in Untreated Cruise Ship Graywater
(EPA Data)1
Average Concentration in Untreated Cruise Ship Graywater
(ACSI/ADEC Data)2
Performance Standards for Type II MSDs (33 CFR Part
159 Subpart C)
Secondary Treatment Discharge
Standards for Sewage from Land-based
Sewage Treatment Plants
(40 CFR 133.102)
Title XIV Standards for Continuous Discharge in
Alaskan Waters(33 CFR Part
159 Subpart E)
Fecal coliform (fecal coliform/
100 mL)
36,000,000*
2,950,000* MPN/ 100 mL
<200 <203
Total residual chlorine (μg/l)
NR 372*^ <10

December 29, 2008
3-20
Biochemical oxygen demand (5-day) (mg/l)
1,140
354 <454
<305 <454
<305
Total suspended solids (mg/l)
704
318
<150 <454
<305 <454
<305
pH 67% of pH samples between
6.0 and 9.0
77% of pH samples
between 6.0 and 9.0
between 6.0 and 9.0
between 6.0 and 9.0
1 Based on EPA sampling data from 2004. 2 Based on data collected by ACSI/ADEC in 2000 and 2001. 3 The geometric mean of the samples from the discharge during any 30-day period does not exceed 20 fecal coliform
per 100 milliliters (ml) and not more than 10% of the samples exceed 40 coliform per 100 ml. 4 The 7-day average shall not exceed this value. 5 The 30-day average shall not exceed this value. In addition, the 30-day average percent removal shall not be less
than 85%. * Average includes at least one nondetect value; this calculation uses detection limits for nondetected results. ^ The minimum detection limit for total residual chlorine reported by most analytical labs is 100 μg/l. “NR” indicated that this information was not reported; equipment used to measure free and total chlorine is not
suitable for measuring low levels of chlorine and is subject to interferences. Accordingly, field measurements collected solely for determining simple preservation requirements are not provided.
3.4.2 Comparison to EPA’s National Recommended Water Quality Criteria EPA compared average untreated graywater concentrations from EPA’s and ACSI/ADEC’s sampling (discussed in subsection 3.3 above) to EPA’s 2006 National Recommended Water Quality Criteria (NRWQC) for saltwater aquatic life and for human health (for the consumption of organisms only), and for pathogen indicators, compared these effluent concentrations to criteria for the protection of human health from incidental ingestion during recreational activities (e.g., swimming and surfing) and to criteria for consumption of shellfish. Analytes that exceed the NRWQC are discussed in greater detail in the subsections below. EPA’s NRWQC are recommended concentrations of analytes in a waterbody that are intended to protect human health and aquatic organisms and their uses from unacceptable effects from exposures to these pollutants. The NRWQC are not directly comparable to analyte concentrations in a discharge for a number of reasons. First, NRWQC not only have a concentration component, but also a duration and frequency component. Second, it is not always necessary to meet all water quality criteria within the discharge pipe to protect the integrity of a waterbody (EPA, 1991). Sometimes it is appropriate to allow for ambient concentrations above the criteria in small areas near outfalls. These are called mixing zones. To ensure mixing zones do not impair the integrity of the waterbody, it should be determined that the mixing zone will not cause lethality to passing organisms and, considering likely pathways of exposure, that there are not significant human health risks. Third, under EPA’s regulations (40 CFR 122.44(d)(1)(ii)), when determining whether a discharge causes, has the reasonable potential to cause, or contributes to an in-stream excursion above a narrative or numeric criteria within a state water quality standard, the permitting authority shall use procedures which account for, where appropriate, the dilution of the effluent in the receiving water.

December 29, 2008
3-21
Nevertheless, comparison of cruise ship wastewater discharges to NRWQC provides a conservative screen of whether these discharges might cause, have the potential to cause, or contribute to non-attainment of the water quality standards in a given receiving water. If the concentration of a given analyte in cruise ship wastewater is less than the NRWQC, the wastewater should not cause, have the potential to cause, or contribute to non-attainment of a water quality standard based on that criterion. If the concentration of a particular analyte in cruise ship wastewater is greater than the NRWQC, additional analysis would determine whether the discharge would cause, have the potential to cause, or contribute to non-attainment of a water quality standard in a given receiving water. It should be noted that such an analysis may be more difficult for mobile sources such as vessels, but in general, greater mixing and dilution would be expected for mobile sources. Pathogen Indicators Wastewater may contain many pathogens of concern to human health, including Salmonella, shigella, hepatitis A and E, and gastro-intestinal viruses (National Research Council, 1993). Pathogen contamination in swimming areas and shellfish beds poses potential risks to human health and the environment by increasing the rate of waterborne illnesses (Pruss, 1998; Rees, 1993; National Research Council, 1993). Shellfish feed by filtering particles from the water, concentrate bacteria and viruses from the water column, and pose the risk of disease in consumers when eaten raw (National Research Council, 1993; Wu, 1999). The NRWQC for pathogen indicators references the bacteria standards in EPA’s 1986 Quality Criteria for Water, commonly known as the Gold Book. The Gold Book standard for bacteria is described in terms of three different waterbody use criteria: freshwater bathing, marine water bathing, and shellfish harvesting waters. The marine water bathing and shellfish harvesting waterbody use criteria shown in Table 3-9 were used for comparison with cruise ship graywater concentrations.
Table 3-9. National Recommended Water Quality Criteria for Bacteria
Waterbody Use Gold Book Standard for Bacteria
Marine Water
Bathing
Based on a statistically sufficient number of samples (generally not less than five samples equally spaced over a 30-day period), the geometric mean of the enterococci densities should not exceed 35 per 100 ml; no sample should exceed a one-sided confidence limit (C.L.) using the following as guidance: 1) Designated bathing beach 75% C.L. 2) Moderate use for bathing 82% C.L. 3) Light use for bathing 90% C.L. 4) Infrequent use for bathing 95% C.L. based on a site-specific log standard deviation, or if site data are insufficient to establish a log standard deviation, then using 0.7 as the log standard deviation.
Shellfish Harvesting
Waters
The median fecal coliform bacterial concentration should not exceed 14 MPN per 100 ml with not more than 10% of samples exceeding 43 MPN per 100 ml for the taking of shellfish.

December 29, 2008
3-22
Pathogen indicator data from untreated graywater consistently exceed the NRWQC for marine water bathing and shellfish harvesting waters (see Tables 3-3 and 3-10). Over 66% of EPA samples for enterococci exceeded the 35 MPN/100 mL standard for marine water bathing. Over 80% of ACSI/ADEC samples for fecal coliform exceeded the 43 MPN/100 mL standard for harvesting shellfish. Given the consistent exceedance of the NRWQC for bacteria, untreated graywater may cause, have the potential to cause, or contribute to non-attainment of water quality standards; a site-specific evaluation would determine if these discharge concentrations would cause, have the potential to cause, or contribute to non-attainment of water quality standards in a given receiving water.
Table 3-10. EPA and ACSI Untreated Cruise Ship Graywater Pathogen Indicator Data
Analyte
Average Concentration (and Range) in Untreated Cruise Ship Graywater
(EPA Data)1
Average Concentration in Untreated Cruise Ship Graywater
(ACSI/ADEC Data)2 Fecal coliform (fecal coliform/100 mL)
36,000,000* (ND [2.00] to 455,000,000)
2,950,000* MPN/100 mL
(ND [2.00] to 32,000,000) Enterococci (MPN/100 mL) 8,920*
(ND [1.00] to 1,600,000) NC
1 Based on EPA sampling data from 2004. 2 Based on data collected by ACSI/ADEC in 2000 and 2001. * Average includes at least one nondetect value; this calculation uses detection limits for nondetected results. “NC” indicates that this information was not collected. Conventional Pollutants and other Common Analytes Conventional pollutants and other common analytes that have a saltwater aquatic life or human health (for the consumption of organisms) narrative NRWQC include oil and grease, settleable residue, total suspended solids (see Table 3-11), and temperature (see Tables 3-11 and 3-12). In addition, the NRWQC include a numeric standard for total residual chlorine (see Table 3-13).
Table 3-11. Narrative National Recommended Water Quality Criteria for Conventional Pollutants and Other Common Analytes
Analyte Gold Book Standard
Oil and Grease For aquatic life: (1) 0.01 of the lowest continuous flow 96-hour LC50 to several important freshwater and marine species, each having a demonstrated high susceptibility to oils and petrochemicals.(2) Levels of oils or petrochemicals in the sediment which cause deleterious effects to the biota should not be allowed. (3) Surface waters shall be virtually free from floating nonpetroleum oils of vegetable or animal origin, as well as petroleum-derived oils.

December 29, 2008
3-23
Settleable and Suspended Solids
Freshwater fish and other aquatic life: Settleable and suspended solids should not reduce the depth of the compensation point for photosynthetic activity by more than 10% from the seasonally established norm for aquatic life.
Temperature Marine Aquatic Life: In order to assure protection of the characteristic indigenous marine community of a waterbody segment from adverse thermal effects, the maximum acceptable increase in the weekly average temperature resulting from artificial sources is 1°C (1.8 °F) during all seasons of the year, providing the summer maxima are not exceeded; and daily temperature cycles characteristic of the waterbody segment should not be altered in either amplitude or frequency. Summer thermal maxima, which define the upper thermal limits for the communities of the discharge area, should be established on a site-specific basis.
Oil and Grease Annual worldwide estimates of petroleum input to the sea exceed 1.3 million metric tonnes (about 380 million gallons) (National Research Council, 2003). Levels of oil and grease of any kind can cause a variety of environmental impacts including the drowning of waterfowl because of loss of buoyancy, preventing fish respiration by coating their gills, asphyxiating benthic organisms from surface debris settling on the bottom, and reducing the natural aesthetics of waterbodies (EPA, 1986). EPA does not have information on cruise ship graywater that would allow us to directly evaluate the narrative NRWQC for oil and grease. Hexane extractable material (HEM) was detected in 100% of EPA’s untreated graywater samples (38 detects out of 38 samples) with detected amounts ranging between 5.6 and 5,010 mg/l. ACSI/ADEC also detected oil and grease in 100% of untreated graywater samples (4 detects out of 4 samples) with detected amounts ranging between 38 and 130 mg/l. However, EPA did not observe any floating oils in their untreated graywater samples; therefore, it is unlikely that there would be floating oils in the receiving water. (ACSI/ADEC did not provide a visual description of their samples to indicate if floating oils were observed.) Settleable and Suspended Solids Solids, either settleable or suspended, may harm marine organisms by reducing water clarity and available oxygen levels in the water column. In addition, solids can directly impact fish and other aquatic life by preventing the successful development of eggs and larva, blanketing benthic populations, and modifying the environment such that natural movements and migration patterns are altered (EPA, 1986). EPA did not directly evaluate cruise ship graywater against the narrative NRWQC for settleable and suspended solids because the criterion is based on conditions in a specific waterbody. Total suspended solids were consistently detected by ACSI/ADEC in untreated graywater samples at levels ranging from 18 to 4,770 mg/l, with an average of 318 mg/l. Total suspended solids were consistently detected by EPA in untreated graywater samples at levels ranging from 24 to 29,400 mg/l, with an average of 704 mg/l. The detected values are substantially higher than the discharge standards for sewage from land-based sewage treatment plants (7-day average shall not

December 29, 2008
3-24
exceed 45 mg/l). A site-specific evaluation would determine if these discharge concentrations would cause, have the potential to cause, or contribute to non-attainment of water quality standards in a given receiving water. Temperature Temperature changes can directly affect aquatic organisms by altering their metabolism, ability to survive, and ability to reproduce effectively. Increases in temperature are frequently linked to acceleration in the biodegradation of organic material in a waterbody, which increases the demand for dissolved oxygen and can stress local aquatic communities. EPA did not directly evaluate cruise ship graywater against the narrative NRWQC for temperature because the criterion is based on conditions in a specific waterbody, such as flushing and the factors that influence flushing. The average temperature from EPA’s untreated graywater samples was 39.6 °C (temperature data were not available for ACSI/ADEC’s untreated graywater samples). Local waterbody temperatures would be needed to determine if the average temperature from untreated graywater would cause, have the potential to cause, or contribute to non-attainment of water quality standards in a given receiving water. Table 3-12 provides a few examples of the water temperatures observed in various coastal waters across the United States. The average temperature for untreated graywater effluent exceeds the temperatures presented in Table 3-12. A site-specific evaluation would determine if the cruise ship discharge volume is significant enough to alter the temperature of a given waterbody. However, considering the size of coastal waterbodies where cruise ships operate, it is unlikely that cruise ship effluent temperatures would cause an increase in waterbody temperature that would exceed the NRWQC.
Table 3-12. Seasonal Coastal Water Temperatures in °C Across the United States
Location State Jan Feb March April May June July Aug Sept Oct Nov Dec
Boston Harbor MA 4.44 2.22 5.00 7.22 12.22 16.11 18.89 20.00 18.89 14.44 10.56 5.56
Baltimore MD 4.44 2.78 6.11 10.56 16.11 21.11 25.00 26.11 25.00 18.89 12.22 6.11
Miami Beach FL 21.67 22.78 23.89 25.56 26.67 28.89 30.00 30.00 28.89 28.33 24.44 22.78
Key West FL 20.56 21.11 23.89 26.11 27.78 30.00 30.56 30.56 30.00 28.33 24.44 22.22
Seattle WA 8.33 7.78 7.78 8.89 10.00 11.67 12.78 13.33 13.33 12.22 10.56 9.44
Los Angeles CA 14.44 14.44 15.56 15.56 16.11 16.67 18.33 20.00 19.44 18.89 17.78 15.56
Galveston TX 12.22 12.78 16.11 21.67 25.56 28.33 30.00 30.00 28.33 23.89 19.44 15.00
Juneau AK 2.22 2.22 2.78 4.44 7.78 10.56 11.11 10.56 9.44 6.67 4.44 3.33
Honolulu HI 24.44 24.44 24.44 24.44 25.56 26.11 26.67 26.67 27.22 27.22 26.11 25.00
Source: National Oceanographic Data Center Coast Water Temperature Guide (www.nodc.noaa.gov/dsdt/wtg12.html)
Total Residual Chlorine Chlorine is extremely toxic to aquatic organisms. Chlorine concentrations as low as 3 μg/l can result in a high mortality rate for some species (EPA, 1984). In fish, exposure to low levels of total residual chlorine (<1,000 μg/l) can cause avoidance behavior, respiratory problems, and

December 29, 2008
3-25
hemorrhaging (Vetrano, 1998). Fish may recover once removed from the chlorine environment, but the severity of the reaction and chance of death increases as the concentration of total residual chlorine increases (Booth et al., 1981). Studies have shown that continuous chlorination can lead to a shift in the composition of phytoplankton communities, thus altering the benthic and fish communities that feed on them (Sanders and Ryther, 1980). Total residual chlorine concentrations were not available for EPA’s untreated graywater samples. The average concentration of total residual chlorine from ACSI/ADEC’s untreated graywater sampling data exceeded the NRWQC for total residual chlorine (see Table 3-13). A site-specific evaluation would determine if these discharge concentrations would cause, have the potential to cause, or contribute to non-attainment of water quality standards in a given receiving water. The most likely source for total residual chlorine in untreated graywater is from the chlorination of the drinking water on the cruise ship.
Table 3-13. Comparison of Untreated Cruise Ship Graywater to Numeric National Recommended Water Quality Criteria for Total Residual Chlorine
Analyte
Average Concentration
in Untreated Cruise Ship Graywater
(ACSI/ADEC Data)1
NRWQC Criteria
Maximum Concentration
(CMC)2
NRWQC Criterion
Continuous Concentration
(CCC)2
Total Residual Chlorine (μg/l) 372*^ 13 7.5 1 Based on data collected by ACSI/ADEC in 2000 and 2001. 2 The National Recommended Water Quality Criteria for chlorine in marine waters are expressed as chlorine-
produced oxidants as measure by total residual chlorine. * Average includes at least one nondetect value; this calculation uses detection limits for nondetected results. ^ The minimum detection limit for total residual chlorine reported by most analytical labs is 100 μg/l. Metals In the aquatic environment, elevated concentrations of metals can be toxic to many species of algae, crustaceans, and fish. Exposure to metals at toxic levels can cause a variety of changes in biochemical, physiological, morphological, and behavioral patterns in aquatic organisms. One of the key factors in evaluating metal toxicity is the bioavailability of the metal in a waterbody. Some metals have a strong tendency to adsorb to suspended organic matter and clay minerals, or to precipitate out of solution, thus removing the metal from the water column. The tendency of a given metal to adsorb to suspended particles is typically controlled by the pH and salinity of the waterbody. If the metal is highly sorbed to particulate matter, then it is likely not in a form that organisms can process. Therefore, a high concentration of a metal measured in the total form may not be an accurate representation of the toxic potential to aquatic organisms. Accordingly, NRWQC for the protection of aquatic life for metals are typically expressed in the dissolved form. In contrast, human health criteria (for the consumption of organisms) for metals are commonly expressed in the total metal form. The use of total metals for human health criteria is because human exposure to pollutants is assumed to be through the consumption of organisms,

December 29, 2008
3-26
where the digestive process is assumed to transform all forms of metals to the dissolved phase, thus increasing the amount of biologically available metals. EPA detected in the untreated graywater samples several dissolved metals that are common components of ship piping -- copper, nickel, and zinc -- at levels approximately 2 to 63 times above NRWQC for aquatic life (see Table 3-14). Both EPA and ACSI/ADEC detected total arsenic in 10% or more of samples with average concentrations exceeding the NRWQC for human health (for the consumption of organisms) (see Table 3-14). EPA also detected total thallium in untreated graywater at levels exceeding the NRWQC for human health (for the consumption of organisms). A site-specific evaluation would determine if these untreated graywater concentrations would cause, have the potential to cause, or contribute to non-attainment of water quality standards in a given receiving water. However, as discussed in section 3.4.3 on Mixing and Dilution below, these analytes would likely meet NRWQC after initial mixing (about 1 to 7 meters from the ship) even when a vessel is at rest.
Table 3-14. Comparison of Untreated Cruise Ship Graywater to National Recommended Water Quality Criteria for Metals
Analytes that Exceed One or More
NRWQC1
Average Concentration in Untreated Cruise Ship Graywater
(EPA Data)2
Average Concentrationin Untreated Cruise Ship Graywater
(ACSI/ADEC Data)3
NRWQC Criteria
Maximum Concentration
(CMC)
NRWQC Criterion
Continuous Concentration
(CCC)
NRWQC Human Health
(for the Consumption of Organisms)
Arsenic (Total) (μg/l) 2.25* 1.22 0.14
Copper (Dissolved) (μg/l) 195 NC 4.8 3.1
Nickel (Dissolved) (μg/l) 18.2 NC 74 8.2
Thallium (Total) (μg/l) 0.930* ND 0.47
Zinc (Dissolved) (μg/l) 1,610 NC 90 81 1 Analytes are not listed in this table if the number of detects was not considered representative of untreated cruise
ship graywater (i.e., less than 10% of samples), if the data were not in the correct form for comparison with NRWQC, or if the average concentration was driven by detection limits.
2 Based on EPA sampling data from 2004. 3 Based on data collected by ACSI/ADEC in 2000 and 2001. * Average includes at least one nondetect value; this calculation uses detection limits for nondetected results. “NC” indicates that this information was not collected. “ND” indicates that the analyte was not detected. Semivolatile and Volatile Organics Table 3-15 presents the organic compounds detected in untreated graywater that exceed NRWQC. Note that EPA and ACSI/ADEC did not test graywater for all organic compounds that have a NRWQC. The magnitude of the exceedances of NRWQC for the semivolatile and volatile organic compounds discussed in this subsection ranged from 3.2 to 33 times the standard. A site-specific evaluation would determine if these discharge concentrations would

December 29, 2008
3-27
cause, have the potential to cause, or contribute to non-attainment of water quality standards in a given receiving water. However, as discussed in section 3.4.3 below, these analytes would likely meet NRWQC after initial mixing (about 1 to 7 meters from the ship) even when a vessel is at rest.
Table 3-15. Comparison of Untreated Cruise Ship Graywater to National Recommended Water Quality Criteria for Semivolatile and Volatile Organics
Analytes that Exceed One or More NRWQC1,2
Average Concentration in Untreated Cruise Ship
Graywater (EPA Data)3
Average Concentration in Untreated Cruise
Ship Graywater (ACSI/ADEC Data)4
NRWQC Human Health
(for the Consumption of
Organisms)
Bis(2-ethylhexyl) phthalate (μg/l) 71.9* 22.4* 2.2
Tetrachloroethylene (μg/l) 11.4* 10.7* 3.3 1 Analytes are not listed in this table if the number of detects was not considered representative of untreated cruise
ship graywater (i.e., less than 10% of samples), if the data were not in the correct form for comparison with NRWQC, or if the average concentration was driven by detection limits.
2 Untreated graywater data were not available for all analytes that have a NRWQC. Therefore this table may not include all analytes that exceed NRWQC.
3 Based on EPA sampling data from 2004. 4 Based on data collected by ACSI in 2000 and 2001. * Average includes at least one nondetect value; this calculation uses detection limits for nondetected results. Bis(2-ethylhexyl) phthalate is a manufactured chemical that is commonly added to plastics to make them flexible and can be found in a variety of common products such as wall coverings, tablecloths, floor tiles, furniture upholstery, and shower curtains. Tetrachloroethylene is widely used in dry cleaning and for metal-degreasing. Nutrients Untreated graywater contains nutrients, such as nitrogen and phosphorus, which are important elements for aquatic plant and algae growth. The influx of excess nutrients can negatively effect marine ecosystems, resulting in diebacks of corals and seagrasses, eutrophication (oxygen-depleted “dead” zones), and increases in harmful algal blooms that can alter the seasonal progression of an ecosystem and choke or poison other plants and wildlife (National Research Council, 1993). Ammonia is the only nutrient for which there is a numeric saltwater or human health (for the consumption of organisms) NRWQC. In the aquatic environment, ammonia exists in the unionized (NH3) and ionized (NH4
+) forms. Unionized ammonia is the more toxic form of the two, with several factors such as pH, temperature, and salinity determining the toxicity to aquatic organisms. Acute levels of NH3 that are toxic to fish can cause a loss of equilibrium, hyperexcitability, and increased breathing, cardiac output, and oxygen uptake (WHO, 1986). Extreme concentrations can cause convulsions, coma, and even death.

December 29, 2008
3-28
The marine NRWQC references EPA’s 1989 Ambient Water Quality Criteria for Ammonia (Saltwater) document, which includes a matrix table for ammonia standards based on the pH, temperature, and salinity of a waterbody. Table 3-16 presents the average concentration of ammonia in untreated graywater. Table 3-17 presents examples of the ammonia NRWQC calculated from pH, temperature, and salinity at some cruise ship ports of call in the United States.
Table 3-16. Ammonia Concentration in Untreated Graywater
Analyte Average Concentration in EPA
Graywater Sampling1 Average Concentration in ACSI
Graywater Sampling2 Ammonia (NH3-N μg/l) 2,130* 2,210* 1 Based on EPA sampling data from 2004. 2 Based on data collected by ACSI in 2000 and 2001. * Average includes at least one nondetect value; this calculation uses detection limits for nondetected results.
Table 3-17. Calculated Ammonia NRWQC for Some Cruise Ship Ports of Call in the United States
Location State pH
Average Temperature
(°C) Salinity
(psu)
NRWQC Criteria Maximum
Concentration (CMC) (NH3-N μg/l)4
NRWQC Criterion Continuous Concentration (CCC)
(NH3-N μg/l)4
Galveston Bay1 TX 8.1 29.0 14.0 2,140 321
Honolulu Harbor1 HI 8.0 25.5 34.4 4,110 617
Los Angeles Harbor1 CA 8.1 17.4 32.6 7,110 1,110
Port of Miami2 FL 8.0 25.3 32.0 4,110 617
Monterey Harbor1 CA 8.1 15.3 32.9 6,860 1,070
New York Harbor1 NY 7.5 22.1 22.9 11,500 2,960
Southeast Alaska3 AK 7.8 12.5 20.0 15,600 2,340
Portland Harbor1 ME 7.8 19.4 29.6 9,040 1,400 1 Data source: EPA’s EMAP National Coastal Database (http://oaspub.epa.gov/coastal/coast.search) 2 Data source: South Florida Water Management District Monitoring Stations
(http://glades.sfwmd.gov/pls/dbhydro_pro_plsql/water_quality_interface.main_page) 3 Data source: Draft State of Alaska Department of Environmental Conservation Large Commercial Passenger
Vessel Wastewater Discharge General Permit No. 2007DB0002 (www.dec.state.ak.us/water/cruise_ships/pdfs/PN%20Version%20LPV%20WWGP%20-%20DRAFT.pdf)
4 Ammonia standards were calculated based on pH, temperature, and salinity values for each waterbody using the matrix table provided in EPA’s 1989 Ambient Water Quality Criteria for Ammonia (Saltwater) document. In cases where measured values fell between column and row headings for pH and temperature the standard was approximated based on the closest value. In addition, the ammonia standards were converted from μg-NH3/l to μg-NH3-N/l by multiplying the standard by 0.822.

December 29, 2008
3-29
Average concentrations of ammonia in untreated graywater exceed most of the NRWQC Criteria Continuous Concentration and one of the NRWQC Criteria Maximum Concentration presented in Table 3-17. Although ammonia standards can vary from waterbody to waterbody, there is only a small range of pH, temperature, and salinity values that result in a chronic ammonia standard that untreated graywater concentrations will not exceed. This suggests that ammonia concentrations in untreated graywater at the end-of-pipe are likely to exceed chronic NRWQC regardless of the receiving water. A site-specific evaluation would determine if these discharge concentrations would cause, have the potential to cause, or contribute to non-attainment of water quality standards in a given receiving water. However, as discussed in section 3.4.3 below, ammonia in untreated graywater would likely meet NRWQC after initial mixing (about 1 to 7 meters from the ship) even when a vessel is at rest. For additional discussion of the potential impacts of nutrients in cruise ship discharges, see Section 2. 3.4.3 Mixing and Dilution Although average analyte concentrations in cruise ship untreated graywater exceed some NRWQC at the end-of-pipe, the mixing and dilution that occurs following discharge also is relevant to an evaluation of potential environmental impact. Dilution at Rest A Science Advisory Panel created by the ACSI used the Cornell Mixing Zone Expert System model to estimate dilution of effluent achieved when a vessel is at rest. Their modeling showed that a discharge rate of 50 m3/hr yields a dilution factor of 36 at a distance of about 4.5 m from the ship, and a dilution factor of 50 at 7 m from the ship after 43 seconds (ADEC, 2002, Appendix 8, footnote 50). The ADEC modeled the dilution of large cruise ship effluent during stationary discharge under a very conservative scenario (a neap tide in Skagway Harbor), using the Visual Plumes model. Their modeling showed the dilution factors ranging from 5 to 60, which would occur between 1 and 7 meters from the ship (ADEC, 2004). This dilution factor may not necessarily apply to situations where the discharge port faces a dock, pilings, or other another obstruction. The initial dilution estimated by ACSI and ADEC for a vessel at rest would not likely be great enough for untreated graywater to meet all NRWQC, in particular fecal coliform and enterococci (see Tables 3-9 and 3-10). However, most of the other analytes that exceed NRWQC at the end-of-pipe would likely meet NRWQC after initial mixing when the vessel is at rest, based on the initial dilution factors discussed above. For example, metal exceedances at the end-of-pipe ranged from 2 to 63 times the lowest NRWQC (see Table 3-14), and ammonia was 7 times the lowest estimated NRWQC (see Tables 3-16 and 3-17). It is important to note that the initial mixing estimates discussed above are based on ship and waterbody-specific input parameters such as discharge port size, effluent flow, waterbody temperature, and salinity. Therefore, they are not necessarily representative of the dilution factors that would be achieved by cruise ships in other ports of call in the United States. Site-
December 29, 2008
3-30
specific and ship-specific calculations would be required to determine the dilution for ships in other locations. Dilution Underway For vessels underway, there is significant additional dilution due to movement of the vessel and mixing by ship propellers. In 2001, EPA conducted dye dispersion studies behind four large cruise ships while underway off the coast of Miami, Florida. The results of this study indicate that dilution of discharges behind cruise ships moving between 9.1 and 17.4 knots are diluted by a factor of between 200,000:1 and 640,000:1 immediately behind the boat (EPA, 2002). Based on these dilution factors, graywater would likely meet all NRWQC except for fecal coliform while underway. 3.4.4 Potential Treatment Technologies in Addition to AWTs As part of its assessment of the cruise ship sewage and graywater discharge standards in Alaska, EPA evaluated upgrades to AWTs and technologies that could be added on to AWTs that would improve the quality of the treated effluent in terms of nutrients, metals, and temperature. See Section 2 (subsection 2.4.4) for a discussion of these potential treatment technologies.
3.5 What action is the federal government taking to address graywater waste streams from
cruise ships? EPA is evaluating the performance of advanced sewage and graywater treatment systems. EPA is evaluating the performance of various advanced sewage and graywater treatment systems as part of its effort to assess whether revised or additional standards for sewage and graywater discharges from large cruise ships operating in Alaska are warranted under Title XIV (see subsection 2.2.3). Some of the results of this intensive effort, including sampling four different AWTs and a survey questionnaire for all cruise ships operating in Alaska in 2004, are summarized in this Assessment Report. EPA anticipates making these full analyses publicly available in 2009. As part of this effort, EPA in conjunction with the ADEC conducted a scientific survey in July 2008 using EPA’s Ocean Survey Vessel Bold to (1) measure the dilution of AWT discharges from stationary cruise ships, and (2) evaluate the potential environmental impact of nutrients in AWT discharges. EPA anticipates making the results of these studies publicly available in 2009. EPA is developing a water permit program for pollutant discharges incidental to the normal operation of vessels. Under a U.S. District Court decision, the existing EPA regulations that exclude discharges incidental to the normal operation of a vessel from CWA permitting were vacated (revoked) as of December 19, 2008. The District Court’s decision to vacate that exclusion was recently upheld by the Ninth Circuit Court of Appeals. NW. Envt’l Advocates et al. v. EPA, 537 F.3d 1006 (9th Cir. 2008). Thus, as explained in section 1.1, as of December 19, 2008, discharges incidental to the normal operation of vessels into waters of the U.S. from cruise ships 79 feet or more in length are subject to National Pollutant Discharge Elimination System permitting.

December 29, 2008
3-31
Coast Guard has developed regulations implementing the monitoring requirements of Title XIV. Under Title XIV, the Coast Guard has implemented an inspection regime that includes sampling of cruise ship sewage and graywater discharges in Alaskan waters. In July 2001, Coast Guard published a final rule (33 CFR 159.301-321) that outlines its oversight of cruise ships sampling in Alaskan waters. Coast Guard is conducting a review of inspection and enforcement policies. The Coast Guard has started a review of their inspection and enforcement policies and regulations for cruise ship environmental practices. This review includes a survey of inspectors from Coast Guard regions, focusing on MSDs, oil/water separators, and the effectiveness and feasibility of various inspection practices. California National Marine Sanctuaries propose to prohibit cruise ship graywater discharges. Under the National Marine Sanctuaries Act (16 U.S.C. § 1431 et seq.), the Monterey Bay, Gulf of the Farallones, and Cordell Bank National Marine Sanctuaries have proposed regulations to prohibit the discharge of treated and untreated graywater from large vessels, including cruise ships (71 FR 59050, Oct. 6, 2006; 71 FR 59338, Oct. 6, 2006; 71 FR 59039, Oct. 6, 2006). NOAA is currently reviewing the comments on these proposed rules. The Channel Islands National Marine Sanctuary has published a proposed rule (73 CFR 16580, March 28, 2008) to revise a proposed action concerning vessel discharges (71 FR 29096, Oct. 5, 2006). The proposed rule containing the revision includes a prohibition on treated and untreated graywater from cruise ships. NOAA is currently reviewing the comments on this proposed rule. National Park Service manages cruise ship waste streams in Glacier Bay National Park. The National Park Service (NPS) manages cruise ship waste streams indirectly in Glacier Bay National Park through competitively awarded concession contracts. The NPS has jurisdiction over the submerged lands and marine waters of Glacier Bay National Park up to 3 miles from the mean high tide line and including all of Glacier Bay proper. Glacier Bay is a well known, very popular attraction for the cruise ship industry in Alaska. Recent environmental reviews and decisions allow up to two cruise ship entries per day into Glacier Bay proper during the primary visitor season. Cruise ship operations in the park are authorized under concession contracts, which are awarded under a competitive solicitation and prospectus process. Impact on park resources is a general standard selection criterion for park concessions. The NPS uses waste stream management as one of a number of selection criteria in this regard. In the past, cruise ship operators have usually proposed to minimize the impact of waste streams by committing to a no-discharge policy while in the park (even if legal under applicable law) for sewage, graywater, ballast water, bilge water, cooling water, hazardous waste, and solid waste. If awarded a contract, companies must comply with their proposal. Typically cruise ships operate in the park for 8-10 hours and then depart. They do not dock or transfer any wastes to shore while in the park.

December 29, 2008
3-32
3.6 Possible Options and Alternatives to Address Graywater from Cruise Ships Based on the public comments received on the draft of this report as well as other information gathered, listed below are a wide range of options and alternatives that address graywater from cruise ships. Identification of any particular option does not imply any EPA recommendation or preference for future action, or that EPA has determined that any of these options are necessary or feasible, or that EPA believes a change to the status quo is warranted, or that EPA or any other entity has the legal authority to implement that option. Prevention & Reduction
Establish standards or best management practices for design, operation, maintenance and/or training that will decrease or eliminate the contaminants and/or volume of untreated graywater and/or treated graywater effluent.
Control: Discharge Standards
Establish and/or revise standards for the discharge of graywater, for example, o to require attainment of national federal water quality criteria at point of
discharge. o to require attainment of national federal water quality criteria at the edge of a
mixing zone. o to require attainment of applicable state water quality standards. o to require attainment of secondary treatment standards for publicly owned
treatment works. o to require the reduction attainable through application of the best available
technology economically achievable. o to require technology that would eliminate remaining pollutants of concern (i.e.,
reduce to level below concern). o to require use of Advanced Wastewater Treatment systems. o to apply Title XIV standards (which apply in certain Alaskan waters) nationwide. o to address additional parameters, e.g., additional pathogen indicators. o to account for potential bioaccumulation. o to require period sampling and testing. o to require more stringent standards in areas frequented by multiple cruise ships. o to define which waste streams/pollutants may be sent to the graywater system.
Control: Geographic Restrictions on Discharge
Restrict discharge of untreated or all graywater, for example, o no discharge out to a certain distance (e.g., 3 miles from shore, 12 miles from
shore, 12 nautical miles from the 20-meter contour line). o no discharge in or within a certain distance (e.g., 0.5 nautical miles, 4 nautical
miles) of sensitive areas (e.g., shellfish, ports, coral reefs, bathing beaches, water bodies with restricted circulation, flushing or inflow, marine protected areas, breeding grounds, near large population centers).
o no discharge in any U.S. waters. o require shore-side discharge. o withhold discharge when a system upset occurs.

December 29, 2008
3-33
Enforcement & Compliance Assurance: Monitoring
Require sampling and testing of untreated and/or treated graywater to ensure that it meets applicable standards
o by government agencies with enforcement authority. o by third-parties. o by cruise lines.
Require onboard observers to monitor all sampling, monitoring, and other effluent-related requirements/to oversee discharging practices, equipment operation and maintenance, and the completion and submittal of accurate logbooks.
Require rapid testing methods for pathogen indicators. Enforcement & Compliance Assurance: Reporting
Require certain reporting by cruise ship operators, for example, o immediate notification to appropriate agencies in the event of an treatment system
malfunction or upset. o disclosure of implementation or non-implementation of pollution reduction and
prevention practices, including but not limited to treatment systems, in all advertisements in the U.S.
o advance notification from ships planning to discharge in U.S. waters. o notification to appropriate agencies of all discharges of untreated graywater or
treated graywater effluent in U.S. waters. o notification of discharges in state waters to appropriate state agencies.
Require electronic transponders to signal land-based authorities when a discharge line is opened or closed.
Enforcement & Compliance Assurance: Inspections & Enforcement
Penalties for failure to meet treated or untreated graywater standards. Increase inspections and inspection requirements. Establish a funding mechanism based on the polluter-pays model that will provide
revenues to develop and implement a comprehensive regulatory scheme. Impose uniform requirements on all ships as a condition of port entry and within waters
under the jurisdiction of the U.S. consistent with international law, regardless of flag state.
Prohibit or otherwise restrict noncompliant vessels (and sister ships, depending on the degree of involvement by parent companies) from operating in sensitive areas of the marine environment under U.S. jurisdiction.

December 29, 2008
3-34
References Alaska Department of Environmental Conservation (ADEC). 2000. Alaska Cruise Ship Initiative
Part 1 Final Report. Juneau, AK. (www.dec.state.ak.us/water/cruise_ships/pdfs/finreportp10808.pdf)
Alaska Department of Environmental Conservation (ADEC). 2001. Alaska Cruise Ship Initiative
Part 2 Report. Juneau, AK. (www.dec.state.ak.us/water/cruise_ships/pdfs/acsireport2.pdf)
Alaska Department of Environmental Conservation (ADEC). 2002. The Impact of Cruise Ship
Wastewater Discharge on Alaska Waters. Juneau, AK. (www.dec.state.ak.us/water/cruise_ships/pdfs/impactofcruiseship.pdf)
Alaska Department of Environmental Conservation (ADEC). 2004. Assessment of Cruise Ship
and Ferry Wastewater Impacts in Alaska. Juneau, AK. (www.dec.state.ak.us/water/cruise_ships/assessreport04.htm)
Booth, P.M., Jr., Sellers, C.M., Jr., & Garrison, N.E. 1981. Effects of Intermittent Chlorination
on Plasma Proteins of Rainbow Trout (Salmo gairdneri). Bull. of Env. Contam. & Tox 26(2): 163-170.
Cruise Lines International Association (CLIA). 2006. CLIA Industry Standard: Cruise Industry
Waste Management Practices and Procedures. Fort Lauderdale, FL. (www.cruising.org/industry/PDF/CLIAWasteManagementAttachment.pdf and www.cruising.org/industry/PDF/CLIAWasteManagement.pdf)
Metcalf & Eddy. 1991. Wastewater Engineering: Treatment and Reuse, Third Edition. New
York, NY: McGraw Hill. Mayer, Peter W. and William B. DeOreo. 1998. Residential End Uses of Water. Aquacraft, Inc.
Water Engineering and Management. American Water Works Association. (www.aquacraft.com/Publications/resident.htm)
National Research Council (NRC): Committee on Wastewater Management for Coastal Urban
Areas, Water Science and Technology Board, Commission on Engineering and Technical Systems. 1993. Managing Wastewater in Coastal Urban Areas. Washington, DC: National Academy Press. (http://www.nap.edu/catalog.php?record_id=2049#toc)
National Research Council (NRC): Committee on Oil in the Sea: Inputs, Fates, and Effects.
2003. Oil in the Sea III: Inputs, Fates, and Effects. Washington, DC: National Academy Press. (http://www.nap.edu/catalog.php?record_id=10388#toc)
Pruss, Annette. 1998. Review of epidemiological studies on health effects from exposure to
recreational water. International Journal of Epidemiology 27: 1-9.

December 29, 2008
3-35
Rees, G. 1993. Health Implications of Sewage in Coastal Waters - the British Case. Marine Pollution Bulletin 26(1): 14-19.
Sanders, J.G., & Ryther J.H. 1980. Impact of Chlorine on the Species Composition of Marine
Phytoplankton. In: R.L. Jolley, et al. (Eds.), Water Chlorination: Environmental Impact and Health Effects, 3: 631. Ann Arbor, MI: Ann Arbor Science Publishers.
U.S. Environmental Protection Agency. 1984. Ambient Water Quality Criteria for Chlorine (EPA 440/5-84-030). Washington, DC. (http://www.epa.gov/ost/pc/ambientwqc/chlorine1984.pdf)
U.S. Environmental Protection Agency. 1986. Quality Criteria for Water (EPA 440/5-86-001).
Washington, DC. (http://www.epa.gov/waterscience/criteria/goldbook.pdf) U.S. Environmental Protection Agency. 1989. Ambient Water Quality Criteria for Ammonia
(Saltwater)(EPA 440/5-88-004). Washington, DC. (http://www.epa.gov/waterscience/pc/ambientwqc/ammoniasalt1989.pdf)
U.S. Environmental Protection Agency. 1991.Technical Support Document for Water Quality-
based Toxics Control (EPA 505-290-001). Washington, DC. (http://www.epa.gov/npdes/pubs/owm0264.pdf)
U.S. Environmental Protection Agency. 2002. Cruise Ship Plume Tracking Survey Report
(EPA842-R-02-001). Washington, DC. (http://www.epa.gov/owow/oceans/cruise_ships/plumerpt2002/plumereport.pdf)
U.S. Environmental Protection Agency. 2004. Survey Questionnaire to Determine the
Effectiveness, Costs, and Impacts of Sewage and Graywater Treatment Devices for Large Cruise Ships Operating in Alaska (EPA Form No. 7500-64). Washington, DC. (http://www.epa.gov/owow/oceans/cruise_ships/cruise_ship_survey.pdf)
U.S. Environmental Protection Agency. 2006a. Sampling Episode Report for Holland America
Veendam (Sampling Episode 6503). Washington, DC. (http://www.epa.gov/owow/oceans/cruise_ships/Veendam/VeendamSER.pdf)
U.S. Environmental Protection Agency. 2006b. Sampling Episode Report for Norwegian Star
(Sampling Episode 6504). Washington, DC. (http://www.epa.gov/owow/oceans/cruise_ships/FinalStar/FinalStarSERNCBI.pdf)
U.S. Environmental Protection Agency. 2006c. Sampling Episode Report for Princess Cruise
Lines – Island Princess (Sampling Episode 6505). Washington, DC. (http://www.epa.gov/owow/oceans/cruise_ships/Island/IslandSER.pdf)
U.S. Environmental Protection Agency. 2006d. Sampling Episode Report for Holland America
Oosterdam (Sampling Episode 6506). Washington, DC. (http://www.epa.gov/owow/oceans/cruise_ships/Oosterdam/OosterdamFinal.pdf)

December 29, 2008
3-36
U.S. Environmental Protection Agency. 2006e. Sampling Episode Report for Nitrogen Compounds Characterization (Sampling Episodes 6517 Through 6520). Washington, DC. (http://www.epa.gov/owow/oceans/cruise_ships/nitrogen/nitrogen_NCBI.pdf)
Vetrano, K.M. 1998. Molecular Chlorine: Health and Environmental Effects. TRC
Environmental Corporation. Windsor, CT. World Health Organization (WHO). 1986. Ammonia Environmental Health Criteria 54. Geneva,
Switzerland. (http://www.inchem.org/documents/ehc/ehc/ehc54.htm) Wu, R.S.S. 1999. Eutrophication, Water Borne Pathogens and Xenobiotic Compounds:
Environmental Risks and Challenges. Marine Pollution Bulletin 39: 11-22.

December 29, 2008
Section 4: Oily Bilge Water Oily bilge water is the mixture of water, oily fluids, lubricants, cleaning fluids, and other similar wastes that accumulate in the lowest part of a vessel from a variety of different sources including engines (and other parts of the propulsion system), piping, and other mechanical and operational sources found throughout the machinery spaces of a vessel. On most cruise ships, oily bilge water can be managed in one of two ways: (1) retained onboard in a holding tank and discharged later to a reception facility on shore, or (2) treated onboard with an Oily Water Separator (OWS) after which the treated bilge water can be discharged overboard in accordance with applicable standards and regulations. This section discusses the current state of information about bilge water, the laws regulating bilge water discharges from vessels, the types of equipment used to treat bilge water generated on cruise ships, the potential environmental impacts of cruise ship bilge water, and federal actions taken to address bilge water from cruise ships. The conclusion of this section lists a wide range of options and alternatives that could be considered when addressing oily bilge water from cruise ships. 4.1 What is bilge water and how much is generated on cruise ships? Bilge water is the mixture of water, oily fluids, lubricants, cleaning fluids, and other similar wastes that accumulate in the lowest part of a vessel from a variety of different sources including the main and auxiliary engines; boilers, evaporators and related auxiliary systems; equipment and related components; and other mechanical and operational sources found throughout the machinery spaces of a vessel. It is not uncommon on ships for oil or water to leak into the bilge from these sources, various seals, gaskets, fittings, piping, connections, and from related maintenance and activities associated with these systems. These leaks, along with onboard spills, wash waters generated during the daily operation of a vessel, and waste water from operational sources (e.g., condensate from air coolers, etc.), collect in the bilge. Machinery spaces onboard cruise ships are complex power plants used to develop propulsion energy, electrical energy, and fresh water, as well as manage sewage and other wastes generated throughout the vessel. The machinery spaces onboard are very large and are not too different from shore side power plants. Cruise ship machinery spaces consist of tanks, pumps, fittings, flanges, valves, control valves, and literally thousands of miles of piping and tubing, all used to manage the various fluids within the different systems. Although this menagerie of systems is designed to be leak free, many leaks develop due to lack of maintenance and repair of failed seals, gaskets, pump shaft seals, machinery casing gaskets and other components. The sizes of these leaks may vary tremendously and the size may be measured in ounces per minute or gallons per minute, depending on the severity of the leak. Further, the type of fluid leaked may vary, resulting in a complex mixture of fluids in the vessel’s bilge. This mixture can be difficult to separate and the oil content may be difficult to monitor with some of the best equipment. Bilge water is the most common source of oil pollution from cruise ships (National Association of Attorneys General, 2000).
4-1

December 29, 2008
In addition to containing oil and grease, bilge water may contain solid wastes such as rags, metal shavings, paint, glass, and a variety of chemical substances (U.S. Environmental Protection Agency, 1997). Bilge water may contain various oxygen-demanding substances, volatile organic compounds, semi-volatile organics, inorganic salts, and metals. Bilge water also may contain other contaminants such as soaps, detergents, dispersants, and degreasers used to clean the engine room. These cleaning agents create an emulsion and prevent separation of oil and water. Moreover, they are often incompatible with Oily Water Separators and Oil Content Monitors. Due to the various sources that contribute to the production of bilge water, the composition of bilge water varies from vessel to vessel, and from day to day. Other waste streams discussed in this Assessment Report, such as sewage and graywater (see Sections 2 and 3, respectively), are typically contained within their own systems and might only be present in bilge water as a result of leaks. The amount of bilge water that accumulates onboard can vary, and depends on a number of factors including the size of the ship, engine room design, preventative maintenance, and the age of the components. Accumulation of bilge water is ongoing and needs to be properly managed, because if too much accumulates, it can cause damage to the propulsion systems and ancillary machinery on the vessel, as well as present a fire hazard and impact the vessel’s stability. Periodically, it is necessary to pump out the bilge spaces into a holding tank, which allows the vessel to maintain stability and eliminates potentially hazardous conditions from the accumulation of bilge water on the tank tops within the machinery spaces. Large vessels such as cruise ships have several additional waste streams that contain sludge, waste oil, and oily water mixtures, including fuel oil sludge, lubricating waste oil, and cylinder oil, that can inadvertently find their way to the bilge. Sludge is produced by the constant purification of fuel, for the removal of contaminants improves low quality fuels and prevents damage to the ship’s engines and highly machined components. As the fuel is purified by centrifuges virtually continuously, the contaminants removed by the oil purifiers eventually drain into a sludge tank. Lubricating oil needed for the ship's engines are processed in the same fashion – removing various solids, water, and byproducts of combustion that contaminate the oil. Cylinder oil comes from the oil injected along the cylinder walls in the engine and contains contaminants from the combustion process. All of these waste oils are typically drained to individual drain tanks and ultimately to a common sludge tank. The production of sludge derived from the fuel oil, unlike sludge derived from bilge water, remains fairly constant and is usually at least 1-2% of the heavy fuel oil consumed onboard. Among the impurities separated out by the purifiers are water and oily water. Most often sludge and bilge water systems are separate. However, management practices on some ships may lead to cross contamination of the bilge water from the sludge tank. For example, if the same pumps and manifolds are used for transferring both sludge and bilge water, there may be residual sludge and oil in the pipes from sludge when that system is then used for the bilge system. Also, if the oily water from the sludge tank is removed and decanted to the bilge water holding tank, it may also bring with it greater concentrations of oil and sludge particles.
4-2

December 29, 2008
The Alaska Department of Environmental Conservation (2000) reported that cruise ships operating in Southeast Alaska produced 1,300 to 5,300 gallons of bilge water every 24 hours. Table 4-1 shows the bilge water production and treatment capacities based on ship tonnage.
Table 4-1. Maximum Daily Volume of Bilge Water Production
Ship Tonnage (Gross Tons)
Passenger and Crew Capacity
Bilge Water Production (max. gallons/day)
Bilge Water Treatment Capacity
(max. gallons/day) 22,000 1,100 1,000 5,000
46,000-48,000 1,500-2,160 3,000 4,000 50,700-55,400 1,850-2,380 5,000 5,000 76,000-78,000 2,700-3,200 2,640 6,400
Source: ADEC, 2000 It should be noted that although there could be a proportional relationship between ship tonnage and bilge water produced, many variables exist that can easily cause a smaller vessel to produce more bilge wastes than a larger vessel. For example, a vessel with just six small 1/8 inch size leaks and four ¼ inch leaks without substantial pressure behind them can produce over 1.43 millions gallons per year or the equivalent of 15 metric tons per day. Bilge ingress values or total accumulations can vary widely across a fleet of sister vessels simply due to one or a few mechanical concerns. 4.2 What federal laws apply to bilge water from cruise ships? 4.2.1 International Convention for the Prevention of Pollution from Ships and the Act to
Prevent Pollution from Ships The International Convention for the Prevention of Pollution from Ships (MARPOL) MARPOL Annex I, Regulations for the Prevention of Pollution by Oil, addresses oil pollution and lists oil prevention requirements for machinery spaces on all ships covered by the Convention and provides requirements for cargo areas of oil tankers. The requirements of MARPOL Annex I cover all petroleum products, including crude oil, fuel oil, oily waste, oily mixtures located in the bilge, and petroleum products in cargo spaces of oil tankers. In 1983, the United States ratified MARPOL Annex I. The Act to Prevent Pollution from Ships (APPS) The Act to Prevent Pollution from Ships (APPS; 33 U.S.C. § 1901 et seq.) is the federal law implementing those provisions of MARPOL that have been ratified by the United States. With respect to implementation of Annex I, APPS applies to all U.S. flagged ships anywhere in the world, and to all foreign flagged vessels operating in the navigable waters of the United States. Violations of APPS or MARPOL may lead to detention of the vessel in port, denial of port entry, or the initiation of civil or criminal enforcement proceedings.
4-3

December 29, 2008
Applicable Coast Guard regulations The Coast Guard generally has the primary responsibility to prescribe and enforce the regulations necessary to implement APPS in the United States. The following Coast Guard regulations pertain to the management of the discharge of oil or oily mixtures into the sea from ships1: Coast Guard regulations (33 CFR 151.10) provide that, when within 12 nautical miles
(nm) of the nearest land, any discharge of oil or oily mixtures into the sea from a ship is prohibited except when all of the following conditions are satisfied:
(1) The oil or oily mixture does not originate from cargo pump room bilges; (2) The oil or oily mixture is not mixed with oil cargo residues; (3) The oil content of the effluent without dilution does not exceed 15 parts per
million (ppm); (4) The ship has in operation oily-water separating equipment, a bilge monitor,
bilge alarm, or combination thereof, as required by Part 155 Subpart B; and (5) The oily-water separating equipment is equipped with a 15 ppm bilge alarm;
for U.S. inspected ships, approved under 46 CFR 162.050 and for U.S. uninspected ships and foreign ships, either approved under 46 CFR 162.050 or listed in the current International Maritime Organization (IMO) Marine Environment Protection Committee (MEPC) Circular summary of MARPOL approved equipment.
Coast Guard regulations (33 CFR 151.10) provide that, when more than 12 nm from the
nearest land, any discharge of oil or oily mixtures into the sea from a ship is prohibited except when all of the following conditions are satisfied:
(1) The oil or oily mixture does not originate from cargo pump room bilges; (2) The oil or oily mixture is not mixed with oil cargo residues; (3) The ship is not within a special area; (4) The ship is proceeding en route; (5) The oil content of the effluent without dilution is less than 15 ppm; and (6) The ship has in operation oily-water separating equipment, a bilge monitor,
bilge alarm, or combination thereof, as required by Part 155 Subpart B. Additional Coast Guard regulations (33 CFR 151.13) prohibit the discharge of oil or an oily mixture within MARPOL special areas unless the above requirements are met and the vessels oily-water separating equipment is equipped with a device that stops the discharge automatically when the oil content of the effluent exceeds 15 ppm. Further, Coast Guard regulations (33 CFR 151.10) provide that if the bilge water cannot be discharged in compliance with these standards, then it must be retained onboard or discharged to a designated reception facility. However, both MARPOL and the APPS regulations exempt emergency discharges needed to save the ship or save a life at sea.
1 Sections 151.09 through 151.25 of the Coast Guard regulations at Chapter 33 CFR do not apply to: 1) a warship, naval auxiliary, or other ship owned or operated by a country when engaged in noncommercial service; 2) a Canadian or U.S. ship being operated exclusively on the Great Lakes of North America or their connecting and tributary waters; and 3) a Canadian or U.S. ship being operated exclusively on the internal waters of the United States and Canada; or 4) any other ship specifically excluded by MARPOL.
4-4

December 29, 2008
Emergency discharges or other exceptional discharges must nevertheless be accurately recorded in ship records and reported to the nearest port state or Coast Guard Captain of the Port.
In addition, Coast Guard regulations (33 CFR 151.25) provide that vessels of 400 gross tons and above shall fully maintain an Oil Record Book Part I (Machinery Space Operations) and vessels of 150 gross tons and above that carry 200 cubic meters or more of oil in bulk shall also maintain an Oil Record Book Part II (Cargo/Ballast Operations). The Oil Record Book is subject to routine inspection by the Coast Guard. (33 CFR 151.23; 151.25(g)). In pertinent part, the APPS regulations require:
(a) Each oil tanker of 150 gross tons and above, ship of 400 gross tons and above other than an oil tanker, and manned fixed or floating drilling rig or other platform shall maintain an Oil Record Book Part I (Machinery Space Operations). An oil tanker of 150 gross tons and above or a non oil tanker that carries 200 cubic meters or more of oil in bulk, shall also maintain an Oil Record Book Part II (Cargo/Ballast Operations).
* * * (d) Entries shall be made in the Oil Record Book on each occasion, on a tank to tank basis if appropriate, whenever any of the following machinery space operations take place on any ship to which this section applies-- (1) Ballasting or cleaning of fuel oil tanks; (2) Discharge of ballast containing an oily mixture or cleaning water from fuel oil tanks; (3) Disposal of oil residue; and (4) Discharge overboard or disposal otherwise of bilge water that has accumulated in machinery spaces. * * * (g) In the event of an emergency, accidental or other exceptional discharge of oil or oily mixture, a statement shall be made in the Oil Record Book of the circumstances of, and the reasons for, the discharge. (h) Each operation described in paragraphs (d), (e) and (f) of this section shall be fully recorded without delay in the Oil Record Book so that all the entries in the book appropriate to that operation are completed. Each completed operation shall be signed by the person or persons in charge of the operations concerned and each completed page shall be signed by the master or other person having charge of the ship. (i) The Oil Record Book shall be kept in such a place as to be readily available for inspection at all reasonable times and shall be kept onboard the ship. (j) The master or other person having charge of a ship required to keep an Oil Record Book shall be responsible for the maintenance of such record.
4-5

December 29, 2008
MARPOL contains additional requirements on what information must be recorded in an Oil Record Book, including the details of overboard discharges of “bilge water which has accumulated in machinery spaces”2/ (MARPOL, Annex I, Appendix III(D)). MARPOL also requires the logging of any failure of the oil discharge monitoring and control equipment (Id. at Appendix III(F)). MARPOL also requires that any accidental or other “exceptional” discharge be recorded in the Oil Record Book (Id. at Appendix III(G)). In short, cruise ships must maintain an accurate record of overboard discharges per this requirement. 4.2.2 Oil Pollution Act and Clean Water Act The Oil Pollution Act of 1990 (OPA; 33 U.S.C. § 2701 et seq.) is a comprehensive statute designed to expand oil spill prevention, preparedness, and response capabilities of the federal government and industry. It amends section 311 of the Clean Water Act (CWA; 33 U.S.C. § 1321) to clarify federal response authority, increase penalties for spills, establish Coast Guard response organizations (including elements of the National Strike Force, district response advisory staff, Coast Guard personnel, and equipment of ports within the district), require tank vessel and facility response plans, and provide for contingency planning in designated areas. CWA section 311, as amended by OPA, applies to cruise ships and prohibits discharge of oil or hazardous substances in harmful quantities into or upon U.S. navigable waters, or into or upon the waters of the contiguous zone, or which may affect natural resources in the U.S. Exclusive Economic Zone (which extends 200 miles offshore). EPA regulations (40 CFR 110.3) provide that for the purposes of section 311(b)(4) of the CWA, discharges of oil in quantities that the Administrator has determined may be harmful to the public health or welfare or the environment of the United States include discharges of oil that: violate applicable water quality standards, or
2 The MARPOL Protocol, Annex I, Appendix III, in pertinent part requires logging of the following information:
(D) Non-automatic discharge overboard or disposal otherwise of bilge water which has accumulated in machinery spaces 13. Quantity discharged or disposed of. 14. Time of discharge or disposal (start and stop). 15. Method of discharge or disposal: .1 through 15 ppm equipment (state position at start and end); .2 to reception facilities (identify port); .3 transfer to slop tank or holding tank (indicate tank(s); state quantity transferred
and the total quantity retained in tank(s). * * *
(F) Condition of oil discharge monitoring and control system 20. Time of system failure. 21. Time when system has been made operational. 22. Reasons for failure. * * *
(G) Accidental or other exceptional discharges of oil 23. Time of occurrence. 24. Place or position of ship at time of occurrence. 25. Approximate quantity and type of oil. 25. Circumstances of discharge or escape, the reasons therefore and general remarks.
4-6

December 29, 2008
cause a film or sheen upon or discoloration of the surface of the water or adjoining shorelines, or cause a sludge or emulsion to be deposited beneath the surface of the water or upon adjoining shorelines.
4.2.3 National Marine Sanctuaries Act The National Marine Sanctuaries Act (NMSA; 16 U.S.C. § 1431 et seq.), as amended, established a national program to designate certain areas of marine environments as areas of special national significance that warrant heightened care. The primary purpose of the law is to protect marine resources and ecosystems, such as coral reefs, sunken historical vessels, or unique habitats, from degradation while facilitating public or private uses compatible with resource protection. NMSA authorizes the National Oceanic and Atmospheric Administration (NOAA) to designate as National Marine Sanctuaries areas of the marine environment that have special aesthetic, ecological, historical, or recreational qualities, and to provide comprehensive and coordinated conservation management for such areas. The National Marine Sanctuary Program manages 13 sanctuaries and the Papahānaumokuākea Marine National Monument (together referred to as “sites”). Designated sites are managed according to site-specific management plans developed by NOAA that typically prohibit by regulation the discharge or deposit of most material. Under NOAA's implementing regulations for NMSA, regulations for most sites allow for discharges incidental to the normal operation of a vessel but exclude oily wastes from bilge pumping. Since the regulations do not specify a limit, this has been interpreted as prohibiting any detectable amount of oil. 4.3 What technologies are available to manage oily bilge water from cruise ships? In order to maintain vessel stability and eliminate potentially hazardous conditions from the accumulation of bilge waste, it is necessary to periodically pump out the bilge spaces into a holding tank. The bilge water then can be managed in one of two ways: (1) retained onboard in a holding tank and discharged later to a reception facility on shore; or (2) treated onboard with an Oily Water Separator (OWS). The treated bilge water then can be discharged overboard in accordance with applicable standards and regulations while the petroleum products extracted by the OWS (i.e., oily waste) are retained in a dedicated holding tank onboard (and later could be incinerated and/or off-loaded in port). The international standard established by MARPOL Annex I, and implemented into United States law by APPS, is that machinery space waste including bilge water may be discharged overboard if it contains a concentration of 15 ppm oil or less, and, for ships beyond the 12 nm limit, provided that the ship is underway. MARPOL and APPS also require that the discharge be made through 15 ppm equipment, namely an OWS and Oil Content Monitor; this equipment must be fitted with the appropriate alarms and stopping devices for ships to discharge in special areas. The holding tank may contain other oily water mixtures including decanted water from the fuel and lubricating oil sludge tanks. In addition to removing the waste from the bilge area, a holding tank can allow for some separation of the oil and water. Bilge water may be discharged
4-7

December 29, 2008
overboard after processing by an Oily Water Separator and passing through a bilge alarm, more commonly known as an Oil Content Monitor that is designed to detect when the effluent exceeds an oil content of greater than 15 ppm. The required pollution prevention equipment also includes an automatic stopping device (typically a three-way solenoid valve) that when triggered by the Oil Content Monitor, will automatically divert the oily water mixture back into a holding tank. APPS and MARPOL define machinery space waste as an oily water mixture. The amount of machinery space waste, as mentioned above, may be reduced through the use of water-lubricated shaft bearing systems. While traditional propeller shaft bearing systems use oil as a lubricating and cooling medium, water-lubricated propeller shaft bearing systems use seawater instead of oil. This substitution can have benefits should a ship experience a shaft bearing leak, for instead of potentially leaking oil, seawater would be leaked. Depending on where the failure in the propeller shaft bearing system occurs, the use of water-lubricated systems can potentially reduce the potential for oily waste mixtures to leak into the bilge. Water-lubricated shaft bearing systems are currently installed on a number of Carnival’s larger ships (Carnival Corporation and PLC, 2006). Under MARPOL, all ships over 400 gross tons are required to have equipment installed onboard that limits the discharge of oil into the oceans to 15 ppm when a ship is en route. Such ship equipment allows for compliance with both international regulations (MARPOL) and Coast Guard regulations that require the oil content of the discharged effluent to be less than 15 ppm and that it not leave a visible sheen on the surface of the water. Regulations also require that all oil or oil residues that cannot be discharged in compliance with these regulations, be retained onboard or discharged to a reception facility. Conventional bilge water systems use an OWS to remove oil to meet regulatory standards prior to discharge. These systems use the techniques of centrifugal force, coalescence, gravity, and other methods to isolate oil from water (Table 4-2 describes some OWS technologies). The management of bilge water by most vessels consists of the following steps:
1) Bilge water is pumped into a holding tank, which is usually of sufficient size to hold the water for several days.
2) Bilge water is processed by an OWS to extract oil and petroleum products from the bilge water. Different cruise ships may use different types of OWS (e.g., centrifugal, filtration, and gravity based systems).
3) The treated bilge water from the OWS is discharged overboard provided that the OWS is certified by the Coast Guard, using International Standards Organization 9377-2:2000; the discharge does not have an oil content of greater than 15 ppm; and the discharge does not leave a visible sheen on the surface of the water.
4) All oil or oil residues that cannot be discharged in compliance with the abovementioned requirements – generally the oily waste collected by the OWS – is retained in a holding tank until it can be incinerated onboard or off-loaded to a land-based treatment facility (CELB, 2003).
4-8

December 29, 2008
Table 4-2. Oily Water Separator Technologies
Description/Capabilities of OWS Devices Processing Capacity
– Removes oil and grease using naturally-occurring microbes – Continuous monitoring of hydrocarbons in effluent – Typically reduces oil content to 1-5 ppm
Up to 5400 gallons/day)
– Designed to separate and remove free and emulsified oil – System can treat bilge and sludge – Oil content meter (bilge alarm calibrated to measure 15 ppm oil content)
12 - 24 m3/day (or 53 - 106 gallons/day)
– Utilizes fluid velocity reduction, differential specific gravity, and coalescences to separate nonsoluble oil, solids, and entrained air from oily water; uses ultra-filtration membranes
– Provides efficient removal or reduction of oil content to less than 5 ppm
Up to 44 gallons/minute
– High-speed centrifugal separation system for treatment of large bilge water volumes at sea
– Generally reduces oil content to below 5 ppm – Continuous operation (24 hours/day)
Approximately 400 - 1320 gallons/hour
Sources: EnSolve, 2008(a and b); Senitec, 2006 and 2008; Coffin World Water Systems, 2008; Alfa Laval, 2008 All vessels are required to have a bilge alarm or bilge monitor integrated into the piping system to detect whether the treated bilge water that is being discharged from the oily water separator has turbidity levels calibrated to be equivalent to samples containing an oil content greater than 15 ppm. If the monitor senses that the oil in the bilge water exceeds 15 ppm, the system is required to stop the overboard discharge and divert the effluent back to a holding tank. Any bilge water found to contain oil or oil residues with an oil content greater than threshold levels must be retained onboard or discharged to a designated reception facility. According to the Center for Environmental Leadership in Business (CELB) (2003), several cruise lines now often use two oily water separators to assure that effluent levels meet or exceed the 15 ppm limit. Also, California’s multi-agency Cruise Ship Environmental Task Force Report to the Legislature (2003) identified some of the more modern oil water separator systems that include a series of filters to further scrub oil from the bilge water prior to discharging. As mentioned earlier, all discharges from the OWS system are required to be logged in the cruise ship’s oil record log book. California’s Cruise Ship Environmental Task Force Report (2003) identified the following potential problems associated with OWS systems: Data recorders can be manipulated or shut off and not record all discharges; Oil-water interface detectors (oil content monitor) can easily get out of calibration and
allow more oil to be discharged than legally allowed; Piping systems can be re-routed to bypass the oil-water detectors; Substances such as cleaning solvents are not removed from bilge water and are routinely
discharged with the liquids into the ocean; and Bilge water tanks are used to dispose of other hazardous materials, both liquids and
solids, illegally because the bilge alarm/bilge monitor will not detect these other substances.
4-9

December 29, 2008
In an attempt to improve the integrity of Oily Water Separators, as of 2007 a number of cruise lines have purchased a bilge water processing system “White Box” (Marinfloc AB, 2007a). The “White Box” is a proprietary system considered to be a tamper resistant fail-safe for overboard discharges of processed bilge water, serving as the final monitoring and control device through which processed bilge water passes prior to discharging overboard. The “White Box” System basically includes the pressure control valve, oil content meter, flow control box, 3-way valve, flow meter, flow switch, 3-way rinse valve, and a recorder (Marinfloc AB, 2005). All the equipment is built into a lockable cabinet. The system monitors the oil content in the water from the oily water separator or bilge water cleaning system. When the water from either of these systems is clean enough for discharge, a valve is opened and the water is pumped overboard. Before the water is discharged, it passes through a flow meter with a pulse transmitter connected to the recorder which records and stores the following information (Marinfloc AB, 2006a):
time when the overboard pumping starts; oil content meter level over a discharge cycle; total quantity of water pumped overboard in a discharge cycle; and time when the overboard pumping stops.
Further, the “White Box” can be supplied with a more sophisticated recorder that enables the ship’s position and course to be recorded as well (Marinfloc AB, 2006a). According to the Carnival cruise line’s Environmental Management Report (Carnival Corporation and PLC, 2006), all Carnival ships route all bilge water destined for overboard discharge, including that stored in clean bilge water holding tanks, through a bilge water processing system “White Box.” The “White Box” is one of many commercially available control technologies designed to make bypassing more difficult. Other ideas are relatively simple, such as placing a unique number tag on every overboard flange in order to prevent unauthorized discharges or locking the overboard valve. Any technological solution to deter deliberate pollution, however, remains subject to compromise by an engineer determined to circumvent treatment. Other means to treat oily wastes in bilge water that are being explored include electro-chemical flocculation, biological digestion, membrane polishing, oil absorption, and incineration (Bryant, 2001). A number of cruise lines have purchased equipment that breaks emulsions in oily bilge water (Marinfloc AB, 2007b). Cleaning agents, emulsifiers, solvent, or surfactants used for cleaning purposes may cause bilge water to emulsify. As stated in MEPC 107(49), “with the possibility of emulsified bilge water always present, the 15 ppm Bilge Separator must be capable of separating the oil from the emulsion to produce an effluent with an oil content not exceeding 15 ppm.” The use of an emulsion breaking bilge water cleaning system can help achieve this. After free oil is separated from preheated oily bilge water, the remaining emulsified bilge water is directed to a circulation tank where a flocculent and small amount of service air is fed into the water at which point a circulation pump causes mixing. Flocks are then skimmed off, and the remaining water goes through a number of filtering stops. The effluent water from the emulsion breaking bilge water cleaning system then passes through the OWS monitor. Bilge water less than 15 ppm can be discharged accordingly; bilge water exceeding 15 ppm is returned to the bilge water holding tank or settling/primary tank. (Marinfloc AB, 2006b).
4-10
December 29, 2008
Under the Cruise Lines International Association (CLIA) member agreement identified earlier, bilge and oily water residue should be processed prior to discharge to remove oil residues, such that oil content of the effluent is less than 15 ppm as specified by MARPOL Annex I. In accordance with MARPOL Regulation 20 and U.S. regulations (33 CFR 151.25) as appropriate, CLIA member lines report that they have agreed that every cruise ship of 400 gross tons and above shall be provided with an oil record book which shall be completed on each occasion whenever any of numerous specified operations take place on the ship. Those operations include the following (CLIA, 2006):
a. ballasting or cleaning of fuel oil tanks; b. discharge of dirty ballast or cleaning water form the fuel oil tanks above; c. disposal of oily residues; and d. discharges of bilge water that accumulated in machinery spaces.
4.4 What are the potential environmental impacts associated with inadequately treated
bilge water from cruise ships? In an examination of oil pollution in the marine environment, the Urban Harbors Institute (2000) indicates that about 70% of such oil pollution is due to chronic pollution from municipal and industrial wastes or runoff, dumping of waste oil, release of oily bilge water, and from other-than-tanker transportation. Bilge water is the most common source of oil pollution from cruise ships (National Association of Attorneys General, 2002). Cruise ships have the potential to create oil pollution through discharges of inadequately treated oily bilge water as a result of a faulty or malfunctioning OWS, human error, malfunctioning bilge monitors, or a deliberate OWS bypass. The impacts from oil pollution can vary depending upon numerous factors. The Port of Cordova, Alaska, has produced educational materials for harbor and non-harbor users explaining that “one pint of spilled oil can cause a sheen over an acre of water and kill the marine organisms that live on the surface” (Urban Harbors Institute, 2000). The National Research Council (2003) states that the effect of a release of petroleum is not directly related to the volume, rather the effect is a “complex function of the rate of release, the nature of the released petroleum (and the proportions of toxic compounds it may contain), and the local physical and biological ecosystem exposed.” Other factors include the season, weather conditions, and the surrounding environment. Consequently, even a small spill at the wrong place, at the wrong time can result in significant damage to individual organisms or entire populations. Oily bilge water may contain emulsified oil and grease, diesel, hydraulic oil, lube oil, and a full range of marine fuel oils. Oil is composed of thousands of compounds in varying quantities; some oils are more harmful to the environment and more toxic than others. The toxicity of many of the individual compounds contained in petroleum can be significant, and even small releases can kill or damage organisms from the cellular- to the population-level (National Research Council, 2003). Recent studies suggest that polycyclic aromatic hydrocarbons (PAHs), even in low concentrations, can have a deleterious effect on marine biota. PAHs are known human carcinogens and occur in varying proportions in crude oil and refined products (National Research Council, 2003). Environment Canada (2006) further indicates that the different
4-11

December 29, 2008
physical and chemical properties of crude and refined oils influence the physical and biological effects of an oil spill, the behavior of a slick, and the effectiveness of clean-up operations. Lighter petroleum products, such as gasoline or diesel fuels, can dissipate and evaporate quickly but are highly toxic and create severe environmental impacts. In contrast, the medium and heavier oils do not evaporate, and therefore may require intensive structural and shoreline cleanup. Although heavier oils are less toxic than light oils, the heavy oils can harm waterfowl and fur-bearing mammals through coating and ingestion. Also, heavy oils can sink and create prolonged contamination of the sea bed and create tar balls that can scatter along beaches. (U.S. Government Accountability Office, 2007). Table 4-3 provides a description of oil types and the interactions that occur when such oil types are released into the marine environment. This table does not take into account the fact that bilge waste is a mixture of different oils and frequently contains an emulsion due to the use of surfactants and degreasers such as soap. Surfactants and degreasers, which are often incompatible with the proper use of pollution prevention equipment, may also have an impact on the introduction of oil into the marine environment.
Table 4-3. Description of Oil Types and the Interaction When Released into the Marine Environment
Oil Type Removal and Response Environmental Impact
Very light oils (jet fuels, gasoline)
Highly volatile (they will evaporate within 1-2 days). It is rarely possible to clean up the oil from such spills.
Highly Toxic: Can cause severe impacts to shoreline resources.
Light oils (diesel, no. 2 fuel oil, light crudes)
Moderately volatile, but will leave a residue after a few days. Clean-up can be very effective for these spills.
Moderately Toxic: Has the potential to create long-term contamination of shoreline resources.
Medium oils (most crude oils)
Some oil (about one-third) will evaporate in 24 hours. Clean-up is most effective if conducted quickly.
Less Toxic: Oil contamination of shoreline can be severe and long-term, and can have significant impacts to waterfowl and fur-bearing mammals.
Heavy oils (heavy crude oils, No. 6 fuel oil, bunker C fuel)
Little or no oil will evaporate. Clean-up is difficult.
Less Toxic: Heavy contamination of shoreline resources is likely, with severe impacts to waterfowl and fur-bearing mammals through coating and ingestion.
Source: U.S. Government Accountability Office, 2007 When considering the types of fuels and oils that cruise ships use, the California Cruise Ship Environmental Task Force Report (2003) indicates that cruise ships generally run their main engines on intermediate fuel (IFO 180 or IFO 380). This fuel is also referred to as “bunker fuel” and requires heating to reduce its viscosity in order to be properly atomized and combusted. The California Cruise Ship Environmental Task Force Report also notes that marine gas oil or a blend of marine gas oil and bunker fuel may be used by some ships during maneuvering.
4-12

December 29, 2008
According to the National Research Council (2003), the discharges from bilge water are considered to be moderate in terms of their loss by evaporation and dissolution, formation of tar balls, and potential for long-distance transport. In addition, vessel discharges pose a low risk of vertical mixing because the releases are generally viscous (National Research Council, 2003). Oil released into the marine environment immediately begins to move and weather, breaking down and changing its physical and chemical properties. Some of these processes occur immediately after the spill, while others occur over time. Some of the processes include dissolution, sedimentation, movement, bio-degradation, evaporation, weathering, and dispersion. As these processes occur, the oil threatens surface resources and a wide range of subsurface marine organisms, which are linked in complex food chains. Some organisms may be seriously injured or killed very soon after contact with the oil in a spill, however, non-lethal toxic effects are more subtle and often longer lasting (U.S. Environmental Protection Agency, 2006). Oil can kill marine organisms, reduce their fitness through sublethal effects, and disrupt the structure and function of marine communities and ecosystems. The chemical contaminants in oil can poison marine life, disrupt feeding, or cause chronic disease, reproductive failure and deformities – ultimately impacting the survival rates of the affected species. Contaminants concentrate in the sea surface microlayer which is an important area for the early development of many fish and other marine species with planktonic life stages. Effects of contaminants on eggs and larvae found at the sea surface in sites along U.S. coasts include mortality, malformation, and chromosome abnormalities. (Urban Harbor Institute, 2000). Exposure of marine organisms to petroleum hydrocarbons can result in mortality due to acute toxicity or physical smothering. Additionally, possible long-term impacts include: impaired survival or reproduction; chronic toxicity of persistent components; and habitat degradation (Peterson and Holland-Bartels, 2002). Oil, even in minute concentrations, can kill fish or have various sub-lethal chronic effects (CRS, 2007), as well as severely damage coral reefs. According to the Bluewater Network (2000), ingestion of oil can kill birds or lead to starvation, disease, and predation of these animals. A Canadian study has estimated that 300,000 seabirds are killed annually in Atlantic Canada as a result of illegal discharges of oil from ships (Wiese, 2002). In that report, Wiese (2002) indicates that the analysis of oil collected from bird plumage in Atlantic Canada and the North Sea over the last 10 years showed that over 90% of the oil collected was composed of heavy fuel oil mixed with lubricant oil – the type found in bilges of large ocean-going vessels. In addition to the strong evidence for the impact of massive contamination associated with an oil spill, there is increasing evidence that chronic, low-level exposures to hydrocarbons in the sea can have a significant effect on the survival and reproductive performance of seabirds and some marine mammals (National Research Council, 2003). According to CELB (2003), any oils that remain on the surface can interfere with larvae development and marine birds; heavier oils can sink to the bottom of the ocean and contaminate the sediment, causing potential long-term impacts to benthic habitats. According to CELB (2003), diesel fuel is acutely toxic to fish, invertebrates, and seaweed, although in open water this fuel dilutes quite rapidly. CELB (2003) further states that spills can be particularly toxic to
4-13

December 29, 2008
crabs and shellfish in shallow, confined near-shore areas because in these organisms oil bio-accumulates – often over a period of several weeks after exposure. As stated by the Urban Harbors Institute (2000), “while overall concentrations of oil toxins from chronic sources might be lower compared to concentrations following a catastrophic spill in the marine environment, chronic pollution can be equally toxic to marine life if sustained over extended periods of time.” The Urban Harbors Institute further suggests that “while contingency planning for large oil spills is important and mandated by the Oil Pollution Act, planning for the small and recurrent contributions to water quality problems from chronic sources is equally important.” Chronic source contributions from cruise ships (i.e., cruise ships discharge oily bilge water treated to 15 ppm) should be considered in the context of cumulative impacts of repeated discharges because cruise ships frequently transit an established route and port destinations. In fact, the National Research Council (2003) identified that research on the cumulative effects of multiple types of hydrocarbons in combination with other types of pollutants is needed to assess the toxicity and organism response under conditions experienced by organisms in polluted coastal zones. 4.5 What action is the federal government taking to address oily bilge water from
cruise ships? The federal government’s bilge water management efforts have focused on responding to oil spills and developing preventative programs. The Coast Guard is the primary federal agency responsible for monitoring and enforcing requirements for cruise ship discharges. In addition to monitoring and enforcing standards, the Coast Guard has been working with the IMO to develop new international performance standards for oil pollution prevention equipment. The National Park Service (NPS) manages cruise ship waste streams indirectly in Glacier Bay National Park through competitively awarded concession contracts. The NPS has jurisdiction over the submerged lands and marine waters of Glacier Bay National Park up to 3 miles from the mean high tide line and including all of Glacier Bay proper. Glacier Bay is a well known, very popular attraction for the cruise ship industry in Alaska. Recent environmental reviews and decisions allow up to two cruise ship entries per day into Glacier Bay proper during the primary visitor season. Cruise ship operations in the park are authorized under concession contracts, which are awarded under a competitive solicitation and prospectus process. Impact on park resources is a general standard selection criterion for park concessions. The NPS uses waste stream management as one of a number of selection criteria in this regard. In the past, cruise ship operators have usually proposed to minimize the impact of waste streams by committing to a no-discharge policy while in the park (even if legal under applicable law) for sewage, graywater, ballast water, bilge water, cooling water, hazardous waste, and solid waste. If awarded a contract, companies must comply with their proposal. Typically cruise ships operate in the park for 8-10 hours and then depart. Cruise ships do not dock or transfer any wastes to shore while in the park. EPA has developed a water permit program for pollutant discharges incidental to the normal operation of vessels. Under a U.S. District Court decision, the existing EPA regulations that
4-14

December 29, 2008
exclude discharges incidental to the normal operation of a vessel from Clean Water Act permitting were vacated (revoked) as of December 19, 2008. The District Court’s decision to vacate that exclusion was recently upheld by the Ninth Circuit Court of Appeals. NW. Envt’l Advocates et al. v. EPA, 537 F.3d 1006 (9th Cir. 2008). As explained in section 1.1, as of December 19, 2008, discharges incidental to the normal operation of vessels (such as bilge water) into waters of the U.S. from cruise ships 79 feet or longer in length will be subject to National Pollution Discharge Elimination System permitting. In a report produced by the U.S. General Accounting Office (now the Government Accountability Office) in 2000, 87 confirmed illegal discharges from foreign-flagged cruise ships in U.S. waters were identified during the period from 1991-1998. Of the 87 cases, 81 incidents involved illegal discharges of oil or oil-based products. The report indicated that about three-fourths of these cases were accidental, resulting from human or mechanical error, while the remainder were either intentional or the lack of information pertaining to the case made it difficult to determine the cause. The report also stated that a few of the 87 cases of illegal discharges involved multiple illegal discharge incidents that numbered in the hundreds over the 6-year period. (U.S. General Accounting Office, 2000.) In an effort to curb the number of illegal oil discharges, the federal government is taking criminal enforcement actions to address violations of bilge water quality and treatment requirements. More specifically, the Coast Guard has a robust enforcement regime involving all vessels regarding violations of MARPOL Annex I. The Coast Guard conducts inspections of all cruise vessels operating in United States ports and waters quarterly and annually. These inspections typically include examination and testing of pollution prevention equipment and review of Oil Record Books. The Coast Guard works closely with the U.S. Department of Justice. Through this cooperation, criminal enforcement actions have been taken for intentional discharges of oily bilge waste. The most common violations of bilge water quality and treatment requirements include the intentional falsification of Oil Record Books to conceal the deliberate bypassing of the OWS entirely or tampering with the monitoring equipment. Tampering has included disabling or modifying the Oil Content Monitor or flushing the device with freshwater to prevent sampling of the actual effluent. Inspections of vessels have found the following problems:
Data records that are manipulated or data recorders that are disabled; Poorly maintained OWS equipment and related piping systems; Crew error or lack of crew training; Bilge alarms/monitors that are out of calibration due to poor maintenance (thereby
allowing bilge water discharges that exceed 15 ppm of oil); Piping systems that are re-routed to bypass the bilge alarms/monitors; and, Improper use of cleaning chemicals and surfactants which degrade OWS efficiency and
conceal oil discharge sheens. Deliberate discharges of untreated bilge water might be accompanied by efforts to deceive port state control officials by falsifying the Oil Record Book. Several port states (i.e., the country the cruise ship visits) have reacted by increasing their scrutiny of OWS systems and diligence for oil record book keeping (OECD, 2003). The U.S. is taking a lead in enforcement actions for such criminal violations. To date the U.S. has prosecuted over 75 cases involving intentional discharges of oily bilge waste from vessels in general, with over $150 million collected in
4-15

December 29, 2008
criminal fines since 2000. Many of the major cruise ship companies calling on U.S. ports have been convicted of such violations, including, Royal Caribbean, Holland America, Carnival and Norwegian Cruise Line Limited. As a result of the prosecutions, all the companies have been at one time placed on probation with a requirement to implement Environmental Compliance Plans. 4.6 Possible Options and Alternatives to Address Oily Bilge Water from Cruise Ships Based on the public comments received on the draft of this report as well as other information gathered, listed below are a wide range of options and alternatives that address oily bilge water from cruise ships. Identification of any particular option does not imply any EPA recommendation or preference for future action, or that EPA has determined that any of these options are necessary or feasible, or that EPA believes a change to the status quo is warranted, or that EPA or any other entity has the legal authority to implement that option. Prevention & Reduction
Establish standards or best management practices for operation, maintenance, and/or training that will decrease the contaminants in bilge water and/or the volume of treated and/or untreated oily bilge water on cruise ships.
Conduct research to determine the presence of hazardous wastes (other than oil) entering the bilge that will be eventually discharged, given that present treatment processes target oil.
Encourage cruise lines to switch to water-based lubricants wherever possible to reduce total production of petroleum-based oily wastes onboard the ship.
Conduct research on the environmental benefits of alternative lubricants, such as bio-oils, taking into account additional environmental risks and damages caused by failures of machinery and systems that use bio-oils.
Encourage recycling of lubricants and other waste oils from oil storage systems. Control: Discharge Standards
States could enact laws prohibiting the discharge of any petroleum product into marine or fresh waters.
Require the highest attainable reduction of oil concentration in bilge water through application of the best available technology economically achievable.
Treat effluents from oily bilge water to an oil content <15 ppm en route and provided that the ship is operating outside special areas.
Review current Coast Guard vessel inspection and enforcement programs and practices, including those applicable to oily wastewater treatment and discharge, to determine if modifications are necessary.
Evaluate the need for increased oily water separator performance standards. Prohibit the addition of any hazardous waste into the bilge area to then be
managed/treated as oily bilge water. Require more stringent standards in areas frequented by multiple cruise ships in order to
adequately address cumulative impacts.
4-16

December 29, 2008
Control: Geographic Restrictions on Discharge Ban discharges of untreated or treated oily bilge water in all U.S. waters. Require discharge to proper shore-side facilities.
Enforcement & Compliance Assurance: Monitoring
Conduct an assessment of the concentrations of metals and organic contaminants in treated bilge water to determine the presence of other pollutants in the discharge.
Require sampling and testing of oily bilge water discharges to ensure that it meets applicable standards by:
o government agencies with enforcement authority, o third-parties, and o cruise lines.
Require onboard observers to monitor sampling, monitoring, and other effluent-related requirements to oversee discharging practices, equipment operation and maintenance, and the completion and submittal of accurate Oil Record Books.
Enforcement & Compliance Assurance: Reporting
Require the installation of electronic transponders to signal land-based authorities when a waste discharge line is opened or closed.
Require cruise ship operators to immediately notify appropriate agencies in the event of an OWS malfunction.
Require that cruise ship operators provide advance notification from ships planning to discharge in U.S. waters.
Require that the cruise ship operators notify all appropriate agencies of all discharges of oily bilge water.
Publicize the APPS whistleblower provisions under 33 U.S.C. 1908(a) to passengers and crew members in order to encourage both to aid in the detection of illegal pollution by alerting authorities when witnessing activities they believe to be illegal.
Enforcement & Compliance Assurance: Inspections & Enforcement
Revise current inspection practices to more aggressively identify noncompliant OWS equipment and include more detailed inspection of a vessel’s piping system to identify rerouting of discharges to circumvent bilge monitors and alarms.
Provide states enforcement authority to take actions when discharges occur where otherwise prohibited; require substantial penalties for violations of those laws and require the full recovery of all costs arising from enforcement of such laws.
Establish penalties for failure to meet applicable standards and regulations pertaining to oil content in bilge water discharges.
Establish a funding mechanism based on the polluter-pays model that will provide revenues to develop and implement a comprehensive regulatory scheme.
Impose uniform requirements on all ships as a condition of port entry and within waters under the jurisdiction of the U.S. consistent with international law, regardless of flag state.
4-17

December 29, 2008
Prohibit or otherwise restrict noncompliant vessels (and sister ships, depending on the degree of involvement by parent companies) from operating in sensitive areas of the marine environment under U.S. jurisdiction.
4-18

December 29, 2008
References Alaska Department of Environmental Conservation (ADEC). 2000. Alaska Cruise Ship Initiative
Part 1 Final Report. Juneau, AK. (www.dec.state.ak.us/water/cruise_ships/pdfs/finreportp10808.pdf)
Alfa Laval. accessed December 28, 2008. EcoStream: Oily Water Cleaning System.
(http://www.alfalaval.com/solution-finder/products/eco-stream/Documents/Ecostream.pdf) Bluewater Network. (2000, March 17). Petition to Environmental Protection Agency
Administrator Carol M. Browner. (www.epa.gov/owow/oceans/cruise_ships/petition.pdf) Bryant, Dennis L. 2001. Environmental Compliance in the Cruise Industry. Holland and Knight
Articles and White Papers. (http://www.gsy.fi/id24660/PublicationId3/ReturnId33/ServiceId131/contentid45721/)
Carnival Corporation and PLC. 2006. Environmental Management Report: Fiscal Year 2006.
(http://phx.corporate-ir.net/phoenix.zhtml?c=140690&p=irol-hess) Center for Environmental Leadership in Business (CELB). 2003. A Shifting Tide: Environmental
Challenges and Cruise Industry Responses. Washington, DC. (www.celb.org/ImageCache/CELB/content/travel_2dleisure/cruise_5finterim_5fsummary_2epdf/v1/cruise_5finterim_5fsummary.pdf)
Coffin World Water Systems. accessed December 28, 2008. Ultra-Sep Oily Water Separators.
(http://www.cworldwater.com/) Congressional Research Service (CRS). 2007. Cruise Ship Pollution: Background, Laws and
Regulations, and Key Issues (Order Code RL32450). Washington, DC. (www.ncseonline.org/NLE/CRSreports/07Jul/RL32450.pdf)
Cruise Lines International Association (CLIA). 2006. CLIA Industry Standard: Cruise Industry
Waste Management Practices and Procedures. Fort Lauderdale, FL. (www.cruising.org/industry/PDF/CLIAWasteManagementAttachment.pdf and www.cruising.org/industry/PDF/CLIAWasteManagement.pdf)
Cruise Ship Environmental Task Force. 2003. Report to the Legislature: Regulation of Large
Passenger Vessels in California. (http://www.swrcb.ca.gov/publications_forms/publications/legislative/docs/2003/cruiseshiplegrpt.pdf)
EnSolve. accessed December 28, 2008a. Petroliminator PL 630M OWS: Product Fact Sheet.
(http://www.ensolve.com/userfiles/file/Products/PL%20630M%20pds%20rev%201108.pdf) EnSolve. October, 2008b. EnSolve Biosystems Inc. News – Volume 1, Issue 1.
(http://www.ensolve.com/userfiles/file/News/EnSolve%20Newsletter%2010-08.pdf)
4-19

December 29, 2008
Environment Canada. 2006. Oil, Water, and Chocolate Mousse. The Green Lane, Environment
Canada’s World Wide Website. (http://www.ec.gc.ca/ee-ue/default.asp?lang=EN&n=88F67B04)
Marinfloc AB. 2005. Type Approval Certificate as per Bureau Veritas Classification Rules.
(http://www.marinfloc.com/?menu=Products&lowerMenu=Marinfloc%20WBS) Marinfloc AB. May, 2006a. White Box: Fail Safe System for Discharge of Treated Bilge Water.
Data Sheet # 50001. (http://www.marinfloc.com/upload/files/wbs/50001%20White%20Box%20%20Description.pdf)
Marinfloc AB. May, 2006b. USCG MED IMO MEPC 107(49) Approved Emulsion Breaking
Bilge Water Cleaning System EBBWCS Mk III – Model “CD.” Data Sheet # 8. (http://www.marinfloc.com/upload/files/ebbwcs/08%20CD%20Complete%2015%2001%202008.pdf)
Marinfloc AB. 2007a. List of References: White Box System – Type WBS. Data Sheet # 50004,
2007-10-24. (http://www.marinfloc.com) Marinfloc AB. 2007b. List of References: Emulsion Breaking Bilge Water Cleaning System –
Type CD. Data Sheet # 21, 2007-10-24. (http://www.marinfloc.com) National Association of Attorneys General. Spring 2002. Floating Cities, Urban Problems: A
Report by the National Association of the Attorneys General Cruise Ship Workgroup. Washington, DC.
National Research Council (NRC): Committee on Oil in the Sea: Inputs, Fates, and Effects.
2003. Oil in the Sea III: Inputs, Fates, and Effects. Washington, DC: National Academy Press. (http://www.nap.edu/catalog.php?record_id=10388#toc)
Organization for Economic Co-operation and Development (OECD). 2003. Cost Savings
Stemming from Non-Compliance with International Environmental Regulations in the Maritime Sector. Paris, France. (www.oecd.org/dataoecd/4/26/2496757.pdf)
Peterson, Charles H.; Holland-Bartels, Leslie. 2002. Nearshore vertebrate predators: constraints
to recovery from oil pollution. Marine Ecology Progress Series 241:235-236. Senitec. accessed December 28, 2008. Sludge and Bilge Water System for the Future – Senitec
SEA. Senitec MB 1000. (http://www.senitecsludge-oilywatertreatment.com/pdf/sea1.0.pdf) Senitec 2006. EC Type Examination Certificate: Oil-Filtering Equipment (for oil content of the
effluent not exceeding 15 p.p.m.). Senitec SEA 1.0. (http://www.senitecsludge-oilywatertreatment.com/pdf/cert_senitecSEA1.0.pdf)
4-20

December 29, 2008
4-21
Urban Harbors Institute (University of Massachusetts Boston). 2000. Green Ports: Environmental Management and Technology at US Ports. Boston, MA.
U.S. General Accounting Office (now the Government Accountability Office). 2000. Marine
Pollution: Progress Made to Reduce Marine Pollution by Cruise Ships, but Important Issues Remain. Report to Congressional Requesters. GAO/RCED-00-48.
U.S. Government Accountability Office. 2007. Marine Transportation: Major Oil Spills Occur
Infrequently, but Risks Remain. Testimony before the Subcommittee on Oceans, Atmosphere, Fisheries, and Coast Guard; Committee on Commerce, Science and Transportation, U.S. Senate. GAO-08-357T.
U.S. Environmental Protection Agency. 1997. Profile of the Water Transportation Industry.
(EPA/310-R-97-003). Washington, D.C.: Author. (http://www.epa.gov/compliance/resources/publications/assistance/sectors/notebooks/watersct.pdf)
U.S. Environmental Protection Agency. 2006. Effects of Oil Spills.
(http://epa.gov/oilspill/edueff.htm) Wiese, F.K. 2002. Seabirds and Atlantic Canada’s Ship-Source Oil Pollution: Impacts, Trends,
and Solutions. Prepared for World Wildlife Fund Canada. Toronto, Canada. (http://www.wwf.ca/Documents/Marine/SeabirdsReport.pdf)

December 29, 2008
Section 5: Solid Waste Solid waste, as defined in section 1004(27) of the Resource Conservation and Recovery Act (RCRA), is the garbage, refuse, sludge, rubbish, trash, and other discarded materials resulting from industrial, commercial, and other operations, as well as that disposed of every day by individuals, businesses, and communities. Solid waste can be either non-hazardous or hazardous waste. On most cruise ships, solid waste is managed by utilizing a multifaceted strategy that includes source reduction, source segregation for waste streams, waste minimization, and recycling. According to the Alaska Department of Environmental Conservation (ADEC) (2001), 75 to 85% of trash is generally incinerated onboard, and the ash is typically discharged at sea; some solid waste is landed ashore for disposal or recycling (CRS, 2007). This section discusses the current state of information about solid waste, the laws regulating solid waste from vessels, how solid waste is managed on cruise ships, the potential environmental impacts of cruise ship solid waste, and federal actions taken to address solid waste from cruise ships. The conclusion of this section lists a wide range of options and alternatives that could be considered when addressing solid waste from cruise ships. 5.1 What is solid waste and how much is generated on cruise ships?
Solid waste is the garbage, refuse, sludge, rubbish, trash, and other discarded materials resulting from industrial, commercial, and other operations, as well as that disposed of every day by individuals, businesses, and communities. Solid waste can be either non-hazardous or hazardous waste. Non-hazardous waste, for example, may be in the form of trash and the waste associated with product packaging, cans, bottles, food waste, newspapers, product and machinery parts, disposable products, and recyclable products. This section discusses non-hazardous solid waste generated on cruise ships. Hazardous waste, however, is a type of solid waste, which, because of its quantity, concentration or physical or chemical characteristics, may pose a substantial present or potential hazard to human health or the environment when improperly treated, stored, transported, disposed or otherwise managed. Hazardous waste generally contains hazardous substances which can be liquids, solids, or contained gases and must be handled, tracked, treated, and disposed of separately from other types of solid waste. Hazardous waste generated on cruise ships is discussed separately in Section 6. Solid waste generated onboard a cruise ship typically comprises the materials used for packaging products for transportation or storage, waste generated by passenger and crew activity, and food waste. More specifically, the types of solid waste generated on a ship can include food waste, glass, paper, wood, cardboard, incinerator ash, metal cans, and plastics. Table 5-1 identifies some types of common solid waste items, including specific examples, generated aboard cruise ships.
5-1
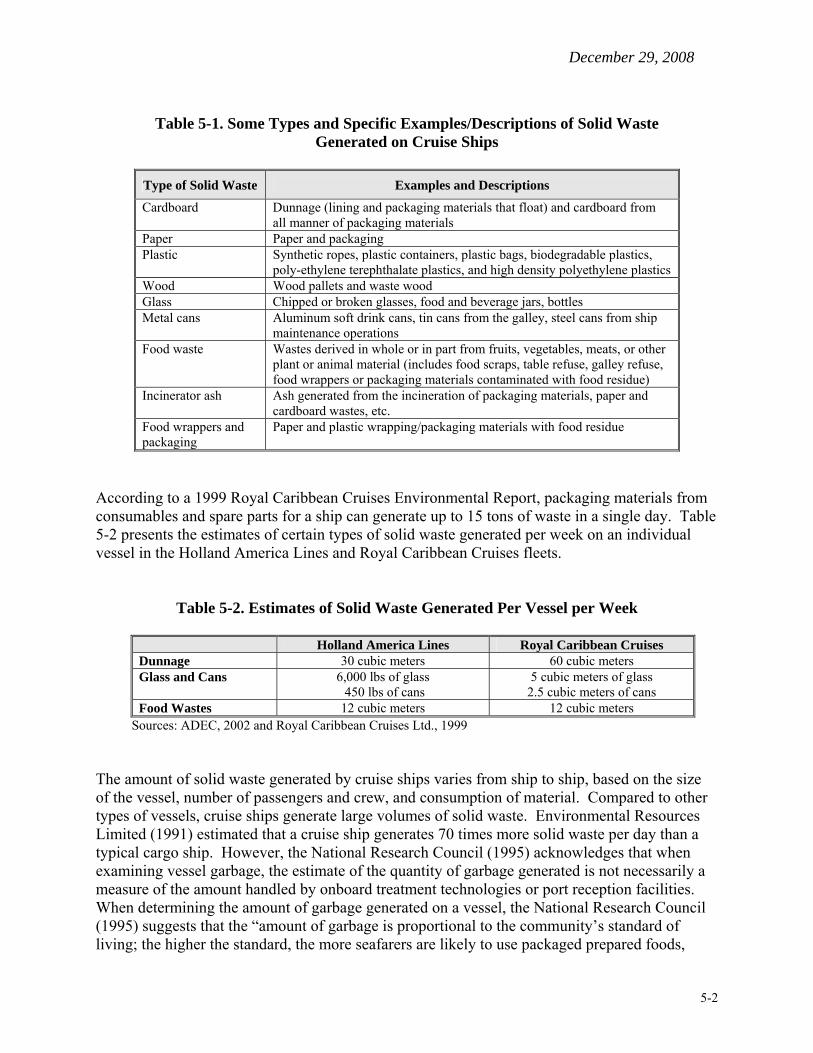
December 29, 2008
Table 5-1. Some Types and Specific Examples/Descriptions of Solid Waste
Generated on Cruise Ships
Type of Solid Waste Examples and Descriptions
Cardboard Dunnage (lining and packaging materials that float) and cardboard from all manner of packaging materials
Paper Paper and packaging Plastic Synthetic ropes, plastic containers, plastic bags, biodegradable plastics,
poly-ethylene terephthalate plastics, and high density polyethylene plastics Wood Wood pallets and waste wood Glass Chipped or broken glasses, food and beverage jars, bottles Metal cans Aluminum soft drink cans, tin cans from the galley, steel cans from ship
maintenance operations Food waste Wastes derived in whole or in part from fruits, vegetables, meats, or other
plant or animal material (includes food scraps, table refuse, galley refuse, food wrappers or packaging materials contaminated with food residue)
Incinerator ash Ash generated from the incineration of packaging materials, paper and cardboard wastes, etc.
Food wrappers and packaging
Paper and plastic wrapping/packaging materials with food residue
According to a 1999 Royal Caribbean Cruises Environmental Report, packaging materials from consumables and spare parts for a ship can generate up to 15 tons of waste in a single day. Table 5-2 presents the estimates of certain types of solid waste generated per week on an individual vessel in the Holland America Lines and Royal Caribbean Cruises fleets.
Table 5-2. Estimates of Solid Waste Generated Per Vessel per Week
Holland America Lines Royal Caribbean Cruises Dunnage 30 cubic meters 60 cubic meters Glass and Cans 6,000 lbs of glass
450 lbs of cans 5 cubic meters of glass
2.5 cubic meters of cans Food Wastes 12 cubic meters 12 cubic meters
Sources: ADEC, 2002 and Royal Caribbean Cruises Ltd., 1999 The amount of solid waste generated by cruise ships varies from ship to ship, based on the size of the vessel, number of passengers and crew, and consumption of material. Compared to other types of vessels, cruise ships generate large volumes of solid waste. Environmental Resources Limited (1991) estimated that a cruise ship generates 70 times more solid waste per day than a typical cargo ship. However, the National Research Council (1995) acknowledges that when examining vessel garbage, the estimate of the quantity of garbage generated is not necessarily a measure of the amount handled by onboard treatment technologies or port reception facilities. When determining the amount of garbage generated on a vessel, the National Research Council (1995) suggests that the “amount of garbage is proportional to the community’s standard of living; the higher the standard, the more seafarers are likely to use packaged prepared foods,
5-2

December 29, 2008
supplies, and single use items rather than provisions requiring added preparation and cleanup.” It has been further estimated that 24% of the solid waste generated by vessels worldwide (by weight) comes from cruise ships (National Research Council, 1995). With large cruise ships carrying several thousand passengers, the amount of waste generated in a given day can be considerable. One large cruise ship of 2,500 passengers and 800 crew (total 3,300 persons onboard) can generate 1 ton of garbage from normal operations in a day (National Research Council, 1995). On average, each cruise ship passenger generates at least two pounds of non-hazardous solid waste per day (CELB, 2003). In addition to that, each cruise ship passenger disposes of two bottles and two cans (both of which are recyclable materials) per day (CELB, 2003). Table 5-3 presents various estimates of the amount of solid waste a passenger generates in a given day during a cruise.
Table 5-3. Estimates of Solid Waste Generated per Person per Day on a Cruise Ship
Source of Data Trash Generated (lbs/person/day)
Environmental Resources Limited 7.7 Florida Caribbean Cruise Association 0.7 Holland America Line 1.8 Organization of Eastern Caribbean States Waste Management Study
6.5
Seebacher 5.7 Source: Simmons & Associates, 1994
The newest addition in Royal Caribbean’s Freedom family of ships, the Liberty of the Seas, is currently the largest cruise ship at 1,112 ft long and carries up to 3,634 passengers and 1,360 crew. Building even larger cruise ships is on the horizon with Royal Caribbean building Genesis class ships that will be almost 1,200 feet long (Bell, 2007). Over the past two decades, the average ship size has been increasing at the rate of roughly 90 ft every 5 years (Bell, 2007). As the size and number of passengers these cruise ships can carry increases, the volume of wastes generated – and discharged – will presumably increase as well. 5.2 What federal laws apply to solid waste from cruise ships? 5.2.1 International Convention for the Prevention of Pollution from Ships and Act to Prevent
Pollution from Ships The International Convention for the Prevention of Pollution from Ships (MARPOL) MARPOL Annex V regulates the disposal of garbage into the sea, by setting forth prohibitions on disposal (e.g., of plastics), to establishing how and where garbage generated during the normal operation of a ship is to be disposed (e.g., food wastes). Under Annex V, the term garbage includes “all kinds of victual, domestic and operational waste, excluding fresh fish and parts thereof, generated during the normal operation of the ship and liable to be disposed of continuously or periodically except those substances which are defined or listed in other
5-3

December 29, 2008
Annexes.” The Annex also requires governments to ensure the provision of facilities at ports and terminals for the reception of garbage. Annex V sets more stringent discharge standards for specifically identified “special areas.” The special areas are “sea areas where for recognized technical reasons in relation to its oceanographic and ecological conditions and to the particular character of its traffic, the adoption of mandatory methods for the prevention of sea pollution by garbage is required.” The special areas identified by Annex V are the Mediterranean Sea, Baltic Sea, Black Sea, Red Sea, Gulfs area, North Sea, Antarctic, and Wider Caribbean Region. In addition, the Annex requires some ships (i.e., depending on size and passenger load) to maintain Garbage Record Books, develop Garbage Management Plans, and display placards that outline the disposal requirements. Act to Prevent Pollution from Ships The Act to Prevent Pollution from Ships (APPS) and its implementing regulations (33 CFR 151.51-77) prohibit the discharge of all garbage within three miles of shore; certain types of garbage from 3-25 miles offshore; and plastic anywhere. Vessels are also required to record each discharge or incineration of garbage in a Garbage Record Book. Under APPS, the definition of “ship” includes fixed or floating platforms. There are separate garbage discharge provisions applicable to these units. For these platforms, and for any ship within 500 meters of these platforms, disposal of certain types of garbage is prohibited. Additionally, all manned, oceangoing U.S. flagged vessels of 12.2 meters or more in length that are engaged in commerce, and all manned, fixed, or floating platforms subject to the jurisdiction of the United States, are required to keep records of garbage discharges and disposals. The Coast Guard regularly inspects vessel discharge records and logbooks required by MARPOL, and investigates all allegations of illegal discharges on the high seas or within United States waters. Receipts and record-keeping for Annex V waste streams from ships are addressed in MARPOL Annex V, Regulation 9. Applicable Coast Guard Regulations The Coast Guard generally has the primary responsibility to prescribe and enforce the regulations necessary to implement APPS in the United States. The following Coast Guard regulations pertain to the management of solid waste on ships: Every manned oceangoing ship of 400 gross tons and above and every ship certified to
carry 15 passengers or more shall ensure that a written record is maintained on the ship for the following discharge or disposal operations:
o discharge overboard, o discharge to another ship, o discharge to a reception facility, and o incineration on the ship (33 CFR 151.55).
Each manned, oceangoing ship of 40 feet or more in length must have a garbage
management plan in place and each person handling the garbage must follow the plan (33 CFR 151.57).
Each ship of 26 feet or more must ensure that appropriate placards outlining disposal
requirements are placed in prominent locations and in sufficient numbers for both passengers and crew (33 CFR 151.59).
5-4

December 29, 2008
No person onboard any ship may discharge garbage into navigable waters of the United
States. Navigable waters means the waters of the United States, including the territorial seas (i.e., the belt of seas measured from the line of ordinary low water along that portion of the coast which is in direct contact with the open sea and the line marking the seaward limit of inland waters, and extending seaward a distance of three miles). No person onboard any ship may discharge into the sea, or into the navigable waters of the United States, plastic or garbage mixed with plastic, including but not limited to synthetic ropes, synthetic fishing nets, and plastic garbage bags. All garbage containing plastics must be discharged ashore or incinerated (33 CFR 151.66 and 151.67).
For vessels operating outside a special area, no person may discharge, into the sea,
garbage that is separated from plastic, if the distance from nearest land is less than: (1) 25 nautical miles (nm) for dunnage, lining and packing materials that float; or (2) 12 nm for victual wastes (any spoiled or unspoiled food wastes) and all other garbage including paper products, rags, glass, metal, bottles, crockery and similar refuse, except that, such garbage may be discharged outside of 3 nm from nearest land after it has been passed through a grinder or comminuter (i.e., pulverizer) and is capable of passing through a screen with openings no greater than 25 mm (33 CFR 151.69).
When the garbage is mixed with other discharges having different disposal or discharge
requirements, the more stringent requirements shall apply. Table 5-4 provides a summary of garbage discharge restrictions per 33 CFR Part 151 for vessels operating both in special areas and outside of special areas.
Table 5-4. Summary of Garbage Discharge Restrictions for Vessels
All Vessels Except Fixed or Floating Platforms and Associated Vessels Garbage Type
Outside special areas (33 CFR 151.69)
In special areas2
(33 CFR 151.71)
Plastics, including synthetic ropes and fishing nets and plastic bags
Disposal prohibited (33 CFR 151.67)
Disposal prohibited (33 CFR 151.67)
Dunnage, lining, and packaging materials that float
Disposal prohibited less than 25 miles from nearest land and in the navigable waters of the U.S.
Disposal prohibited (33 CFR 151.71)
Paper, rags, glass, metal bottles, crockery and similar refuse
Disposal prohibited less than 12 miles from nearest land and in the navigable waters of the U.S.
Disposal prohibited (33 CFR 151.71)
Paper, rags, glass, etc. -- comminuted or ground1
Disposal prohibited less than 3 miles from nearest land and in the navigable waters of the U.S.
Disposal prohibited (33 CFR 151.71)
Victual waste4 not comminuted or ground
Disposal prohibited less than 12 miles from nearest land and in the navigable waters of the U.S.
Disposal prohibited less than 12 miles from nearest land
Victual waste comminuted or ground1
Disposal prohibited less than 3 miles from nearest land and in the navigable waters of the U.S.
Disposal prohibited less than 12 miles from nearest land
5-5

December 29, 2008
Mixed garbage types3 See Note 3 See Note 3 Source: 33 CFR 151.51- 151.77 Appendix A 1 Comminuted or ground garbage must be able to pass through a screen with a mesh size no larger than 25 mm (1 inch) (33 CFR 151.75). 2 Special areas under Annex V are the Mediterranean, Baltic, Black, Red, and North Seas areas, the Gulfs area, the Antarctic area, and the Wider Caribbean region, including the Gulf of Mexico and the Caribbean Sea (33 CFR 151.53). 3 When garbage is mixed with other substances having different disposal or discharge requirements, the more stringent disposal restrictions shall apply. 4 Victual waste is any spoiled or unspoiled food waste. The regulations applicable to port reception facilities for garbage are published at 33 CFR
Part 158. Under those regulations, the Coast Guard administers the reception facility “Certificate of Adequacy” (COA) program for certification, including periodic inspection of the port reception facilities to which those regulations apply. All port facilities and terminals under the jurisdiction of the United States, including commercial fishing facilities, mineral and oil shore bases, and recreational boating facilities, must have a garbage reception facility which meets the regulatory requirements for adequacy (33 CFR 158.133(c)). These regulations apply to U.S. ports and terminals that receive garbage from cruise ships. Though only a subset of those ports require a COA, (see 33 CFR 158.135(c) for COA criteria with respect to Annex V wastes), Coast Guard field units regularly inspect all port reception facilities for adequacy, regardless of the requirement for a COA, and investigate all allegations of inadequate reception facilities.
5.2.2 Clean Water Act As a general matter, the Clean Water Act (CWA; 33 U.S.C. § 1251 et seq.) prohibits any person from discharging any pollutant from any point source into waters of the United States, which includes the territorial seas (i.e., the belt of seas measured from the line of ordinary low water along that portion of the coast which is in direct contact with the open sea and the line marking the seaward limit of inland waters, and extending seaward a distance of three miles), except in compliance with a National Pollutant Discharge Elimination System (NPDES) permit or as otherwise authorized under the Act. The term “point source” is defined to include a “vessel or other floating craft.” The term “pollutant” does not include sewage from vessels (within the meaning of CWA section 312). Outside the territorial seas, i.e., in the contiguous zone or the ocean, the addition of any pollutant from a “vessel or other floating craft” is not a “discharge of pollutants,” and therefore does not require an NPDES permit (CWA section 502(12)(b)). The addition of any pollutant to the waters of the contiguous zone or ocean from any point source other than a “vessel or other floating craft” is a “discharge of pollutants,” and therefore does require an NPDES permit. However, EPA has interpreted this permitting requirement to apply to certain discharges from a vessel that operates in a capacity other than as a means of transportation such as when used as an energy or mining facility, a storage facility or a seafood processing facility, or when secured to the bed of the ocean, contiguous zone, or waters of the United States for the purpose of mineral or oil exploration or development (40 CFR 122.3(a)). In addition, EPA regulations (40 CFR 122.3(a)) have historically excluded discharges incidental to the normal operation of a vessel (for example, effluent from properly functioning marine engines, laundry, shower, and galley sink wastes) from the requirement of an NPDES permit.
5-6
December 29, 2008
This regulatory exclusion has not applied and does not apply to discharges of rubbish, trash, garbage, or other such materials discharged overboard a vessel, which would be solid waste subject to RCRA. Whether a discharge is authorized under an NPDES permit affects applicability of RCRA; dissolved and solid materials in industrial discharges which are point sources subject to NPDES permits are not “solid waste” under the RCRA statute. This only applies to materials once they have been discharged. For further information regarding operation of the RCRA statute as it applies to solid waste and hazardous waste, see sections 5.2.4 and 6.2.2, respectively. 5.2.3 National Marine Sanctuaries Act The National Marine Sanctuaries Act (NMSA; 16 U.S.C. § 1431 et seq.), as amended, established a national program to designate certain areas of marine environments as areas of special national significance that warrant heightened care. The primary purpose of the law is to protect marine resources and ecosystems, such as coral reefs, sunken historical vessels, or unique habitats, from degradation while facilitating public or private uses compatible with resource protection. NMSA authorizes the National Oceanic and Atmospheric Administration (NOAA) to designate as National Marine Sanctuaries areas of the marine environment that have special aesthetic, ecological, historical, or recreational qualities, and to provide comprehensive and coordinated conservation management for such areas. The National Marine Sanctuary Program manages 13 sanctuaries and the Papahānaumokuākea Marine National Monument (together referred to as “sites”). Designated sites are managed according to site-specific management plans developed by NOAA that typically prohibit by regulation the discharge or deposit of most material. Under NOAA's implementing regulations for NMSA, it is illegal to discharge solid waste into most national marine sanctuaries. 5.2.4 Resource Conservation and Recovery Act The Resource Conservation and Recovery Act (RCRA; 42 U.S.C. § 6901 et seq.) is the federal law that, among other things, defines and provides for regulation of solid waste and hazardous waste. RCRA is designed to minimize the hazards of waste disposal, conserve resources through waste recycling, recovery, and reduction, and ensure waste management practices that are protective of human health and the environment. In order to achieve these goals, RCRA established a Solid Waste Program (RCRA Subtitle D) and a Hazardous Waste Program (RCRA Subtitle C).1 RCRA Subtitle D encourages environmentally-sound solid waste management practices that maximize source reduction, reuse, and recycling efforts, and establishes regulations that specify how solid waste disposal facilities (i.e., municipal solid waste landfills) should be designed and operated. RCRA provides that solid waste is predominantly regulated by state and local governments (U.S. Environmental Protection Agency, 2006).
1 In states with hazardous waste programs authorized by EPA, the authorized state hazardous waste program operates in lieu of the federal hazardous waste program. Some states have authorized hazardous waste programs that are more stringent than the federal hazardous waste program.
5-7

December 29, 2008
5.2.5 Marine Protection, Research, and Sanctuaries Act The Marine Protection, Research, and Sanctuaries Act (MPRSA, 33 U.S.C. § 1401 et seq.) (also called the Ocean Dumping Act) prohibits (1) the transportation of any material from the United States for the purpose of disposal in ocean waters without a permit; (2) the transportation of any material by U.S. agencies or by U.S. flagged vessels or aircraft for the purpose of disposal in ocean waters without a permit; and (3) any person from dumping, without a permit, any material transported from a location outside the United States into the U.S. territorial seas or into the contiguous zone, to the extent it may affect the territorial seas or the territory of the United States. This Assessment Report does not address the transportation of materials that would require an ocean dumping permit under MPRSA. 5.3 What practices are available to manage solid wastes generated on cruise ships? The management of shipboard-generated waste is a challenge not only for cruise ships at sea, but also for other commercial vessels, military ships, fishing vessels, and recreational boats. Most cruise ship trash is treated onboard (incinerated, pulped, or ground for discharge overboard) (CRS, 2007). According to ADEC (2001), 75 to 85% of trash is generally incinerated onboard, and the ash is typically discharged at sea; some solid waste is landed ashore for disposal or recycling (CRS, 2007). The Center for Environmental Leadership in Business (CELB) (2003) states that Royal Caribbean’s Vision-class ships sort, crush, and off-load about 450 pounds (204kgs) of aluminum cans for recycling per week-long trip. Food wastes and hazardous wastes generated on cruise ships are often separated from other solid wastes and processed separately. Food waste is often pulped or compressed, and then incinerated. According to ADEC (2000), the food liquids (1,300 to 2,600 gallons per day) removed during dehydration are recycled through a pulping/compression process several times, and eventually end up in the graywater holding tanks; the remaining compressed, dehydrated food waste is incinerated. Hazardous wastes are separated from other solid wastes because onboard incinerators do not operate at the temperatures necessary to properly destroy hazardous substances. Therefore, proper waste identification and segregation of hazardous waste prior to burning is critical. As a result, waste segregation, as well as crew and passenger training, and compliance with appropriate waste handling procedures is a fundamental aspect of vessel waste management and safe discharges. Upon arriving in port, the solid waste generator (the cruise ship) off-loads any remaining solid waste (including incinerator ash) in accordance with applicable state solid waste management requirements.2 Examples of Royal Caribbean Cruise’s waste management practices are presented in Table 5-5.
2 RCRA Subtitle D established regulations addressing how solid waste disposal facilities should be designed and operated.
5-8

December 29, 2008
Table 5-5. Waste Management Practices as Reported by Royal Caribbean Cruises
Type of Waste Management Practice Cardboard Packaging materials are collected onboard and incinerated or off-loaded for recycling or
disposal. Incinerator ash is landed ashore for disposal. Paper Paper wastes are collected onboard and incinerated or off-loaded for recycling or disposal.
Incinerator ash is landed ashore for disposal. Plastic Plastic wastes are collected onboard and incinerated or off-loaded for recycling or
disposal. Incinerator ash is landed ashore for disposal. Glass Glass is collected, crushed onboard, stored, and off-loaded for recycling. Metal Cans Cans are collected and sorted onboard to separate out the aluminum cans that have a high
market recycling value. Cans are crushed on board, stored, and off-loaded for recycling. Food Waste Wet food waste is processed through giant grinders (called pulpers) that reduce the size of
food particles, which allows for more efficient removal of water by extractors. Removing excess water allows food waste to be burned and managed more easily. The water removed in the process is ultimately discharged as gray water. Incinerator ash is landed ashore for disposal.
Source: RCCL, 1999 The Cruise Lines International Association (CLIA) environmental standards noted earlier are intended to provide for improved solid waste management through: source reduction, minimization, recycling, collection, processing, and discharge ashore.
The CLIA environmental standards are intended to provide for the elimination of, to the maximum extent possible, the disposal of MARPOL Annex V wastes into the marine environment through purchasing practices, reuse and recycling programs, landing ashore, and onboard incineration in approved shipboard incinerators. Some cruise ships report that they employ various types of equipment such as glass crushers, metal can compactors, and shredders in addition to incinerators, to prepare waste to be recycled in port (U.S. General Accounting Office, 2000). Adopting a multifaceted strategy that includes waste minimization, source reduction, and recycling, along with waste stream management and periodic ash testing, should be sufficient to ensure that incinerator ash does not meet the definition of hazardous waste (e.g., if it exhibits a characteristic of hazardous waste as defined in 40 CFR Part 261 Subpart C. For more information, see Section 6 for the hazardous waste discussion). Proper hazardous waste management procedures are to be instituted onboard each ship to ensure that waste products which will result in a hazardous ash are not introduced into the incinerator. The CLIA environmental standards further provide that when such items are separated out from the waste stream, the waste will be identified and segregated for individual handling and management in accordance with appropriate laws and regulations. (CLIA, 2006). As mentioned above, the CLIA environmental standards call for the testing of incinerator ash at least once quarterly for the first year of operation to establish a baseline, and annual testing
5-9

December 29, 2008
thereafter. Any incinerator ash that exhibits a characteristic of hazardous waste as defined in 40 CFR Part 261 Subpart C must be disposed onshore in accordance with RCRA, which may include additionally applicable state law requirements specific to the jurisdiction where the ash is landed. MARPOL Annex V specifies requirements for the disposal at sea of non-hazardous incinerator ash, which alternatively can be landed ashore. Some additional reported approaches available to large cruise ship lines to reduce solid waste discharges that specifically target the proper handling of plastics include the following (U.S. General Accounting Office, 2000; RCCL, 1998): replacing disposable plastic and Styrofoam cups with reusable cups; reducing paper and plastic wrapping; replacing plastic condiment packages with bulk dispensers; eliminating plastic garbage bag liners; replacing disposable plastic plates and cutlery with china and washable plastic dishes; eliminating plastic bottles of shampoo and body lotion and replacing them with
dispensers in the cabins; and using recycled paper in laundry bags instead of plastic.
5.4 What are the potential environmental impacts associated with solid waste from
cruise ships? Waste products in the past were made from natural materials and were mostly biodegradable. Now, much of the non-hazardous waste generated is either not easily biodegradable or does not biodegrade at all (CELB, 2003). According to Campbell (1999), the average solid waste generated daily per cruise ship passenger is 3.5 kilograms, which consists of food wastes, glass, plastics, paper, cans, cardboard, and wood. If cruise ships fail to properly store solid waste that is destined for off-loading to port reception facilities or fail to properly incinerate their solid waste before disposing of it into the ocean, or if passengers throw litter overboard or items are inadvertently blown overboard (e.g., towels, clothes, soda cans, plastic bottles, etc.), there is the potential for the introduction of plastics and other solid wastes from cruise ships into the marine environment. In such instances, the solid waste introduced into the marine environment becomes marine debris. According to NOAA, any persistent solid material that is manufactured or processed and directly or indirectly, intentionally or unintentionally, disposed of or abandoned into the marine environment or the Great Lakes is marine debris (NOAA, 2008). Marine debris has also been defined as “any man-made object that enters the marine environment due to numerous processes, including careless handling or disposal, intentional or unintentional release of materials or as a result of national disasters and storms (Sheavly, 2007). Marine debris can also be considered simply as objects that are found in the marine environment but do not naturally occur there (U.S. Environmental Protection Agency, 1992). Even though under the MARPOL agreement and U.S. federal law it is illegal for any vessel to discharge plastics or garbage containing plastics into any waters, there have been cases when unlawful discharges of solid waste and plastics have taken place. From 1993 through 1998, federal data indicate that foreign-flagged cruise ships were involved in 6 cases of confirmed illegal discharges of garbage or plastic (U.S. General Accounting Office, 2000). Solid waste that
5-10
December 29, 2008
enters the ocean directly or indirectly can pose a threat to marine organisms, humans, coastal communities, and commercial industries. This marine debris may accumulate on beaches, on the surface of waters, and in the benthos. The fate of garbage after it is discharged overboard depends on a number of factors, including the physical characteristics (especially the density) of the solid and whether the garbage is loose or bagged. According to the National Research Council (1995), large, dense particles, such as ground glass and shredded metal, quickly sink. In areas where there is a strong pycnocline, small particles tend to disperse in the surface layer, while emulsified particles may remain in the water column for long periods of time. Organic material may or may not sink. Plastics are quite buoyant and may accumulate on the surface of water and on beaches. According to Cohen (2008), 60% of trash on beaches is plastic, and 90% of debris floating in the ocean is plastic. Newly discarded plastic items float and may be transported far from the site of discharge. Plastics also may sink over time as they break apart, weather, or accumulate organic coatings, tar, shells, or sand. Floating debris, such as plastics, is being implicated in the contamination of some habitats by nonindigenous invasive species (Cruise Ship Environmental Task Force, 2003). Consequently, implementing proper garbage handling practices for plastics is especially critical given that plastics are “highly functional materials and will continue to be available” (National Research Council, 1995). Regardless of how materials are predicted to flow in the ocean, wash ups of some types of marine debris on beaches seem to defy logical explanation (National Research Council, 1995). Not only can beach users be injured by pieces of glass, cans, or other litter washed ashore, such marine debris on beaches may cause significant adverse economic impact in coastal communities. For example, in 1988, it was estimated that New Jersey lost between $379 million and $3.6 billion in tourism and other revenue as a result of debris washing ashore (National Research Council, 2008). The potential environmental and physical effects of marine debris include (National Research Council, 1995): aesthetic degradation of surface waters and beach areas; physical injuries to humans and life-threatening interference with their activities; ecological damage caused by the interference of plastics with gas exchange between
overlying waters and those in the benthos; alterations in the composition of ecosystems caused by debris that provide habitat for
opportunistic organisms; entanglements of birds, fish, turtles, and cetaceans in lost or discarded nets, fishing gear,
and packaging materials; and ingestion of plastic particles by marine animals.
Food is often the largest single component of the garbage stream in ships (Polglaze, 2003). If discharged in sufficient quantities, food waste can contribute to increases in biological oxygen demand, chemical oxygen demand, and total organic carbon, diminish water and sediment quality, adversely effect marine biota, increase turbidity, and elevate nutrient levels. Polglaze (2003) further states that food waste components may be detrimental to fish digestion and health,
5-11

December 29, 2008
and have unsuitable nutrient content. Continued disposal of food wastes in restricted environments can cause nutrient pollution, if the water is not freely exchanged (Cruise Ship Environmental Task Force, 2003). Also, regular and sufficiently large inoculations of food waste to an area may cause ecological changes such as perturbations to species behavioral patterns and alternation to community species composition and diversity (Polglaze, 2003). An additional potential environmental impact of discharged food waste may be the inadvertent introduction of food associated plastics. To avoid an unintentional introduction of plastics with food wastes to the marine environment, it is critical to remove all food associated plastics before food wastes are comminuted prior to being discharged at sea or incinerated to then be discharged at sea. Ash generated from the incinerator consists of trash (e.g., cardboard, paper, plastic), food solids from the food pulper systems, and sewage/graywater residuals (e.g., graywater screening solids, sewage/graywater screening solids, and sewage/graywater waste biosludge). The International Maritime Organization (IMO) guidelines for Annex V implementation recognize the potential for air pollution associated with incinerator use and therefore discourage the use of incinerators in ports in or near urban areas (Annex V, Appendix B, Section 5.4). The guidelines further recognize that some disadvantages of incinerators may include the hazardous nature of the ash or vapor, and that when in use, incinerators may not meet air pollution regulations imposed in certain harbors (Annex V, Appendix B, Section 5.4.5). Further, the incineration of plastics requires special precautions due to the potential environmental and health effects from the combustion of by-products. In these cases, the guidelines suggest that the incineration of plastic wastes complying with Annex V is to take place in a safe manner with an incinerator suitable for the incineration of plastics, otherwise the following problems can result:
Depending on the type of plastic and conditions of combustion, some toxic gases can be generated in the exhaust stream, including vaporized hydrochloric and hydrocyanic acids. These and other intermediary products of plastic combustion can be extremely dangerous (Annex V, Appendix B, Section 5.4.6.1).
The ash from the combustion of some plastic products may contain heavy metal or other residues which can be toxic and should therefore not be discharged into the sea (Annex V, Appendix B, Section 5.4.6.2).
Further, the Parliamentary Commission for the Environment (2003) states that a cruise ship solid waste incinerator may produce small amounts of polychlorinated biphenyls and polycyclic aromatic hydrocarbons. 5.5 What action is the federal government taking to address solid waste from cruise ships? The Interagency Marine Debris Coordinating Committee, a federal group co-chaired by EPA and NOAA, is looking into ways to reduce the impact and sources of marine debris (any abandoned or uncontrolled solid material that is introduced into the ocean and coastal environment), including debris from vessels such as cruise ships. The group provided recommendations for research priorities, educational programs, monitoring techniques, and federal agency action in a Report to Congress in 2008. This report is required by section 5(c) of the Marine Debris Research, Prevention, and Reduction Act (Pub. L. 109-449).
5-12

December 29, 2008
According to the IMO (2007), the United Nations General Assembly invited IMO to review MARPOL Annex V, in consultation with relevant organizations and bodies, to assess the Annex’s effectiveness in addressing sea-based sources of marine debris. Comprehensive review of MARPOL Annex V began in February 2006 with the formation of a correspondence group. The U.S. Government has been an active participant in this group. A working group to consider whether amendments to the Annex are necessary will be formed in July 2009 at MEPC 59. The Coast Guard implements ongoing inspection and compliance programs to insure the adequacy of port reception facilities. In 2006 alone, the Coast Guard conducted over 14,000 facility inspections (up from approximately 3,500 in calendar year 2000), including inspections of MARPOL Annex V port reception facilities for compliance and adequacy. During the period from 2002 to 2006, vessel arrivals at U.S. ports nearly doubled, which in turn increased pressure on the capacities of U.S. ports. In meeting this increased compliance and inspection challenge, the Coast Guard issued or responded to and investigated 7,424 facility deficiencies in calendar year 2006, including reception facility deficiencies (up from 2,587 in calendar year 2000). From the time period between 2002 and 2006, the Coast Guard has documented a 26% reduction in the number of pollution incidents reported at facilities, which demonstrates the Coast Guard’s continuing commitment to vigorous implementation of the pollution prevention and environmental stewardship missions which have been entrusted to the Coast Guard by Congress. This includes the administration of the COA program and insuring the adequacy of all U.S. port reception facilities for Annex V wastes from vessels. The United States (as a party to MARPOL), with active Coast Guard engagement, participates in international work groups in efforts to standardize both Advance Notice Forms generated by vessels with respect to their reception facility needs for all wastes and a standard receipt form for such wastes. Addressing this standardization issue has been an ongoing effort by the MEPC of the IMO (since at least October 2004) to improve the performance of port reception facilities for solid waste management. The Coast Guard itself has focused on ways to address standardized reporting, including updates to implementing regulations, as well as the Coast Guard instructions that provide guidance to its field units. Implementation of standardized receipts, as proposed by the IMO with Coast Guard concurrence, will enhance the capacity of Coast Guard inspectors to confirm both allegations of illegal discharges and reports of inadequate reception facilities (approximately 80 reports of inadequacies have been received and investigated in 2007). Coast Guard inspectors will be able to compare Advance Notice records with reception facility receipts (which are required to be kept with the vessel garbage log book for a period of two years under Section 4.2 of the Appendix to MARPOL Annex V, 2006 Consolidated Edition). Presently, reports of inadequate reception facilities are available through the IMO’s Global Integrated Shipping Information System public website at http://gisis.imo.org/Public/. The National Park Service (NPS) manages cruise ship waste streams indirectly in Glacier Bay National Park through competitively awarded concession contracts. The NPS has jurisdiction over the submerged lands and marine waters of Glacier Bay National Park up to 3 miles from the mean high tide line and including all of Glacier Bay proper. Glacier Bay is a well known, very popular attraction for the cruise ship industry in Alaska. Recent environmental reviews and decisions allow up to two cruise ship entries per day into Glacier Bay proper during the primary
5-13

December 29, 2008
visitor season. Cruise ship operations in the park are authorized under concession contracts, which are awarded under a competitive solicitation and prospectus process. Impact on park resources is a general standard selection criterion for park concessions. The NPS uses waste stream management as one of a number of selection criteria in this regard. In the past, cruise ship operators have usually proposed to minimize the impact of waste streams by committing to a no-discharge policy while in the park (even if legal under applicable law) for sewage, graywater, ballast water, bilge water, cooling water, hazardous waste, and solid waste. If awarded a contract, companies must comply with their proposal. Typically cruise ships operate in the park for 8-10 hours and then depart. Cruise ships do not dock or transfer any wastes to shore while in the park. 5.6 Possible Options and Alternatives to Address Solid Waste from Cruise Ships Based on the public comments received on the draft of this report as well as other information gathered, listed below are a wide range of options and alternatives that address solid waste from cruise ships. Identification of any particular option does not imply any EPA recommendation or preference for future action, or that EPA has determined that any of these options are necessary or feasible, or that EPA believes a change to the status quo is warranted, or that EPA or any other entity has the legal authority to implement that option. Prevention & Reduction
Increase use and range of on-board garbage handling and treatment technologies (e.g., compactors, pulpers, shredders, and incinerators).
Resolve issues that may be impeding safe waste storage and expanded use of compactors and incinerators.
Improve infrastructure to assist in recycling of all glass, paper, wood, cardboard, and aluminum and other metals.
Introduce and encourage cruise line participation in EPA’s WasteWise and Recycle on the Go solid waste reduction programs which provide technical assistance to organizations to develop and implement solid waste reduction practices (further information is available at http://www.epa.gov/wastewise/about/overview.htm and http://www.epa.gov/osw/conserve/rrr/rogo/index.htm).
Employ waste reduction for waste materials and plastics by reducing the amount of plastics and other packaging materials brought onboard.
Increase efforts to buy in bulk and choose products with less packaging. Control: Discharge Standards
Expand training for employees regarding waste segregation requirements by including the legal and environmental basis for those requirements.
Post waste segregation requirements (along with the associated the legal and environmental concerns) onboard (via placards and written information) for employees and passengers.
Initiate rulemaking to provide for stronger waste management plans than the current cruise industry practices in order to control solid waste discharges from cruise ships into all U.S. waters.
5-14

December 29, 2008
Include adequate port reception facilities as a component of a comprehensive vessel garbage management system, and establish a fee system to encourage the use of the facilities.
Require that U.S. ports initiating port expansions also build additional reception facilities to receive Annex V wastes from cruise ships.
Sort all wastes onboard and off-load recyclables only at ports with recycling facilities. Establish accountability for both vessel operators and port operators with regard to proper
solid waste management. Determine who should pay for vessel garbage services. Ensure all biohazard wastes and infirmary/sickbay wastes are properly processed for
disposal in compliance with state solid waste disposal regulations for hospital wastes. Require an analysis and accounting of the contaminants typically found in cruise ship
incinerator ash to determine whether each batch of ash generated should be categorized as a solid waste or hazardous waste to then be managed accordingly.
Require standardized incinerator ash testing before each overboard discharge. Establish performance standards for onboard incinerators to ensure Annex V compliance. Develop standards for compacted solid waste discharges to the marine environment.
Control: Geographic Restrictions on Discharge
Prohibit the discharge of any waste, food, or otherwise macerated waste into any marine sanctuary or any other sensitive area.
Prohibit the discharging of incinerator ash from cruise ships into U.S. waters. Discontinue discharges of dunnage and floating waste in all waters. Bring all solid waste to shore for disposal or recycling. Encourage the cruise industry to work with private vendors and ports to ensure that ample
recycling opportunities exist in foreign ports. Expand all port reception facilities to accept solid waste. Require that wherever cruise ships call, receiving ports provide reception facilities for
solid waste off-loading and have established waste reception plans. Prohibit the use of incinerators while in port. Require that cruise ships off-load garbage during U.S. port calls. Encourage EPA and Coast Guard to:
o conduct a feasibility study to determine the costs to provide adequate port reception facilities for cruise ships; and
o develop a “polluter pays” funding mechanism to pay for some or all of the capital costs, operations, and maintenance of such port reception facilities.
Enforcement & Compliance Assurance: Monitoring
Establish a mandatory, standardized incinerator ash testing program to determine appropriate management of the ash.
Ensure no discharge of solid waste into the marine environment by establishing a system of monitoring compliance, adequate sanctions for noncompliance, and forwarding non-compliance data to the vessel’s next port of call.
5-15

December 29, 2008
Enforcement & Compliance Assurance: Reporting
Require that ports provide receipts for garbage off-loaded to their reception facilities; compare the receipts to vessel garbage logs for inconsistencies.
Assess the need for increased recording/logging of garbage generation onboard cruise ships.
Require that cruise ships maintain certified log books documenting incinerator ash test results, dates, volumes, ultimate disposition of ash, and locations of legal ash discharges.
Publicize the APPS whistleblower provisions under 33 U.S.C. 1908(a) to passengers and crew members to encourage detection of illegal pollution.
Enforcement & Compliance Assurance: Inspections & Enforcement
Streamline enforcement by issuing “tickets” in civil cases. Encourage vessel owners to report inadequate reception facilities. Conduct public awareness campaigns urging citizens to report illegal garbage disposal
(e.g., passengers on cruise ships who observe any illegal dumping and/or the disposal of plastic at sea should report this to the National Response Center or the nearest Coast Guard Marine Safety Office).
Provide incentives for third party reporting of environmental violations. Impose uniform requirements (consistent with international law) on all ships as a
condition of port entry and within U.S. waters, regardless of flag state. Prohibit or otherwise restrict noncompliant vessels (and sister ships, depending on the
degree of involvement by parent companies) from operating in sensitive areas of the marine environment under U.S. jurisdiction.
5-16

December 29, 2008
References Alaska Department of Environmental Conservation (ADEC). 2000. Alaska Cruise Ship Initiative
Part 1 Final Report. Juneau, AK. (www.dec.state.ak.us/water/cruise_ships/pdfs/finreportp10808.pdf)
Alaska Department of Environmental Conservation (ADEC). 2001. Alaska Cruise Ship Initiative
Part 2 Report. Juneau, AK. (www.dec.state.ak.us/water/cruise_ships/pdfs/acsireport2.pdf)
Alaska Department of Environmental Conservation (ADEC). 2002. The Impact of Cruise Ship
Wastewater Discharge on Alaska Waters. Juneau, AK. (www.dec.state.ak.us/water/cruise_ships/pdfs/impactofcruiseship.pdf)
Bell, Tom. 2007 (September 28). Experts: Mega-berth needed for cruise ships. Portland Press
Herald. (www.pressherald.mainetoday.com/story_pf.php?id=137059&ac=PHnws) Center for Environmental Leadership in Business (CELB). 2003. A Shifting Tide: Environmental
Challenges and Cruise Industry Responses. Washington, DC. (www.celb.org/ImageCache/CELB/content/travel_2dleisure/cruise_5finterim_5fsummary_2epdf/v1/cruise_5finterim_5fsummary.pdf)
Cohen, Roz. 2008 (January 18). There’s a future in plastics.
(http://www.conservation.org/FMG/ARTICLES/Pages/01180802.aspx) Congressional Research Service (CRS). 2007. Cruise Ship Pollution: Background, Laws and
Regulations, and Key Issues (Order Code RL32450). Washington, DC. (www.ncseonline.org/NLE/CRSreports/07Jul/RL32450.pdf)
Cruise Lines International Association (CLIA). 2006. CLIA Industry Standard: Cruise Industry
Waste Management Practices and Procedures. Fort Lauderdale, FL. (www.cruising.org/industry/PDF/CLIAWasteManagementAttachment.pdf and www.cruising.org/industry/PDF/CLIAWasteManagement.pdf)
Cruise Ship Environmental Task Force. 2003. Report to the Legislature: Regulation of Large
Passenger Vessels in California. (http://www.swrcb.ca.gov/publications_forms/publications/legislative/docs/2003/cruiseshiplegrpt.pdf)
Environmental Resources Limited. 1991. Port Reception and Disposal Facilities for Garbage in
the Wider Caribbean (Final Report). Prepared for the International Maritime Organization, the World Bank. London, England.
International Maritime Organization (IMO). 2007. Prevention of Pollution by Garbage from
Ships. London, England. (www.imo.org/Environment/mainframe.asp?topic_id=297)
5-17

December 29, 2008
5-18
National Oceanic and Atmospheric Administration (NOAA). 2008. Marine Debris 101. (http://marinedebris.noaa.gov/marinedebris101/welcome.html)
National Research Council (NRC). 2008. Tackling Marine Debris in the 21st Century (Report in
Brief). Washington, D.C. (http://www.nationalacademies.org/includes/marinedebris.pdf) National Research Council (NRC), 1995. Clean Ships, Clean Ports, Clean Oceans: Controlling
Garbage and Plastic Wastes at Sea. National Academy Press: Washington, DC. Parliamentary Commissioner for the Environment. 2003. Just Cruising? Environmental Effects
of Cruise Ships. Wellington: Parliamentary Commissioner for the Environment. ISBN: 1-877274-23-2. (http://www.pce.govt.nz/reports/allreports/1_877274_23_2.shtml)
Polglaze, John. 2003. Can We Always Ignore Ship-Generated Food Waste? Marine Pollution
Bulletin. Volume 46, Issue 1. pp. 33-38. (http://www.sciencedirect.com/science?_ob=ArticleURL&_udi=B6V6N-47MHXHP-3&_user=14684&_rdoc=1&_fmt=&_orig=search&_sort=d&view=c&_acct=C000001678&_version=1&_urlVersion=0&_userid=14684&md5=75901cf546aed19105a093695ad6388e)
Royal Caribbean Cruises Ltd. (RCCL). 1999. Save the Waves. Environmental Report. Sheavly, S.B. 2007. National Marine Debris Monitoring Program: Final Program Report, Data
Analysis and Summary. Prepared for U.S. Environmental Protection Agency by Ocean Conservancy, Grant Number X83053401-02. (http://www.oceanconservancy.org/site/PageServer?pagename=mdm_debris)
Simmons & Associates. 1994. The Impact of Tourism on the Marine Environment of the
Caribbean: With Special Reference to Cruise and Other Types of Marine-based Tourism. Caribbean Tourism Organization, Barbados.
U.S. Environmental Protection Agency. 1992. Turning the Tide on Trash: Marine Debris
Curriculum. EPA842-B-92-003. (http://www.epa.gov/owow/OCPD/Marine/contents.html)
U.S. Environmental Protection Agency. 2006. RCRA Orientation Manual 2006: Resource
Conservation and Recovery Act. EPA530-R-06-003. (http://www.epa.gov/epaoswer/general/orientat/rom.pdf)
U.S. General Accounting Office (GAO) (now the Government Accountability Office). 2000.
Marine Pollution: Progress Made to Reduce Marine Pollution by Cruise Ships, but Important Issues Remain. Report to Congressional Requesters. GAO/RCED-00-48.

December 29, 2008
Section 6: Hazardous Waste
Hazardous waste is a subset of “solid waste,” and is a waste that contains hazardous constituents that can be liquid, solid, semisolid, or contained gas. On most cruise ships, the hazardous waste generated onboard is stored onboard until the wastes can be off-loaded for recycling or disposal. Hazardous waste that is off-loaded for disposal in the United States is handled in accordance with RCRA requirements, and must be sent to a licensed hazardous waste Treatment, Storage, and Disposal Facility. This section discusses the current state of information about hazardous waste, the laws regulating hazardous waste from vessels, how hazardous waste is managed on cruise ships, the potential environmental impacts of cruise ship hazardous waste, and federal actions taken to address hazardous waste from cruise ships. The conclusion of this section lists a wide range of options and alternatives that could be considered when addressing hazardous waste from cruise ships. 6.1 What is RCRA hazardous waste and how much is landed by cruise ships to the
United States? Under federal law, “hazardous waste” is a subset of “solid waste.” The regulations implementing the Resource Conservation Recovery Act (RCRA) establish the criteria for defining “hazardous waste” with two basic approaches: a solid waste is a hazardous waste if it is either a waste that appears on one of the four hazardous waste lists (i.e., F-List, K-List, P-List, or U-List); or the solid waste exhibits at least one of four hazardous characteristics (ignitability, corrosivity, reactivity, or toxicity). Once a waste is identified as a hazardous waste, any person who generates or manages the hazardous waste must comply with all applicable state and federal regulations regarding its management. Hazardous wastes need to be stored, treated, and disposed in a manner so as to minimize the risks to human health and the environment. The universe of hazardous waste is diverse – it is a waste that contains hazardous constituents that can be liquid, solid, semisolid, or contained gas. The universe of wastes generated as a result of daily cruise ship activities is diverse as well. Cruise ship activities such as photo processing, dry cleaning, and equipment cleaning can produce hazardous waste containing a wide range of substances such as water with perchlorethylene from dry cleaning machines, hydrocarbons, chlorinated hydrocarbons, heavy metals, and solvents. Additional wastes generated on cruise ships that may be hazardous include paint waste, aerosol liquid waste from the crushing of aerosol cans, some incinerator ash, fluorescent and mercury vapor light bulbs, various types of batteries, and unused or outdated pharmaceuticals. Table 6-1 identifies different types of wastes generated on cruise ships that are, or may be, hazardous. This is only a list of typical wastes, and ultimately it is the responsibility of the person generating the waste (i.e., ship owner and/or operator) to make this determination and to comply with all applicable environmental requirements.
6-1

December 29, 2008
Table 6-1. Types of Potentially Hazardous Waste Generated Aboard Cruise Ships
Waste Type Description Photo Processing Waste (including X-ray development fluid waste)
Spent fixer, spent cartridges, expired film, and silver flake. The fixer removes unexposed silver compounds from the film during the developing process. Though silver-bearing waste is typically hazardous waste under RCRA due to silver content, RCRA regulations at 40 CFR 266.70, which apply to materials recycled to recover economically significant amounts of certain precious metals, including silver, do not include all of the requirements applicable to other types of hazardous wastes generally.
Dry Cleaning Wastes Dry cleaning units produce a small volume of waste from the bottoms of the internal recovery stills and filter media. This waste comprises dirt, oils, filter material, and spent solvent. The spent solvent is a chlorinated solvent called perchlorethylene (perc) and must be managed as a hazardous waste.
Print Shop Wastes Printing solvents, inks, and cleaners may contain hydrocarbons, chlorinated hydrocarbons, and heavy metals.
Photocopying and Laser Printer Cartridges
Spent or discarded cartridges, inks, and toner materials are not typically defined as hazardous under the federal RCRA program, but may be hazardous waste under some authorized state programs.
Used Cleaners, Solvents, Paints, and Thinners
Degreasing materials are a common element of maintenance onboard vessels; tetrachloroethylene is used for metal-degreasing.
Used or Outdated Pharmaceuticals
Cruise ships have pharmaceuticals based on the ship’s itinerary and the demographics of the passenger base. Inventory that is discarded because it is off specification or has exceeded shelf life may qualify as hazardous waste.
Incinerator Ash Incinerator ash may contain constituents, such as heavy metals, in concentrations that would classify the ash as hazardous waste under RCRA.
Fluorescent/Mercury Vapor Bulbs
These bulbs contain small amounts of mercury, and therefore lamps containing these types of bulbs might qualify as RCRA hazardous waste when discarded. To promote the safe recycling and disposal of certain used lamps, EPA classifies these lamps as Universal Waste (40 CFR 273.5). For more information, see www.epa.gov/epaoswer/hazwaste/id/univwast/lamps/lamps.htm.
Batteries Large batteries are used on tenders and standby generators; small batteries are used in flashlights and cameras. Other equipment on board may also require batteries. Four types of batteries typically used onboard cruise ships are:
Lead-acid – Batteries that are wet, rechargeable, and usually six-celled typically contain a sponge lead anode, a lead dioxide cathode, and a sulfuric acid electrolyte that is corrosive.
Nickel Cadmium (Nicad) – Batteries that are usually rechargeable and contain wet or dry potassium hydroxide as an electrolyte. The potassium hydroxide is corrosive; cadmium is a characteristic hazardous waste.
Lithium – Batteries used for flashlights and portable electronic equipment. Some spent lithium batteries (specifically, lithium metal-sulfide batteries) may constitute hazardous wastes based on the “reactivity” criterion (D003).
Alkaline – Batteries used for flashlights and other personal equipment. Though spent alkaline batteries are not considered hazardous waste under federal regulations, some alkaline batteries might be defined as hazardous waste under some authorized states’ more stringent (or broader in scope) hazardous waste regulations (e.g., some states include tests, such as bioassay tests, to define hazardous waste, and some alkaline batteries may fail this test).
Spent Explosives
Explosives are used occasionally in small quantities for celebratory (e.g., theatrical productions, parties, etc.) and/or emergency purposes (e.g., lifeboat flares). Discarded explosives are managed as hazardous waste (ADEC, 2002).
Sources: ADEC, 2000 and ADEC, 2002
6-2

December 29, 2008
Limited information is available on the amount of hazardous waste that a cruise ship might generate. Table 6-2 presents estimates of the hazardous waste generated in one week by the Holland America Lines fleet, consisting of 11 vessels in 2000, and by the Royal Caribbean Cruises Ltd. fleet, consisting of 17 vessels in 1999. The information provided in Table 6-2 identifies specific hazardous waste materials that result from cruise ship activities. It is possible that these estimates may not be representative of the cruise ship fleets at this time. According to the U.S. General Accounting Office (GAO) Report (2000), some of the larger cruise ship companies reported taking actions to reduce the amounts of hazardous waste onboard. These cruise ship companies reported replacing hazardous chemicals with non-hazardous ones, and implementing procedures to improve the collection and disposal of waste from hazardous materials that cannot be replaced and must still be used. Table 6-3 presents more current estimates of waste measured across all of Carnival Corporation’s operating lines and ships according to their reports.
Table 6-2. Estimates of Hazardous Waste Generated Per Week Onboard Cruise Ship Fleets
Holland America
Lines Fleet (11 Vessels)
Royal Caribbean Cruises Ltd Fleet
(17 vessels) Waste Type Amount Generated
in 2000 Amount Generated
in 1999 Photo wastes 2262 gallons/week 1300 gallons/week
Discarded and expired chemicals 1735 lbs/week 2050 lbs/week
Medical Waste 45 lbs/week 80 lbs/week
Batteries 75 lbs/week 580 lbs/week1
Fluorescent Lights 153 lbs/week 270 lbs/week
Explosives 6 lbs/week 12 lbs/week
Spent paints and thinners 213 gallons/week 225 gallons/week
Source: The information above is the hazardous waste production per week by Holland America Lines Fleet, as reported in their 2000 Environmental Report (ADEC, 2002), and by Royal Caribbean Cruises Ltd as reported in their 1999 Environmental Report “Save the Waves” (Royal Caribbean Cruises Ltd, 1999). 1 Total amount of batteries includes alkaline/carbon zinc, alkaline/mercury, lead acid, NiCad, mercury, and lithium.
6-3

December 29, 2008
Table 6-3. Estimates of Hazardous Waste and Solid Waste Generated Onboard as Reported by Carnival Cruise Lines
Parameter 2006 Measurement 2005 Measurement Notes
Solid and Hazardous Waste (to shore)
0.0066 tonnes/ALBD 0.0077 tonnes/ALBD (1) and (2)
Solid Waste (to sea or incinerated)
0.0079 tonnes/ALBD 0.0083 tonnes/ALBD (1) and (2)
Source: Carnival Corporation & PLC, Environmental Management Report, Fiscal Year 2006 NOTES: 1. Rather than refer to measurements as Passenger Berth Days to normalize data by ship size/capacity,
the more commonly referenced cruise industry indicator ALBD (Available Lower Berth Day) is used to normalize data by ship size/capacity.
2. This parameter measures solid and hazardous waste disposal normalized by ALBD. Hazardous waste disposal is normally less than 1% of total waste disposal. Hazardous waste is landed to shore facilities. There are three methods for solid waste, namely disposal ashore, at sea, or incinerated waste. According to Carnival Cruise Lines, the “at sea” or “incinerated waste” is discharged/disposed in accordance with MARPOL and applicable laws and regulations; plastic is not disposed at sea. Incinerated waste includes dry garbage, food waste, and sludge.
In 2003, the California Environmental Protection Agency (Cal/EPA) convened a multi-agency Cruise Ship Environmental Task Force to evaluate the environmental practices and waste streams of large passenger vessels (cruise ships). After gathering information from the cruise industry, the Task Force prepared a report to the California legislature. Regarding hazardous waste implementation issues, the Task Force highlighted the differences between stationary hazardous waste generators operating in California, and cruise ships that can operate in California but also off-load hazardous waste in other states or countries. The Task Force stated that it would be impossible for inspectors to track the disposal path of all onboard-generated hazardous waste without the cooperation of the cruise line. While the Task Force did not recommend any specific additional requirements for cruise ships related to managing or tracking hazardous waste, they did suggest additional information gathering. The Task Force also said that after such information gathering, it may be necessary to promulgate regulations to clarify that cruise ships operating in California are subject to the state hazardous waste management requirements in the same manner as other hazardous waste generators. 6.2 What federal laws apply to hazardous waste on cruise ships? 6.2.1 Clean Water Act As noted earlier, the Clean Water Act (CWA) prohibits any person from discharging any pollutant from any point source into waters of the United States, except in compliance with a National Pollutant Discharge Elimination System (NPDES) permit or otherwise authorized under the Act. The term “point source” is defined to include a “vessel or other floating craft.” Under CWA section 502(12)(b), the requirement for an NPDES permit applies to the addition of any pollutant from any point source “other than a vessel or other floating craft” in the contiguous zone or the ocean, i.e., outside the territorial seas. Whether a discharge is authorized under an NPDES permit affects applicability of RCRA; dissolved and solid materials in industrial
6-4

December 29, 2008
discharges which are point sources subject to NPDES permits are not “solid waste” under the RCRA statute and thus not “hazardous waste.” This only applies to materials once they have been discharged. Prior to being discharged pursuant to an NPDES permit, wastes remain subject to RCRA if they are hazardous wastes. Section 311 of the CWA also prohibits the discharge of oil or hazardous substances into or upon the navigable waters of the United States, adjoining shorelines, or into or upon the waters of the contiguous zone, or in connection with activities under the Outer Continental Shelf Lands Act or the Deepwater Port Act, or which may affect natural resources belonging to, appertaining to, or under the exclusive management authority of the United States in such quantities as may be harmful, as determined by the President. In Executive Order Number 11735, the President delegated to EPA the authority to determine these quantities. EPA has identified the quantities that may be harmful for hazardous substances in regulations at 40 CFR 117 and for oil in regulations at 40 CFR 110. Section 311(b)(5) of the CWA also requires the person in charge of a vessel or an onshore facility or an offshore facility to, as soon as he has knowledge of any discharge of oil or a hazardous substance in violation of section 311, immediately notify the National Response Center of the discharge. 6.2.2 Resource Conservation and Recovery Act The Resource Conservation and Recovery Act (RCRA) imposes management requirements on generators, transporters, and persons who treat or dispose of hazardous waste. Cruise ships regularly use chemicals for operations ranging from routine maintenance such as cleaning and painting, to passenger services such as dry cleaning, beauty parlors, and photography labs. Thus, cruise ships or passenger service facilities within cruise ships may be subject to RCRA requirements. Issues the cruise ship industry may face relating to RCRA include ensuring the hazardous waste identification is made at the point at which a hazardous waste is considered generated; ensuring that parties are properly identified as generators, storers, treaters, or disposers; and determining the applicability of RCRA requirements to these parties. RCRA (42 U.S.C. §§ 6901 et seq.) is the federal law that, among other things, defines and regulates solid waste and hazardous waste. RCRA is designed to minimize the hazards of waste disposal; conserve resources through waste recycling, recovery, and reduction; and ensure waste management practices that are protective of human health and the environment. In order to achieve these goals, RCRA established a Solid Waste Program (RCRA Subtitle D) and a Hazardous Waste Program (RCRA Subtitle C).1 Subtitle C of RCRA establishes a hazardous waste management system that controls hazardous waste from the point of generation until ultimate disposal, also referred to as a “cradle-to-grave” program. As part of this program, RCRA Subtitle C regulates hazardous waste generators. The owner or operator of a cruise ship may be a “generator” of hazardous waste. EPA regulation (40 CFR 260.10) defines a generator to mean any person, by site, whose act or process produces hazardous waste, or whose act first causes a hazardous waste to become subject to regulation.
1 In states with hazardous waste programs authorized by EPA, the authorized state hazardous waste program operates in lieu of the federal hazardous waste program. Some states have authorized hazardous waste programs that are more stringent than the federal hazardous waste program.
6-5

December 29, 2008
As stated previously, the RCRA regulations contain criteria for identifying whether a solid waste is a hazardous waste (40 CFR 261, Subparts C and D). There are two basic ways a waste is defined as hazardous under RCRA -- it is either a waste that appears on one of the four hazardous waste lists (i.e., F-List, K-List, P-List, or U-List), or the waste exhibits at least one of four hazardous characteristics (ignitability, corrosivity, reactivity, or toxicity). EPA’s RCRA regulations at 40 CFR 262.11 require that any person who produces or generates a waste must determine if that waste is hazardous. Once a waste is identified as a hazardous waste, any person who generates or manages the hazardous waste must comply with all applicable federal regulations regarding its handling and management. Hazardous waste generators are regulated based on the amount of hazardous waste produced each month. Table 6-4 shows that generators are divided into three categories: large quantity generators (LQGs); small quantity generators (SQGs); and conditionally exempt small quantity generators (CESQGs). LQGs are facilities that generate greater than or equal to 1,000 kg of hazardous waste per month, greater than 1 kg of acutely hazardous waste per month (i.e., any waste denoted with the hazard code “H” and all P-listed wastes), or greater than 100 kg of acute spill residue or soil per month (i.e., soil, waste, or debris resulting from the cleanup of an acute hazardous waste spill). SQGs are facilities that generate between 100 kg and 1,000 kg of hazardous waste per month. CESQGs are subject to significantly reduced requirements for managing hazardous waste. Generators are classified as CESQGs if they generate 100 kg of hazardous waste per month. If the hazardous waste being generated is acutely hazardous waste (a more stringently-regulated category of hazardous waste), then a generator is a CESQG provided they generate 1 kg of acutely hazardous waste per month. In situations where the waste being generated is residue, waste, or contaminated soil or debris from cleaning up a spill of acutely hazardous waste, a generator is a CESQG provided they generate 100 kg of this spill residue. Generator status is determined on a monthly basis, so it is possible for a generator’s (e.g., a cruise ship) status to change from one month to the next, depending upon waste generation during that period. If a generator’s status does change, the generator is required to comply with the applicable regulatory requirements for that class of generators for the hazardous waste generated in that particular month. For example, if a generator has reached LQG status in a particular month, then biennial reporting is required, and all other regulatory requirements applicable to large quantity generators will apply to the waste generated in that month. Accurate counting of the waste is critical, because the regulations are specific to each generator type. EPA regulations (40 CFR 261.5(c) and (d)) specify the types of hazardous wastes that must be included in a generator's monthly count. EPA regulation (40 CFR 262.34) specifies the threshold quantities for LQGs and SQGs and includes limits on the amount of time hazardous waste may be accumulated on site before being sent offsite for further management (e.g., treatment, recycling, disposal, etc.). EPA regulation (40 CFR 261.5) also specifies threshold quantities for CESQGs, as shown in Table 6-4. There is no accumulation time limit for CESQGs. According to the Congressional Research Service (2007), the generator classification assigned to individual cruise ships is often unclear. However, once a cruise ship has determined its appropriate generator classification, the cruise ship must follow the appropriate accumulation requirements.
6-6

December 29, 2008
Table 6-4. Classification System and Accumulation Limits for Hazardous Waste Generators
Source: U.S. Environmental Protection Agency, 2005
Classification of
Generator
Amount of Hazardous
Waste Generated Per Month
Amount of Acutely
Hazardous Waste
Generated Per Month
Amount of Acute Spill
Residue Generated Per Month
On-site Accumulation
Time
On-site Quantity Limit
Large Quantity Generators
≥ 1000 kg > 1 kg > 100 kg ≤ 90 days on site
No Limit
Small Quantity Generators
100 kg < 1000 kg
N/A N/A ≤ 180 days on site or ≤ 270 days if shipped 200 miles or more
6,000 kg
Conditionally Exempt Small Quantity Generators
≤ 100 kg ≤ 1 kg ≤ 100 kg N/A 1,000 kg 1kg acute 100 kg residue
Any individual cruise ship that is identified as a large or small generator (i.e., LQG or SQG) is required to have a “Cruise Ship Identification Number” to identify both the type and quantity of hazardous waste onboard (40 CFR 262.12); comply with the manifest system (40 CFR 262, Subpart B); handle wastes properly before shipment (40 CFR 262, Subpart C); and comply with record-keeping and reporting requirements (40 CFR 262, Subpart D). The identification number is used to identify a generator and to track waste activities, as well as to provide increased coordination between the Coast Guard, EPA, and states. The number remains with a vessel, and is used on all hazardous waste manifests, regardless of where the waste is off-loaded in the United States. Upon off-loading hazardous waste, the cruise ship must comply with that particular off-loading state’s RCRA requirements, whether or not that state assigned the ID number. The Hazardous Waste Manifest System is a set of forms, reports, and procedures designed to track hazardous waste from the time it leaves the generator where it was produced, until it reaches the off-site waste facility that will store, treat, or dispose of the hazardous waste (for more information on the Hazardous Waste Manifest System, see http://www.epa.gov/epaoswer/hazwaste/gener/manifest/). The system enables waste generators to verify that their waste has been properly delivered, and that no waste has been lost or unaccounted for in the process (40 CFR 262, Subpart B). EPA’s RCRA regulations (40 CFR 273) also specify that a number of the hazardous wastes generated aboard cruise ships may be treated as Universal Wastes under the Universal Waste Program. The Universal Waste Program was developed under RCRA to streamline collection requirements for certain widely-generated hazardous wastes to promote waste recycling, and to ease the regulatory burden associated with handling, transportation, and collection. Waste considered to be “widely-generated” includes batteries, pesticides, mercury-containing
6-7

December 29, 2008
equipment, and lamps with hazardous components (e.g., fluorescent, metal halide, and high pressure sodium). The Universal Waste Rule allows a facility (e.g., a cruise ship) additional time for these wastes to accumulate for recycling or disposal and thereby streamlines requirements related to hazardous waste notification, labeling, marking, employee training, responses to releases, offsite shipments, tracking, exports, and transportation. 6.2.3 The Comprehensive Environmental Response, Compensation, and Liability Act The Comprehensive Environmental Response, Compensation, and Liability Act (CERCLA; U.S.C. § 9601 et seq.) regulates the release of “hazardous substances” of which RCRA hazardous wastes are a sub-set. CERCLA provides that any person in charge of a vessel or an offshore or an onshore facility shall, as soon as he has knowledge of any release (other than a “federally permitted release”) of a hazardous substance from such vessel or facility in quantities equal to or greater than those determined pursuant to CERCLA section 9602, immediately notify the National Response Center of such release. The National Response Center conveys the notification expeditiously to all appropriate government agencies. While the universe of CERCLA hazardous substances is larger than RCRA hazardous wastes (see 40 CFR 302.4 for the complete list of CERCLA hazardous substances), all RCRA hazardous wastes are by definition CERCLA hazardous substances. Therefore, in addition to the RCRA “cradle-to-grave” requirements summarized elsewhere in this section, releases of RCRA hazardous waste in amounts above the regulatory threshold are subject to reporting as a CERCLA hazardous substance unless exempted as a federally permitted release. 6.2.4 National Marine Sanctuaries Act The National Marine Sanctuaries Act (NMSA; 16 U.S.C. § 1431 et seq.), as amended, established a national program to designate certain areas of marine environments as areas of special national significance that warrant heightened care. The primary purpose of the law is to protect marine resources and ecosystems, such as coral reefs, sunken historical vessels, or unique habitats, from degradation while facilitating public or private uses compatible with resource protection. NMSA authorizes the National Oceanic and Atmospheric Administration (NOAA) to designate as National Marine Sanctuaries areas of the marine environment that have special aesthetic, ecological, historical, or recreational qualities, and to provide comprehensive and coordinated conservation management for such areas. The National Marine Sanctuary Program manages 13 sanctuaries and the Papahānaumokuākea Marine National Monument (together referred to as “sites”). Designated sites are managed according to site-specific management plans developed by NOAA that typically prohibit by regulation the discharge or deposit of most material. Under NOAA’s implementing regulations for NMSA, discharging hazardous waste is prohibited at all sites except for the Thunder Bay and the Hawaiian Islands Humpback Whale National Marine Sanctuaries, where such discharges are prohibited under other legislation or regulation.
6-8

December 29, 2008
6.3 What practices are available to manage hazardous wastes generated on cruise ships? Among the previously noted Cruise Lines International Association (CLIA) environmental standards, those applicable to hazardous wastes consist of programs for waste minimization, waste reuse and recycling, and waste stream management for incorporation into the Safety Management Systems (see Section 1.5). Specifically, a 2006 update to the CLIA environmental standards describes revised practices and procedures for the management of the following: photo processing wastes, including x-ray development fluid wastes; dry-cleaning waste fluids and contaminated materials; print shop waste fluids; photo copying and laser printer cartridges; unused and outdated pharmaceuticals; spent fluorescent and mercury vapor lamp bulbs; spent batteries; and minimizing the generation and avoiding the hazardous contamination of incinerator ash (CLIA, 2006). According to California’s Cruise Ship Environmental Task Force (2003), the information that CLIA and individual cruise ships reported regarding hazardous waste treatment onboard consists of the following:
Incineration/burning of used oil, oily sludge, medical and bio-hazardous waste, and outdated pharmaceuticals;
Aerosol can crushing and the collection of liquids from the aerosol cans; Silver recovery from photo and x-ray processing; Crushing and sieving of spent fluorescent and mercury vapor bulbs; and Separation of oil and water mixtures.
In some cases, the cruise ship industry is installing new technologies and design features to minimize hazardous waste generation (ADEC, 2000):
Effective and efficient digital photo technology to reduce hazardous waste stream generation during photo processing;
Use of non-toxic printing ink and non-chlorinated solvents and other non-hazardous products to eliminate hazardous wastes in print shops; and
Alternative dry cleaning processes such as CO2 and wet (i.e., a water-based alternative to dry cleaning) processes.
According to the CLIA environmental standards, member lines have agreed to reduce the production of incinerator ash by minimizing the generation of waste and maximizing recycling opportunities. CLIA further notes that incorporating waste stream segregation practices should prevent the introduction of hazardous materials to the incinerator, thereby directing the use of onboard incinerators primarily for food waste, contaminated cardboard, some plastics, trash, and wood. According to the CLIA environmental standards, non-hazardous ash is disposed of at sea in accordance with MARPOL Annex V. If any ash is identified as being hazardous, it is disposed ashore in accordance with RCRA. The CLIA environmental standards provide for testing of incinerator ash at least once quarterly for the first year of operation (in order to establish a baseline), and subsequent annual testing. (CLIA, 2006). Cruise ships are also directing efforts to hazardous waste collection and storage prior to off-loading for disposal ashore. For hazardous materials that cannot be re-used and/or recycled, the
6-9

December 29, 2008
CLIA environmental standards provide that hazardous waste is to be collected and stored onboard, then landed ashore for disposal in accordance with RCRA requirements or other applicable laws and regulations (CLIA, 2006). The GAO Report (2000) states that officials of some of the larger cruise ship companies reported that hazardous waste from photo labs, dry cleaning operations, and other sources are collected, stored in separate locked rooms, and off-loaded in port. Based on several ship board visits accompanied by Coast Guard inspectors and/or cruise ship company officials, GAO observed locked storage areas for hazardous chemicals, reviewed procedures for handling hazardous waste, and in some instances observed the equipment for collecting hazardous wastes from photo processing and dry cleaning operations (U.S. General Accounting Office, 2000). Ultimately, when considering the means by which to dispose of the hazardous wastes, the local port infrastructure, availability of services providers, and the quality of disposal facilities are critical.
Additional wastes stored until offloaded ashore for proper disposal are used fuel/oil filters. The Task Force reported that cruise lines have indicated that “fuel oil from cruise ships’ bunker tanks is run through filters and mechanical separators to remove sludge and water. The used filters are supposed to be disposed of in a hazardous waste dump.” Cruise lines further indicated that the engine lubrication system uses oil filters to screen out particulate matter, with the treatment of the used oil filters to be the same as that for the fuel filters just mentioned (Cruise Ship Environmental Task Force, 2003). 6.4 What are the potential environmental impacts associated with hazardous waste from
cruise ships? Although the quantities of hazardous waste generated on cruise ships are small, their toxicity to sensitive marine organisms can be significant (CRS, 2007). The environmental effects of a hazardous waste release would depend on the chemical and toxicological characteristics of the particular waste released. Although the Cruise Ship Environmental Task Force stated in its 2003 report that they were unaware of any studies conducted on the environmental effects from the illegal discharge of hazardous waste, it could be assumed that the environmental impacts of such a release in port areas would have a far greater impact to the environment than a release far from shore where dilution effects are more efficient (Cruise Ship Environmental Task Force, 2003). There are a number of possible hazardous waste streams produced on cruise ships, including perchloroethylene, silver, mercury, hydrocarbons, heavy metals, and corrosives, that could enter the environment and cause harm if not appropriately managed as required under RCRA. When hazardous waste generated aboard cruise ships is properly identified, stored, and treated and/or disposed onshore, the risk posed to the marine environment is normally minimized. Hazardous wastes should be properly stored and segregated from other wastes where required by law (e.g., incompatible hazardous wastes cannot be stored together) and where necessary to ensure proper management. When considering the incineration of waste, the generation and/or discharge of incinerator ash meeting the hazardous waste characteristics can be reduced, if not prevented, through a rigorous program of waste segregation, including education, and periodic ash testing. To ensure hazardous waste is handled and disposed of properly, adequate operational procedures and employee training and, in some instances, passenger training (e.g.,
6-10

December 29, 2008
clear demarcation of the proper locations for the onboard discard of materials that may be hazardous) is necessary. After three years of sampling and analysis, ADEC (2002) determined that sewage and graywater waste streams are not used for hazardous waste disposal and that cruise ships screen for hazardous waste prior to incineration. If passenger and crew education efforts regarding waste management and waste segregation are not effective, waste materials that are hazardous (or otherwise contain hazardous constituents) may be comingled and then incinerated with solid wastes, and in some cases, cause the resulting incinerator ash to be hazardous. The IMO guidelines for Annex V implementation recognize the potential for air pollution associated with incinerator use, and therefore discourage the use of incinerators in ports in or near urban areas (Annex V, Appendix B, Section 5.4). The guidelines further recognize that some disadvantages of incinerators may include the hazardous nature of the ash or vapor, and that when in use, incinerators may not meet air pollution regulations imposed in certain harbors (Annex V, Appendix B, Section 5.4.5). The incineration of plastics requires special precautions due to the potential environmental and health effects from the combustion of by-products. In these cases, the guidelines suggest that the incineration of plastic wastes complying with Annex V are to take place in a safe manner with an incinerator suitable for the incineration of plastics, otherwise the following problems can result:
Depending on the type of plastic and conditions of combustion, some toxic gases can be generated in the exhaust stream, including vaporized hydrochloric and hydrocyanic acids. These and other intermediary products of plastic combustion can be extremely dangerous (Annex V, Appendix B, Section 5.4.6.1).
The ash from the combustion of some plastic products may contain heavy metal or other residues which can be toxic and should therefore not be discharged into the sea (Annex V, Appendix B, Section 5.4.6.2).
Further, the Parliamentary Commission for the Environment (2003) states that a cruise ship solid waste incinerator may produce small amounts of polychlorinated biphenyls and polycyclic aromatic hydrocarbons. 6.5 What action is the federal government taking to address hazardous waste from
cruise ships?
EPA has brought multiple enforcement actions against cruise ship operators for illegal discharges of hazardous substances and other pollutants to ensure that cruise ships comply with these requirements through environmental management systems developed as conditions of probation in criminal plea agreements. EPA and states have worked together to develop a system whereby an EPA hazardous waste identification (ID) number is assigned to every cruise ship (U.S. Environmental Protection Agency, 2001). Previously, cruise ships were receiving different numbers from a variety of states upon off-loading hazardous waste. As a result, cruise ships were receiving multiple identification numbers and creating multiple copies of hazardous waste management records. Implementation of this 2001 policy has enabled individual cruise ships to be assigned a single
6-11

December 29, 2008
EPA hazardous waste identification number for the purposes of identification as a generator of hazardous waste under the Resource Conservation and Recovery Act. Under the 2001 policy, the following procedures apply:
a) A cruise ship determines its American-based home port state (the state in which it has corporate offices or its main port of call). b) After determining the home port state, the cruise line notifies the selected state or corresponding EPA regional office of its hazardous waste activities. c) The cruise ship identifies its hazardous waste generator size in accordance with 40 CFR 261.5(c). d) The home port state or EPA regional office issues a hazardous waste identification number for the cruise ship. The number reflects the home port state initials and ten alphanumeric characters.
After the identification number is assigned, that number remains with the ship, and is used for all hazardous waste manifests, regardless of where the waste is off-loaded in the United States. The assignment of the EPA ID number does not affect the applicability of state-specific RCRA requirements; cruise ships must still comply with each state’s RCRA requirements when off-loading hazardous waste, regardless of which state assigned the ID number. The ship must provide records to the relevant individual off-loading state, as required by that state’s laws. The National Park Service (NPS) manages cruise ship waste streams indirectly in Glacier Bay National Park through competitively awarded concession contracts. The NPS has jurisdiction over the submerged lands and marine waters of Glacier Bay National Park up to 3 miles from the mean high tide line and including all of Glacier Bay proper. Glacier Bay is a well known, very popular attraction for the cruise ship industry in Alaska. Recent environmental reviews and decisions allow up to two cruise ship entries per day into Glacier Bay proper during the primary visitor season. Cruise ship operations in the park are authorized under concession contracts, which are awarded under a competitive solicitation and prospectus process. Impact on park resources is a general standard selection criterion for park concessions. The NPS uses waste stream management as one of a number of selection criteria in this regard. In the past, cruise ship operators have usually proposed to minimize the impact of waste streams by committing to a no-discharge policy while in the park (even when discharge is legal under applicable law) for sewage, graywater, ballast water, bilge water, cooling water, hazardous waste, and solid waste. If awarded a contract, companies must comply with their proposal. Typically cruise ships operate in the park for 8-10 hours and then depart. Cruise ships do not dock or transfer any wastes to shore while in the park. 6.6 Possible Options and Alternatives to Address Hazardous Waste from Cruise Ships Based on the public comments received on the draft of this report as well as other information gathered, listed below are a wide range of options and alternatives that address hazardous waste from cruise ships. Identification of any particular option does not imply any EPA recommendation or preference for future action, or that EPA has determined that any of these options are necessary or feasible, or that EPA believes a change to the status quo is warranted, or that EPA or any other entity has the legal authority to implement that option.
6-12

December 29, 2008
Prevention & Reduction
Establish standards or best management practices for operation, maintenance, and/or training that will decrease the contaminants in hazardous wastes and/or the volume of hazardous waste on cruise ships.
Resolve issues that may be impeding safe waste storage and expanded use of incinerators. Foster cruise ship industry hazardous waste minimization programs. Provide education and outreach to the cruise industry regarding hazardous waste
generator requirements, including requirements to: o identify treatment activities, o report the locations where treatment takes place, and o obtain the appropriate hazardous waste permits or authorizations if cruise ships
operate treatment units within certain state waters. Post waste segregation requirements, as well as the legal and environmental concerns,
onboard cruise ships via placards and written information for employees and passengers. Conduct research on the effects of air quality as a result of incinerating hazardous wastes
and materials aboard cruise ships. Conduct research to determine the presence of hazardous wastes (other than oil) entering
the bilge that will eventually be discharged, given that present treatment processes target oil.
Control: Discharge Standards
Review provisions of state laws -- in states with cruise ship port calls -- as they pertain to the CWA and RCRA to ascertain whether more stringent state provisions should be enacted.
Ensure that the handling and disposal of batteries, special chemicals, etc., are done in accordance with state solid waste regulations.
Expand training for employees regarding waste segregation requirements by including the legal and environmental reasons for those requirements.
Establish industry practice of regular standardized ash testing before sea disposal.
Control: Geographic Restrictions on Discharge EPA should begin a rulemaking to prohibit the discharge of any hazardous materials or
materials with hazardous characteristics into U.S. waters out to the 200-mile Exclusive Economic Zone.
Expand port reception facilities to accept hazardous waste. Prohibit incinerating hazardous waste while in port.
Enforcement & Compliance Assurance: Monitoring
Establish a requirement for a full accounting of hazardous waste disposal. Establish a mandatory incinerator ash testing program to determine whether each batch of
incinerator ash is hazardous and proceed with disposal accordingly. Develop a means to track the path of all onboard generated hazardous wastes for all states
and foreign ports.
6-13

December 29, 2008
Enforcement & Compliance Assurance: Reporting Include in the mandatory incinerator ash testing program maintenance of a certified log
book documenting test results, dates, volumes, and ultimate disposition of ash (based on hazardous waste determination).
Enforcement & Compliance Assurance: Inspections & Enforcement
Clarify that the cruise industry is subject to hazardous waste generator requirements and inspections by Certified Unified Program Agencies and the Department of Toxic Substances Control at ports where cruise ships take on or discharge passengers.
Increase inspections and inspection requirements on cruise ships that received a permit to treat hazardous waste where these permits may exist.
Increase inspections of authorized hazardous waste facilities that receive cruise ship hazardous wastes.
Establish a funding mechanism based on the polluter-pays model that will provide revenues to develop and implement a comprehensive regulatory scheme specific to cruise ships.
Impose uniform requirements on all ships as a condition of port entry and within waters under the jurisdiction of the United States consistent with international law, regardless of flag state.
Expand Coast Guard inspections for environmental compliance to include pollution prevention equipment and practices for hazardous waste management.
Establish a coordinated inspection program by the Department of Toxic Substances Control or Certified Unified Program Agencies, along with Coast Guard, to enforce generator reporting to promote cruise ships’ accountability for all off-loaded hazardous wastes, to deter illegal disposal, and to identify if additional regulations are required to address offshore management of hazardous wastes.
Prohibit or otherwise restrict noncompliant vessels (and sister ships, depending on the degree of involvement by parent companies) from operating in sensitive areas of the marine environment under U.S. jurisdiction.
6-14

December 29, 2008
6-15
References Alaska Department of Environmental Conservation (ADEC). 2000. Alaska Cruise Ship Initiative
Part 1 Final Report. Juneau, AK. (www.dec.state.ak.us/water/cruise_ships/pdfs/finreportp10808.pdf)
Alaska Department of Environmental Conservation (ADEC). 2002. The Impact of Cruise Ship
Wastewater Discharge on Alaska Waters. Juneau, AK. (www.dec.state.ak.us/water/cruise_ships/pdfs/impactofcruiseship.pdf)
Carnival Corporation & PLC. 2006. Environmental Management Report: Fiscal Year 2006.
(http://phx.corporate-ir.net/phoenix.zhtml?c=140690&p=irol-hess) Congressional Research Service (CRS). 2007. Cruise Ship Pollution: Background, Laws and
Regulations, and Key Issues (Order Code RL32450). Washington, DC. (www.ncseonline.org/NLE/CRSreports/07Jul/RL32450.pdf)
Cruise Lines International Association (CLIA). 2006. CLIA Industry Standard: Cruise Industry
Waste Management Practices and Procedures. Fort Lauderdale, FL. (www.cruising.org/industry/PDF/CLIAWasteManagementAttachment.pdf and www.cruising.org/industry/PDF/CLIAWasteManagement.pdf)
Cruise Ship Environmental Task Force. 2003. Report to the Legislature: Regulation of Large
Passenger Vessels in California. (http://www.swrcb.ca.gov/publications_forms/publications/legislative/docs/2003/cruiseshiplegrpt.pdf)
Royal Caribbean Cruises Ltd. 1999. Save the Waves. Environmental Report. U.S. Environmental Protection Agency. 2001. Memorandum: Cruise Ship Identification
Numbers and State Required Annual Reporting Components. Washington, DC. (www.epa.gov/osw/meeting/pdf02/cruise.pdf)
U.S. Environmental Protection Agency. 2005. Introduction to Generators (40 CFR Part 262)
(EPA530-K-05-011). Washington, DC. (http://www.epa.gov/epaoswer/hotline/training/gen05.pdf)
U.S. General Accounting Office (GAO) (now the Government Accountability Office). 2000.
Marine Pollution: Progress Made to Reduce Marine Pollution by Cruise Ships, but Important Issues Remain. Report to Congressional Requesters. GAO/RCED-00-48.

Appendix A. List of Acronyms ACSI . . . . . . . . . . . Alaska Cruise Ship Initiative ADEC . . . . . . . . . . . Alaska Department of Environmental Conservation ALBD . . . . . . . . . . . Available Lower Berth Day APPS . . . . . . . . . . . Act to Prevent Pollution from Ships AWT . . . . . . . . . . . Advanced Wastewater Treatment AWTs . . . . . . . . . . . Advanced Wastewater Treatment systems BOD . . . . . . . . . . . . biological oxygen demand Cal/EPA . . . . . . . . . California Environmental Protection Agency CCC . . . . . . . . . . . . criterion continuous concentration CELB . . . . . . . . . . . Center for Environmental Leadership in Business CERCLA . . . . . . . . Comprehensive Environmental Response, Compensation, and Liability Act CESQG . . . . . . . . . conditionally exempt small quantity generator CFR . . . . . . . . . . . . Code of Federal Regulations C.L. . . . . . . . . . . . . Confidence Limit CLIA . . . . . . . . . . . Cruise Lines International Association CMC . . . . . . . . . . . criteria maximum concentration COA . . . . . . . . . . . . Certificate of Adequacy COTP . . . . . . . . . . . Captain of the Port CWA . . . . . . . . . . . Clean Water Act CRS . . . . . . . . . . Congressional Research Service DAF . . . . . . . . . . dissolved air flotation
7-1

DOC . . . . . . . . . . Document of Compliance EPA . . . . . . . . . . U.S. Environmental Protection Agency EEZ . . . . . . . . . . U.S. Exclusive Economic Zone FR . . . . . . . . . . Federal Register gal/day/pers . . . . . gallons per day per person GAO . . . . . . . . . . U.S. General Accounting Office (now the U.S. Government
Accountability Office) HEM . . . . . . . . . hexane extractable material ICCL . . . . . . . . . International Council of Cruise Lines IFO . . . . . . . . . . intermediate fuel oil IMO . . . . . . . . . . . . International Maritime Organization ISM . . . . . . . . . . . . International Safety Management ISPPC . . . . . . . . . . . International Sewage Pollution Prevention Certificate LQG . . . . . . . . . . . . large quantity generator MARPOL . . . . . . . . . International Convention for the Prevention of Pollution from
Ships (MARPOL 73/78) MBR . . . . . . . . . . . Membrane Bioreactor MEPC . . . . . . . . . . Marine Environment Protection Committee MPN . . . . . . . . . . . . most probable number MPRSA . . . . . . . . . Marine Protection, Research, and Sanctuaries Act MSD . . . . . . . . . . . . marine sanitation device NC . . . . . . . . . . . . . not collected ND . . . . . . . . . . . . . not detected NDZ . . . . . . . . . . . . no-discharge zone
7-2

NH3 . . . . . . . . . . . . unionized ammonia NH4
+ . . . . . . . . . . . . ionized ammonia nm . . . . . . . . . . . . . nautical mile NMSA . . . . . . . . . . National Marine Sanctuaries Act NOAA . . . . . . . . . . National Oceanic and Atmospheric Administration NOx . . . . . . . . . . . . nitrous oxide NPS . . . . . . . . . . . . National Park Service NPDES . . . . . . . . . . National Pollutant Discharge Elimination System NR . . . . . . . . . . . . . not recorded NRC . . . . . . . . . . . . National Research Council NRWQC . . . . . . . . . National Recommended Water Quality Criteria OECD . . . . . . . . . . Organization for Economic Co-operation and Development OPA . . . . . . . . . . . . Oil Pollution Act of 1990 OWS . . . . . . . . . . . . Oily Water Separator PAH . . . . . . . . . . . . polycyclic aromatic hydrocarbon POTWs . . . . . . . . . . publicly owned treatment works ppm . . . . . . . . . . . . parts per million Pub. L. . . . . . . . Public Law RCRA . . . . . . . . Resource Conservation and Recovery Act RCCL . . . . . . . . . . . Royal Caribbean Cruises Ltd. SMS . . . . . . . . . . . . Safety Management System SOLAS . . . . . . . . . . International Convention for the Safety of Life at Sea SQG . . . . . . . . . . . . small quantity generator
7-3

TOC . . . . . . . . . . . . total organic carbon U.S. . . . . . . . . . . . . United States USCG . . . . . . . . . . . United States Coast Guard UV . . . . . . . . . . . . . ultraviolet U.S.C. . . . . . . . . . . United States Code VGP . . . . . . . . . . . . Vessel General Permit WHO . . . . . . . . . . . World Health Organization
7-4

7-5
Appendix B. State Efforts to Address Discharges from Cruise Ships The Cruise Ship Discharge Assessment Report (Assessment Report) presents on-going actions by the federal government to address five primary waste streams from cruise ships (sewage, graywater, oily bilge water, solid waste, and hazardous waste). Based on the public comments received on the draft of the report, as well as other information gathered, a wide range of options and alternatives is listed for each abovementioned waste stream. Identification of any particular option does not imply EPA recommendation or preference for future action, or that EPA has determined that any of these options are necessary or feasible, or that EPA believes a change to the status quo is warranted, or that EPA or any other entity has the legal authority to implement that option. Nevertheless, the range of options and alternatives presented in this Assessment Report may be useful to government entities such as state, local, and tribal entities that are interested in addressing cruise ship waste streams.
There are a number of states (Alaska, California, Florida, Hawaii, Maine, and Washington), as well as Native American Tribes, that have on-going efforts to address the frequency of cruise ship traffic and the range of issues associated with discharges from these vessels. Some states have taken action independent of federal requirements by passing legislation controlling cruise ship discharges, creating industry partnership programs under which cruise lines voluntarily adopt certain environmental practices, and/or establishing No Discharge Zones where the discharge of sewage from vessels (whether treated or not) is prohibited. Listed below are some links to access current state efforts.
State
General Information Regarding Cruise Ship Efforts
Connecticut http://www.ctcruiseship.com/
http://www.dep.state.fl.us/secretary/news/2000/00-MOUcruise.htm Florida http://www.dep.state.fl.us/water/wastewater/vessel.htm
http://www.co.maui.hi.us/index.asp?NID=631 http://healthuser.hawaii.gov/health/about/pr/2003/03-94epo.html
Hawaii
http://www.epa.gov/owow/oceans/cruise_ships/hawaiimou.pdf
http://www.state.me.us/dep/blwq/topic/vessel/cruiseship/rule/history.htm http://www.state.me.us/dep/blwq/topic/vessel/LCPV/index.htm
Maine
http://www.barharbormaine.gov/xhtml/171/Permalink/363/
Washington http://www.ecy.wa.gov/programs/wq/wastewater/cruise_mou/index.html

December 29, 2008 EPA842-R-07-005


