07 Gillanders FISH 97(4) - spo.nmfs.noaa.govGillanders et al.: Aging methods for Seriola lalandi 813...
16
812 Aging methods for yellowtail kingfish, Seriola lalandi, and results from age- and size-based growth models Bronwyn M. Gillanders NSW Fisheries Research Institute PO Box 21, Cronulla, NSW 2230, Australia Present address: School of Biological Sciences A08 University of Sydney New South Wales 2006, Australia E-mail address: [email protected] Douglas J. Ferrell Neil L. Andrew NSW Fisheries Research Institute PO Box 21 Cronulla, New South Wales 2230, Australia Manuscript accepted 9 December 1998. Fish. Bull. 97:812–827 (1999). Abstract.–Dorsal spines, otoliths, scales, and vertebrae collected from yellowtail kingfish (Seriola lalandi) in NSW, Australia, were assessed for use- fulness in estimating age. Legibility of growth zones, the time scale at which zones form, and precision of age esti- mates were evaluated for fish sizes from 323 to 1090 mm FL. All calcified structures contained growth zones, but dorsal spines were unsuitable for age determination because it was likely that early growth zones were lost. From marginal increment analysis, it ap- peared that one zone was laid down per year for otoliths and possibly scales, but a clear pattern was not found for ver- tebrae. Although exact agreement be- tween repeated age readings was rela- tively low (50–66%), agreement within one zone was higher (92–96%) and scales provided the most precise read- ings. Precision decreased with increas- ing age of fish. Growth curves derived from otoliths and scales were similar for all ages except fish from the first age class; those derived from otoliths and vertebrae were similar for all fish with less than eight growth zones. Al- though statistical differences were found between the growth curves of scales and vertebrae for some age classes, with the exception of the first age class these differences were not bio- logically important. Growth rates esti- mated from length-frequency (age- based) and mark-recapture (length- based) data compared favorably with those estimated from calcified aging structures. Otoliths, scales, and verte- brae all showed promise as structures for aging kingfish, but further work is needed to determine the position of the first zone and to validate estimates for all age classes. Until such work is com- pleted, we recommend that scales and either otoliths or vertebrae be used for aging kingfish. 1 Penney, A. J. 1992. Sea Fisheries Re- search Institute, Private Bag X2, Rogge Bay 8012, South Africa. Personal commun. Yellowtail kingfish, Seriola lalandi, is a popular recreational species and supports significant commercial fisheries throughout temperate re- gions of the world. In Australia, the major commercial fishery for yel- lowtail kingfish is in New South Wales where 400–600 tonnes are caught per year. Despite the exist- ence of a commercial fishery and persistent controversy about exploi- tation of the species, very little is known about its biology. For future management of the fishery and for stock assessment purposes, informa- tion on age and growth is needed. Estimates of age of Seriola spp. have been derived from a variety of methods and structures, reflecting the difficulty of aging Seriola and other pelagic species. The Japanese species (Seriola quinqueradiata) is the most studied species in the ge- nus because of its importance in aquaculture. Studies in the 1950s used scales, vertebrae, and opercu- lar bones for aging (e.g. Mitani, 1955, 1958; Mitani and Sato, 1959). More recent studies have focused on the use of vertebrae (e.g. Munekiyo et al . , 1982; Murayama, 1992). Scales have also been used to age S. lalandi (formerly S. dorsalis, Baxter, 1960), as have otoliths (Penney 1 ). Recently, sectioned oto- liths were used to determine ages of Seriola dumerili, although it was acknowledged that age and growth determinations were difficult (Man- ooch and Potts, 1997). Despite the use of a variety of structures for ag- ing Seriola spp., there has been no comparative analysis to determine which structure provides the most reliable estimates. In addition, most studies have assumed that growth zones are annual and there have been few validations of age estimates (but see Mitani and Sato, 1959; Baxter, 1960). The specific objectives of this study were 1) to assess the useful- ness of several structures (scales, otoliths, dorsal spines, and verte- brae) for determining the age of kingfish, 2) to compare multiple age estimates for different structures in order to determine the most precise method for determining age and growth parameters, 3) to provide information on size-at-age and 4) to compare growth rates obtained
Transcript of 07 Gillanders FISH 97(4) - spo.nmfs.noaa.govGillanders et al.: Aging methods for Seriola lalandi 813...

812
Aging methods for yellowtail kingfish,Seriola lalandi, and results fromage- and size-based growth models
Bronwyn M. GillandersNSW Fisheries Research InstitutePO Box 21, Cronulla, NSW 2230, AustraliaPresent address: School of Biological Sciences A08
University of SydneyNew South Wales 2006, Australia
E-mail address: [email protected]
Douglas J. Ferrell
Neil L. AndrewNSW Fisheries Research InstitutePO Box 21Cronulla, New South Wales 2230, Australia
Manuscript accepted 9 December 1998.Fish. Bull. 97:812–827 (1999).
Abstract.–Dorsal spines, otoliths,scales, and vertebrae collected fromyellowtail kingfish (Seriola lalandi) inNSW, Australia, were assessed for use-fulness in estimating age. Legibility ofgrowth zones, the time scale at whichzones form, and precision of age esti-mates were evaluated for fish sizesfrom 323 to 1090 mm FL. All calcifiedstructures contained growth zones, butdorsal spines were unsuitable for agedetermination because it was likelythat early growth zones were lost. Frommarginal increment analysis, it ap-peared that one zone was laid down peryear for otoliths and possibly scales, buta clear pattern was not found for ver-tebrae. Although exact agreement be-tween repeated age readings was rela-tively low (50–66%), agreement withinone zone was higher (92–96%) andscales provided the most precise read-ings. Precision decreased with increas-ing age of fish. Growth curves derivedfrom otoliths and scales were similarfor all ages except fish from the firstage class; those derived from otolithsand vertebrae were similar for all fishwith less than eight growth zones. Al-though statistical differences werefound between the growth curves ofscales and vertebrae for some ageclasses, with the exception of the firstage class these differences were not bio-logically important. Growth rates esti-mated from length-frequency (age-based) and mark-recapture (length-based) data compared favorably withthose estimated from calcified agingstructures. Otoliths, scales, and verte-brae all showed promise as structuresfor aging kingfish, but further work isneeded to determine the position of thefirst zone and to validate estimates forall age classes. Until such work is com-pleted, we recommend that scales andeither otoliths or vertebrae be used foraging kingfish.
1 Penney, A. J. 1992. Sea Fisheries Re-search Institute, Private Bag X2, Rogge Bay8012, South Africa. Personal commun.
Yellowtail kingfish, Seriola lalandi,is a popular recreational species andsupports significant commercialfisheries throughout temperate re-gions of the world. In Australia, themajor commercial fishery for yel-lowtail kingfish is in New SouthWales where 400–600 tonnes arecaught per year. Despite the exist-ence of a commercial fishery andpersistent controversy about exploi-tation of the species, very little isknown about its biology. For futuremanagement of the fishery and forstock assessment purposes, informa-tion on age and growth is needed.
Estimates of age of Seriola spp.have been derived from a variety ofmethods and structures, reflectingthe difficulty of aging Seriola andother pelagic species. The Japanesespecies (Seriola quinqueradiata) isthe most studied species in the ge-nus because of its importance inaquaculture. Studies in the 1950sused scales, vertebrae, and opercu-lar bones for aging (e.g. Mitani,1955, 1958; Mitani and Sato, 1959).More recent studies have focused onthe use of vertebrae (e.g. Munekiyoet al., 1982; Murayama, 1992).Scales have also been used to ageS. lalandi (formerly S. dorsalis,
Baxter, 1960), as have otoliths(Penney1). Recently, sectioned oto-liths were used to determine agesof Seriola dumerili, although it wasacknowledged that age and growthdeterminations were difficult (Man-ooch and Potts, 1997). Despite theuse of a variety of structures for ag-ing Seriola spp., there has been nocomparative analysis to determinewhich structure provides the mostreliable estimates. In addition, moststudies have assumed that growthzones are annual and there havebeen few validations of age estimates(but see Mitani and Sato, 1959;Baxter, 1960).
The specific objectives of thisstudy were 1) to assess the useful-ness of several structures (scales,otoliths, dorsal spines, and verte-brae) for determining the age ofkingfish, 2) to compare multiple ageestimates for different structures inorder to determine the most precisemethod for determining age andgrowth parameters, 3) to provideinformation on size-at-age and 4) tocompare growth rates obtained

813Gillanders et al.: Aging methods for Seriola lalandi
from age-length data (from counts of zones in calci-fied structures) to those obtained from length-fre-quency and mark-recapture (tagging) data. We ac-knowledge that the data from these three approachesfor estimating growth are not directly comparable(Francis, 1988a), but follow the recommendations ofFrancis (1995) in interpreting differences.
Materials and methods
Fish collection and treatment
Yellowtail kingfish, Seriola lalandi, specimens werecollected from New South Wales, Australia, betweenAugust 1995 and July 1996 by commercial or recre-ational fishermen. Fish caught by commercial fish-ermen were obtained after being processed by fillet-ing. Fish were measured (total length, fork length)and sagittal otoliths, dorsal spines, scales, and ver-tebrae removed. Dorsal spines were examined butconsidered unsuitable for aging because the center(core) region was either occupied by vascular bonytissue or was hollow. The hollow core in large fishwas found to have a larger diameter than the wholespine of small fish. For this reason, it was likely thatearly growth zones were lost in older fish and there-fore spines were considered unsuitable for aging.
Sagittae
Whole sagittae were burned for 7 min at 500°C. Theywere viewed under a low-power dissecting microscope(6× magnification) with reflected light against a blackbackground. Assignments of age were based oncounts of opaque (light) zones or ridges (or both) thatwere usually most visible at the base of the rostrumon the ventral surface (Fig. 1A). Sagittae were alsoembedded in clear resin, sectioned in a transverseplane with a low speed saw, the sections (≈350 mmthickness) mounted on glass slides, and viewed un-der a compound microscope (40× magnification) withreflected light against a black background.
Scales
Scales were removed from a position anterior andventral to the pectoral fin. It was necessary to re-move scales from such a position because most fishhad been processed prior to the removal of scales.Scales from each fish were soaked in a solution ofsodium hydroxide for 3 h, then rinsed and soaked inwater for a further 3–12 h. Clean, nonreplacement(i.e. original scales showing typical ctenoid shape)scales were dry-mounted between two glass micro-
scope slides. Scales were read under a compoundmicroscope (20× magnification) with reflected lightagainst a black background. Presumed annuli wereidentified by cutting over (sensu Bagenal and Tesch,1978) in the lateral fields or by clear zones, wherecirculi were more widely spaced, in the anterior field.
Vertebrae
The second vertebra of 24 vertebrae present in king-fish was chosen because it was most easily obtainedfrom processed fish. Vertebrae were either stored fro-zen with flesh intact, or the flesh was removed, andthe vertebrae were separated from each other andstored dry. The spines were removed and each verte-bra cut in half along the longitudinal–horizontalplane and stained in a solution of alizarin red S (fol-lowing Berry et al., 1977) for 8 h, rinsed in tap waterfor at least 1 min, and dried at room temperature.Vertebrae were read under a dissecting microscope(6–12× magnification) with reflected light from ablue-filtered, high-intensity bulb against a blackbackground. Age was estimated from counts of ridgeson the inner surface of the vertebra from the core tothe outer edge of the centrum (Fig. 1C).
Assessment of aging techniques
To determine whether the zones would be reliablyinterpreted, two replicate counts of zones were madefor each structure by the same person. Counts wereusually separated by one month. All readings weredone in a random order, with no knowledge of dateof collection, size of fish, or knowledge of previouscounts. Preliminary investigations of transverse sec-tions of otoliths from 50 fish (ranging from 323 to1090 mm FL) found that growth zones were not in-terpretable for any fish (Fig. 2).
Multiple counts of zones (two counts for each ag-ing structure) were used to estimate the probabilityof assigning an age a to a fish with estimated “true”age b following maximum-likelihood estimation pro-cedures outlined in Richards et al. (1992). This pro-cedure requires the estimation of a classificationmatrix where there are columns for each “true” ageand rows for each assigned age, and the entries re-fer to probabilities of assigning age a to a fish, givenits true age b. “True” age is best described as themost probable age, and it does not refer to the accu-racy of the age estimate nor does it substitute forage validation procedures. It is assumed that fish willbe assigned to the true (or most probable) age classwith the highest probability (Richards et al., 1992).
The classification matrix is defined by up to fourparameters, where the first two parameters, σ1 and

814 Fishery Bulletin 97(4), 1999
Figure 1Structures used to estimate the age of kingfish from New South Wales: (A) otolith(860 mm FL, age 3); (B) scale (618 mm FL, age 3); and (C) vertebra (720 mm FL, age 3). Allstructures viewed with reflected light against a black background. Size of scale bars areindicated on each figure. Growth zones are indicated by squares; abbreviations: A = ante-rior, P = posterior, D = dorsal, V = ventral.
σA, are estimates of the standard deviation for theobservation a at age 1 and A respectively. The thirdparameter, α, determines nonlinearity of σ(b), thestandard deviation of the observation a. The fourthparameter, β, controls the extent that the classifica-tion matrix may be dominated by its diagonal en-tries (Richards et al., 1992). Two possible represen-tations of the classification matrix were used, namelya normal and an exponential representation (sensuRichards et al., 1992, p. 1803) and the α parameterwas constrained to 0 during one fit of each of the
normal and exponential representations, allowingfour different cases of the model to be fitted for eachaging structure. The appropriate model structure,or best fit model, for the classification matrix wasthen selected by using the Akaike information crite-rion (AIC) where a model with a low AIC value inrelation to other models was considered to provide agood fit (Richards et al., 1992).
Initially, data from each aging structure (otoliths,scales, and vertebrae) were analyzed separately andan age assigned to each fish from each structure. The

815Gillanders et al.: Aging methods for Seriola lalandi
Figure 2Transverse sections of sagittal otoliths of kingfish over a range of sizes viewedwith reflected light against a black background: (A) 337 mm FL; (B) 638 mm FL;(C) 850 mm FL; and (D) 1002 mm FL fish. Scale bar is 1.5 mm.
classification matrix for the best model (see above)was used to estimate the most probable age of eachfish by determining the probability that a fish wouldbe from each true age class given its two assignedages. Each fish was assigned to the age class withthe highest probability (Richards et al., 1992). Thisestimate of age was used for growth models. Onlythe first five age classes (0–4) were used in the clas-sification matrix because, although older fish oc-curred, sample sizes were small and some extrapo-lation for missing age classes would be necessary.Because data from older fish are important in esti-mating growth models, fish not used in the classifi-cation matrix were assigned an age by randomly se-lecting one of their two age readings.
The data matrix comprising the two age readingsfor each of the three aging structures was then ex-
amined to determine possible effects of the differentaging structures and to determine a final age for eachfish. Classification matrices for each aging structurewere determined following a modification of themethods of Richards et al. (1992; outlined above).Results from running the models for each structureseparately showed that the model of best fit was ob-tained by using a normal model with α = 0; there-fore, in its simplest form, the model contained theparameters σ1, σA, and terms for the relative bias ofeach method (r1 and r2; r3 = 0–r1–r2). Parameters de-termining the change in bias with age (γ) and non-linearity of bias with age (η) were also added aloneand indexed by aging structure. Different combina-tions of the model parameters were therefore testedto determine which model provided the best fit tothe data and to determine relative biases by method.

816 Fishery Bulletin 97(4), 1999
Table 1Summary of the different cases of Schnute’s (1981) size-at-age growth model that was fitted to age estimates from differentcalcified structures and Francis’s (1995) mark-recapture analogue of Schnute’s growth model that was fitted to the tagging data.
Francis’s (1995) mark-recapture analogue ofSchnute’s (1981) size at age model Schnute’s (1981) growth model
Case 1: a≠0, b≠0
Case 2: a≠0, b≠0
Case 3: a≠0, b≠0
Case 4: a≠0, b≠0
Meaning of terms Y(t) = fish size (FL) at age t, τ1 and τ2 = lowerand upper ages of fish respectively where τ2> τ1, y1 and y2 = mean sizes at ages τ1 and τ2 ,respectively. a and b describe the shape ofthe curve.
∆Y = mean growthYt = size at marking
y1 and y2 = lower and upper sizes of fish,respectively, where y1 < y2
g1 and g2 = mean annual growth for fishes ofsizes y1 and y2 respectively,
b = describes curvature in model,λ1 = y1 + g1 and λ2 = y2 + g2,
∆ ∆ ∆Y Y Y e c et tb a t a t b b= − + + −[ ]− − −
( )11 1
∆ ∆ ∆Y Y Y c et ta t a t= − + −[ ]− −exp ( ) exp ( )1
∆ ∆Y Y Y y tt tb b b b b= − + + −[ ] −
( )λ1 1
1 1
∆ ∆Y Y Y yt tt= − + ( / )λ1 1
cy y
y yb
b b b b
b b b b= −− + −
≠2 1 1 2
1 1 2 2
0λ λ
λ λ if or
cy y
y yb t= −
−= =ln( ) ln( ) ln( ) ln( )
ln( ) ln( / ),
λ λλ λ
1 1 2
1 2 2 1
0 1 if ∆
To determine the timing of zone formation, theedges of the various structures were examined. Thegrowth of the structure, subsequent to the most re-cent zone, was estimated as a percentage (20, 40, 60,and 80%) of the previously completed zone. It wasalso noted whether the zone was considered to be onthe edge of the structure. Only fish with 2–4 growthzones were used. Fish were examined individuallyby structure in a random order with no knowledge ofdate of collection.
Estimation of growth models from calcified structures
Growth models using age estimates from differentcalcified structures were derived by using proceduresoutlined in Schnute (1981). Schnute’s model relates size(FL) to age by several parameters, including two thatdescribe the shape of the curve (a and b; Table 1). These
latter parameters combine to describe a range of com-mon growth curves, including the von Bertalanffy(a>0, b=1), Richards (a>0, b<0), logistic (a>0, b=–1)and Gompertz (a>0, b=0) (Table 1; Schnute, 1981).The other parameters in Schnute’s growth modelwere y1 and y2, the mean sizes at ages τ1 and τ2 re-spectively, where the value of τ1 and τ2 are specified,but usually chosen to be near the lower and upperends of the range of ages in the data. In this study, τ1and τ2 were set at 1 and 5 respectively. All growthmodels were calculated by minimizing sums ofsquares and using additive errors because variationin size-at-age was similar for all ages of fish (see“Results” section).
Initially, a two-parameter model (y1 and y2) wasfitted to the data (case 4 in Table 1). Two types of athree-parameter model [parameters were a, y1, andy2 (case 2), and b, y1, and y2 (case 3)] and a four-
Y t y y yee
b b ba t
a
b
( ) ( )( )
( )= + − −−
− −
− −1 2 111
1
2 1
1τ
τ τ
Y t y y yee
a t
a( ) exp log ( / )( )
( )= −−
− −
− −1 2 111
1
2 1
τ
τ τ
Y t y y ytb b b
b
( ) ( )= + − −−
1 2 1
1
2 1
1
ττ τ
Y t y y yt
( ) exp log ( / )= −−
1 2 1
1
2 1
ττ τ
ay y
bb b
b b= −−
≠ln 2 1
2 1
0λ λ
if or
ay y
b=
=ln
ln( / )ln( / )
,2 1
2 10
λ λ if
817Gillanders et al.: Aging methods for Seriola lalandi
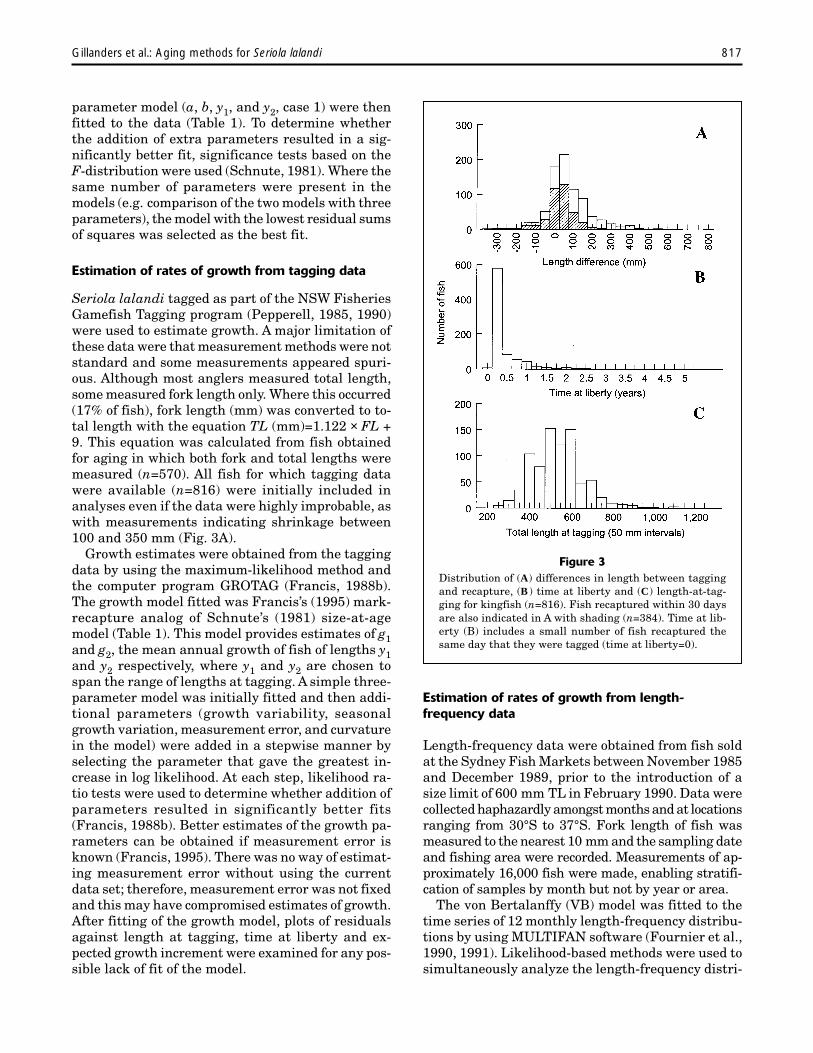
Figure 3Distribution of (A) differences in length between taggingand recapture, (B) time at liberty and (C) length-at-tag-ging for kingfish (n=816). Fish recaptured within 30 daysare also indicated in A with shading (n=384). Time at lib-erty (B) includes a small number of fish recaptured thesame day that they were tagged (time at liberty=0).
parameter model (a, b, y1, and y2, case 1) were thenfitted to the data (Table 1). To determine whetherthe addition of extra parameters resulted in a sig-nificantly better fit, significance tests based on theF-distribution were used (Schnute, 1981). Where thesame number of parameters were present in themodels (e.g. comparison of the two models with threeparameters), the model with the lowest residual sumsof squares was selected as the best fit.
Estimation of rates of growth from tagging data
Seriola lalandi tagged as part of the NSW FisheriesGamefish Tagging program (Pepperell, 1985, 1990)were used to estimate growth. A major limitation ofthese data were that measurement methods were notstandard and some measurements appeared spuri-ous. Although most anglers measured total length,some measured fork length only. Where this occurred(17% of fish), fork length (mm) was converted to to-tal length with the equation TL (mm)=1.122 × FL +9. This equation was calculated from fish obtainedfor aging in which both fork and total lengths weremeasured (n=570). All fish for which tagging datawere available (n=816) were initially included inanalyses even if the data were highly improbable, aswith measurements indicating shrinkage between100 and 350 mm (Fig. 3A).
Growth estimates were obtained from the taggingdata by using the maximum-likelihood method andthe computer program GROTAG (Francis, 1988b).The growth model fitted was Francis’s (1995) mark-recapture analog of Schnute’s (1981) size-at-agemodel (Table 1). This model provides estimates of g1and g2, the mean annual growth of fish of lengths y1and y2 respectively, where y1 and y2 are chosen tospan the range of lengths at tagging. A simple three-parameter model was initially fitted and then addi-tional parameters (growth variability, seasonalgrowth variation, measurement error, and curvaturein the model) were added in a stepwise manner byselecting the parameter that gave the greatest in-crease in log likelihood. At each step, likelihood ra-tio tests were used to determine whether addition ofparameters resulted in significantly better fits(Francis, 1988b). Better estimates of the growth pa-rameters can be obtained if measurement error isknown (Francis, 1995). There was no way of estimat-ing measurement error without using the currentdata set; therefore, measurement error was not fixedand this may have compromised estimates of growth.After fitting of the growth model, plots of residualsagainst length at tagging, time at liberty and ex-pected growth increment were examined for any pos-sible lack of fit of the model.
Estimation of rates of growth from length-frequency data
Length-frequency data were obtained from fish soldat the Sydney Fish Markets between November 1985and December 1989, prior to the introduction of asize limit of 600 mm TL in February 1990. Data werecollected haphazardly amongst months and at locationsranging from 30°S to 37°S. Fork length of fish wasmeasured to the nearest 10 mm and the sampling dateand fishing area were recorded. Measurements of ap-proximately 16,000 fish were made, enabling stratifi-cation of samples by month but not by year or area.
The von Bertalanffy (VB) model was fitted to thetime series of 12 monthly length-frequency distribu-tions by using MULTIFAN software (Fournier et al.,1990, 1991). Likelihood-based methods were used tosimultaneously analyze the length-frequency distri-

818 Fishery Bulletin 97(4), 1999
2 Steffe, A., J. Murphy, D. Chapman, B. E. Tarlington, G. N. G.Gordon, and A. Grinberg. 1996. An assessment of the im-pact of offshore recreational fishing in New South Wales on themanagement of commercial fisheries. Final Report toFisherires Research Development Corporation, PO Box 222,Deakin West ACT 2600, Australia.
butions sampled at different times to estimate thenumber of cohorts in the population, the growth pa-rameters (asymptotic length [L∞] and growth coeffi-cient [K] of the von Bertalanffy growth equation),the age of the first cohort (assuming that the VBcurve passes through the origin) and the proportionsat age. The simplest model assumes that meanlengths-at-age lie on the VB growth curve and thatthe standard deviations of length-at-age are identi-cal for all cohorts. More complex models were alsotested that allowed 1) sampling bias for the first co-hort, 2) age-dependent standard deviation in length-at-age, and 3) seasonally oscillating growth to beadded as additional parameters in the model. Themore complex models incorporated all possible com-binations of these parameters and used likelihoodratio tests to identify the model of best fit. The sig-nificance of improvement of fit within models by add-ing year classes was tested for significance at the0.10 level (see Fournier et al., 1990), and significanceof improvement of fit between models by adding ex-tra parameters was tested at the 0.05 level.
The seasonal form of the von Bertalanffy equationfor the length-frequency data is
µ ρρja N
j t f t
Nm m ma a
= + − −−
− + +[ ]−1 1
1 12
1
11
( ) ,( ) ( / ) ( )
( )
where
µja = the mean length of fish of the jth ageclass in the ath length-frequency dataset;
m1 = the mean length of the first age class;mN = the mean length of the last age class;ρ = the Brody growth coefficient;tα = the number of months after the pre-
sumed birth month of the fish in theath length-frequency data set;
N = the number of age classes present; andφ1 and φ2 describe the amplitude and phaseof the seasonal component, respectively(Fournier et al., 1990, 1991; Francis andFrancis, 1992).
Comparisons of rates of growth fromcalcified structures and from taggingand length-frequency data
Rates of growth were estimated from aging struc-tures and from length-frequency (both age-based) andmark-recapture (length-based) data with methodsoutlined in Francis (1995). The aging error model of
f tt
aa( ) sin ,= + −
φπ
π φ122
21
12
Richards et al. (1992) that showed the best fit to thedata matrix comprising two age readings from eachof the three aging structures was used to determinea single age for each fish. Schnute’s growth curve(case 2) was then fitted to the age-size data and thismean age-size relationship was used as a basis withwhich to compare the estimates of growth from the dif-ferent data sets. The annual growth for the age-sizedata and length-frequency data was calculated as themean size at age x minus the mean size-at-age (x+1;Francis, 1995). Annual growth at corresponding pointson the size-based line was then estimated at the sizethe fish was at age x, as determined from the fit to themark-recapture data obtained by using GROTAG.
Results
Structures for aging Seriola lalandi were collectedfrom a total of 572 fish ranging in size from 323 to1090 mm FL, although not all structures were col-lected from all fish. Although S. lalandi is reported toreach a total length of almost 2000 mm (1700 mm FL)and a weight of 60 kg, fish of this size are rare. In NewSouth Wales, few fish over 20 kg (about 1200 mm FL)are caught by commercial fishermen and the largestfish recorded in surveys of amateur fishermen hasbeen 1140 mm FL (Steffe et al.2). We were unable toobtain fish larger than 1100 mm FL.
All structures showed zones that could be inter-preted as annuli (Fig. 1); however, zones were notinterpretable in all fish. Growth zones in wholeotoliths were more easily interpretable than thosein sectioned otoliths (Fig. 2); the latter showed nu-merous striations that could rarely be interpreted.Zones in sectioned otoliths were, however, clearer insome larger fish (Fig. 2). A large number of scaleshad to be collected because preliminary resultsshowed that two-thirds of fish had at least some re-generated scales. Vertebrae did not always stain welland showed pronounced ridges which reduced read-ability in many fish.
Validation of aging methods
Analysis of marginal increments showed differentpatterns among structures (Table 2). Otoliths andscales revealed that one zone was laid down per year,in August–September (otoliths) and between Decem-

819Gillanders et al.: Aging methods for Seriola lalandi
Table 2Results of analyses of marginal increments for kingfishaged by otoliths, scales, and vertebrae. Each category isthe growth of the structure, subsequent to the most recentzone, as a percentage of the previously completed zone.The percentage of fish in each category for each two-monthperiod is shown; sample sizes are also indicated (in paren-theses beside month). Only fish aged 2–4 were used foranalyses. For each row, the highest percentage of fish isshown in bold.
Category
Month Edge 20 40 60 80
OtolithsAug–Sep (34) 44 35 15 0 6Oct–Nov (149) 16 36 24 10 13Dec–Jan (87) 9 7 18 24 41Feb–Mar (68) 1 13 31 24 31
ScalesAug–Sep (0)Oct–Nov (181) 15 12 21 24 29Dec–Jan (94) 22 34 21 7 15Feb–Mar (101) 1 19 28 34 19
VertebraeAug–Sep (51) 8 16 16 10 51Oct–Nov (173) 16 20 24 16 23Dec–Jan (50) 14 12 28 20 26Feb–Mar (70) 14 13 37 11 24
Figure 4Differences between repeated counts of zones for threestructures used to age kingfish. Each comparison repre-sents independent counts from a single reader.
ber and January (scales; Table 2). No data were, how-ever, obtained for scales in August–September andsample sizes were small between April and July (n=1–7 fish per month) for all structures. No clear pattern ofmarginal zones was observed in vertebrae (Table 2).
Precision within and among structures
Comparisons of two independent counts of zones ina structure resulted in a relatively low level of agree-ment (50–66%). Depending on the structure, between92% and 96% of readings agreed within one zone(Fig. 4). Differences in counts of zones varied by up tofour zones (Fig. 4). Mean coefficients of variation amongcounts ranged from 7.6% (scales) to 12% (otoliths).
Comparison of readings between structuresshowed a large amount of variation, with differencesbetween structures varying by up to six growth zones(Fig. 5). Agreement between any two methods de-creased with age, but otoliths and vertebrae had thegreatest concordance in fish aged 4 and over. Fishwere never assigned an age of 0 when aged withscales; fish assigned 0 or 1 with other structures wereassigned an age of 1 with scales. Readings betweenstructures agreed within one zone between 88% (be-
tween vertebrae and otoliths) and 91% (betweenscales and otoliths) of the time.
Estimates of aging error
Analysis of aging precision with the methods ofRichards et al. (1992) showed that the estimates ofassigned age were more precise for young fish(Fig. 6A). For example, with otoliths, 98% of fish withan estimated most probable age of 0 were likely tobe aged as 0, whereas only 74% of fish with a mostprobable age of 4 were likely to be aged as 4. Thisprecision can be compared with those obtained fromother structures (e.g. scales and vertebrae; Fig. 6A).Fish aged with scales had a higher probability ofbeing consistently assigned ages 1 and 2. Fish agedwith vertebrae or otoliths, however, had a higherprobability of being consistently assigned age 4,whereas there was little difference between the threestructures in assigning fish to age 3 (Fig. 6A).
Difference (number of zones)

820 Fishery Bulletin 97(4), 1999
Figure 5Counts of zones from kingfish otoliths, scales, and vertebrae com-pared with other aging structures. Histograms show the differ-ence between structures, and the scatterplots enable compari-sons between structures by age. In each scatterplot, the line ofslope 1 (dotted line) indicates 100% agreement. The line of bestfit (dashed line) is indicated with a dashed line. The sample sizefor each point on the scatterplots is also shown.
A more complex aging error model, with para-meters that accounted for effects due to aging struc-tures showed that fish in their first year (i.e. 0 growthzones) were likely to be overestimated with scalesand vertebrae than with otoliths. Otoliths underes-timated the age of fish in their first year, althoughthis is due to the relative nature of the model be-cause vertebrae and scales overestimated the age ofthese fish (Fig. 6B). Scales showed less bias in rela-tion to the other structures for fish aged 1–4 (Fig. 6B).
Estimates of rates of growth
Patterns in growth of kingfish from NSW were ob-tained from Schnute’s (1981) growth model fitted tothe estimated most probable ages of fish calculated
from the different aging structures (Fig. 7). Size-agedata were best fitted by three-parameter models forotoliths, vertebrae (both case 2, see Table 1) andscales (case 3). Using the best fitting model for eachstructure, we estimated that the average lengths (±standard error) of fish with one growth zone were 499(±5), 418 (±9), and 485 (±7) mm FL for otoliths, scales,and vertebrae respectively. At age 5, fish were 807 (±8),823 (±8), and 788 (±6) mm FL for otoliths, scales, andvertebrae respectively. The maximum age of fish was 9yr for otoliths and scales, compared to 11 yr for verte-brae (Fig. 7). Vertebrae tended to produce higher ageestimates than did otoliths and scales, with 5% of fishshowing greater than five growth zones in vertebraecompared with only 2% for scales and otoliths. Using asingle age for each fish, we estimated an age-length
key for fish sampled during the current study(Table 3). Fish in all length classes were found inmore than one age class (Table 3).
The different aging structures showed signifi-cant differences in mean size-at-age for someage classes. Scales showed significantly differ-ent mean size-at-age to otoliths and vertebraefor fish with one growth zone (t-tests, P<0.05).Otoliths and vertebrae gave similar estimatesof mean size-at-age for fish with less than eightgrowth zones (t-tests, P<0.05). With the excep-tion of fish with one growth zone, scales gavesimilar estimates of mean size-at-age to otolithsfor all other age classes (t-tests, P<0.05). Al-though differences between scales and vertebraewere statistically significant for some age classes(fish with 4–6 growth zones), these differenceswere not likely to be biologically important.
Kingfish that were measured at both taggingand recapture were at large for between 0 days(i.e. recaptured the same day that they weretagged) and 5 years (Fig. 3B). Growth of recap-tured fish ranged from a decrease of 350 mm toan increase of 800 mm (Fig. 3A). The frequencydistribution of fish at large <30 days showedthat fishermen were just as likely to underesti-mate the length of fish as they were to overes-timate the length of fish (Fig. 3A). The meandifference in size of fish between tagging andrecapture for fish recaptured within 30 days was11.6 mm (±0.4, SE), suggesting that there waslittle bias in measurements between tagging andrecapture. Size of fish at tagging ranged from 220to 1200 mm, although the majority of fish werebetween 400 and 600 mm TL (Fig. 3C).
The best fit to the complete tag-recapturedata set (model 1 in Table 4) showed a high pro-portion of outliers (P=0.04). Twenty-two fish (or2.7%) that had absolute standardized residu-

821Gillanders et al.: Aging methods for Seriola lalandi
Figure 6(A) Aging error versus estimated most probable age for king-fish aged with otoliths, scales, and vertebrae. Estimated mostprobable age was calculated separately for each structure byusing the methods of Richards et al. (1992), see text for fur-ther details. Errors around the first and last ages are indi-cated by the vertical lines. (B) Relative bias versus estimatedmost probable age for kingfish aged by otoliths, scales, and ver-tebrae. Relative bias was calculated from a model that incorpo-rated two age readings from each of the three structures.
als greater than 3 in the model 1 fit were removedfrom the data set. Initially, a simple three-param-eter model was fitted (model 2 in Table 4), whichindicated growth rates of 255 mm and 176 mm for400-mm and 600-mm fish, respectively. The firstadditional parameter selected was that describ-ing the shape of the growth curve (model 3 inTable 4). Model 3 showed annual growth rates of 270and 140 mm. There was a significant improvementin fit when a term describing growth variability wasadded (model 4 in Table 4). Additional parameters(e.g. seasonal growth terms) did not result in sig-nificant improvements of fit. The best fitting modelwas therefore case-1 model in Table 1. Plots ofstandardized residuals against length at tagging,time at liberty, and expected growth incrementshowed no pattern (correlations were 0.022, 0.003,and 0.005, respectively) suggesting that the modelwas appropriate.
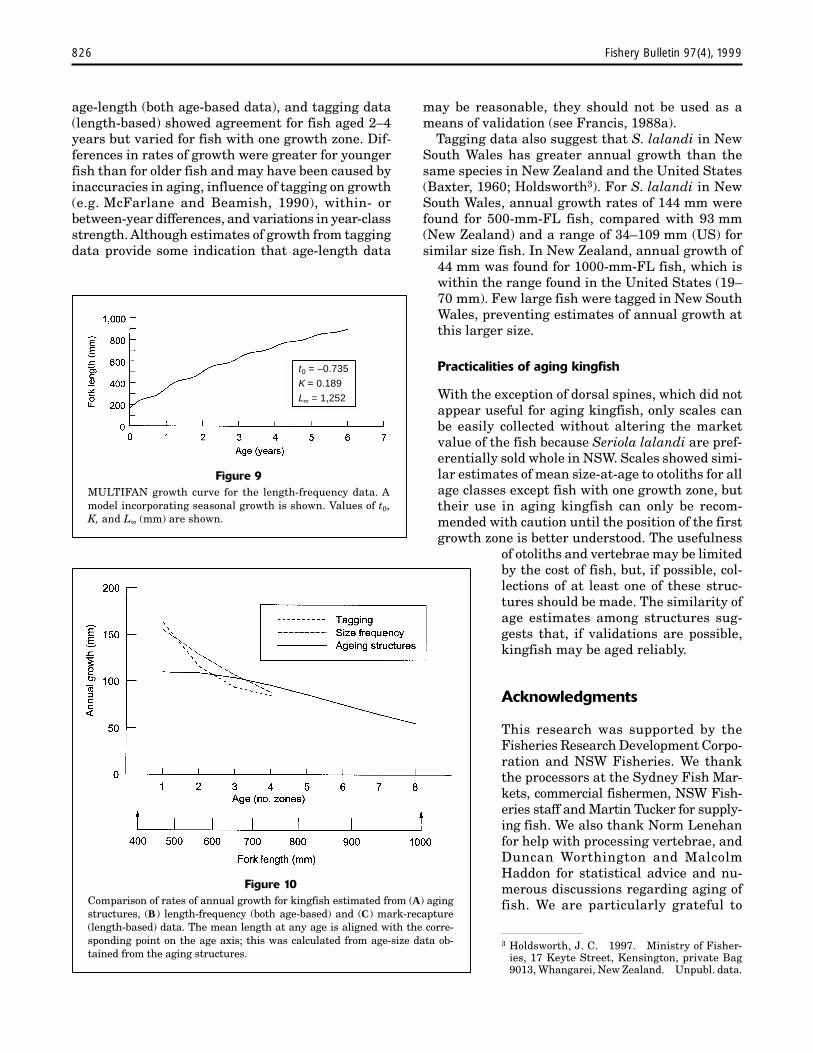
The best fitting model for the kingfish length-fre-quency data set identified five cohorts aged from 1.73to 5.73 years (Table 5; Fig. 8). The standard devia-tion of the predicted length estimates for each ageclass increased with age. Parameters for first lengthbias and seasonal growth were also included in thebest fitting model (Table 5; Fig. 9). Estimates of themean length-at-age (and standard deviation) for thelength-frequency data set are given in Table 5. Themean lengths and proportions of the modes predictedby MULTIFAN generally fitted the observed data(Fig. 8). There were large numbers of small fish(e.g. 1 yr) in the catch during the summer months(e.g. November and December), whereas 2-yr fishdominated the catch at other times. Small numbersof large fish (e.g. greater than 5 yr) were foundthroughout the year (Fig. 8). The seasonal form ofthe von Bertalanffy growth equation showed thatthe projected value of L∞ was 1252 mm FL and therate of change in growth increment (K) was 0.189(Fig. 9).
Comparison of annual growth between age-based (age-length and length-frequency) andlength-based (mark-recapture) data, although notstrictly comparable, showed a decrease in growthwith age and size of fish (Fig. 10). Estimates ofannual growth were similar among the threemethods for 2–4 year fish (≈550–750 mm SL) butvaried by ≈50 mm for 1-yr-old fish.
Discussion
All structures showed patterns of growth that were,to varying degrees, quantifiable. Delineation of eachzone was, however, sometimes difficult, as has been
found in other studies (e.g. Brennan and Cailliet,1989; Manooch and Potts, 1997), and the clarity ofzones varied among individuals for all structures.Because pelagic fishes including Seriola spp. areknown to be difficult to age, these results were notsurprising.
To accurately reflect the age of a fish, the zones mustbe formed on a regular and determinable time scale.

822 Fishery Bulletin 97(4), 1999
Figure 7Relationship between fork length and age for the different struc-tures used to age kingfish (A–C) and (D) comparison of thethree growth curves. The growth curves were calculated byusing Schnute’s growth model. R2, overall standard deviation(SD), and the parameters (standard error) describing the growthmodel are shown. y1 is size at age 1, y2 is size at age 5, a and bare parameters that describe the shape of the curve. The for-mulae for the growth curves are found in Table 1.
Small sample sizes during the winter months (fromApril to July), due in part to small numbers of fish be-ing taken in the fishery, made analysis of marginal in-crements problematic, especially for scales becausesamples were also not obtained in August–September.With the exceptions of otoliths and possibly scales, ourdata were not sufficient to confirm that only one zone
was formed per year. No single category of marginalgrowth ever had more than 50% of fish for any struc-ture. A previous study (Mitani and Sato, 1959) alsofound that fish (Seriola quinqueradiata) collected inany one time period showed a wide range of marginalgrowth conditions. Growth zones on the edge of theotoliths of S. dumerili were also found over five months
of the year (Manooch and Potts, 1997). The widerange of marginal growth patterns in our study mayin part be due to grouping of samples intotwo-month intervals or because fish from three ageclasses (2–4 growth zones) were used in analyses.Fish from different age classes have previously beenshown to lay down zones at slightly different timesof year (e.g. Francis et al., 1992).
Analysis of marginal increments often providesonly partial validation of age estimates becauseolder fish with slower growth often do not showseasonality in formation of zones. A methodshould not be considered accurate until all re-ported ages are validated (Beamish and McFar-lane, 1983). Validation of age estimates in olderfish will require a mark-recapture study, but fur-ther work on validation in younger fish may usea variety of approaches (e.g. length-frequencyanalyses if cohorts are easily recognized, mark-recapture etc). In the present study, few taggedfish were at large more than a year (Fig. 3B),which suggests that many fish would have to betagged in a mark-recapture study to recover suf-ficient fish to make this approach feasible.
There have been few validation studies on Seriolaspp. and all have involved analysis of marginal in-crements. Mitani and Sato (1959) have suggestedthat one zone is laid down each winter in opercularbones of S. quinqueradiata and Baxter (1960) foundthat zones are formed between November andJanuary in scales of S. lalandi (formerly dorsalis).In otoliths of S. lalandi opaque zones appear to belaid down in August or September. Timing of zoneformation in scales and vertebrae was more vari-able and may differ between structures because pro-cesses involved in deposition vary among bone,scales, and otoliths (Simkiss, 1974).
Precision of aging estimates
Exact agreement among age estimates for eachstructure was generally poor; agreement withinone zone was reasonable for all structures. Theuse of percent agreement (i.e. percent of fish agedalike between sets of multiple readings) has beencriticized because it fails to take into account therange of year classes of fish and therefore can beused only for age-specific comparisons (Kimura
R2=0.67
R2=0.73
R2=0.70
823Gillanders et al.: Aging methods for Seriola lalandi
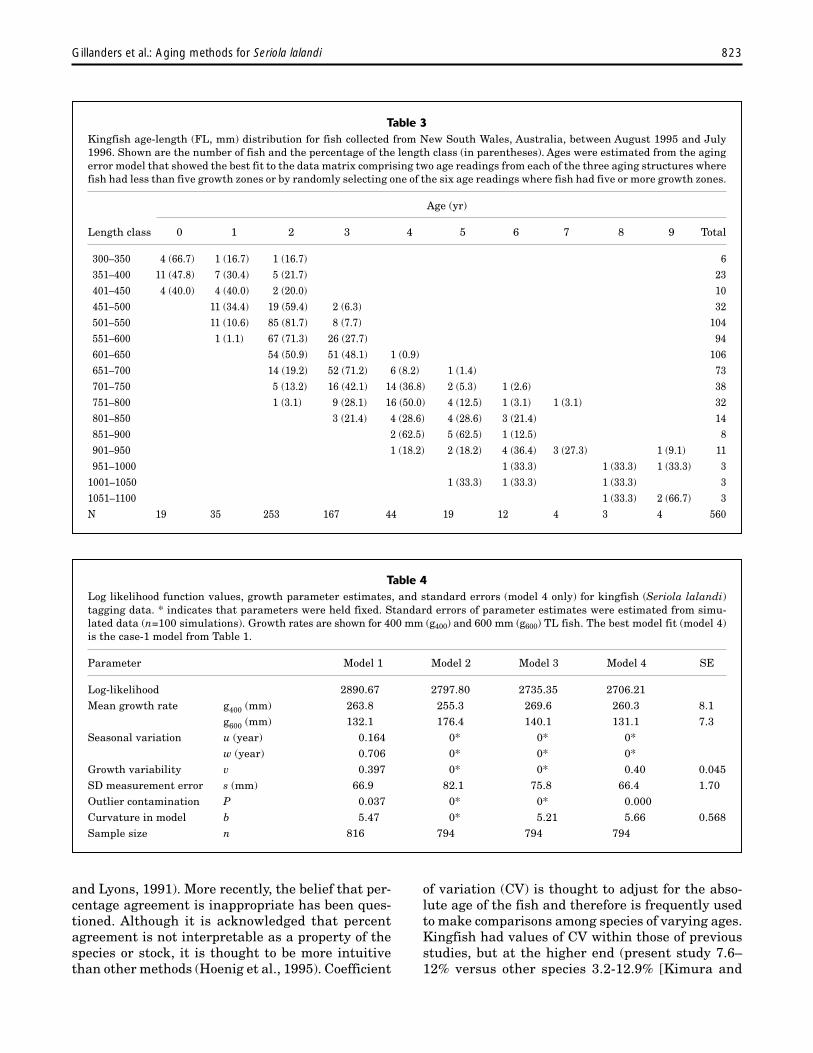
Table 4Log likelihood function values, growth parameter estimates, and standard errors (model 4 only) for kingfish (Seriola lalandi)tagging data. * indicates that parameters were held fixed. Standard errors of parameter estimates were estimated from simu-lated data (n=100 simulations). Growth rates are shown for 400 mm (g400) and 600 mm (g600) TL fish. The best model fit (model 4)is the case-1 model from Table 1.
Parameter Model 1 Model 2 Model 3 Model 4 SE
Log-likelihood 2890.67 2797.80 2735.35 2706.21Mean growth rate g400 (mm) 263.8 255.3 269.6 260.3 8.1
g600 (mm) 132.1 176.4 140.1 131.1 7.3Seasonal variation u (year) 0.164 0* 0* 0*
w (year) 0.706 0* 0* 0*Growth variability v 0.397 0* 0* 0.40 0.045SD measurement error s (mm) 66.9 82.1 75.8 66.4 1.70Outlier contamination P 0.037 0* 0* 0.000Curvature in model b 5.47 0* 5.21 5.66 0.568Sample size n 816 794 794 794
Table 3Kingfish age-length (FL, mm) distribution for fish collected from New South Wales, Australia, between August 1995 and July1996. Shown are the number of fish and the percentage of the length class (in parentheses). Ages were estimated from the agingerror model that showed the best fit to the data matrix comprising two age readings from each of the three aging structures wherefish had less than five growth zones or by randomly selecting one of the six age readings where fish had five or more growth zones.
Age (yr)
Length class 0 1 2 3 4 5 6 7 8 9 Total
300–350 4 (66.7) 1 (16.7) 1 (16.7) 6351–400 11 (47.8) 7 (30.4) 5 (21.7) 23401–450 4 (40.0) 4 (40.0) 2 (20.0) 10451–500 11 (34.4) 19 (59.4) 2 (6.3) 32501–550 11 (10.6) 85 (81.7) 8 (7.7) 104551–600 1 (1.1) 67 (71.3) 26 (27.7) 94601–650 54 (50.9) 51 (48.1) 1 (0.9) 106651–700 14 (19.2) 52 (71.2) 6 (8.2) 1 (1.4) 73701–750 5 (13.2) 16 (42.1) 14 (36.8) 2 (5.3) 1 (2.6) 38751–800 1 (3.1) 9 (28.1) 16 (50.0) 4 (12.5) 1 (3.1) 1 (3.1) 32801–850 3 (21.4) 4 (28.6) 4 (28.6) 3 (21.4) 14851–900 2 (62.5) 5 (62.5) 1 (12.5) 8901–950 1 (18.2) 2 (18.2) 4 (36.4) 3 (27.3) 1 (9.1) 11951–1000 1 (33.3) 1 (33.3) 1 (33.3) 3
1001–1050 1 (33.3) 1 (33.3) 1 (33.3) 31051–1100 1 (33.3) 2 (66.7) 3N 19 35 253 167 44 19 12 4 3 4 560
and Lyons, 1991). More recently, the belief that per-centage agreement is inappropriate has been ques-tioned. Although it is acknowledged that percentagreement is not interpretable as a property of thespecies or stock, it is thought to be more intuitivethan other methods (Hoenig et al., 1995). Coefficient
of variation (CV) is thought to adjust for the abso-lute age of the fish and therefore is frequently usedto make comparisons among species of varying ages.Kingfish had values of CV within those of previousstudies, but at the higher end (present study 7.6–12% versus other species 3.2-12.9% [Kimura and

824 Fishery Bulletin 97(4), 1999
Table 5Estimated parameters from the MULTIFAN analysis of thelength-frequency data, with predicted fork lengths (FL) andstandard deviations (SD) of lengths at age.
Parameter Estimated value
Number of cohorts (N) 5von Bertalanffy K 0.189/yearvon Bertalanffy L∞ 1,252 mmBrody’s rho (ρ) 0.828First length (m1) 349.5 mmLast length (mN) 828.4 mmAge of first year class 1.73 yearsMean length sampling bias 26.13 mmSeasonal growth amplitude (φ1) 0.611Seasonal growth phase (φ2) 0.087 yearsMean SD 44.4 mmRatio of first to last SD 1.897
Age Predicted FL (mm) Length-at-age SD
1 349.5 32.22 505.0 39.73 633.7 47.14 740.2 54.35 828.4 61.1
Lyons, 1991]) suggesting that S. lalandi was a moredifficult species to age. For kingfish, scales (7.6%)had lower values of CV than did otoliths (12%) andvertebrae (11%). The lowest CV values were for struc-tures where no fish were in their first year (e.g.scales), and the highest values were for structureswhere fish were aged as in their first year (e.g.otoliths and vertebrae). Similarly, Kimura and Lyons(1991) found that the CV was highest for species inwhich 1-year age classes were present and lowestwhere the youngest age classes were 2 or 3 years.Coefficient of variation therefore depends on theminimum age of fish and we suggest that its use belimited to comparisons where fish have the samerange of ages. Such indices, if averaged over all fish,are also thought to simplify the data because anytrends that might occur with age are ignored (seeHoenig et al., 1995). Precision of aging decreased withage of fish for all structures, suggesting that esti-mates of precision should not be averaged over allage classes. We believe that the methods of Richardset al. (1992) give a better indication of aging error,and therefore precision, than did methods that sum-marized over all age classes.
Length at age
Estimates of mean size-at-age calculated from growthmodels suggested that the resulting growth curvesfrom otoliths, scales, and vertebrae were similar forall but the youngest age class. Although other agingstudies on Seriola spp. have calculated averagelength-at-age (e.g. Mitani, 1955; Mitani and Sato,1959), few have fitted models to the data (but seeBaxter, 1960; Manooch and Potts, 1997). Growthmodels from all aging structures were within therange of growth of Seriola spp. described elsewhere(e.g. Mitani, 1955, 1958; Mitani and Sato, 1959;Baxter, 1960; Murayama, 1992).
Further research needs to focus on the position ofthe first zone in all structures because this may con-tribute to differences in the shape of the growthcurves between structures. No fish were found to bein their first year (i.e. 0) when aged with scales, butfish were found to be in their first year when agedwith otoliths and vertebrae. There are also differ-ences in estimated mean size between scales and bothotoliths and vertebrae for fish with one growth zone,which is also likely to be due to the detectability ofthe first zone. Either scales lay down a false firstzone or the first zone is not detected in otoliths andvertebrae, possibly because it is close to the edge ofthe structure. Collections of fish from recruitmentover a 12-month period and sampling of all struc-tures may help elucidate the position of the first zone.
Although, it is well known that age estimates fromscales are inaccurate once growth becomes asymp-totic (Beamish and McFarlane, 1987), scales did notappear to underestimate ages of kingfish in relationto otoliths in the present study but may have under-estimated ages of older fish in relation to vertebrae(e.g. Fig. 5). In a previous study on S. lalandi, spacesbetween circuli became increasingly narrow after theseventh year, so that it was impossible to differenti-ate between one year’s growth and the next (Baxter,1960). Few fish, however, had greater than sevengrowth zones in the current study.
Many studies have found that sectioned otolithsare preferable to whole otoliths for aging becauseexamination of whole otoliths does not take into ac-count the asymmetric deposition of material (Cam-pana, 1984). After a certain age, deposition maythicken the otolith and growth along the anteropos-terior axis may decline; therefore only transversesections would reveal recently formed growth zones(Beamish, 1979). Growth zones on whole otolithswere interpretable for aging kingfish, but zones couldrarely be interpreted on sectioned otoliths. This isunusual because in many studies, sectioned otolithshave been found to give more precise and accurateestimates of age than whole otoliths (e.g. Beamish,

825Gillanders et al.: Aging methods for Seriola lalandi
Figure 8Observed length-frequency distributions for kingfish data (shaded histograms), showing the fitof the MULTIFAN model (see Table 5 for model details). Estimated frequencies for each ageclass (inner smoothed curves) and for the sum of all age classes (outer smooth curve) are shown.Vertical lines represent the estimated mean lengths-at-age in each sample.
1979; Campana, 1984). Manooch and Potts (1997)have used sectioned otoliths to age S. dumerili butcommented that age and growth determinations werevery difficult. Measurements could only be made on48% of samples and zones could only be counted on71% of samples and thus may have biased estimatesof growth in their study. Whole otoliths were examinedin their study solely to determine the plane of section-ing (Manooch and Potts, 1997). Because whole oto-
liths may underestimate age of large fish (e.g. Beamish,1979; Campana, 1984), it may also be useful to lookat transverse sections of otoliths of kingfish for ex-tremely large fish (>20 kg).
Comparison of age- and length-based data
Although not strictly comparable (see Francis, 1988a,1995), estimates of growth from length-frequency,
826 Fishery Bulletin 97(4), 1999
Figure 10Comparison of rates of annual growth for kingfish estimated from (A) agingstructures, (B) length-frequency (both age-based) and (C) mark-recapture(length-based) data. The mean length at any age is aligned with the corre-sponding point on the age axis; this was calculated from age-size data ob-tained from the aging structures.
Figure 9MULTIFAN growth curve for the length-frequency data. Amodel incorporating seasonal growth is shown. Values of t0,K, and L∞ (mm) are shown.
3 Holdsworth, J. C. 1997. Ministry of Fisher-ies, 17 Keyte Street, Kensington, private Bag9013, Whangarei, New Zealand. Unpubl. data.
age-length (both age-based data), and tagging data(length-based) showed agreement for fish aged 2–4years but varied for fish with one growth zone. Dif-ferences in rates of growth were greater for youngerfish than for older fish and may have been caused byinaccuracies in aging, influence of tagging on growth(e.g. McFarlane and Beamish, 1990), within- orbetween-year differences, and variations in year-classstrength. Although estimates of growth from taggingdata provide some indication that age-length data
may be reasonable, they should not be used as ameans of validation (see Francis, 1988a).
Tagging data also suggest that S. lalandi in NewSouth Wales has greater annual growth than thesame species in New Zealand and the United States(Baxter, 1960; Holdsworth3). For S. lalandi in NewSouth Wales, annual growth rates of 144 mm werefound for 500-mm-FL fish, compared with 93 mm(New Zealand) and a range of 34–109 mm (US) forsimilar size fish. In New Zealand, annual growth of
44 mm was found for 1000-mm-FL fish, which iswithin the range found in the United States (19–70 mm). Few large fish were tagged in New SouthWales, preventing estimates of annual growth atthis larger size.
Practicalities of aging kingfish
With the exception of dorsal spines, which did notappear useful for aging kingfish, only scales canbe easily collected without altering the marketvalue of the fish because Seriola lalandi are pref-erentially sold whole in NSW. Scales showed simi-lar estimates of mean size-at-age to otoliths for allage classes except fish with one growth zone, buttheir use in aging kingfish can only be recom-mended with caution until the position of the firstgrowth zone is better understood. The usefulness
of otoliths and vertebrae may be limitedby the cost of fish, but, if possible, col-lections of at least one of these struc-tures should be made. The similarity ofage estimates among structures sug-gests that, if validations are possible,kingfish may be aged reliably.
Acknowledgments
This research was supported by theFisheries Research Development Corpo-ration and NSW Fisheries. We thankthe processors at the Sydney Fish Mar-kets, commercial fishermen, NSW Fish-eries staff and Martin Tucker for supply-ing fish. We also thank Norm Lenehanfor help with processing vertebrae, andDuncan Worthington and MalcolmHaddon for statistical advice and nu-merous discussions regarding aging offish. We are particularly grateful to
t0 = –0.735
K = 0.189
L∞ = 1,252

827Gillanders et al.: Aging methods for Seriola lalandi
Duncan Worthington for his help and advice in run-ning MATLAB for the aging error section of this pa-per and for his comments on a draft of the manu-script. The manuscript was greatly improved by thecomments of three anonymous reviewers.
Literature cited
Bagenal, T. B., and F. W. Tesch.1978. Age and growth. Chap. 5 in T. B. Bagenal (ed.), Meth-
ods for assessment of fish production in fresh waters, p. 101–136. Blackwell Scientific Publications, Oxford, 365 p.
Baxter, J. L.1960. A study of the yellowtail Seriola dorsalis (Gill). State
of California Department of Fish and Game, Fish Bull.110:96.
Beamish, R. J.1979. Differences in the age of Pacific hake (Merluccius
productus) using whole otoliths and sections of otoliths. J.Fish. Res. Board Can. 36:141–151.
Beamish, R. J., and G. A. McFarlane.1983. The forgotten requirement for age validation in fish-
eries biology. Trans. Am. Fish. Soc. 112:735–743.1987. Current trends in age determination methodology.
In R. C. Summerfelt and G. E. Hall (ed.), Age and growthof fish, p. 15–42. Iowa State Univ. Press, Ames, IA,544 p.
Berry, F. H., D. W. Lee, and A. R. Bertolino.1977. Age estimates in Atlantic bluefin tuna—an objective
examination and an intuitive analysis of rhythmic mark-ings on vertebrae and in otoliths. Int. Comm. Conserv.Atl. Tunas, Collect. Vol. Sci. Pap., Madrid 6:305–317.
Brennan, J. S., and G. M. Cailliet.1989. Comparative age-determination techniques for white
sturgeon in California. Trans. Am. Fish. Soc. 118:296–310.Campana, S. E.
1984. Comparison of age determination methods for starryflounder. Trans. Am. Fish. Soc. 113:365–369.
Fournier, D. A., J. R. Sibert, J. Majkowski, and J. Hampton.1990. MULTIFAN a likelihood-based method for estimat-
ing growth parameters and age composition from multiplelength frequency data sets illustrated using data for south-ern bluefin tuna (Thunnus maccoyii). Can. J. Fish. Aquat.Sci. 47:301–317.
Fournier, D. A., J. R. Sibert, and M. Terceiro.1991. Analysis of length frequency samples with relative
abundance data for the Gulf of Maine northern shrimp(Pandalus borealis) by the MULTIFAN method. Can. J.Fish. Aquat. Sci. 48:591–598.
Francis, M. P., and R. I. C. C. Francis.1992. Growth rate estimates for New Zealand rig (Mustelus
lenticulatus). Aust. J. Mar. Freshwater Res. 43:1157–1176.
Francis, R. I. C. C.1988a. Are growth parameters estimated from tagging and
age-length data comparable? Can. J. Fish. Aquat. Sci.45:936–942.
1988b. Maximum likelihood estimation of growth andgrowth variability from tagging data. N.Z. J. Mar. Fresh-water Res. 22:42–51.
1995. An alternative mark-recapture analogue of Schnute’sgrowth model. Fish. Res. 23:95–111.
Francis, R. I. C. C., L. J. Paul, and K. P. Mulligan.1992. Ageing of adult snapper (Pagrus auratus) from otolith
annual ring counts: validation by tagging and oxytetracyclineinjection. Aust. J. Mar. Freshwater Res. 43:1069–1089.
Hoenig, J. M., M. J. Morgan, and C. A. Brown.1995. Analysing differences between two age determina-
tion methods by tests of symmetry. Can. J. Fish. Aquat.Sci. 52:364–368.
Kimura, D. K., and J. J. Lyons.1991. Between-reader bias and variability in the age-de-
termination process. Fish. Bull. 89:53–60.Manooch, C. S. III, and J. C. Potts.
1997. Age, growth and mortality of greater amberjack fromthe southeastern United States. Fish. Res. 30:229–240.
McFarlane, G. A., and R. J. Beamish.1990. Effect of an external tag on growth of sablefish
(Anoplopoma fimbria), and consequences to mortality andage at maturity. Can. J. Fish. Aquat. Sci. 47:1551–1557.
Mitani, F.1955. Studies on the fishing conditions of some useful fishes
in the western region of Wakasa Bay—11. Relation betweenthe scale of the yellowtail, Seriola quinqueradiata T. & S.,and fork length and age. Bull. Jpn. Soc. Scient. Fish.21:463–466.
1958. Studies on the growth and age of the yellow-tail,Seriola quinqueradiata T. & S., found in Japan and theadjacent region—1. A fundamental consideration on ageestimation by vertebrae. Bull. Jpn. Soc. Scient. Fish.24:626–631.
Mitani, F., and T. Sato.1959. Studies on the growth and age of the yellowtail, Seriola
quinqueradiata T. & S., found in Japan and the adjacent re-gion—11. Estimation of age and growth from the opercularbone. Bull. Jpn. Soc. Scient. Fish. 24:803–808.
Munekiyo, M., M. Sinoda, and O. Sugimura.1982. A possibility of fish age estimation by means of a rep-
lica of the vertebral centrum. Bull. Jpn. Soc. Scient. Fish.48:1371–1374.
Murayama, T.1992. Growth of the yellowtail Seriola quinqueradiata in
the Japan Sea and coast in recent years. Nippon SuisanGakkaishi 58:601–609.
Pepperell, J. G.1985. Cooperative game fish tagging in the Indo-Pacific
region. In R. H. Stroud (ed.), World angling resources andchallenges, p. 241–252. International Game Fish Asso-ciation, Fort Lauderdale, Florida.
1990. Australian cooperative game-fish tagging program,1973–1987: status and evaluation of tags. Am. Fish. Soc.Symp. 7:765–774.
Richards, L. J., J. T. Schnute, A. R. Kronlund, andR. J. Beamish.
1992. Statistical models for the analysis of ageing error.Can. J. Fish. Aquat. Sci. 49:1801–1815.
Schnute, J.1981. A versatile growth model with statistically stable
parameters. Can. J. Fish. Aquat. Sci. 38:1128–1140.Simkiss, K.
1974. Calcium metabolism of fish in relation to ageing. InT. B. Bagenal (ed.), The ageing of fish, p. 1–12. UnwinBrothers Ltd, London, 234 p.