07-05-20 Restoring Prosperity-OH - University of Cincinnati · The Restoring Prosperity Initiative...
67
Transcript of 07-05-20 Restoring Prosperity-OH - University of Cincinnati · The Restoring Prosperity Initiative...
Restoring ProsperityThe State Role in Revitalizing America’s Older Industrial Cities
What are the findings of the report?II
How can states restore prosperity to older industrial cities?III
What is the Restoring Prosperity Initiative?I

The Restoring Prosperity Initiative has developed an empirically-based inventory of struggling older industrial cities
by josephpetepickle

Cleveland
Detroit
Based on this research, the Initiative proposes a policy agenda for revitalizing older industrial cities
Hartford by ChadBriggs
Milwaukee
by c
ompu
jera
mey
In the coming months and years, we will help to organize a network of state and local reformers in target states to advance this agenda
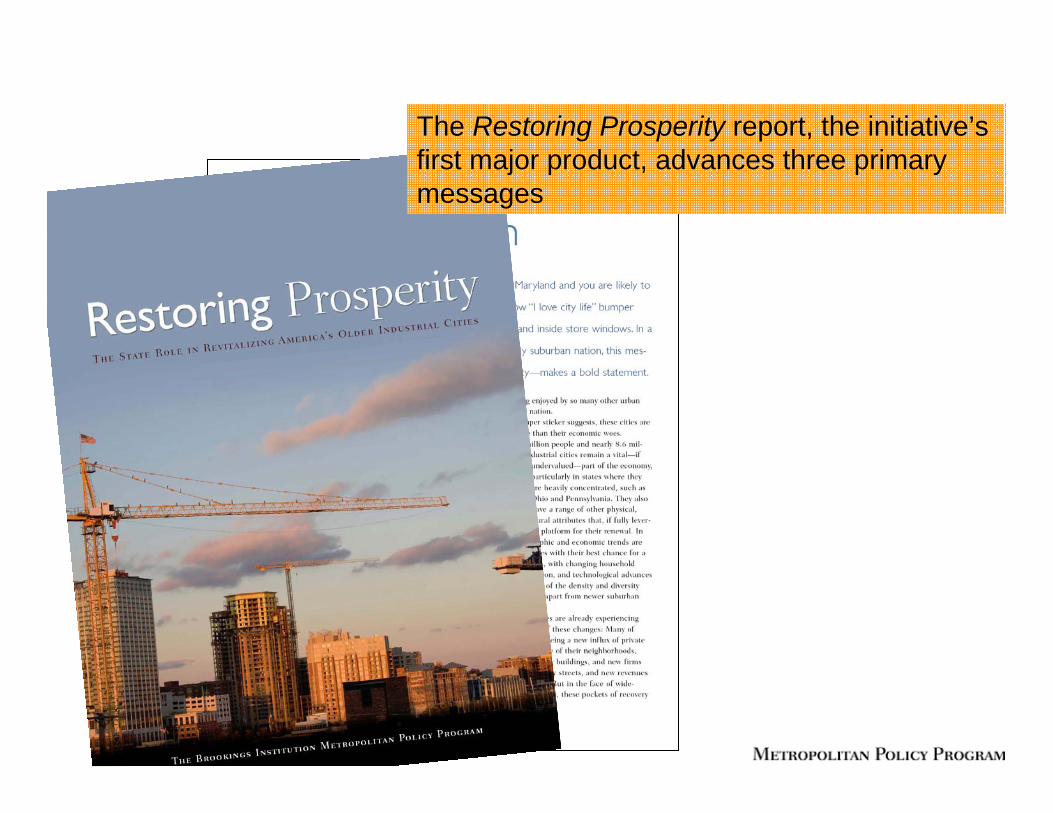
The Restoring Prosperity report, the initiative’s first major product, advances three primary messages
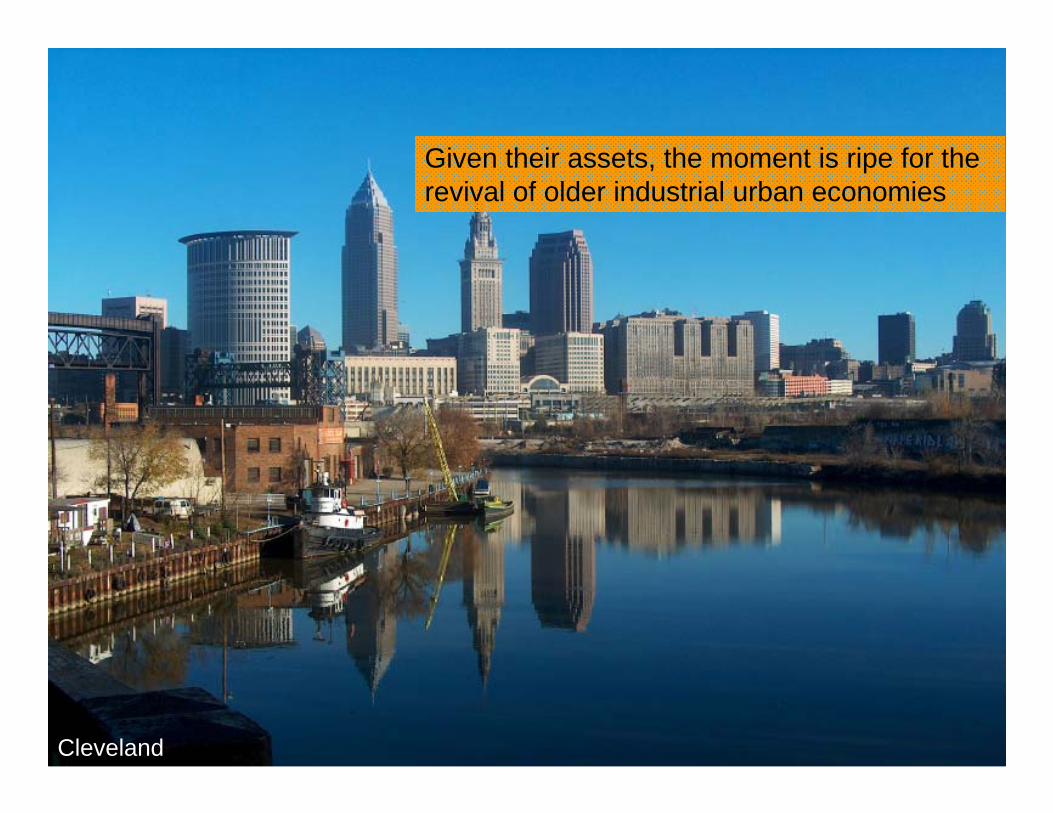
Given their assets, the moment is ripe for the revival of older industrial urban economies
Cleveland
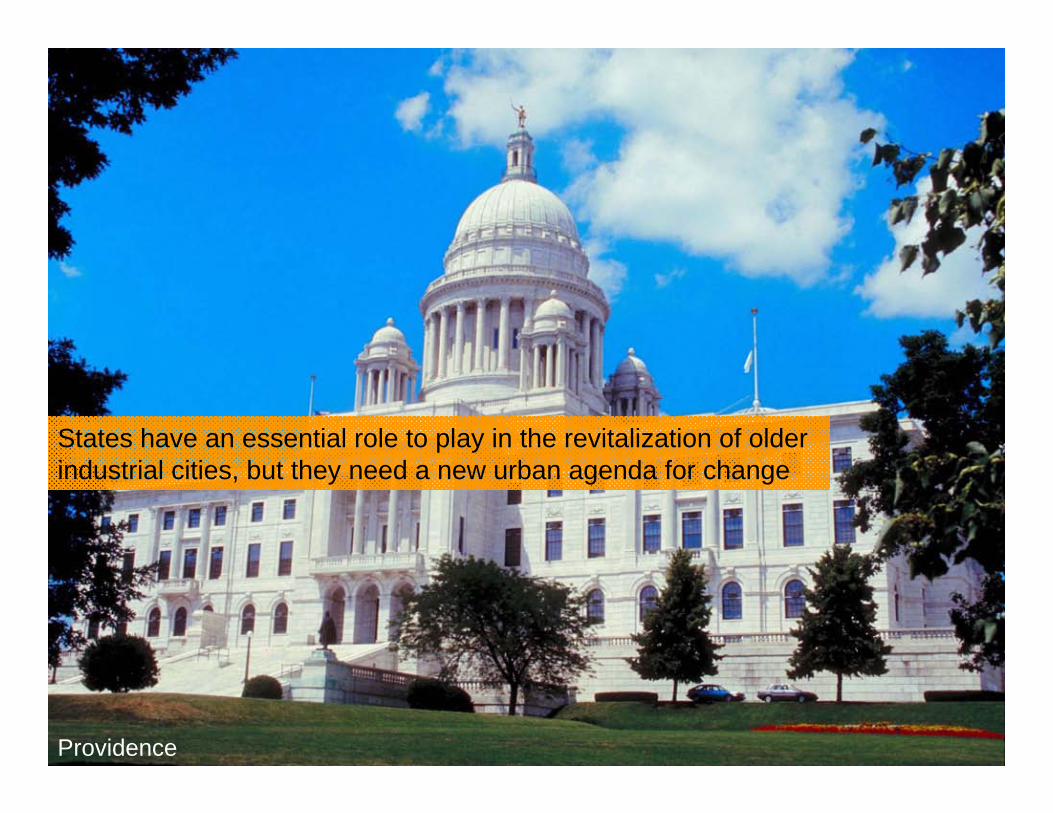
States have an essential role to play in the revitalization of older industrial cities, but they need a new urban agenda for change
Providence
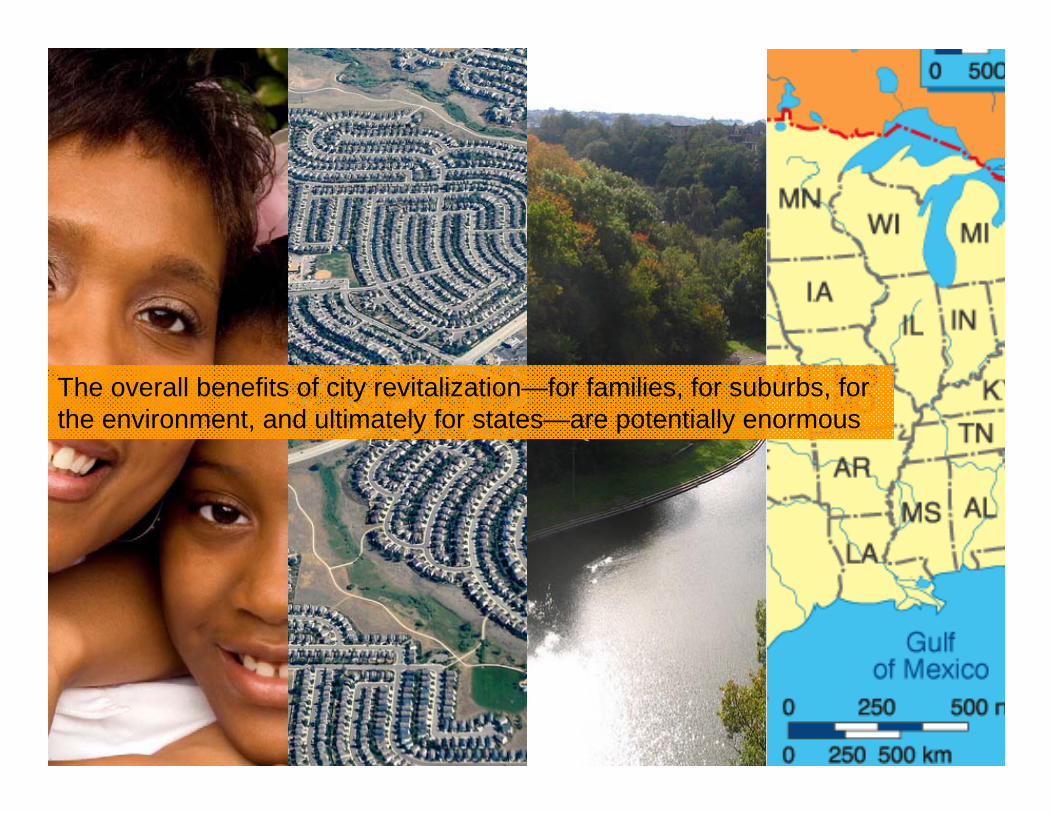
The overall benefits of city revitalization—for families, for suburbs, for the environment, and ultimately for states—are potentially enormous
What are the findings of the report?II
How can states restore prosperity to older industrial cities?III
What is the Restoring Prosperity Initiative?I

What are the findings of the report?I
Several forces are contributing to the underperformance of these cities
We have identified 65 cities in 24 states that are underperforming economically
But, the moment is right for change
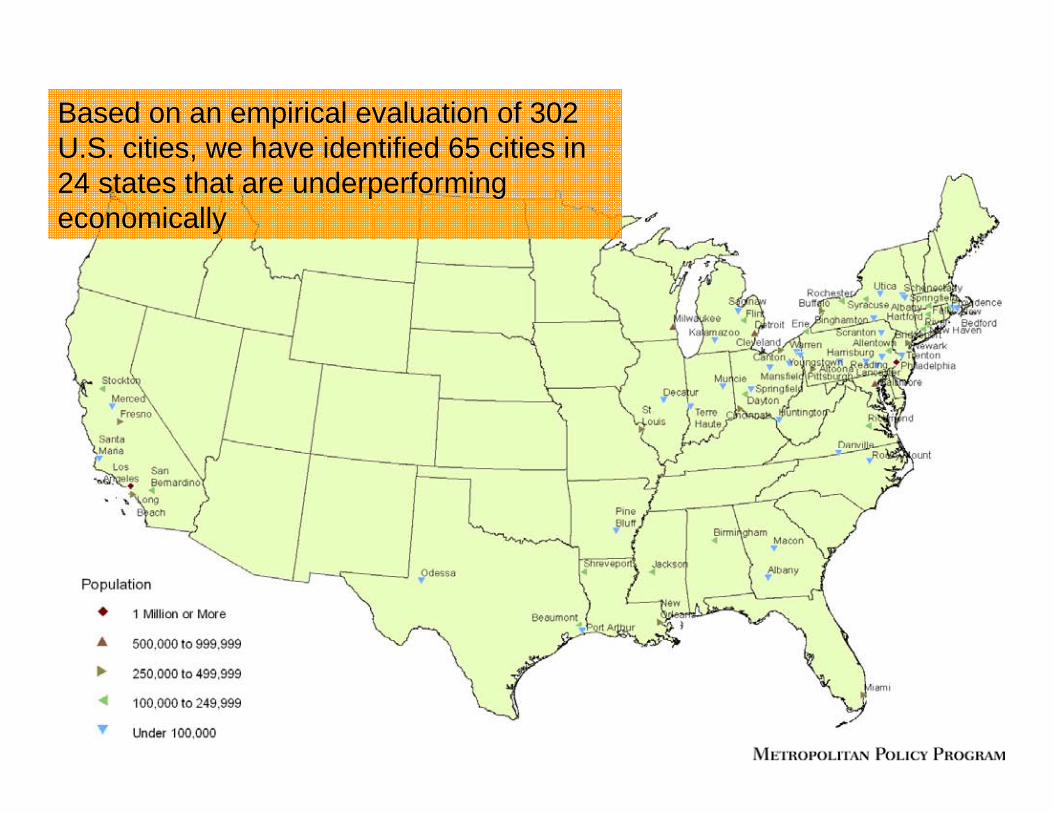
Based on an empirical evaluation of 302 U.S. cities, we have identified 65 cities in 24 states that are underperforming economically
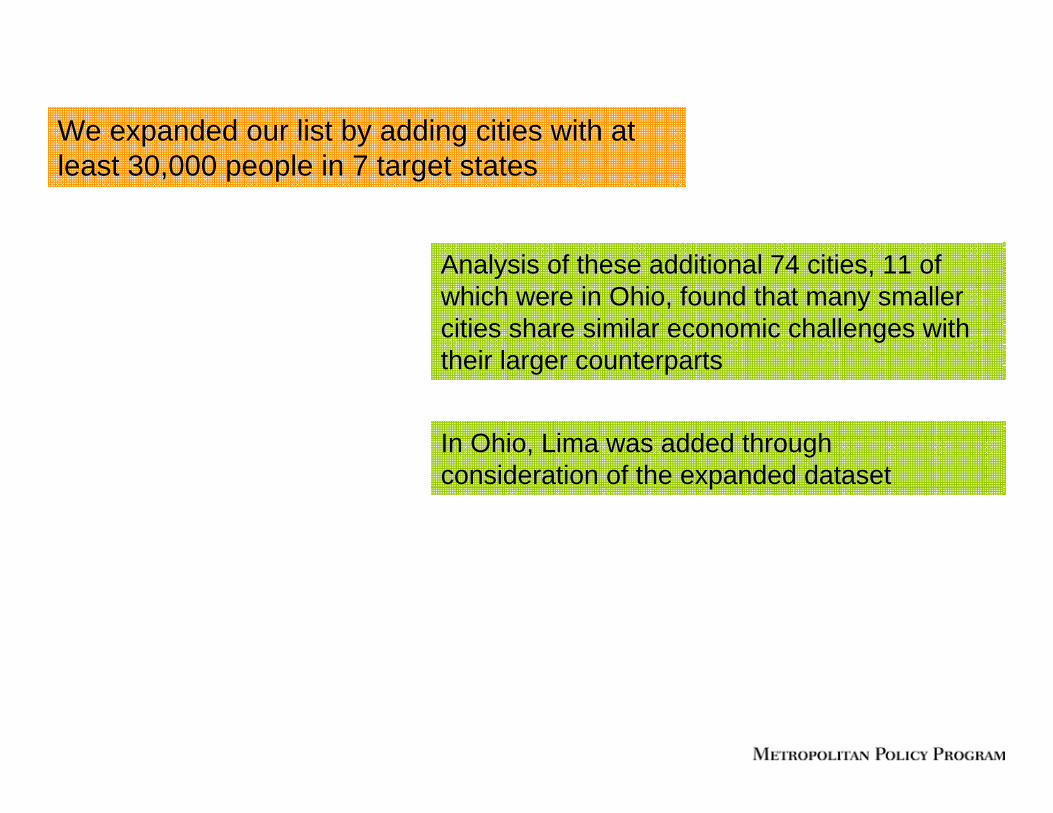
We expanded our list by adding cities with at least 30,000 people in 7 target states
Analysis of these additional 74 cities, 11 of which were in Ohio, found that many smaller cities share similar economic challenges with their larger counterparts
In Ohio, Lima was added through consideration of the expanded dataset

In all, 9 of the 22 cities in Ohio examined for this analysis are struggling

Eight of Ohio’s nine older industrial cities—all but Cincinnati—are located in “weak” metropolitan areas
Canton, Cleveland, Dayton, Lima, Mansfield, Springfield, Warren, and Youngstown are located in economically struggling MSAs
All told, nearly 4.8 million people—42 percent of the state’s total population—were living ineconomically anemic communities in 2000
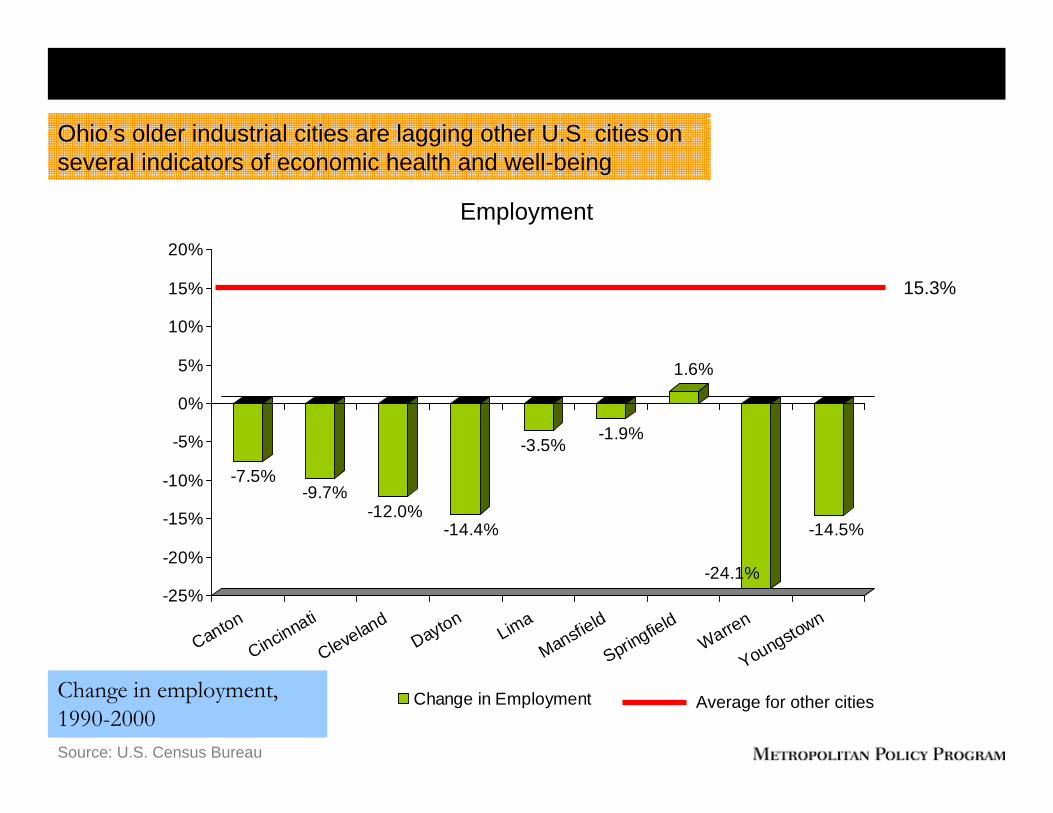
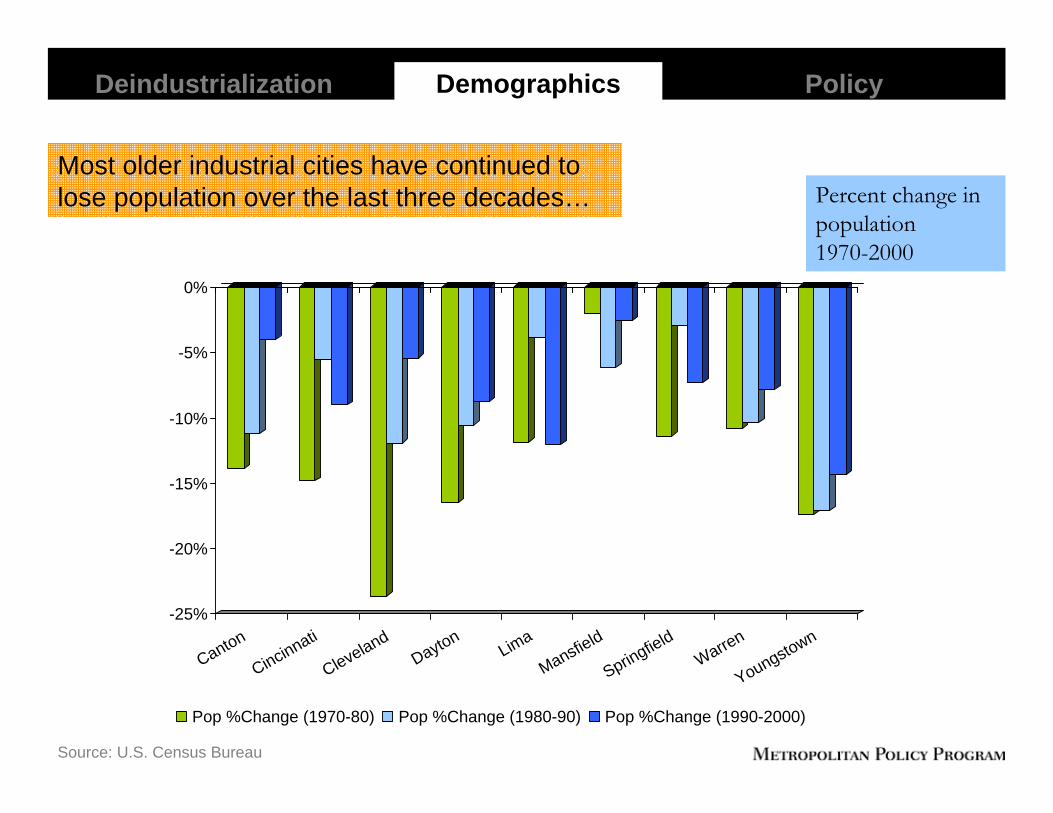
-7.5%-9.7%
-12.0%-14.4%
-3.5%-1.9%
1.6%
-24.1%
-14.5%
-25%
-20%
-15%
-10%
-5%
0%
5%
10%
15%
20%
Canton
Cincinnati
ClevelandDayton
Lima
Mansfield
SpringfieldWarren
Youngstown
Change in Employment
Ohio’s older industrial cities are lagging other U.S. cities on several indicators of economic health and well-being
Change in employment, 1990-2000
Employment
Source: U.S. Census Bureau
15.3%
Average for other cities
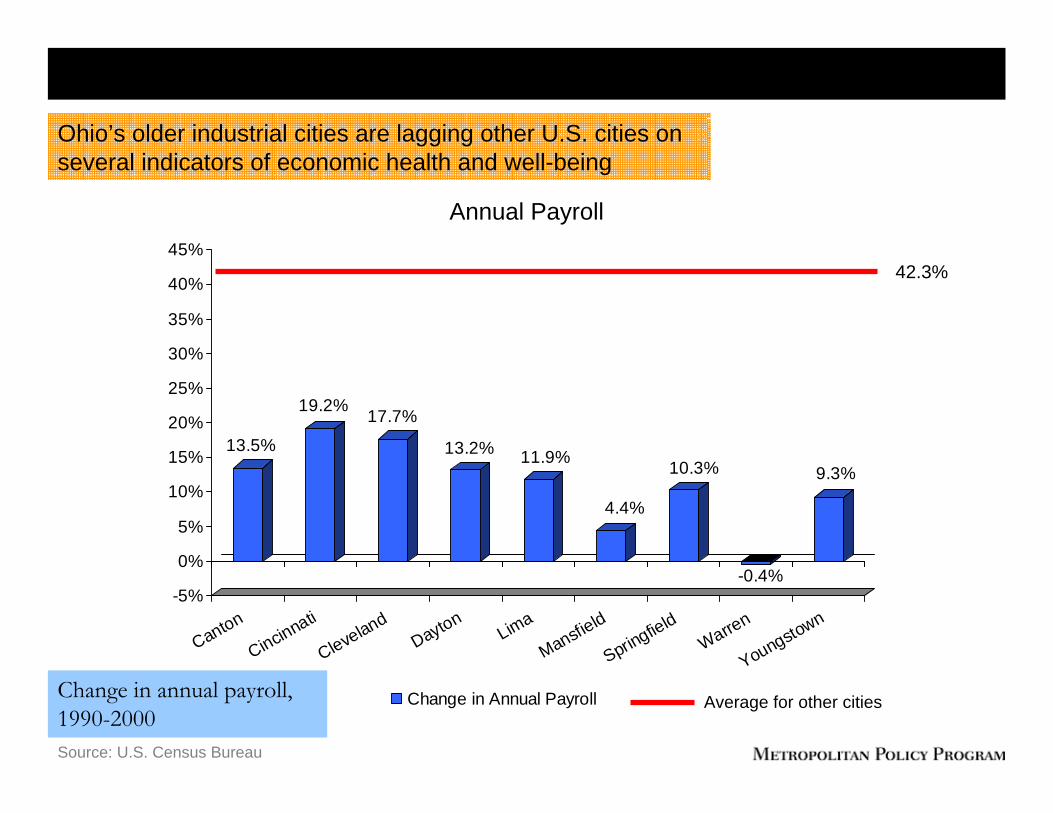
13.5%
19.2% 17.7%
13.2% 11.9%
4.4%
10.3%
-0.4%
9.3%
-5%
0%
5%
10%
15%
20%
25%
30%
35%
40%
45%
Canton
Cincinnati
ClevelandDayton
Lima
Mansfield
SpringfieldWarren
Youngstown
Change in Annual PayrollChange in annual payroll, 1990-2000
Annual Payroll
Source: U.S. Census Bureau
42.3%
Average for other cities
Ohio’s older industrial cities are lagging other U.S. cities on several indicators of economic health and well-being
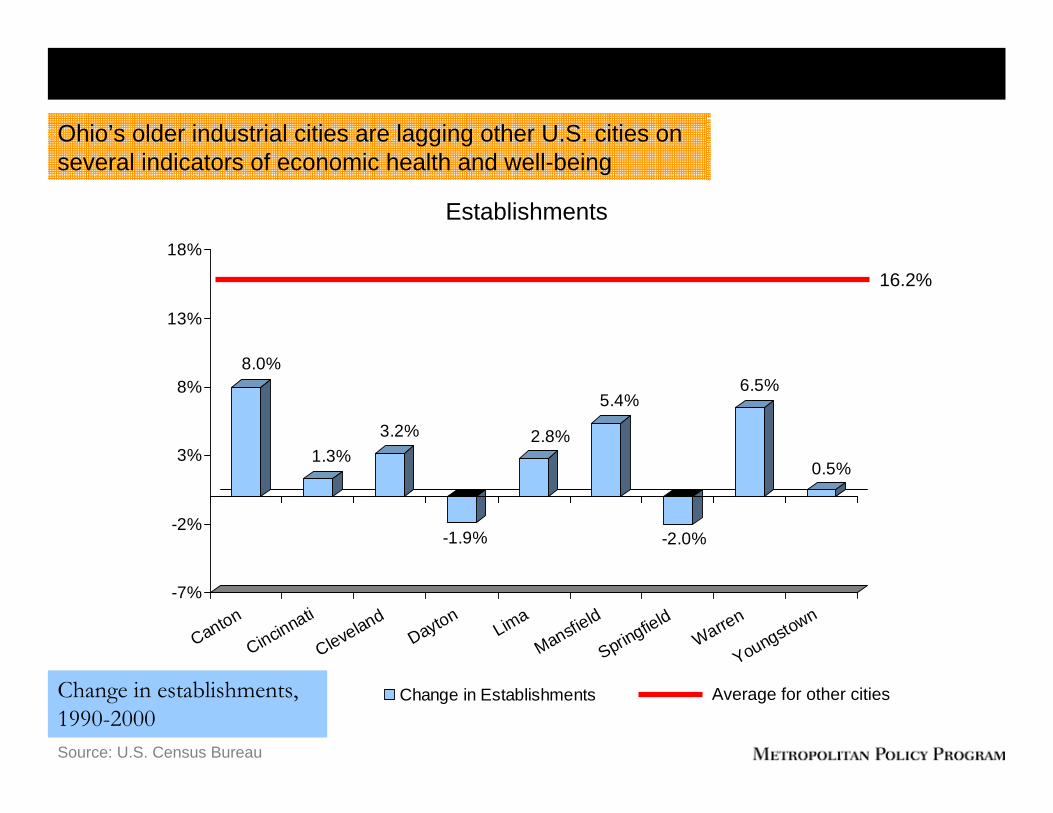
8.0%
1.3%3.2%
-1.9%
2.8%
5.4%
-2.0%
6.5%
0.5%
-7%
-2%
3%
8%
13%
18%
Canton
Cincinnati
ClevelandDayton
Lima
Mansfield
SpringfieldWarren
Youngstown
Change in EstablishmentsChange in establishments, 1990-2000
Establishments
Source: U.S. Census Bureau
16.2%
Average for other cities
Ohio’s older industrial cities are lagging other U.S. cities on several indicators of economic health and well-being
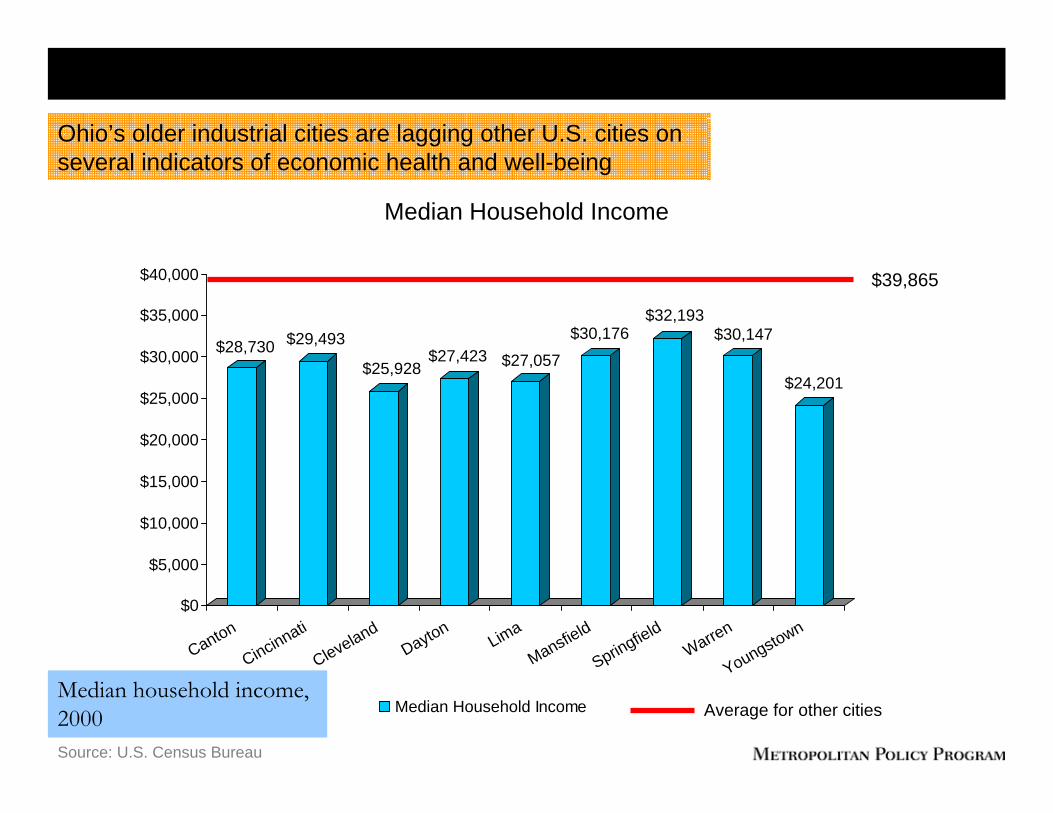
$28,730 $29,493
$25,928$27,423 $27,057
$30,176$32,193
$30,147
$24,201
$0
$5,000
$10,000
$15,000
$20,000
$25,000
$30,000
$35,000
$40,000
Canton
Cincinnati
ClevelandDayton
Lima
Mansfield
SpringfieldWarren
Youngstown
Median Household IncomeMedian household income, 2000
Median Household Income
Source: U.S. Census Bureau
$39,865
Average for other cities
Ohio’s older industrial cities are lagging other U.S. cities on several indicators of economic health and well-being
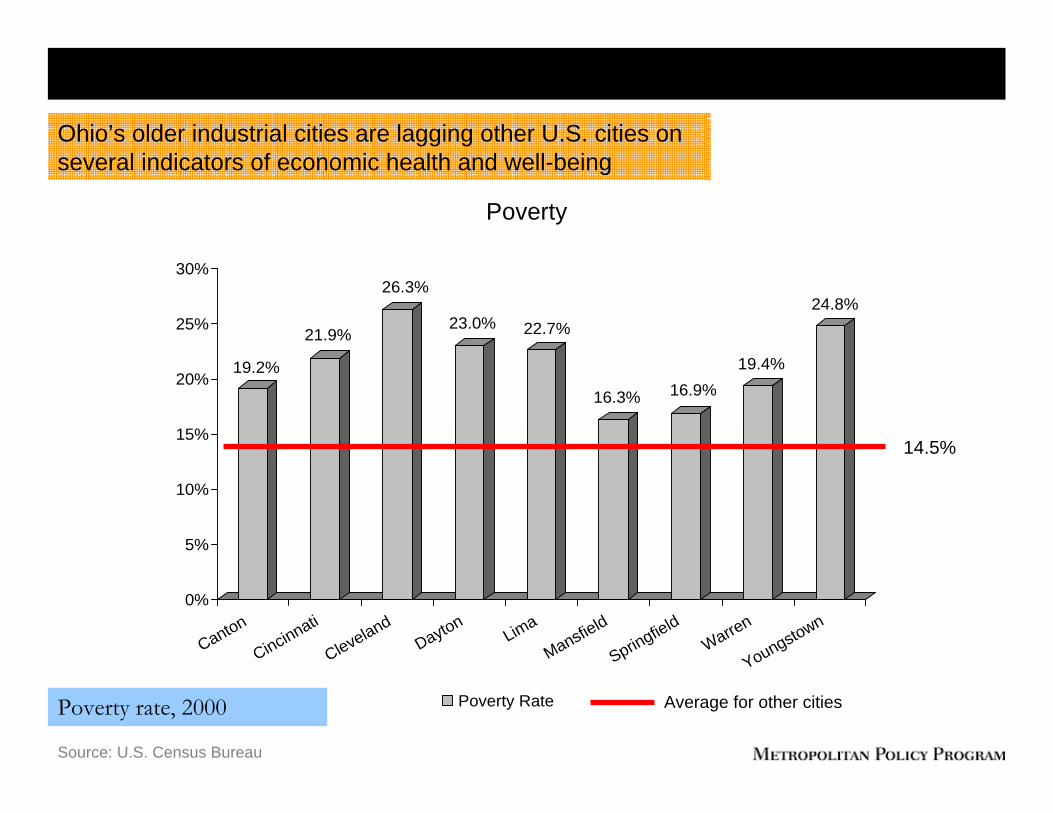
19.2%
21.9%
26.3%
23.0% 22.7%
16.3% 16.9%19.4%
24.8%
0%
5%
10%
15%
20%
25%
30%
Canton
Cincinnati
ClevelandDayton
Lima
Mansfield
SpringfieldWarren
Youngstown
Poverty RatePoverty rate, 2000
Poverty
Source: U.S. Census Bureau
14.5%
Average for other cities
Ohio’s older industrial cities are lagging other U.S. cities on several indicators of economic health and well-being

Since 2000, these trends have continued
On average, Ohio’s older industrial cities have experienced a 9.8 percent decline in annual payroll, while other U.S. cities have grown 2 percent since 2000
All of Ohio’s older industrial cities have lost establishments since 2000, averaging a decline of 2.2 percent, compared to 4 percent growth in other cities
In 2005, the poverty rate exceeded 30 percent in Cleveland, and 25 percent in Canton, Cincinnati, and Dayton
What are the findings of the report?I
Several forces are contributing to the underperformance of these cities
We have identified 65 cities in 24 states that are underperforming economically
But, the moment is right for change
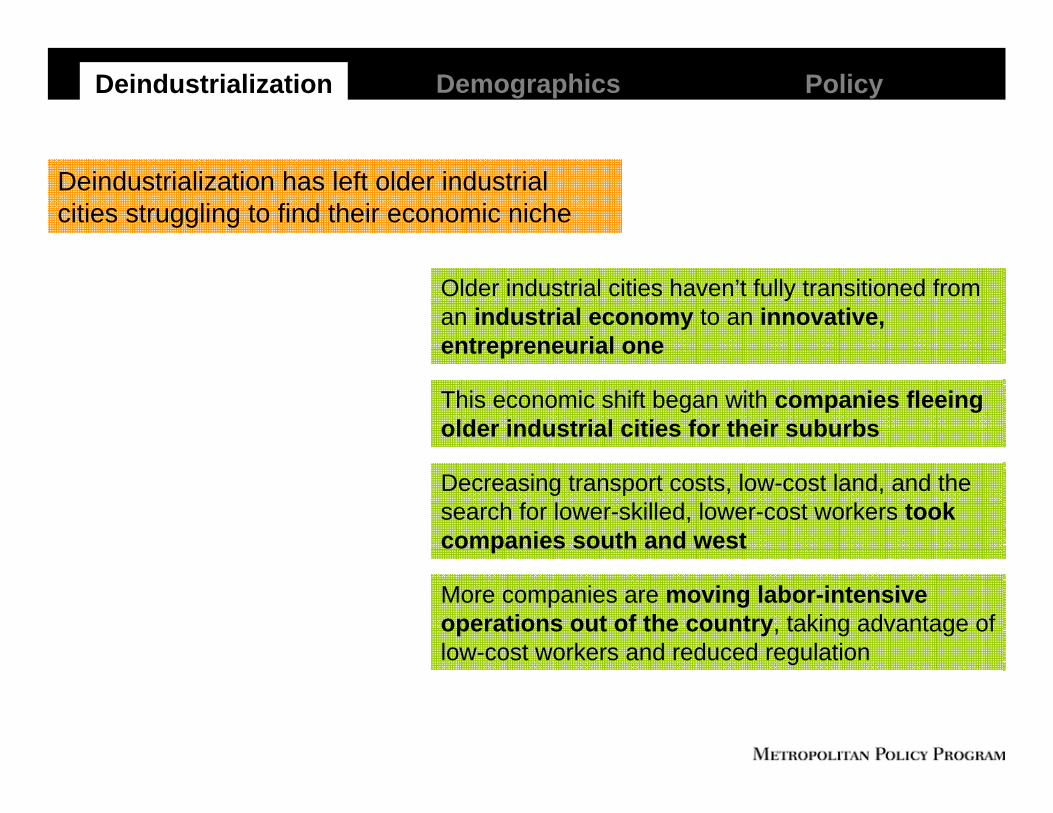
Deindustrialization Demographics Policy
Deindustrialization has left older industrial cities struggling to find their economic niche
Older industrial cities haven’t fully transitioned from an industrial economy to an innovative, entrepreneurial one
This economic shift began with companies fleeing older industrial cities for their suburbs
Decreasing transport costs, low-cost land, and the search for lower-skilled, lower-cost workers took companies south and west
More companies are moving labor-intensive operations out of the country, taking advantage of low-cost workers and reduced regulation
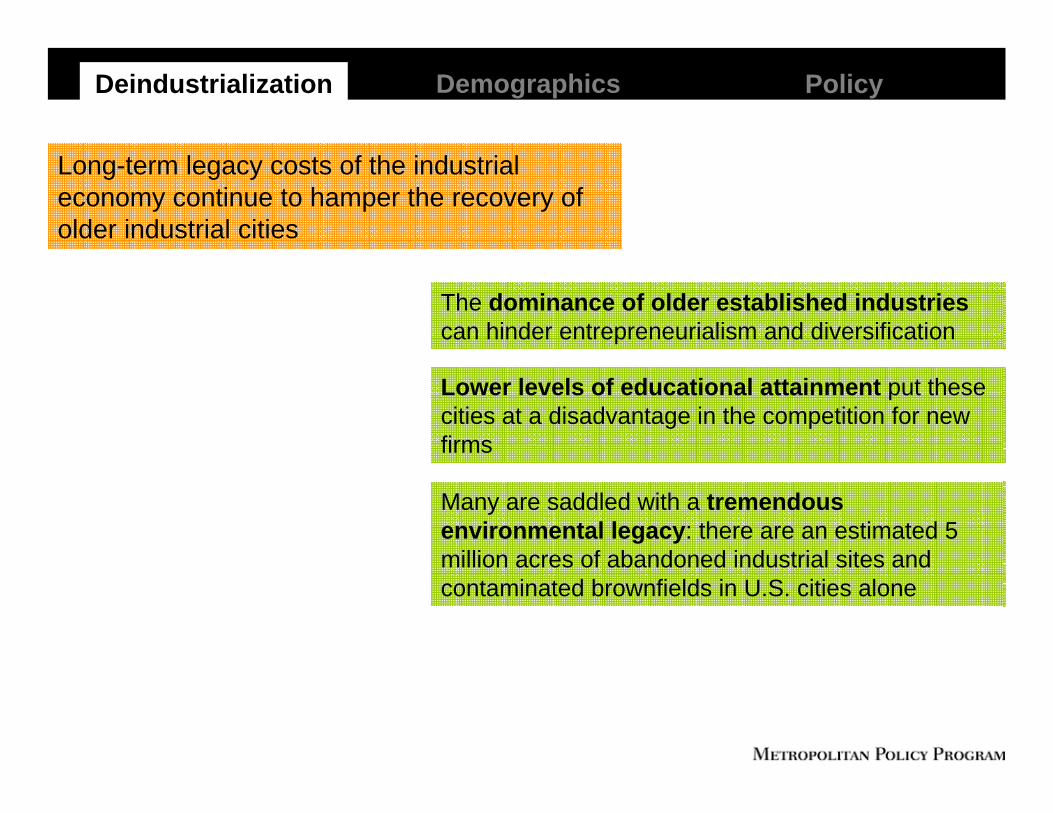
Deindustrialization Demographics Policy
Long-term legacy costs of the industrial economy continue to hamper the recovery of older industrial cities
The dominance of older established industriescan hinder entrepreneurialism and diversification
Lower levels of educational attainment put these cities at a disadvantage in the competition for new firms
Many are saddled with a tremendous environmental legacy: there are an estimated 5 million acres of abandoned industrial sites and contaminated brownfields in U.S. cities alone
Deindustrialization Demographics Policy
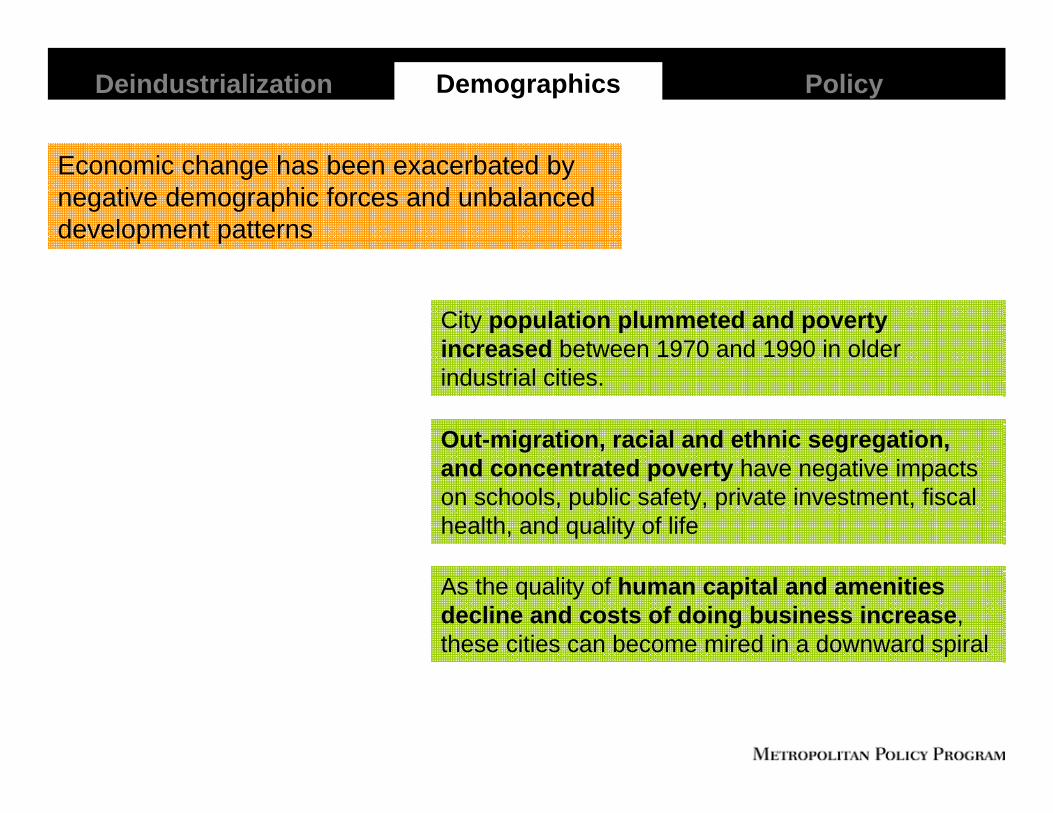
Economic change has been exacerbated by negative demographic forces and unbalanced development patterns
City population plummeted and poverty increased between 1970 and 1990 in older industrial cities.
Out-migration, racial and ethnic segregation, and concentrated poverty have negative impacts on schools, public safety, private investment, fiscal health, and quality of life
As the quality of human capital and amenities decline and costs of doing business increase, these cities can become mired in a downward spiral
Deindustrialization Demographics Policy
Percent change in population1970-2000
Source: U.S. Census Bureau
Most older industrial cities have continued to lose population over the last three decades…
-25%
-20%
-15%
-10%
-5%
0%
Canton
Cincinnati
ClevelandDayton
Lima
Mansfield
SpringfieldWarren
Youngstown
Pop %Change (1970-80) Pop %Change (1980-90) Pop %Change (1990-2000)
Deindustrialization Demographics Policy
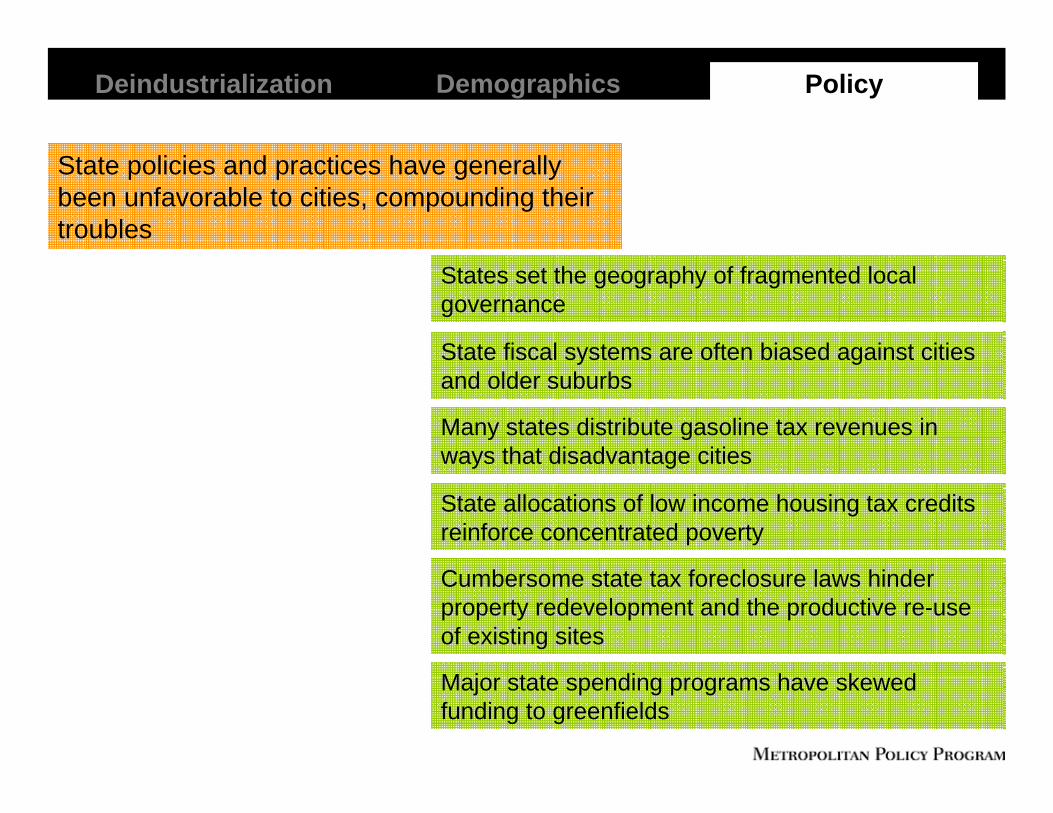
State policies and practices have generally been unfavorable to cities, compounding their troubles
States set the geography of fragmented local governance
State fiscal systems are often biased against cities and older suburbs
Many states distribute gasoline tax revenues in ways that disadvantage cities
State allocations of low income housing tax credits reinforce concentrated poverty
Cumbersome state tax foreclosure laws hinder property redevelopment and the productive re-use of existing sites
Major state spending programs have skewed funding to greenfields
Deindustrialization Demographics Policy
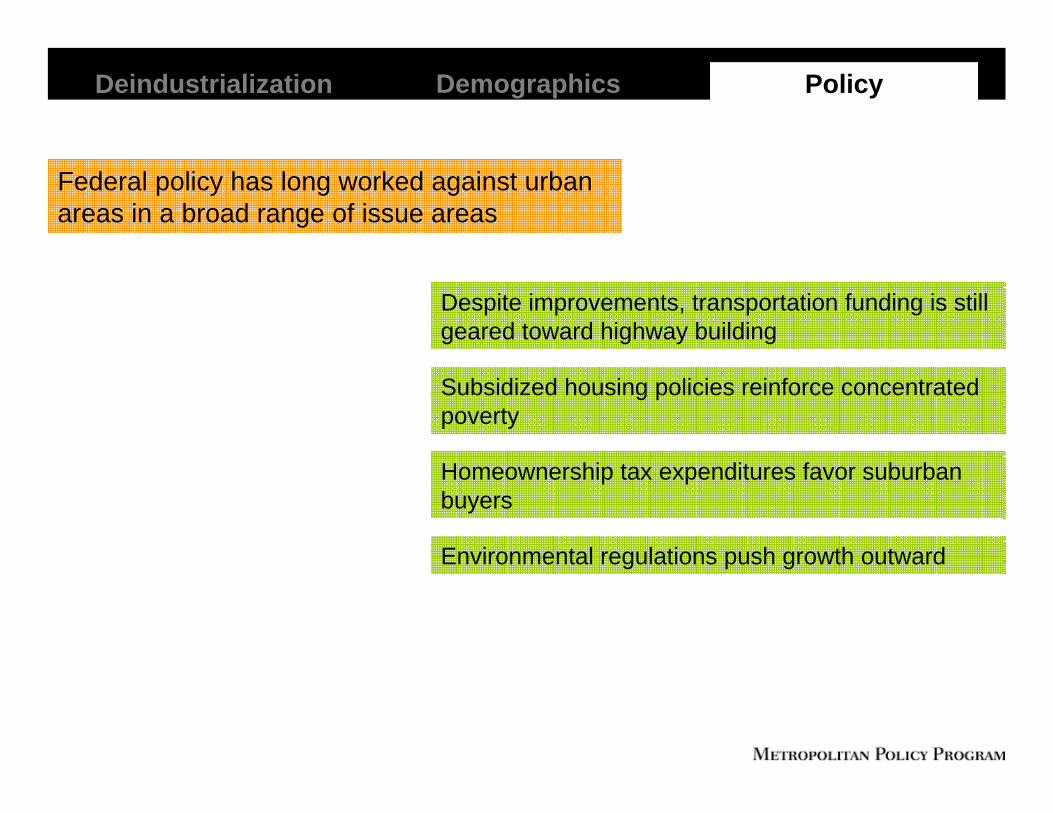
Federal policy has long worked against urban areas in a broad range of issue areas
Despite improvements, transportation funding is still geared toward highway building
Subsidized housing policies reinforce concentrated poverty
Homeownership tax expenditures favor suburban buyers
Environmental regulations push growth outward
Deindustrialization Demographics Policy
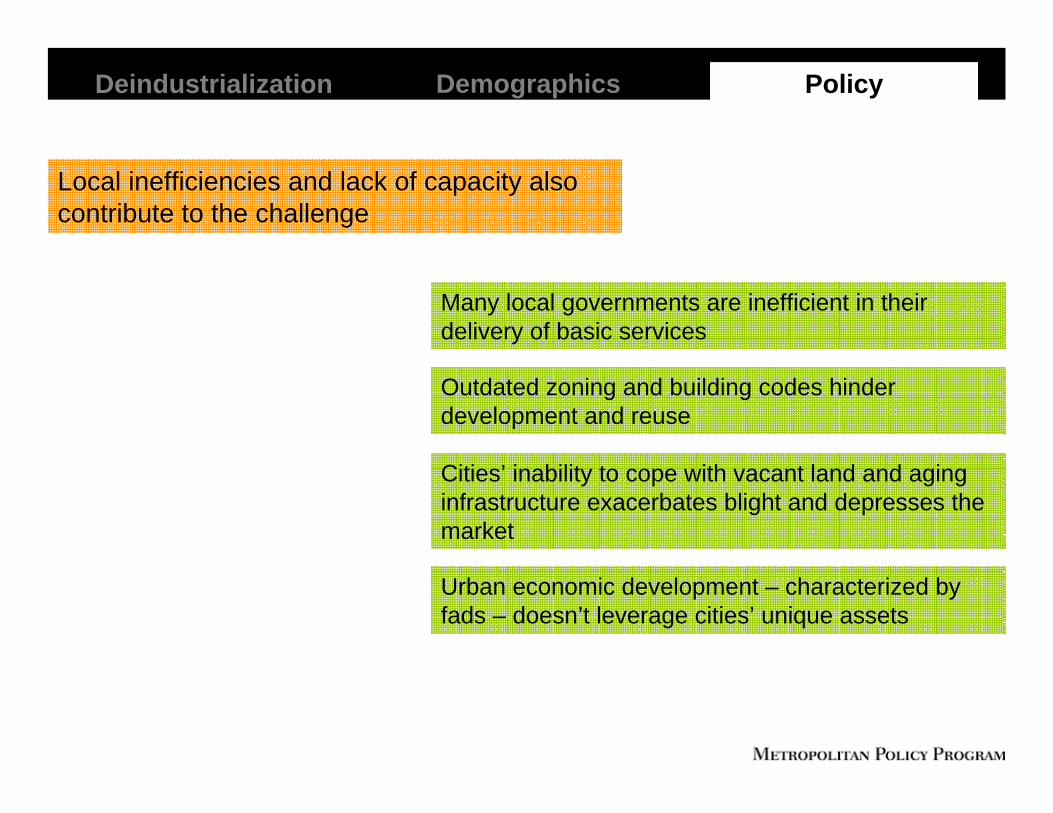
Local inefficiencies and lack of capacity also contribute to the challenge
Many local governments are inefficient in their delivery of basic services
Outdated zoning and building codes hinder development and reuse
Cities’ inability to cope with vacant land and aging infrastructure exacerbates blight and depresses the market
Urban economic development – characterized by fads – doesn’t leverage cities’ unique assets
What are the findings of the report?I
Several forces are contributing to the underperformance of these cities
We have identified 65 cities in 24 states that are underperforming economically
But, the moment is right for change
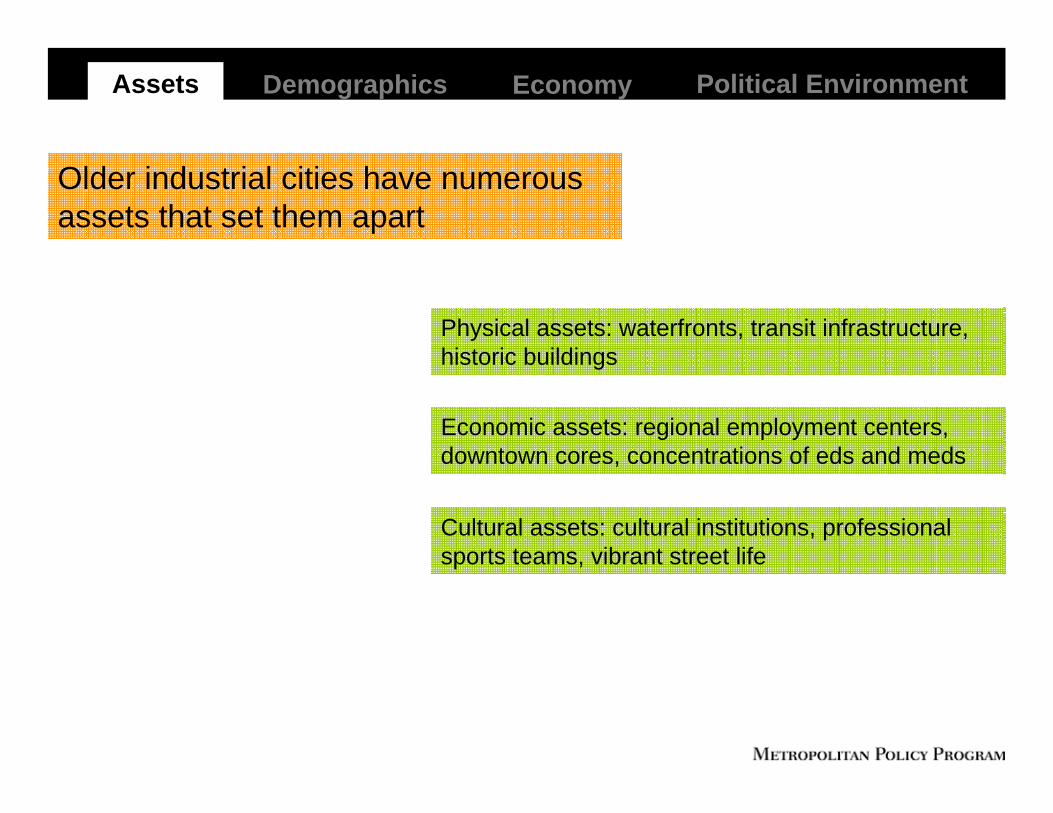
Older industrial cities have numerous assets that set them apart
Cultural assets: cultural institutions, professional sports teams, vibrant street life
Economic assets: regional employment centers, downtown cores, concentrations of eds and meds
Physical assets: waterfronts, transit infrastructure, historic buildings
Assets Demographics Political EnvironmentEconomy
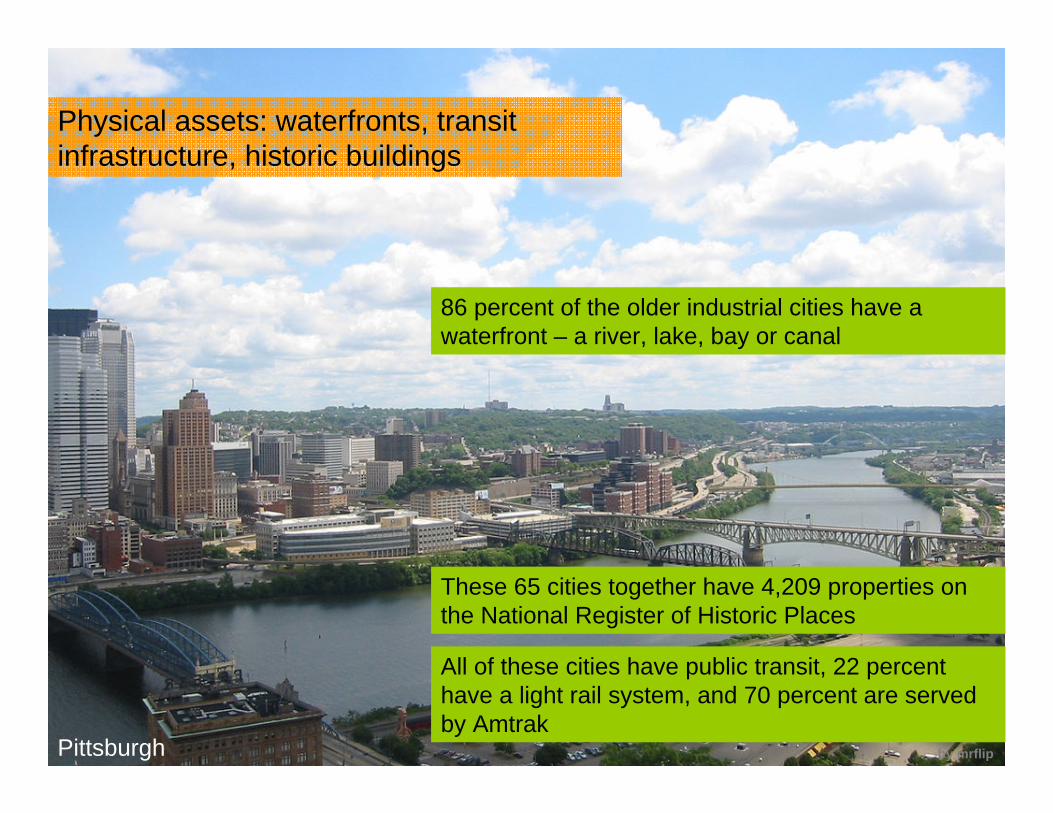
86 percent of the older industrial cities have a waterfront – a river, lake, bay or canal
All of these cities have public transit, 22 percent have a light rail system, and 70 percent are served by Amtrak
These 65 cities together have 4,209 properties on the National Register of Historic Places
Physical assets: waterfronts, transit infrastructure, historic buildings
Pittsburgh by mrflip
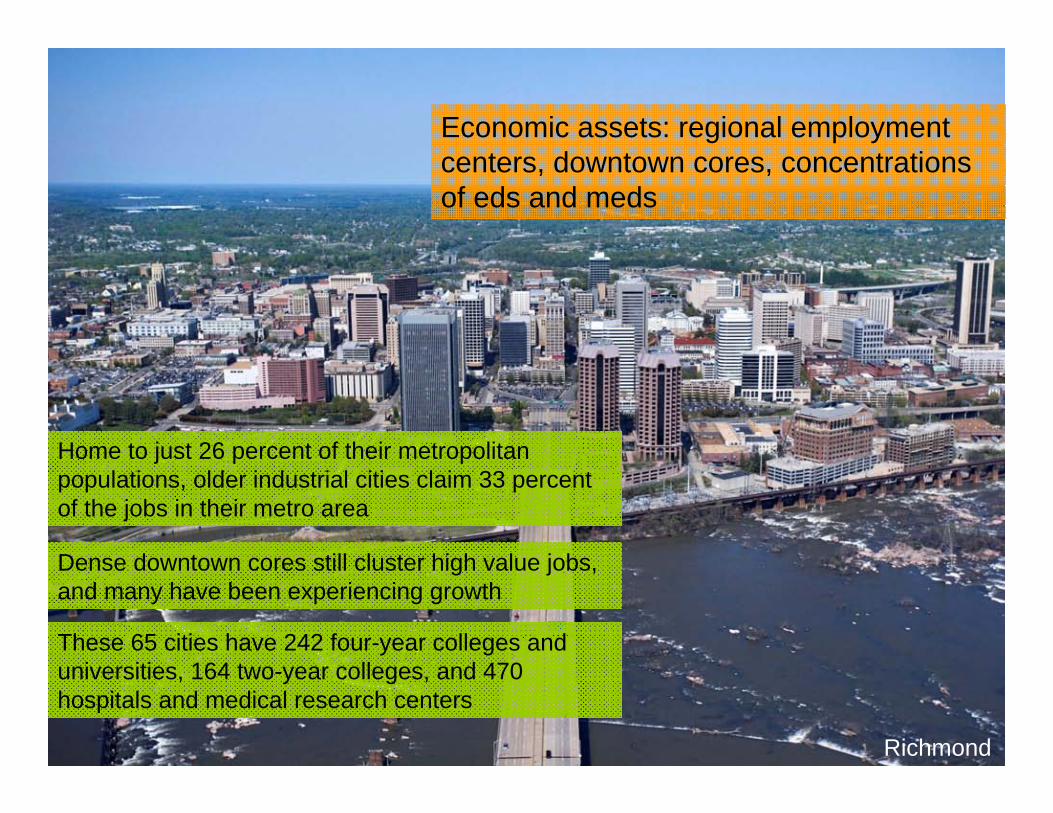
Economic assets: regional employment centers, downtown cores, concentrations of eds and meds
Home to just 26 percent of their metropolitan populations, older industrial cities claim 33 percent of the jobs in their metro area
Dense downtown cores still cluster high value jobs, and many have been experiencing growth
These 65 cities have 242 four-year colleges and universities, 164 two-year colleges, and 470 hospitals and medical research centers
Richmond
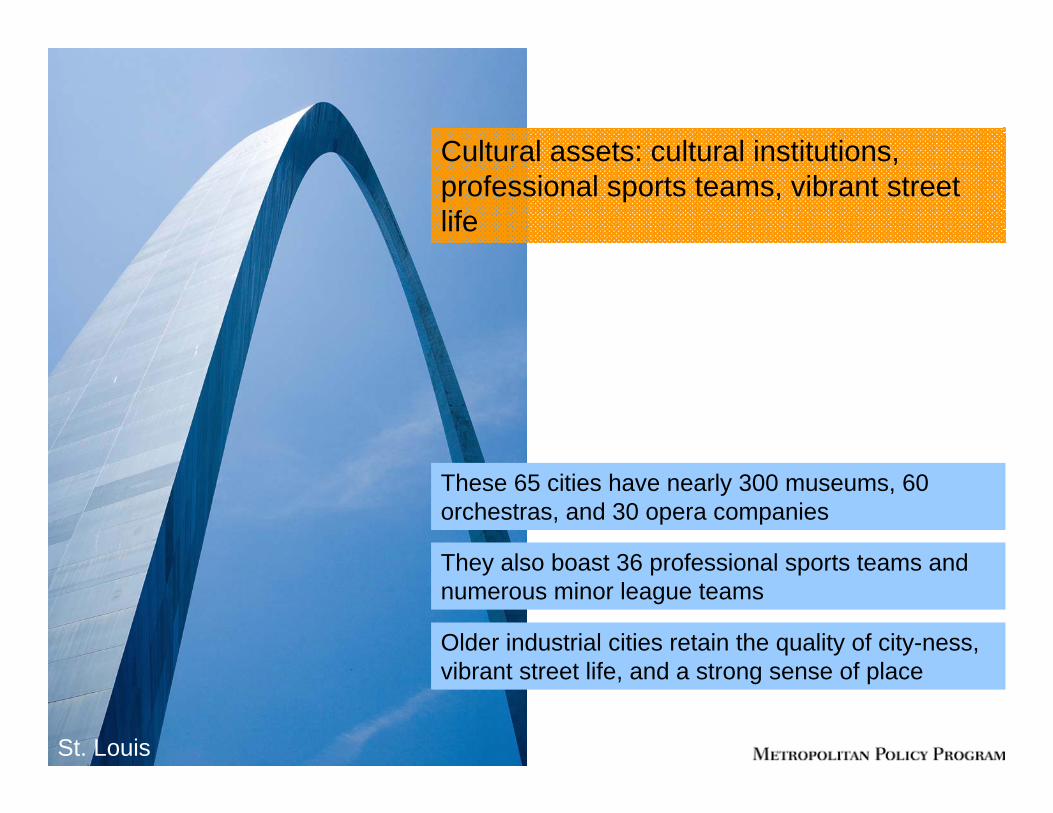
Cultural assets: cultural institutions, professional sports teams, vibrant street life
These 65 cities have nearly 300 museums, 60 orchestras, and 30 opera companies
They also boast 36 professional sports teams and numerous minor league teams
Older industrial cities retain the quality of city-ness, vibrant street life, and a strong sense of place
St. Louis
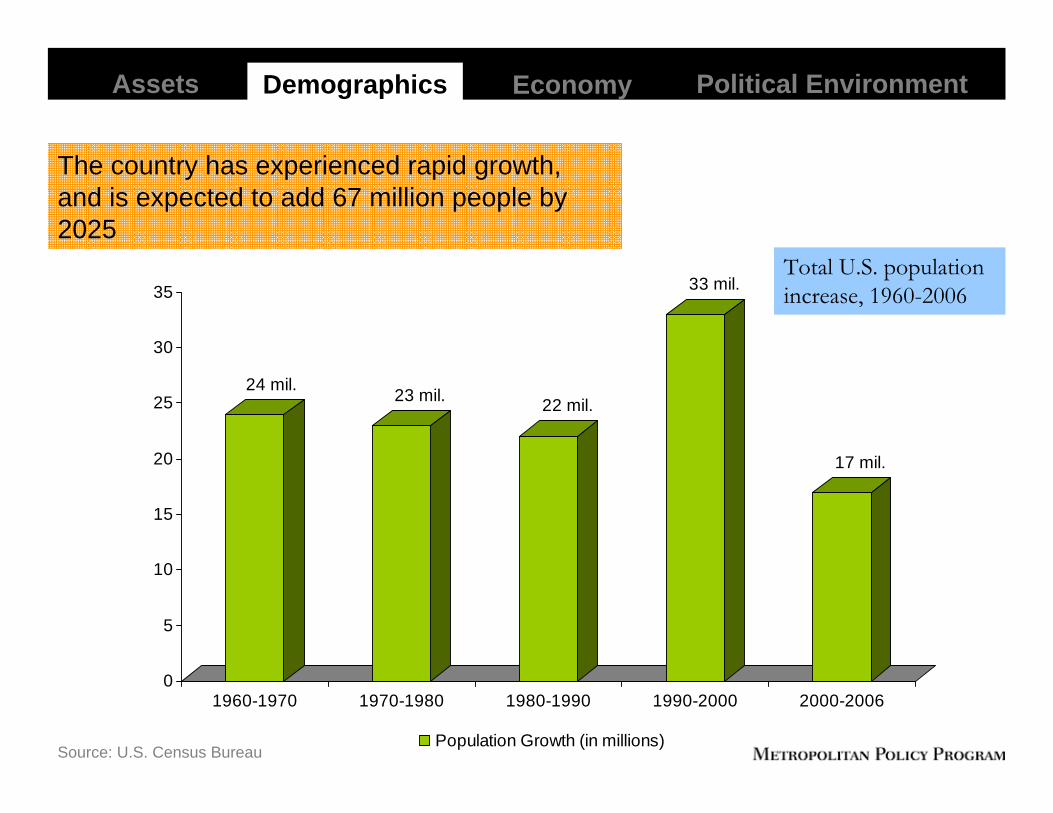
Total U.S. population increase, 1960-2006
Source: U.S. Census Bureau
The country has experienced rapid growth, and is expected to add 67 million people by 2025
24 mil. 23 mil. 22 mil.
33 mil.
17 mil.
0
5
10
15
20
25
30
35
1960-1970 1970-1980 1980-1990 1990-2000 2000-2006
Population Growth (in millions)
Assets Demographics Political EnvironmentEconomy
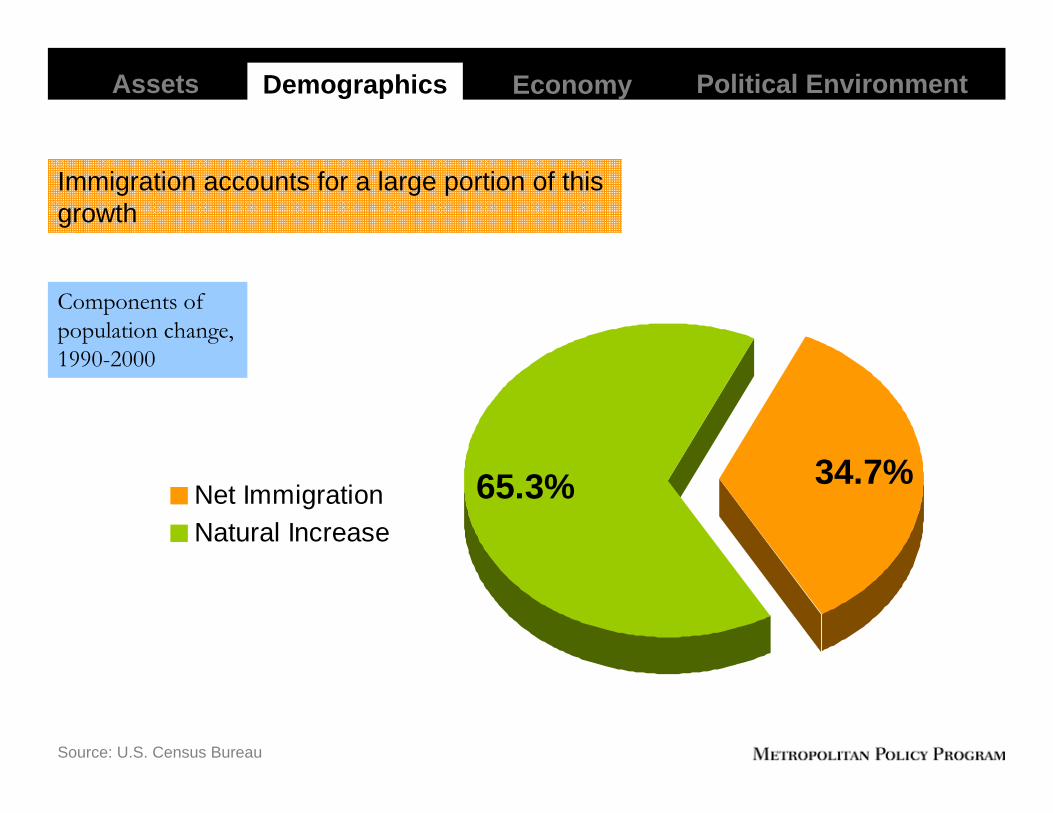
65.3% 34.7%Net ImmigrationNatural Increase
Components of population change,1990-2000
Source: U.S. Census Bureau
Immigration accounts for a large portion of this growth
Assets Demographics Political EnvironmentEconomy
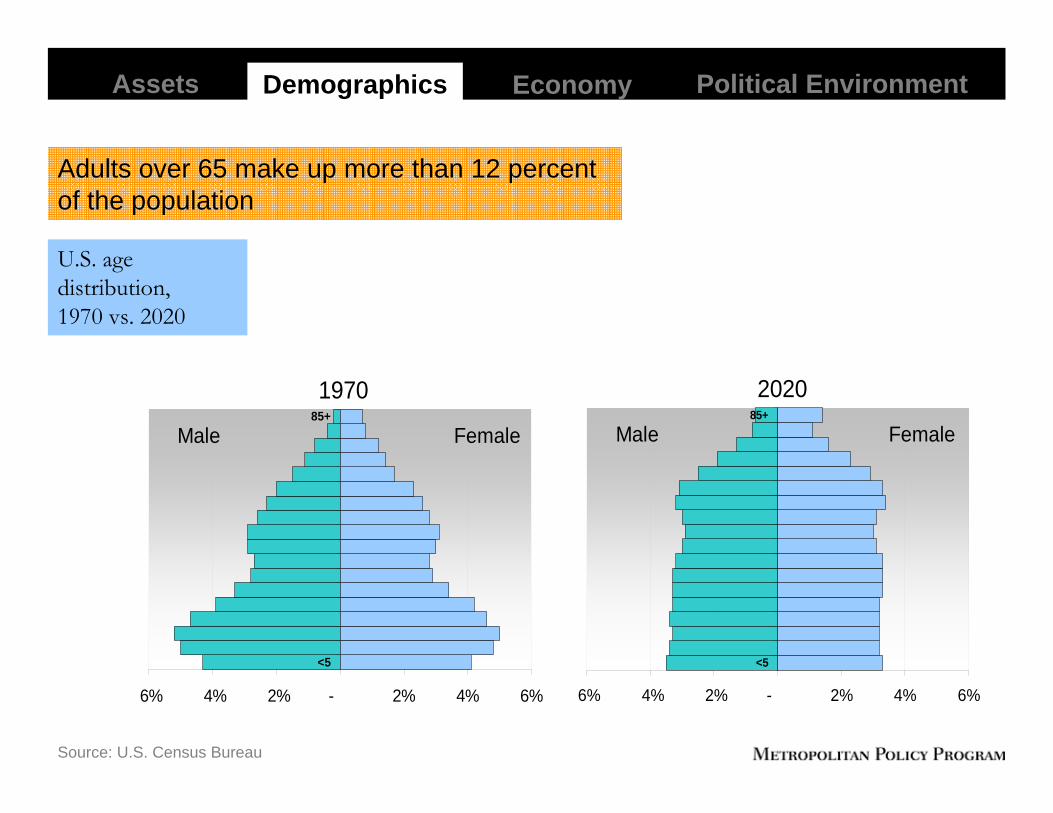
1970
6% 4% 2% - 2% 4% 6%
<5
85+
Male Female
2020
6% 4% 2% - 2% 4% 6%
<5
85+
Male Female
U.S. age distribution, 1970 vs. 2020
Source: U.S. Census Bureau
Adults over 65 make up more than 12 percent of the population
Assets Demographics Political EnvironmentEconomy
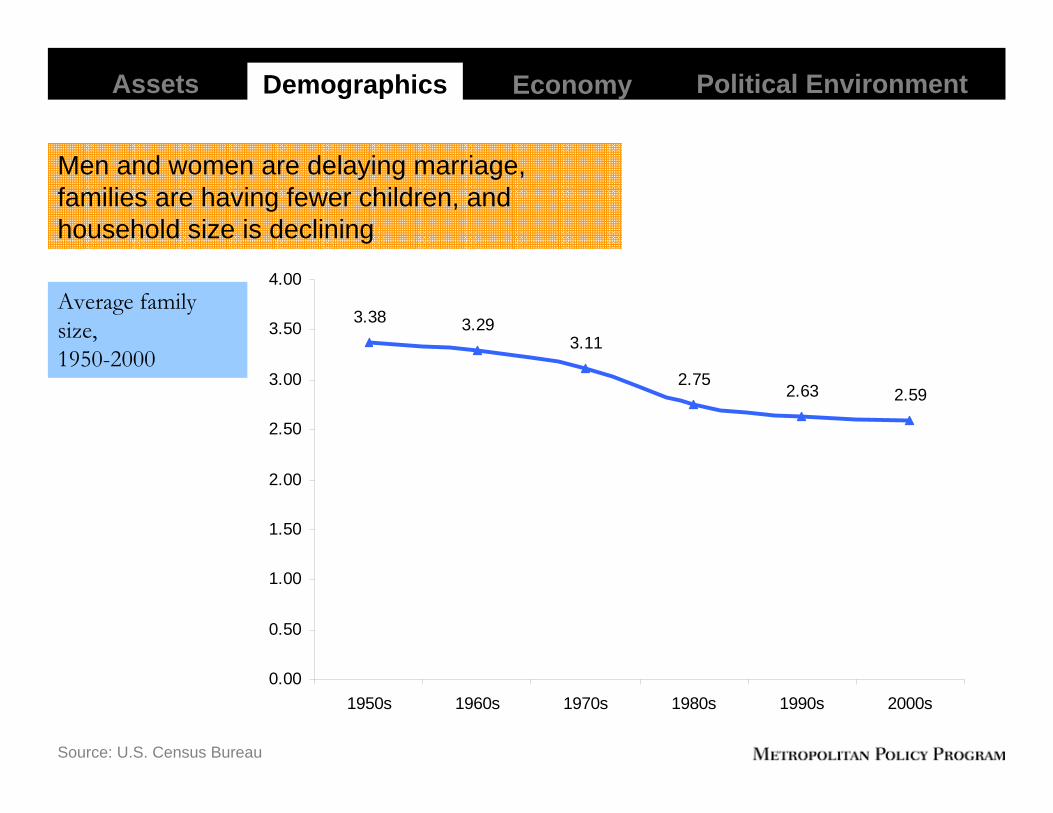
3.38 3.293.11
2.752.63 2.59
0.00
0.50
1.00
1.50
2.00
2.50
3.00
3.50
4.00
1950s 1960s 1970s 1980s 1990s 2000s
Hous
ehol
d S
ize
Source: U.S. Census Bureau
Average family size,1950-2000
Men and women are delaying marriage, families are having fewer children, and household size is declining
Assets Demographics Political EnvironmentEconomy
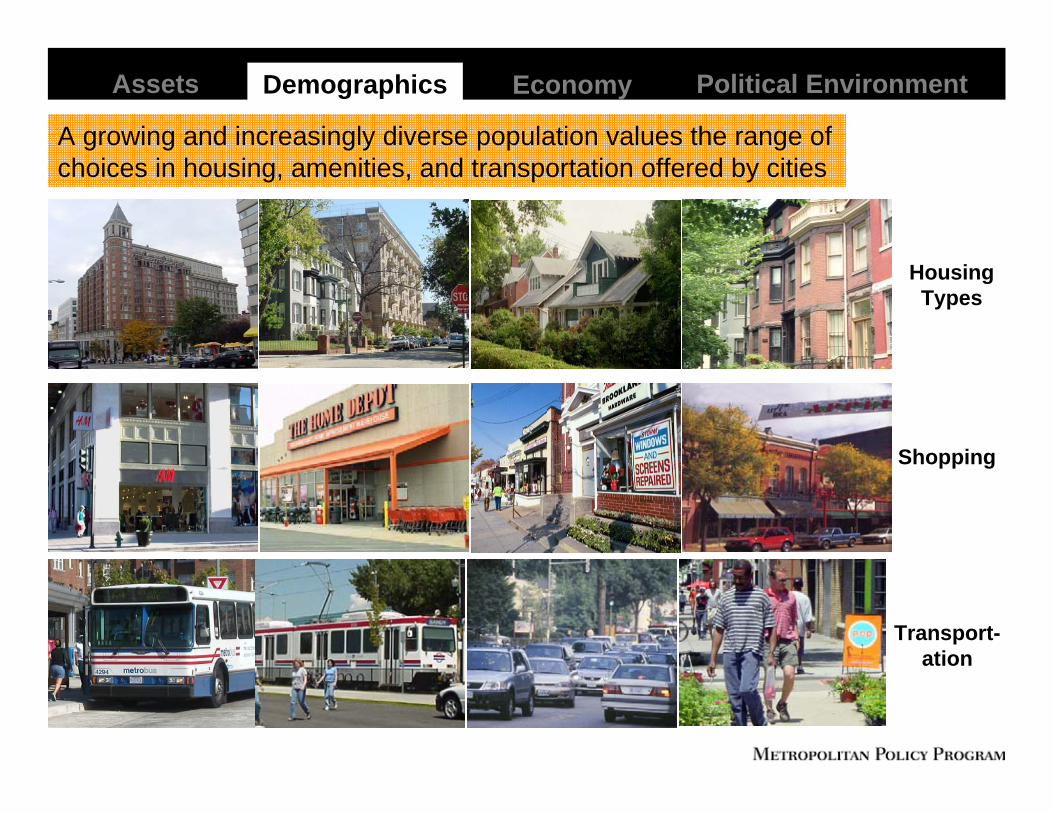
A growing and increasingly diverse population values the range of choices in housing, amenities, and transportation offered by cities
Shopping
Housing Types
Transport-ation
Assets Demographics Political EnvironmentEconomy
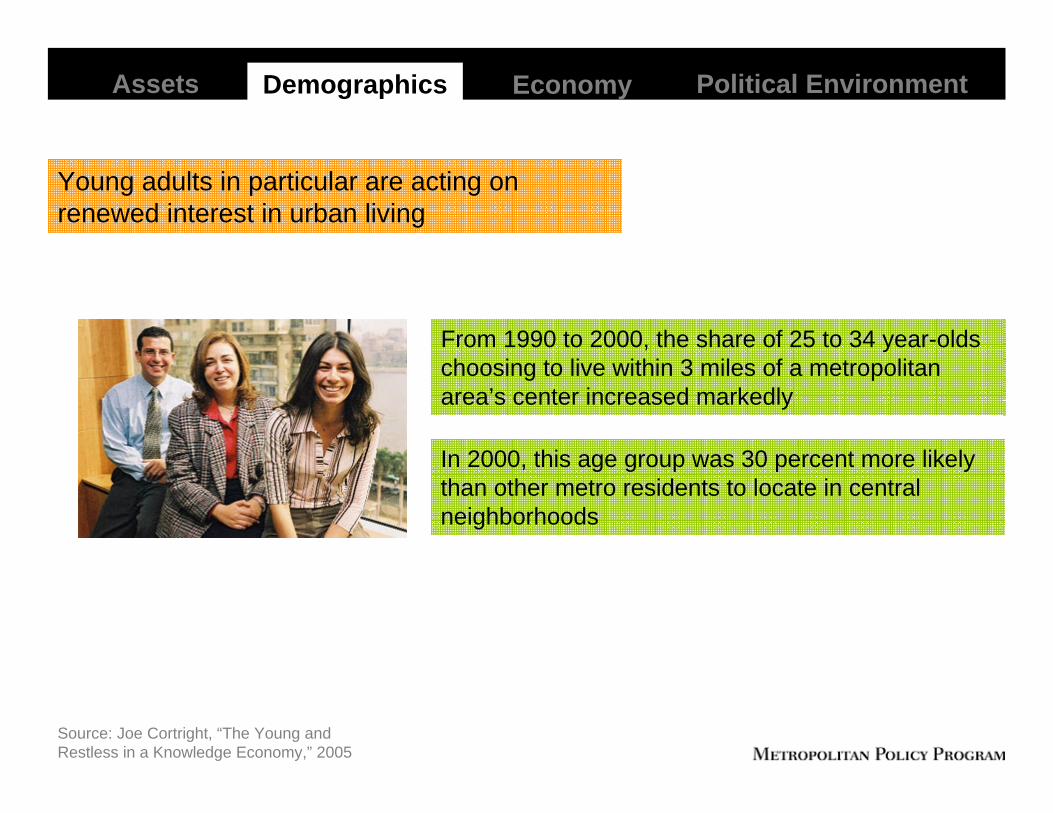
Source: Joe Cortright, “The Young and Restless in a Knowledge Economy,” 2005
Young adults in particular are acting on renewed interest in urban living
From 1990 to 2000, the share of 25 to 34 year-olds choosing to live within 3 miles of a metropolitan area’s center increased markedly
In 2000, this age group was 30 percent more likely than other metro residents to locate in central neighborhoods
Assets Demographics Political EnvironmentEconomy
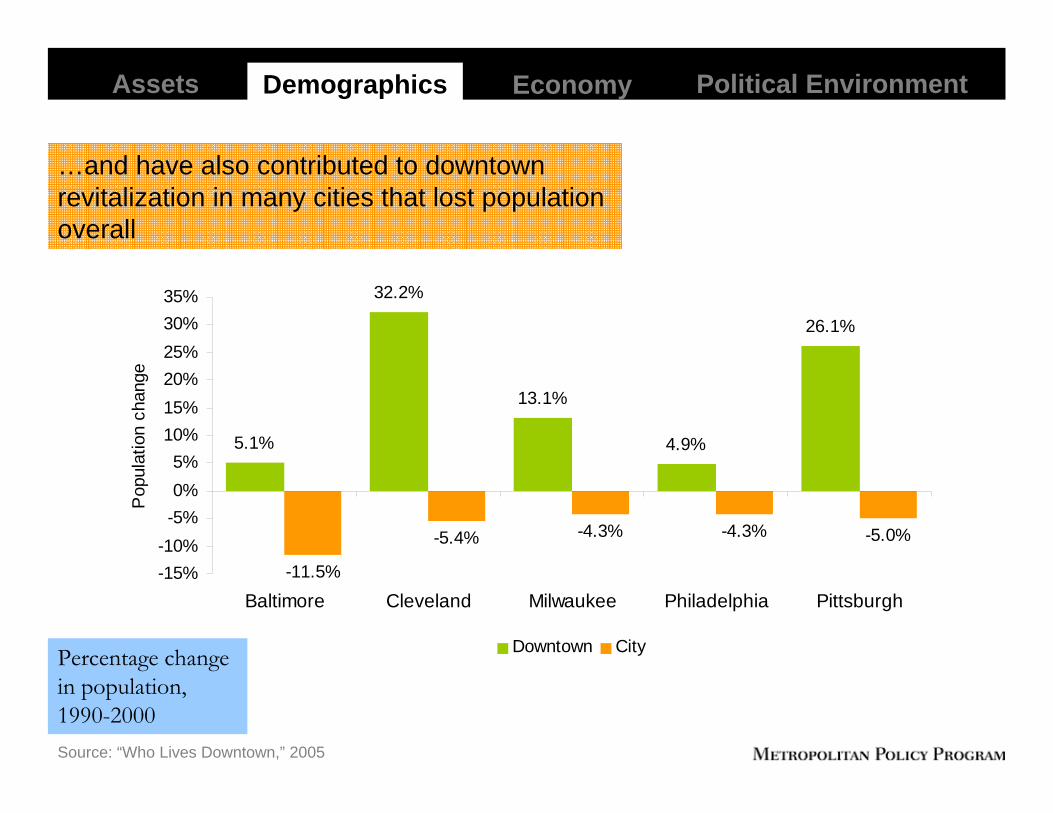
Percentage change in population,1990-2000Source: “Who Lives Downtown,” 2005
…and have also contributed to downtown revitalization in many cities that lost population overall
Assets Demographics Political EnvironmentEconomy
5.1%
32.2%
13.1%
4.9%
26.1%
-11.5%
-5.4% -4.3% -4.3% -5.0%
-15%-10%-5%0%5%
10%15%20%25%30%35%
Baltimore Cleveland Milwaukee Philadelphia Pittsburgh
Pop
ulat
ion
chan
ge
Downtown City
Source: Bureau of Labor Statistics
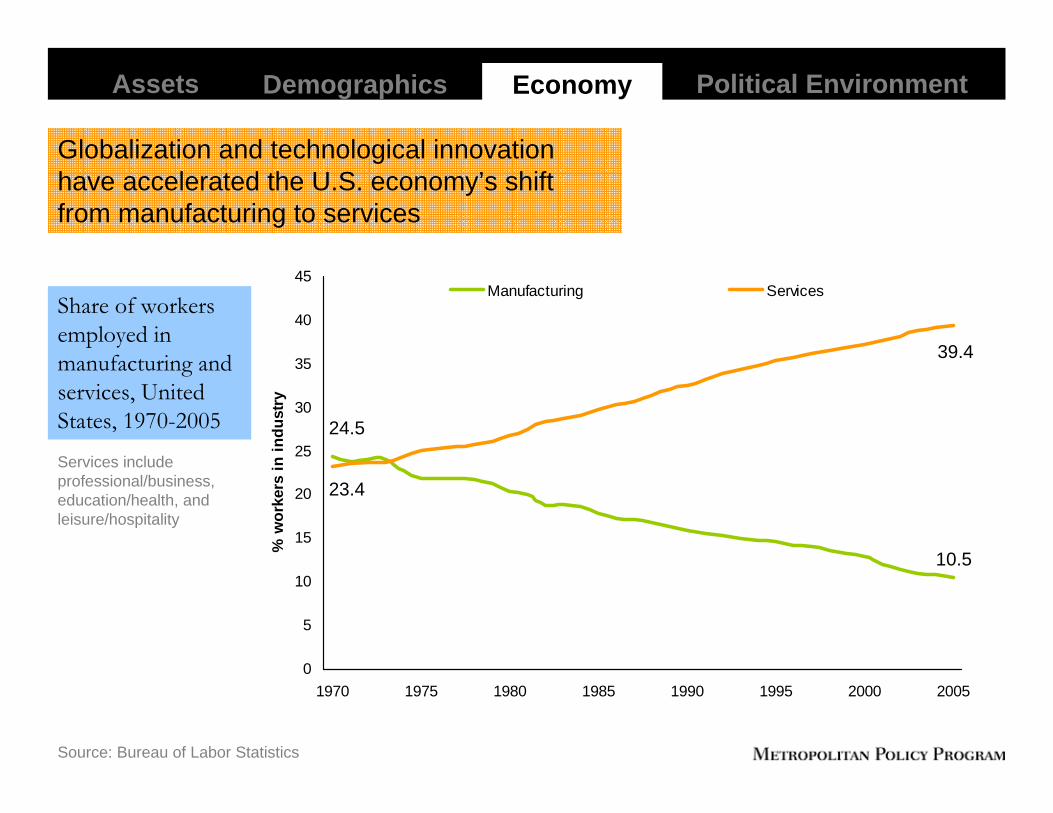
Globalization and technological innovation have accelerated the U.S. economy’s shift from manufacturing to services
Share of workers employed in manufacturing and services, United States, 1970-2005
0
5
10
15
20
25
30
35
40
45
1970 1975 1980 1985 1990 1995 2000 2005
% w
orke
rs in
indu
stry
Manufacturing Services
Services include professional/business, education/health, and leisure/hospitality
23.4
24.5
10.5
39.4
Assets Demographics Political EnvironmentEconomy
0%10%20%30%40%50%60%70%80%90%
100%
Architec
ts, Exce
pt Naval
Biologic
al Scie
ntists
Computer a
nd Mathematical O
ccupation
s
Engineers
Health Diagnosing a
nd Treating Practit
ioners
Legal Occu
pations
Medical S
cientist
s
Perc
ent w
ith c
olle
ge d
egre
e or
hig
her
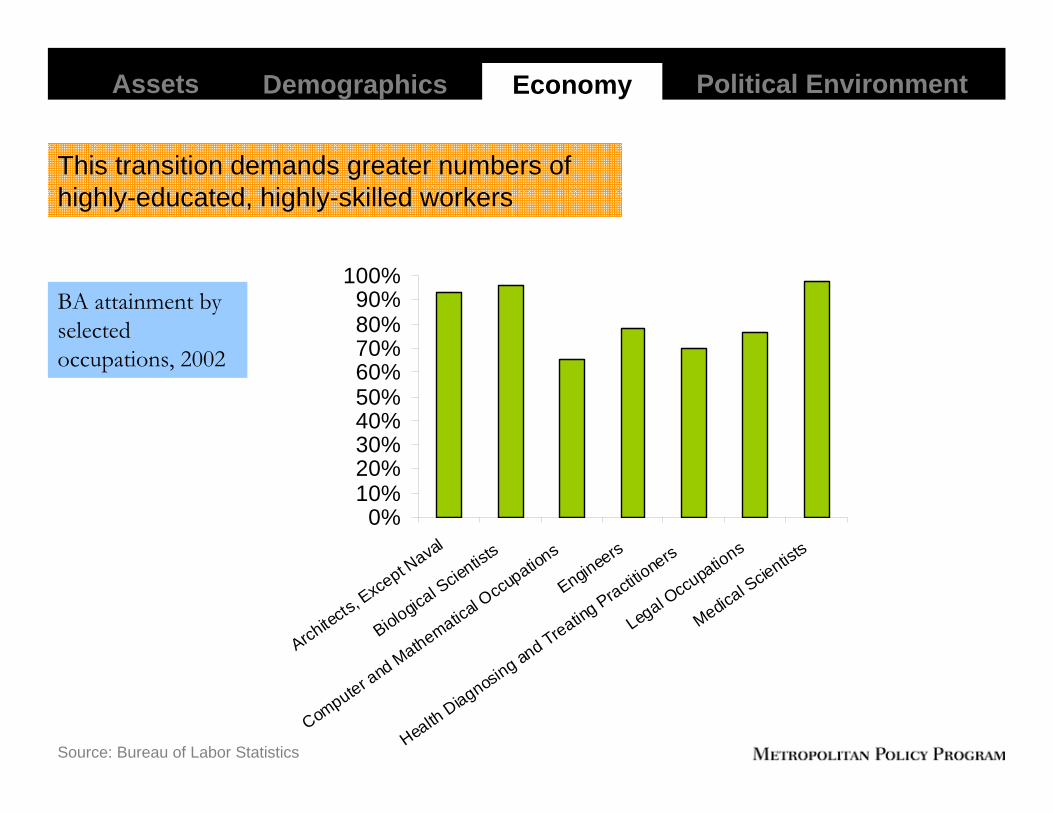
BA attainment by selected occupations, 2002
Source: Bureau of Labor Statistics
This transition demands greater numbers of highly-educated, highly-skilled workers
Assets Demographics Political EnvironmentEconomy

The role of universities, colleges, and medical research institutions in economic development and community revitalization is growing
Purchasers: Redirect institutional purchasing towards local businesses
Network builders: Channel university expertise to increase local business capacity
Real estate developers:Use real estate to anchor growth
Work force developers:Address local/regional resource needs
Employers: Offer employment to local residents
Incubators: Offer services to support start ups
University of Pennsylvania
Assets Demographics Political EnvironmentEconomy
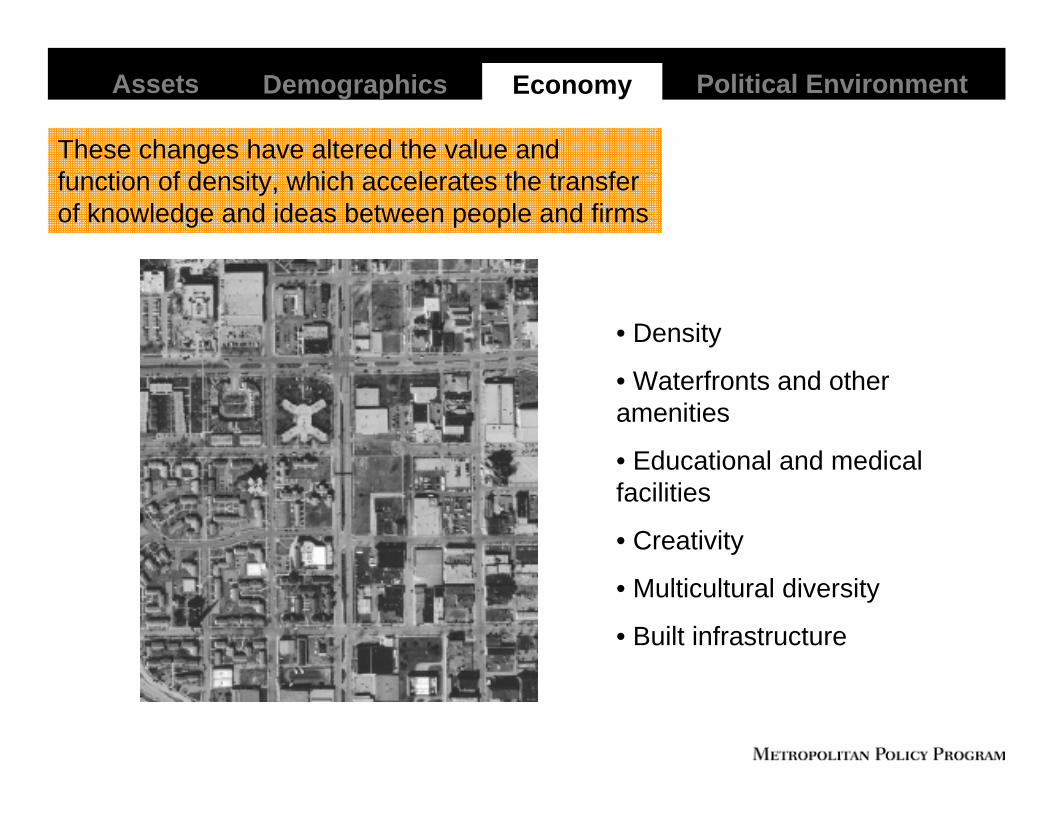
These changes have altered the value and function of density, which accelerates the transfer of knowledge and ideas between people and firms
Assets Demographics Political EnvironmentEconomy
• Density
• Waterfronts and other amenities
• Educational and medical facilities
• Creativity
• Multicultural diversity
• Built infrastructure

Lastly, cities have an opportunity to take advantage of a profound political and constituency moment
Progressive state leaders are recognizing—and acting upon—the link between strong cities and regional competitiveness
U.S. foundations and philanthropies are increasingly supportive of long-term projects to revitalize weak market cities
Community development organizations are increasingly interested in market-based solutions to building neighborhood wealth
Environmental and smart growth leaders are focusing on the critical role that cities play in reducing carbon emissions, enhancing energy efficiency, and conserving open space
Assets Demographics Political EnvironmentEconomy
What are the findings of the report?II
How can states restore prosperity to older industrial cities?III
What is the Restoring Prosperity Initiative?I
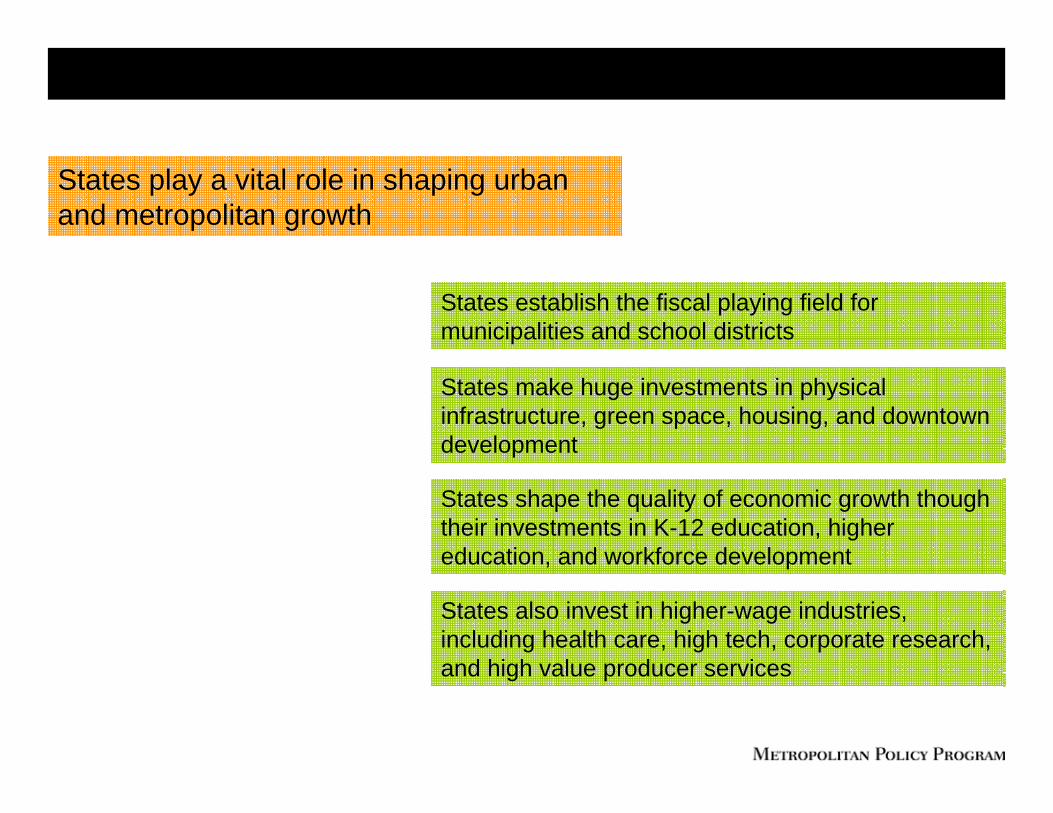
States play a vital role in shaping urban and metropolitan growth
States establish the fiscal playing field for municipalities and school districts
States make huge investments in physical infrastructure, green space, housing, and downtown development
States shape the quality of economic growth though their investments in K-12 education, higher education, and workforce development
States also invest in higher-wage industries, including health care, high tech, corporate research, and high value producer services

1
2
5
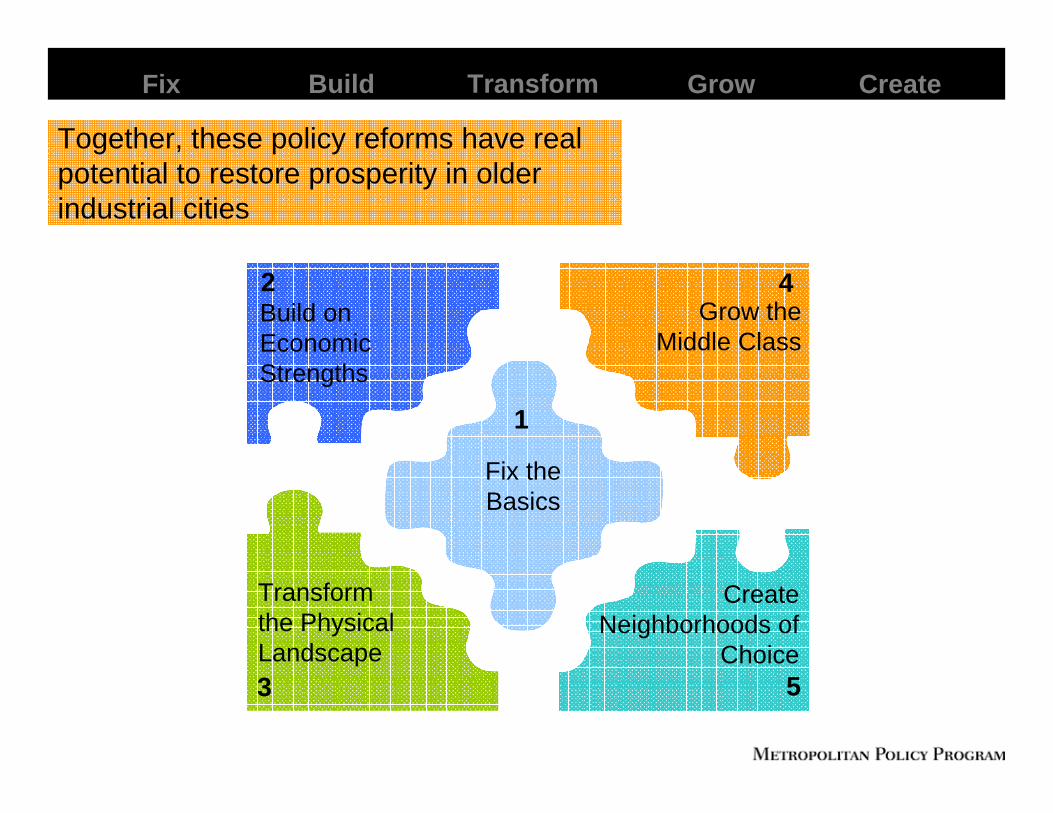
Build on Economic Strengths
4
Fix the Basics
Grow the Middle Class
Transform the Physical Landscape
Create Neighborhoods of
Choice3
To unleash the economic potential of older industrial cities, we propose five interrelated policy strategies
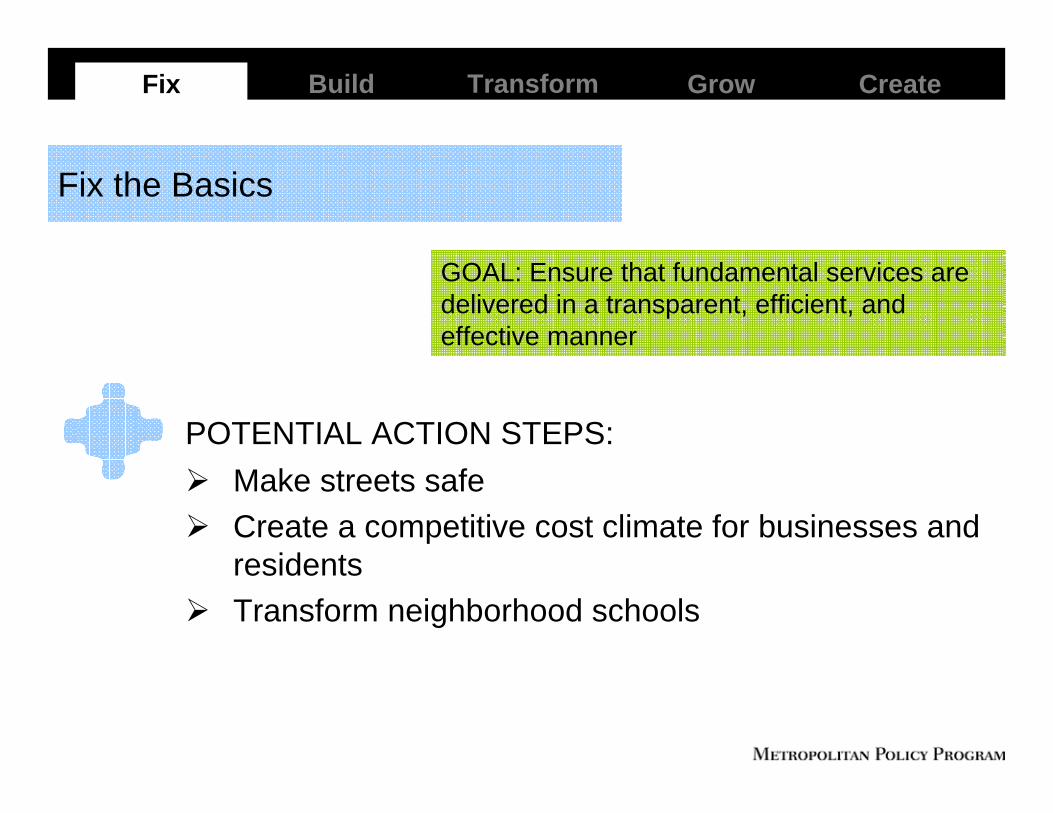
POTENTIAL ACTION STEPS: Make streets safeCreate a competitive cost climate for businesses and residents Transform neighborhood schools
Build Transform Grow CreateFix
Fix the Basics
GOAL: Ensure that fundamental services are delivered in a transparent, efficient, and effective manner
Build Transform Grow CreateFix
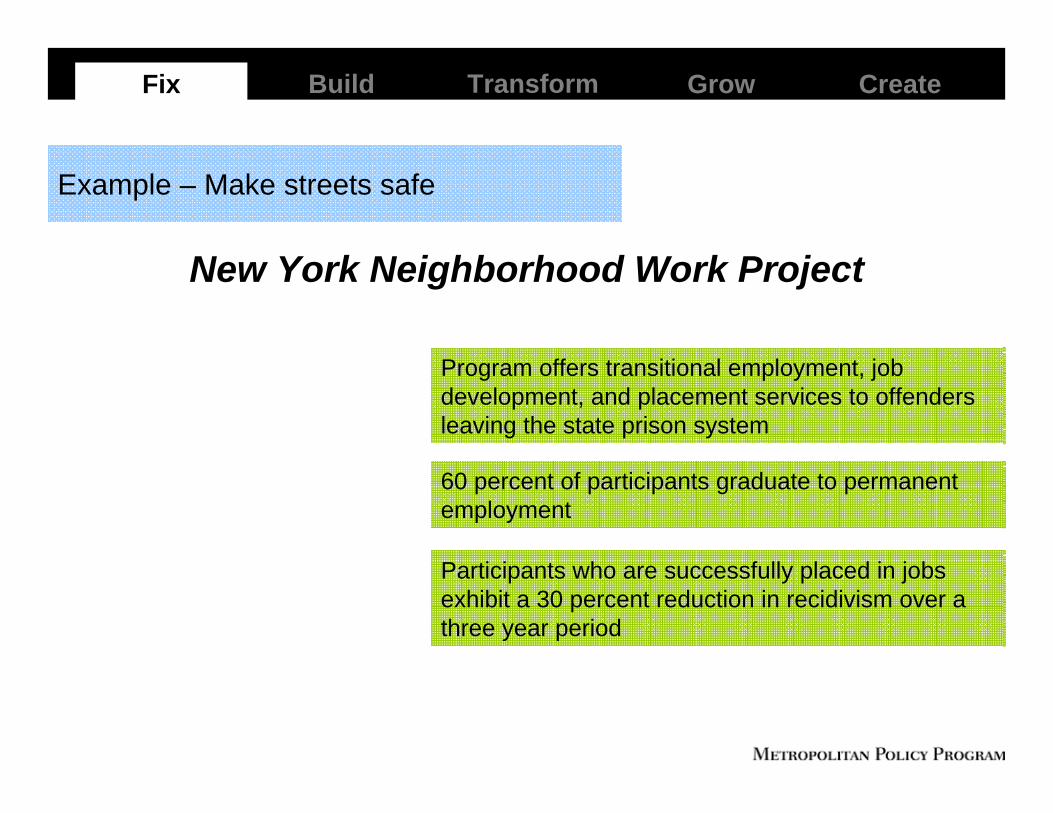
Program offers transitional employment, job development, and placement services to offenders leaving the state prison system
60 percent of participants graduate to permanent employment
Participants who are successfully placed in jobs exhibit a 30 percent reduction in recidivism over a three year period
Example – Make streets safe
New York Neighborhood Work Project
POTENTIAL ACTION STEPS: Invest in downtown revitalization Focus on cities’ competitive nichesEnhance connectivity between cities and regions
Build Transform Grow CreateFix
Build on Economic Strengths
GOAL: Leverage existing strengths to build a “high road” economy of knowledge, innovation, and entrepreneurship
Build Transform Grow CreateFix
In 1987, Chattanooga’s civic leaders initiated a strategic planning process to create a walkableconnection from downtown to the Tennessee River
The State of Tennessee provided funding for new waterfront infrastructure and turned over a key highway to the city
In 2002, the city embarked on a $120 million 21st
Century Waterfront Plan to create additional housing and open space on a thriving waterfront
Example – Invest in downtown revitalization
The Chattanooga TurnaroundIn the 1980s, Chattanooga had terrible air and water pollution, a declining economy and population base, and a 9-to-5 downtown
POTENTIAL ACTION STEPS: Fix it firstInvest in catalytic development projectsCreate marketable sites
Build Transform Grow CreateFix
Transform the Physical Landscape
GOAL: Undertake one or two major physical projects that transform the urban landscape, and give cities the tools they need to create marketable sites primed for reinvestment
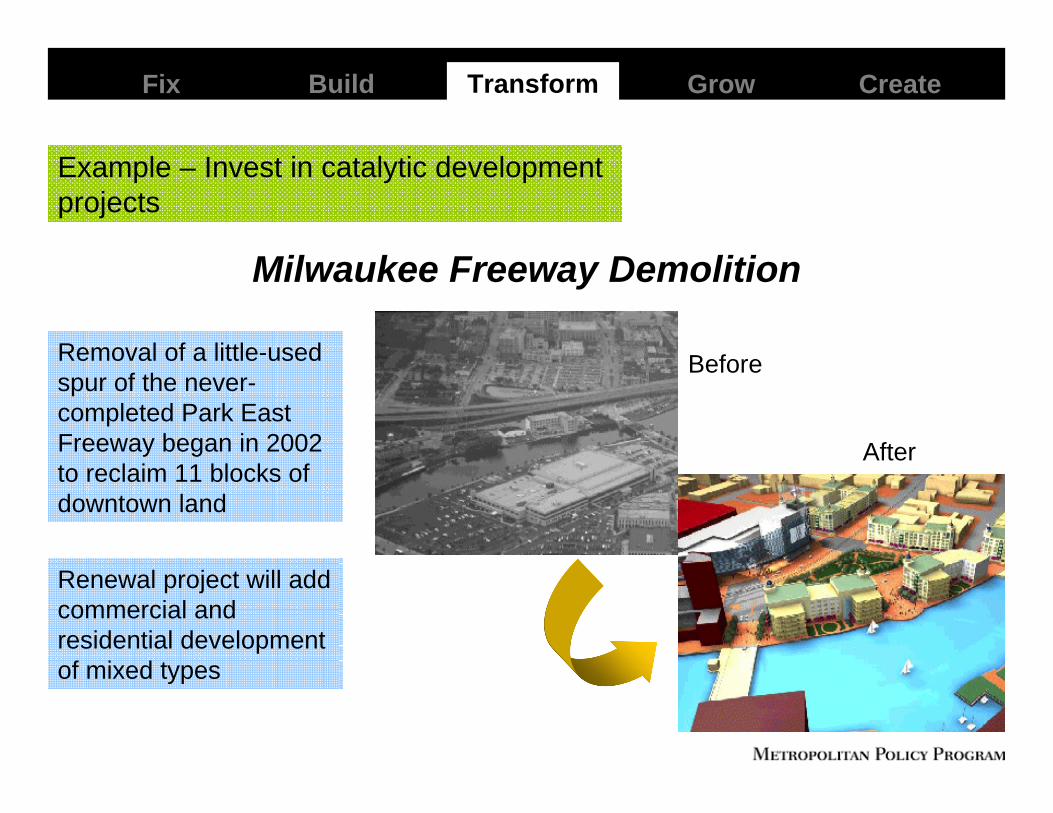
Removal of a little-used spur of the never-completed Park East Freeway began in 2002 to reclaim 11 blocks of downtown land
Renewal project will add commercial and residential development of mixed types
Before
After
Build Transform Grow CreateFix
Example – Invest in catalytic development projects
Milwaukee Freeway Demolition
Allows cities and counties to create land bank authorities to acquire, assemble, and redevelop vacant and abandoned land and buildings
Land banks also have the power to borrow money or sell bonds to raise revenue, buy and assemble land into larger parcels, and demolish, rehabilitate, or construct new buildings that can then be sold
Currently in possession of more than 9,480 properties, the Authority has restored and returned 693 properties to the market since 2004, with no state funding
Build Transform Grow CreateFix
Example – Create marketable sites
Michigan Land Bank Fast Track Authority
POTENTIAL ACTION STEPS: Give residents the skills and connections they need to competeMake work pay for low-income workersReduce the costs of being poor
Build Transform Grow CreateFix
Grow the Middle Class
GOAL: Reduce social inequity by helping low-wage earners build incomes and wealth
Build Transform Grow CreateFix
Provides funding for six workforce intermediary-led partnerships that map career development pathways for Ohio’s unemployed and low-income workforce
The project responds to the disconnect between labor markets and the state’s community colleges and technical schools
The KnowledgeWorks Foundation operates the program with foundation funding and discretionary funds from the Governor’s Workforce Policy Board
Example – Give residents the skills they need to compete
Ohio Career Pathways Project
POTENTIAL ACTION STEPS: Support mixed-income housing Grow inner city markets Invest in preservation and rehabilitation
Build Transform Grow CreateFix
Create Neighborhoods of Choice
GOALS: Create neighborhoods that serve families with a broad range of incomes

Build Transform Grow CreateFix
Partnership between local governments, private banks, and the State Banking Department to encourage banks to locate in neighborhoods that lack mainstream financial services
State provides below-market rate deposits, along with market rate deposits, to subsidize banks that open branches in designated neighborhoods
By August 2006, the program had commitments from 26 banks and thrifts to open new branches in underserved markets throughout the state
Example – Grow inner city markets
New York Banking Development Districts
Build Transform Grow CreateFix
1
2
5
Build on Economic Strengths
4
Fix the Basics
Grow the Middle Class
Transform the Physical Landscape
Create Neighborhoods of
Choice3
Together, these policy reforms have real potential to restore prosperity in older industrial cities
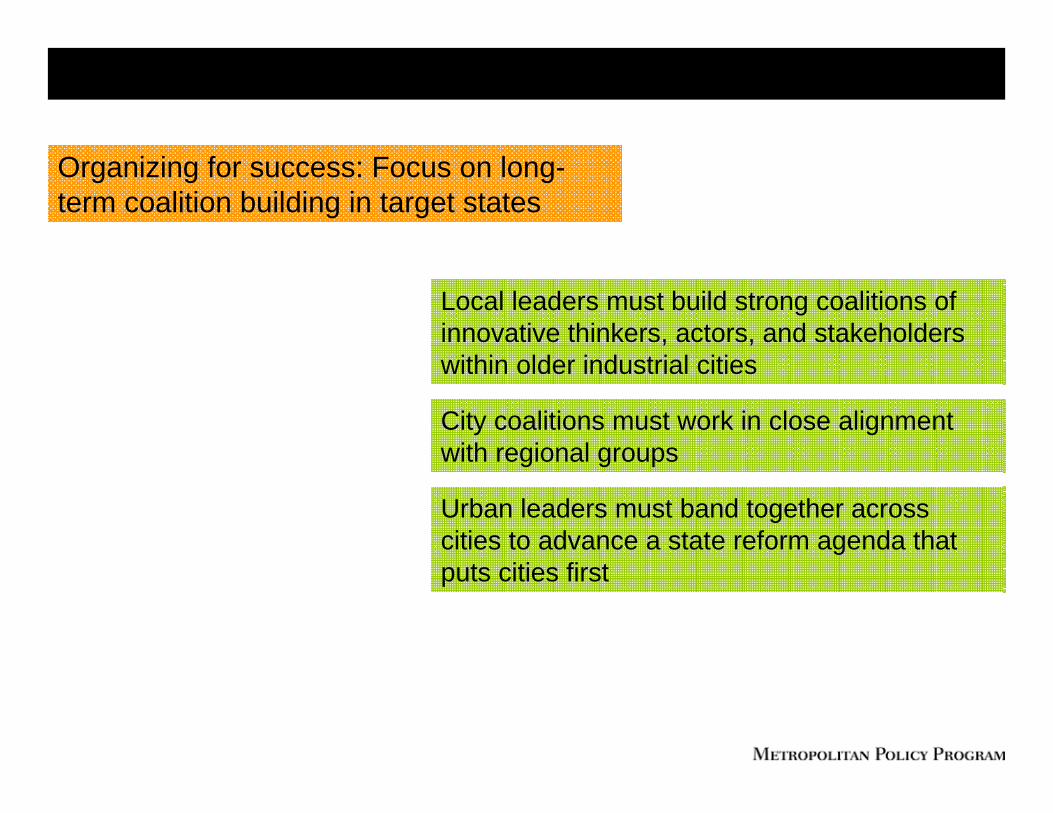
Organizing for success: Focus on long-term coalition building in target states
Local leaders must build strong coalitions of innovative thinkers, actors, and stakeholders within older industrial cities
City coalitions must work in close alignment with regional groups
Urban leaders must band together across cities to advance a state reform agenda that puts cities first
" "
"
""
"
"
"
" "
"
"
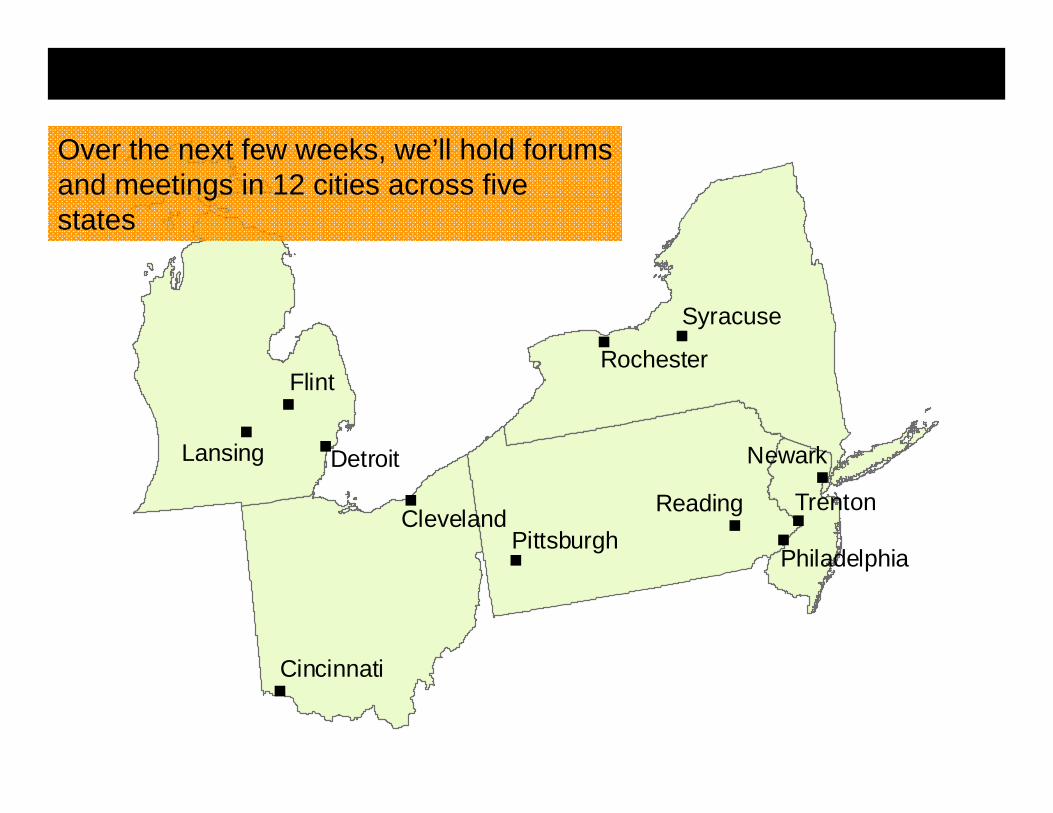
FlintRochester
Syracuse
Lansing Detroit
ClevelandPhiladelphia
Newark
ReadingPittsburgh
Trenton
Cincinnati
Over the next few weeks, we’ll hold forums and meetings in 12 cities across five states
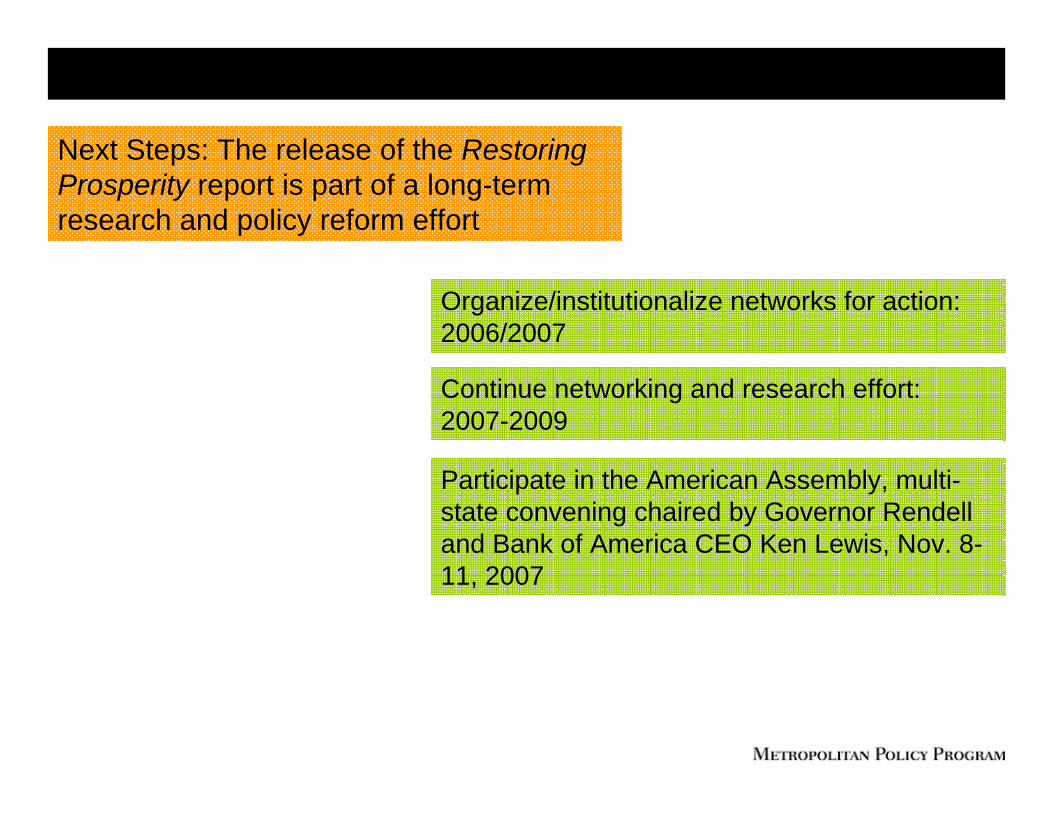
Next Steps: The release of the Restoring Prosperity report is part of a long-term research and policy reform effort
Organize/institutionalize networks for action: 2006/2007
Continue networking and research effort: 2007-2009
Participate in the American Assembly, multi-state convening chaired by Governor Rendell and Bank of America CEO Ken Lewis, Nov. 8-11, 2007
Older Industrial Cities Phase II: January 2008-2009
Expand and deepen the research and continue to pursue policy reform: Older Industrial Cities Policy series; policy advisory committee
Trends: Sector analysis, innovation and economic growth, city/metro analysis, immigration, human capital, real estate values
Comparative analysis: U.S.-E.U. analysis in partnership with the LSE; cross-state comparisons; diagnostics in Akron, Chattanooga, and Louisville
www.restoringprosperity.orgj o i n u s :
www.brookings.edu/metro