06_JER555733 356..365v-scheiner.brunel.ac.uk/bitstream/2438/12642/5/fulltext.docx · Web viewHua...
19
Analysis of cyclic variations during mode switching between spark ignition and controlled auto-ignition combustion operations Tao Chen 1 , Hua Zhao 1,2 , Hui Xie 1 and Bangquan He 1 Abstract Controlled auto-ignition, also known as homogeneous charge compression ignition, has been the subject of extensive research because of their ability to provide simultaneous reductions in fuel consumption and NOx emissions from a gas- oline engine. However, due to its limited operation range, switching between controlled auto-ignition and spark ignition combustion is needed to cover the complete operating range of a gasoline engine for passenger car applications. Previous research has shown that the spark ignition –controlled auto-ignition hybrid combustion (SCHC) has the poten- tial to control the ignition timing and heat release process during the mode transition operations. However, it was found that the SCHC is often characterized with large cycle-to-cycle variations. The cyclic variations in the in-cylinder pressure are particularly noticeable in terms of both their peak values and timings while the coefficient of variation in the indicated mean effective pressure is much less. In this work, the cyclic variations in SCHC operations were analyzed by means of in-cylinder pressure and heat release analysis in a single-cylinder gasoline engine equipped with Variable Valve Actuation (VVA) systems. First, characteristics of the in-cylinder pressure traces during the spark ignition–controlled auto-ignition hybrid combustion operation are presented and their heat release processes analyzed. In order to clarify the contribu- tion to heat release and cyclic variation in SCHC, a new method is introduced to identify the occurrence of auto-ignition combustion and its subsequent heat release process. Based on the new method developed, the characteristics of cyclic variations in the maximum rate of pressure rise and different stages of heat release process have been analyzed and discussed. Keywords Spark ignition–controlled auto-ignition hybrid combustion, cyclic variation, homogeneous charge compression ignition, combustion stability
Transcript of 06_JER555733 356..365v-scheiner.brunel.ac.uk/bitstream/2438/12642/5/fulltext.docx · Web viewHua...

Analysis of cyclic variations during mode switching between spark ignition and controlled auto-ignition combustion operations
Tao Chen1, Hua Zhao1,2, Hui Xie1 and Bangquan He1
AbstractControlled auto-ignition, also known as homogeneous charge compression ignition, has been the subject of extensive research because of their ability to provide simultaneous reductions in fuel consumption and NOx emissions from a gas- oline engine. However, due to its limited operation range, switching between controlled auto-ignition and spark ignition combustion is needed to cover the complete operating range of a gasoline engine for passenger car applications. Previous research has shown that the spark ignition –controlled auto-ignition hybrid combustion (SCHC) has the poten- tial to control the ignition timing and heat release process during the mode transition operations. However, it was found that the SCHC is often characterized with large cycle-to-cycle variations. The cyclic variations in the in-cylinder pressure are particularly noticeable in terms of both their peak values and timings while the coefficient of variation in the indicated mean effective pressure is much less. In this work, the cyclic variations in SCHC operations were analyzed by means of in-cylinder pressure and heat release analysis in a single-cylinder gasoline engine equipped with Variable Valve Actuation (VVA) systems. First, characteristics of the in-cylinder pressure traces during the spark ignition–controlled auto-ignition hybrid combustion operation are presented and their heat release processes analyzed. In order to clarify the contribu- tion to heat release and cyclic variation in SCHC, a new method is introduced to identify the occurrence of auto-ignition combustion and its subsequent heat release process. Based on the new method developed, the characteristics of cyclic variations in the maximum rate of pressure rise and different stages of heat release process have been analyzed and discussed.
KeywordsSpark ignition–controlled auto-ignition hybrid combustion, cyclic variation, homogeneous charge compression ignition, combustion stability
IntroductionOver the last decade, a lot of efforts have been made in the research of controlled auto-ignition (CAI) or homogeneous charge compression ignition (HCCI) combustion because of its potential to achieve simulta- neous reductions in fuel consumption and NOx emis-
effective way to achieve the mode switching as well as controlling the combustion stability and the heat release process.3 The continuous combustion mode transition was achieved with load by the adjustment of intake and exhaust valves.
sion.1 But the application of CAI or HCCI combustion to production engines is still confronted with a host of difficulties, such as combustion process control and limited operating range.2 In order to cover the com- plete range of operations, spark ignition (SI) combus- tion is needed outside the range of CAI operation, necessitating the switching between the two combustion modes. The SI–CAI hybrid combustion (also named as spark-assisted HCCI combustion before) can be an
1State Key Laboratory of Engines (SKLE), Tianjin University, Tianjin, China
2Centre for Advanced Powertrain and Fuels (CAPF), Brunel UniversityLondon, Uxbridge, UK
Corresponding author:Hua Zhao, Centre for Advanced Powertrain and Fuels (CAPF), Brunel University London, Uxbridge UB8 3PH, UK.Email: [email protected]

Previous research has identified two stages of the heat release process of SI–CAI hybrid combustion: spark-ignited flame propagation in the first part fol- lowed by auto-ignition exothermic reactions of unburned mixture.4–8 Compared with the pure CAI combustion, the relatively slower and more reliable initial flame propagation process in SI–CAI hybrid combustion reduces the rate of pressure rise at higher load condition and improves the combustion stability at lower load conditions. When operating with different gasoline-type fuels, Bunting9 found that the in-cylinder charge temperature and dilution had similar effects on hybrid combustion as on the CAI combustion. Yun et al.10 found that reducing the residual gas temperature and changing the distribution of residual gas in cylinder could alter the heat release process of the hybrid com- bustion and expand the operating range of high- efficiency low-temperature combustion.
In these studies, large cycle-to-cycle variations were found in the in-cylinder pressures and heat release rates during the SI–CAI hybrid combustion operations.3
Such cyclic variations are more likely to occur when the main heat release process of SI–CAI hybrid com- bustion was changed from CAI operation to SI opera- tion. Such large cyclic variation made it difficult to achieve smoothed mode switching and operations at the interface regions between SI and CAI operations. Wagner and colleagues11,12 initially considered the fluc- tuation of the residual gas energy as the main cause to such cyclic variations and then studied the effect of the initial temperature. Glewen et al.13 developed a dual Weber function to identify proportion variation between CAI and SI combustion.
However, the previous research had been aimed at achieving stable CAI combustion through SI and focused on the CAI combustion, thus being called spark-assisted CAI or HCCI combustion. But in prac- tice, it is found that in order to achieve better control over the combustion process, a greater proportion of spark-ignited flame can be employed during the hybrid combustion to achieve smooth and optimized heat release and engine operations. Although the cyclic var- iation in traditional SI combustion and HCCI combus- tion has attracted much interest among researchers,14–17
at the moment, there is a lack of good understanding on characteristic of the cyclic variations during the hybrid combustion operation. In this work, engine experiments were carried out to characterize the in-cylinder pressure and heat release profiles of the hybrid combustion pro- cess. Autoignited combustion was achieved by either residual gas trapping by the negative valve overlap (NVO) method or external exhaust gas recirculation (EGR) with intake heating. The occurrence and magni-tude of the cyclic variation of the spark ignition– controlled auto-ignition hybrid combustion (SCHC) phenomenon are analyzed and correlated to the in-cylinder gas temperature, exhaust gas concentration and air–fuel ratio.
Table 1. Engine specifications.
Engine type Four-stroke single cylinder
Bore 86 mmStroke 86 mmDisplacement 0.5 LCompression ratio 10.66Combustion chamber Pent roof/four valvesFuel injection Port fuel injectionInjection pressure 3 barFuel Gasoline 93 RONInlet pressure Naturally aspiratedCoolant temperature 80 °COil temperature 50 °C
Experimental setupEngine specification and test benchIn this research, experiments were carried out on a four-stroke single-cylinder engine, and its specifications are given in Table 1. The engine comprises a Ricardo Hydra engine block and a specially designed cylinder head equipped with two sets of identical mechanically fully variable valve actuation systems on the intake and exhaust valves. Each system integrates a BMW VANOS variable valve timing device and a BMW Valvetronics continuously variable valve lift device. With the fully variable valve system, intake and exhaust valve lifts can be continuously adjusted from0.3 to 9.5 mm and the valve timings are adjustable within 60° crank angle (CA). In order to achieve auto- ignition combustion through trapped residual gases, the intake and exhaust valve profiles were adjusted to achieve variable NVOs.
The intake system was connected to two separated intake pipes, with one pipe providing preheated air and the other supplying air at ambient temperature. A 6- kW electrical heater was used to preheat the intake air when required. The desired intake temperature was achieved by adjusting the ratio of mass flows between preheated air and ambient air. A K-type thermocouple mounted upstream of both intake ports and injector was used to measure the temperature of mixed air.
Figure 1 shows the schematic experimental setup with the control sub-system and the data acquisition sub-system developed at the authors’ laboratory.18 The engine was connected directly to a 30-kW alternating current (AC) electric dynamometer. A linear oxygen sensor (with an accuracy of 61.5%) was mounted in the exhaust pipe to ensure precise control of the air– fuel ratio. The exhaust gas temperature was measured by a K-type thermocouple installed in the exhaust pipe. At each experimental point, the in-cylinder pressure was measured with a Kistler 6125B piezoelectric trans- ducer and a 5011B charge amplifier. The amount of airflow was measured with a laminar flow meter withan accuracy of 61%. The residual gas fraction (RGF)

was determined from the residual gas mass calculated

Figure 1. Schematic of the test setup.EGR: exhaust gas recirculation; AC: alternating current; EFI, Electronic Fuel Injection; ECU, Electronic Control Unit; 4VVAS, Four Variable Valve Actuation System; A/D, AC/DC; CAN, Controller Area Network.
from the exhaust gas temperature and the in-cylinder gas pressure at the exhaust valve closing time using the state equation of the ideal gas. The gaseous exhaust emissions of carbon monoxide (CO), hydrocarbons (HCs) and nitrogen oxides (NOx) were measured by a Horiba MEXA-7100 DEGR gas analyzer system. The external EGR ratio was determined from the concen- trations of CO2 in the exhaust and intake pipes.
Experimental methodThe valve profiles adopted are schematically shown in Figure 2. To achieve the SI–CAI hybrid combustion with the residual gas trapping method, intake and exhaust valve profiles were configured to achieve a NVO, with exhaust valve closing and intake valve opening kept symmetrical about the gas exchange top dead center (TDC). The air–fuel ratio was kept stoi- chiometric. In addition, the external EGR and the effective compression ratio were used for maintaining optimized controlled combustion.
To achieve the CAI/HCCI combustion by intake preheating and external EGR without residual gas trap- ping, positive valve profiles were adopted and the com- bustion phasing was maintained by adjusting the intake temperature. The external recirculated exhaust gas was
mixed with preheat charge well in the intake pipe.

Figure 2. Schematic valve profiles.CA: crank angle; TDC: top dead center.
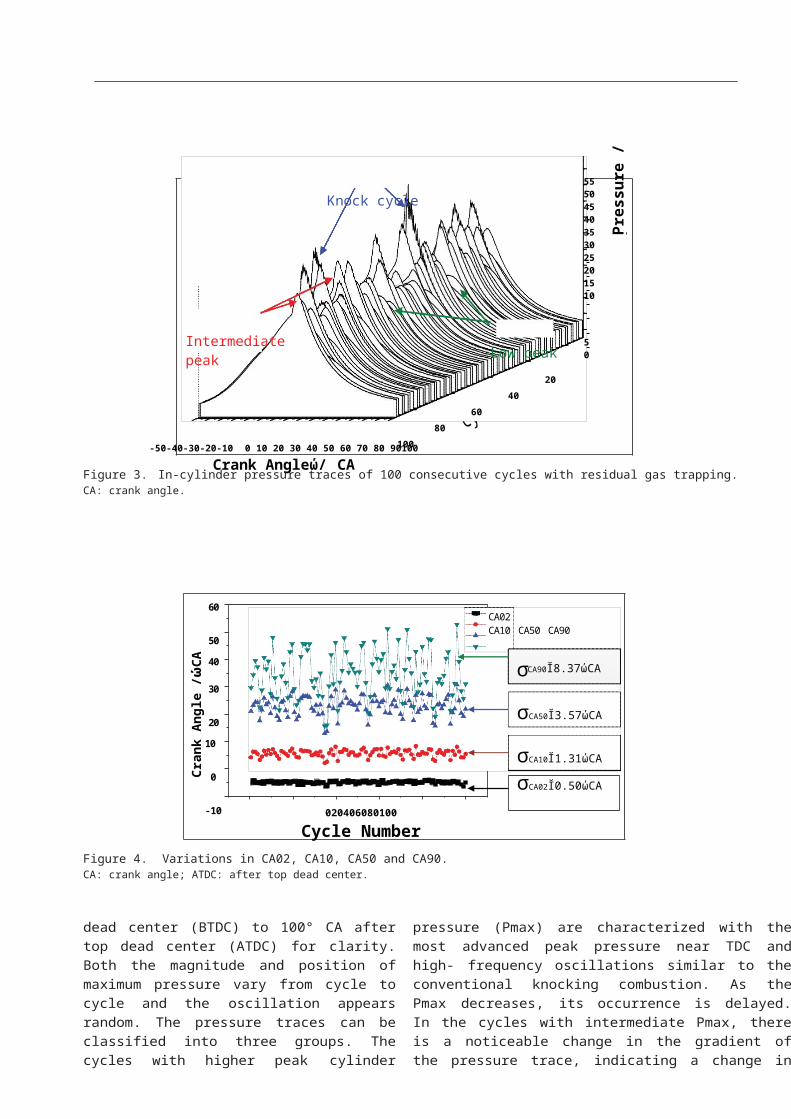
Results and discussionCharacteristics of cycle-to-cycle variations during the SI–CAI hybrid combustion operationFigure 3 shows the in-cylinder pressure traces of 100 consecutive cycles at net indicated mean effective pres- sure (IMEP) 6 bar and 1500 r/min with the NVO setup, when the engine operation was changed from multiple auto-ignition combustion to spark-ignited flame. The pressure traces are plotted from 50° CA before top

Knock cycle55504540353025201510
Intermediatepeak Low peak
50
2040
6080
-50-40-30-20-10 0 10 20 30 40 50 60 70 80 90100Crank Angleώ/ CA
100
60
50
CA02CA10 CA50 CA90
40 σCA90Ĭ8.37ώCA
30
20 σCA50Ĭ3.57ώCA
10
0
-10
σCA10Ĭ1.31ώCA
σCA02Ĭ0.50ώCA
020406080100
Cycle Number
Figure 3. In-cylinder pressure traces of 100 consecutive cycles with residual gas trapping.CA: crank angle.
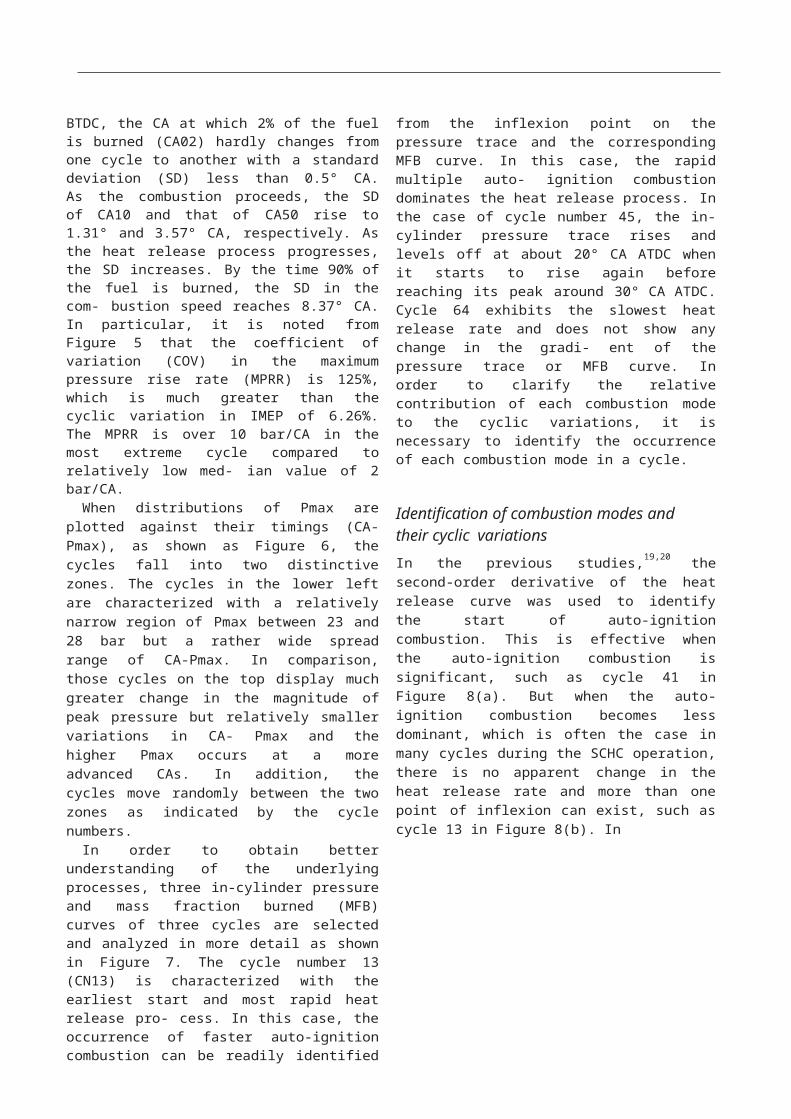
Figure 4. Variations in CA02, CA10, CA50 and CA90.CA: crank angle; ATDC: after top dead center.
dead center (BTDC) to 100° CA after top dead center (ATDC) for clarity. Both the magnitude and position of maximum pressure vary from cycle to cycle and the oscillation appears random. The pressure traces can be classified into three groups. The cycles with higher peak cylinder pressure (Pmax) are characterized with the most advanced peak pressure near TDC and high- frequency oscillations similar to the conventional knocking combustion. As the Pmax decreases, its occurrence is delayed. In the cycles with intermediate Pmax, there is a noticeable change in the gradient of the pressure trace, indicating a change in the heat release process. In the low Pmax cycles, the pressure traces are smooth without any abrupt change.
Detailed analysis of the heat release process is shown in Figure 4. Because the spark timing is fixed at 18°
CA
Cra
nk A
ngle
/ώC
A A
TDC
Pres
sure
/ ba
r
MPRRIMEP COVIMEP=6.29%
20 7
18
1614
612
10
8
6 5
4
20
40 20 40 60 80 100
Cycle Number
Figure 5. Variations in MPRR and IMEP.MPRR: maximum pressure rise rate; IMEP: indicated mean effective pressure; COVIMEP: coefficient of variation in IMEP; CA: crank angle.
MP
RR
/ ba
r/䜪C
A IME
P /
bar

50 3.0CA_Pmax@25,Pmax=39 bar, IMEP= 6.28 bar CN13CA_Pmax@25,Pmax=25 bar, IMEP= 5.69 bar CN45 CA_Pmax@12,Pmax=23 bar, IMEP= 4.97 bar CN64
2.540Average value in 100 cycles IMEP= 5.82 bar30 COVIMEP= 6.29 %
2.0
1.520
1.0
100.5
0 0.0
-60-40-20020406080100Crank Angle (CA)
BTDC, the CA at which 2% of the fuel is burned (CA02) hardly changes from one cycle to another with a standard deviation (SD) less than 0.5° CA. As the combustion proceeds, the SD of CA10 and that of CA50 rise to 1.31° and 3.57° CA, respectively. As the heat release process progresses, the SD increases. By the time 90% of the fuel is burned, the SD in the com- bustion speed reaches 8.37° CA. In particular, it is noted from Figure 5 that the coefficient of variation (COV) in the maximum pressure rise rate (MPRR) is 125%, which is much greater than the cyclic variation in IMEP of 6.26%. The MPRR is over 10 bar/CA in the most extreme cycle compared to relatively low med- ian value of 2 bar/CA.
When distributions of Pmax are plotted against their timings (CA-Pmax), as shown as Figure 6, the cycles fall into two distinctive zones. The cycles in the lower left are characterized with a relatively narrow region of Pmax between 23 and 28 bar but a rather wide spread range of CA-Pmax. In comparison, those cycles on the top display much greater change in the magnitude of peak pressure but relatively smaller variations in CA- Pmax and the higher Pmax occurs at a more advanced CAs. In addition, the cycles move randomly between the two zones as indicated by the cycle numbers.
In order to obtain better understanding of the underlying processes, three in-cylinder pressure and mass fraction burned (MFB) curves of three cycles are selected and analyzed in more detail as shown in Figure 7. The cycle number 13 (CN13) is characterized with the earliest start and most rapid heat release pro- cess. In this case, the occurrence of faster auto-ignition combustion can be readily identified from the inflexion point on the pressure trace and the corresponding MFB curve. In this case, the rapid multiple auto- ignition combustion dominates the heat release process. In the case of cycle number 45, the in-cylinder pressure trace rises and levels off at about 20° CA ATDC when it starts to rise again before reaching its peak around 30° CA ATDC. Cycle 64 exhibits the slowest heat release rate and does not show any change in the gradi- ent of the pressure trace or MFB curve. In order to clarify the relative contribution of each combustion mode to the cyclic variations, it is necessary to identify the occurrence of each combustion mode in a cycle.
Identification of combustion modes and their cyclic variationsIn the previous studies,19,20 the second-order derivative of the heat release curve was used to identify the start of auto-ignition combustion. This is effective when the auto-ignition combustion is significant, such as cycle 41 in Figure 8(a). But when the auto-ignition combustion becomes less dominant, which is often the case in many cycles during the SCHC operation, there is no apparent change in the heat release rate and more than one point of inflexion can exist, such as cycle 13 in Figure 8(b). In
Figure 6. Relative between CA and magnitude of Pmax.CA: crank angle; ATDC: after top dead center.
Figure 7. In-cylinder pressure and cumulative heat release curve of characteristic cycle.CA: crank angle; IMEP: indicated mean effective pressure; COVIMEP: coefficient of variation in IMEP.
addition, most cycles in the lower left zone in Figure 8, such as cycle 45 in Figure 8(c), have no apparent change in the second derivative of the heat release curve, although their heat release rates are still much faster than the flame propagation cycle as can be observed from cycle 64 in Figure 8(d).
In order to overcome the difficulty with the use of second derivative of the heat release rate, the following method is developed to identify the contribution of auto-ignition combustion during the SI–CAI hybrid combustion mode. The parameters of the Wiebe func- tion developed for SI flame propagation21 were deter- mined from the initial MFB curve of each cycle by assuming the initial 10% heat release of a cycle in the SCHC mode was derived from flame propagation solely. Figure 9 shows the actual and calculated cumu-
Pre
ssur
e (B
ar)
Cum
ulat
ive
Hea
t Rel
ease
lative heat release curves for the four cycles. It can be seen that faster auto-ignition combustion dominates

Seco
nd o
rder
der
ivat
ive
of H
RR
(J
/(CA
^3))
Seco
nd o
rder
der
ivat
ive
of H
RR
(J
/(CA
^3))
HR
R (J
/CA
)H
RR
(J/C
A)
120
100
80
HRRSOD of HRR
120
100
80
120
100
80
120
100
80
60 60 60 60
40 40 40 40
20 20 20 20
0 0 0 0
-20 -20 -20 -20
-40-40 -20 0 20 40 60 80
Crank Angle
-40 -40-40 -20 0 20 40 60 80
Crank Angle
-40
(a) (b)120
100 HRRSOD of
HRR80
120
100
80
120
100
80
HRR SOD of
HRR
120
100
80
60 60 60 60
40 40 40 40
20 20 20 20
0 0 0 0
-20 -20 -20 -20
-40-40 -20 0 20 40 60 80
Crank Angle
-40 -40 -40-40 -20 0 20 40 60 80
Crank Angle(c) (d)
Figure 8. Typical heat release curves and their second-order derivative: (a) cycle 41, (b) cycle 1, (c) cycle 45 and (d) cycle 64.HRR: heat release rate; SOD: second-order derivative; CA: crank angle.
HR
R (J
/CA
)M
FBH
RR
(J/C
A)
MFB
MFB
MFB
Seco
nd o
rder
der
ivat
ive
of H
RR
(J
/(CA
^3))
Seco
nd o
rder
der
ivat
ive
of H
RR
(J
/(CA
^3))

0.00.0
-40-20020406080100-40-20020406080100
Crank AngleCrank Angle(c)(d)
Figure 9. Experimental and fitting MFB curves: (a) cycle 41, (b) cycle 1, (c) cycle 45 and (d) cycle 64.MFB: mass fraction burned.

Characterized by Auto-ignition˖IMEP = 6.1484 bar˗IMEP =0.2080 bar˗ COVIMEP =3.4 %dPdCA _ MAX =1.9184 bar/CA˗dPdCA _ MAX = 2.0598 bar/CA˗COVdPdCA _ MAX =107.4 %
Characterized by flame propagationIMEP = 5.5169 bar˗IMEP =0.2176 bar˗ COVIMEP =3.9 %dPdCA _ MAX =0.5459 bar/CA˗dPdCA _ MAX = 0.0196 bar/CA˗COVdPdCA _ MAX =3.6 %
0 10 20 30 405060 70 80 9010012
Characterized by Auto-ignitionCharacterized by Flame Propagation
8
4
0
7.0
6.5
6.0
5.5
5.0
4.5
0 10 20 30 405060CycN
70 80 90100
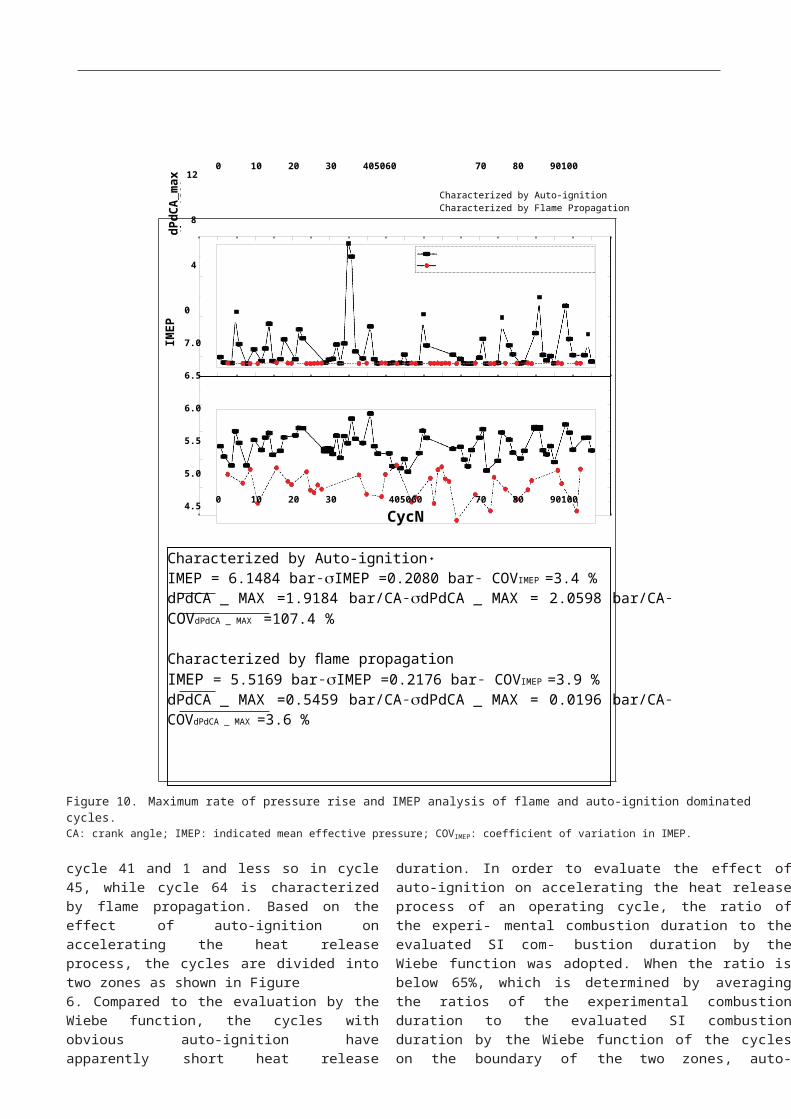
Figure 10. Maximum rate of pressure rise and IMEP analysis of flame and auto-ignition dominated cycles.CA: crank angle; IMEP: indicated mean effective pressure; COVIMEP: coefficient of variation in IMEP.
cycle 41 and 1 and less so in cycle 45, while cycle 64 is characterized by flame propagation. Based on the effect of auto-ignition on accelerating the heat release process, the cycles are divided into two zones as shown in Figure6. Compared to the evaluation by the Wiebe function, the cycles with obvious auto-ignition have apparently short heat release duration. In order to evaluate the effect of auto-ignition on accelerating the heat release process of an operating cycle, the ratio of the experi- mental combustion duration to the evaluated SI com- bustion duration by the Wiebe function was adopted. When the ratio is below 65%, which is determined by averaging the ratios of the experimental combustion duration to the evaluated SI combustion duration by the Wiebe function of the cycles on the boundary of the two zones, auto-ignition is assumed significant during the heat release process, and therefore, such a cycle is defined as the cycle characterized by auto-igni- tion, which is located in the top zone in Figure 6.
Correspondingly, the other cycles are defined as the cycles characterized by flame propagation.
The variations in the maximum rate of pressure rise, dP/dCA_max and IMEP of the cycles in the two zones are plotted in Figure 10. It can be seen that the flame dominated cycles are characterized with the fairly small maximum rate of pressure rise (the square root of dP/ dCA_max equals to 0.0196 bar/CA), and the COV in dP/dCA_max is about 3.6%. In comparison, the auto- ignition dominated cycles exhibit much greater rate of pressure rise and 30 times higher cyclic variations in the maximum rate of pressure rise, as shown by COVdP/dCA_max = 107.4%. However, the coefficient of variation in IMEP (COVIMEP) of each zone is less than 4% and lower than the overall COVIMEP of 6.26%. Furthermore, the average IMEP of the flame dominated cycles is 0.63 bar less than that of the auto-ignition dom- inated cycles. As the flame dominated cycles account for 37% of the total number of cycles, their lower IMEP values will deteriorate the fuel conversion efficiency.
IMEP
(Bar
)dP
dCA
_max
(bar
/CA
)
0 10 20 30 405060 70 80 90100
50
40
30
20
40
30
20
10
30
Characterized by Auto-ignitionCharacterized by Flame Propagation
20
10
0
0 10 20 30405060
CycN70 80 90100
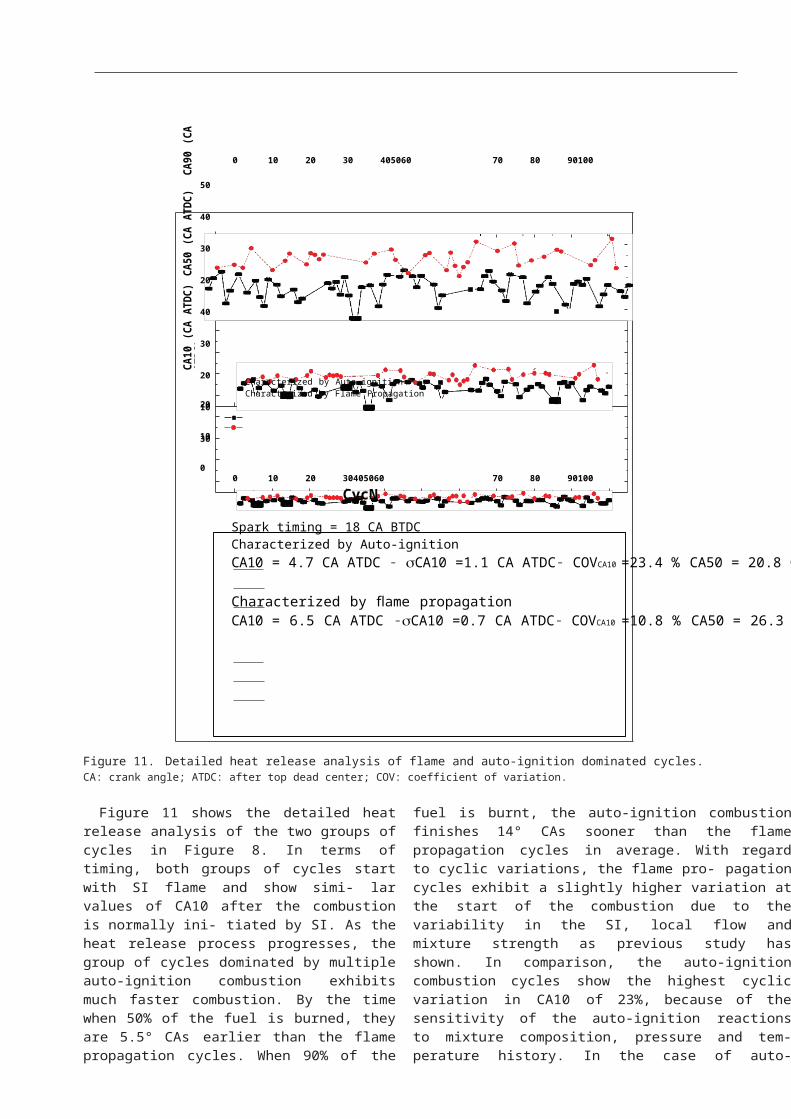
Spark timing = 18 CA BTDCCharacterized by Auto-ignitionCA10 = 4.7 CA ATDC ˗ CA10 =1.1 CA ATDC˗ COVCA10 =23.4 % CA50 = 20.8 CA ATDC˗CA50 =2.7 CA ATDC˗ COVCA50 =13.0 % CA90 = 29.4 CA ATDC˗CA90 =5.4 CA ATDC˗ COVCA90 =18.4 %
Characterized by flame propagationCA10 = 6.5 CA ATDC ˗CA10 =0.7 CA ATDC˗ COVCA10 =10.8 % CA50 = 26.3 CA ATDC˗ CA50 =1.8 CA ATDC˗ COVCA50 =6.8 % CA90 = 43.5 CA ATDC˗CA90 =4.1 CA ATDC˗ COVCA90 =9.4 %
Figure 11. Detailed heat release analysis of flame and auto-ignition dominated cycles.CA: crank angle; ATDC: after top dead center; COV: coefficient of variation.
Figure 11 shows the detailed heat release analysis of the two groups of cycles in Figure 8. In terms of timing, both groups of cycles start with SI flame and show simi- lar values of CA10 after the combustion is normally ini- tiated by SI. As the heat release process progresses, the group of cycles dominated by multiple auto-ignition combustion exhibits much faster combustion. By the time when 50% of the fuel is burned, they are 5.5° CAs earlier than the flame propagation cycles. When 90% of the fuel is burnt, the auto-ignition combustion finishes 14° CAs sooner than the flame propagation cycles in average. With regard to cyclic variations, the flame pro- pagation cycles exhibit a slightly higher variation at the start of the combustion due to the variability in the SI, local flow and mixture strength as previous study has shown. In comparison, the auto-ignition combustion cycles show the highest cyclic variation in CA10 of 23%, because of the sensitivity of the auto-ignition reactions to mixture composition, pressure and tem- perature history. In the case of auto-ignition cycles, the cyclic variations reach their minimum at CA50 before rising to 18% at CA90. Overall, the cyclic variations in
the auto-ignition dominated cycles are twice as much as the flame propagation cycles.
The above results have demonstrated that auto- ignition combustion leads to higher thermal efficiency due to its faster heat release rate and it is characterized with large cycle-to-cycle variations in the rate of heat release rate. But the auto-ignition combustion has the ability to self-adjust the combustion phasing so that the engine output (IMEP) remains constant despite the large cyclic variations in cylinder pressures. In compari- son, the flame propagation exhibits similar cyclic varia- tions in the engine output but lower cyclic changes in the heat release rate. The slow heat release rate renders the thermal efficiency of the engine operation low.
Summary and conclusionIn this research, the cyclic variations during the SI–CAI hybrid combustion operation were investigated in detail on a single-cylinder port fuel injection gasoline four- stroke engine equipped with variable valve lift and tim- ing control devices. The CAI combustion was achieved
CA10
(CA
ATDC
) CA
50 (C
A AT
DC)
CA90
(CA
ATDC
)

through the residual gas trapping by means of the NVO. The main findings can be summarized as follows:
1. The SI–CAI hybrid combustion cycles exhibit rela- tively overall low cyclic variations in the engine’s output as measured by the COVIMEP, but they show significant cycle-to-cycle variations in the peak cylinder pressure, the maximum rate of heat release and the location of peak cylinder pressure and timing of the maximum heat release.
2. Two types of cycles were identified and classified based on the relative contribution of auto-ignition combustion and flame propagation to the total heat released.
3. In the case of auto-ignition combustion dominant cycles, there are very large cycle-to-cycle variations in the peak cylinder pressure, the maxi- mum rate of pressure rise and the combustion tim- ings. But the cyclic variation in IMEP is much smaller than the cylinder pressure and change in the heat release rates. When the flame propagation becomes the dominant combustion process, there is much less cyclic variation in the heat release rate. The cylinder variation in IMEP of the flame dominant cycles is similar to the auto- ignition cycles.
4. Auto-ignition combustion is characterized with the largest cyclic variations in the initial phase of the heat release as measured by CA10 and reaches its minimum at CA50. In general, auto-ignition com- bustion exhibits twice the cyclic variations throughout the heat release process than flame propagation.
5. The fast heat release rate and self-adjustment of combustion phasing result in higher IMEP, and hence better fuel conversion efficiency than the flame propagation cycles.
Declaration of conflicting interestsThe authors declare that there is no conflict of interest.
FundingThis work was supported by Project of National Key Basic Research Plan (grant number 2013CB228403) from the Ministry of Science and Technology and Project of National Nature Science Foundation of China (grant number 51206118) from National Nature Science Foundation Committee of China.
References1. Zhao F, Asmus TW, Assanis DN, Dec JE, Eng JA and
Najt PM. Homogeneous Charge Compression Ignition (HCCI) engines, key research and development issues. Warrendale, PA: Society of Automotive Engineers (SAE publication PT-94), 2003.
2. Zhao H (ed.) Homogeneous Charge Compression Ignition (HCCI) and Controlled Autoignition (CAI)
combustion
engines for automotive industry. Cambridge: Woodhead Publishing Limited, 2007.
3. Chen T, Xie H, Li L, Yu W, Li Z and Zhao H. Continu- ous load adjustment strategy of a gasoline HCCI-SI engine fully controlled by exhaust gas. SAE paper 2011- 01-1408, 2011.
4. Persson H, Hultqvist A, Johansson B and Remo´ n A. Investigation of the early flame development in spark assisted HCCI combustion using high speed chemilumi- nescence imaging. SAE paper 2007-01-0212, 2007.
5. Weinrotter M, Wintner E, Iskra K, Neger T, Olofsson J, Seyfried H, et al. Optical diagnostics of laser-induced and spark plug-assisted HCCI combustion. SAE paper 2005-01-0129, 2005.
6. Hyvo¨ nen J, Haraldsson G and Johansson B. Operating conditions using spark assisted HCCI combustion during combustion mode transfer to SI in a multi-cylinder VCR-HCCI engine. SAE paper 2005-01-0109, 2005.
7. Wang ZH, Xu He, Wang JX, Shuai S, Xu F and YangD. Combustion visualization and experimental study on spark induced compression ignition (SICI) in gasoline HCCI engines. Energ Convers Manage 2010; 51: 908– 917.
8. Manofsky L, Vavra J, Assanis D and BabajimopoulosA. Bridging the gap between HCCI and SI: spark- assisted compression ignition. SAE paper 2011-01-1179, 2011.
9. Bunting BG. Combustion, control, and fuel effects in a spark assisted HCCI engine equipped with variable valve timing. SAE paper 2006-01-0872, 2006.
10. Yun H, Wermuth N and Najt P. Extending the high load operating limit of a naturally-aspirated gasoline HCCI combustion engine. SAE paper 2010-01-0847, 2010.
11. Wagner R, Edwards K, Daw C, Green JB and Bunting BG. On the nature of cyclic dispersion in spark assisted HCCI combustion. SAE paper 2006-01-0418, 2006.
12. Daw S, Edwards K, Wagner R and Green JB. Modeling cyclic variability in spark-assisted HCCI. In: Proceedings of the ASME 2007 internal combustion engine division fall technical conference, Charleston, SC, 14–17 October 2007, ICEF2007-1685. South Carolina, USA: ASME.
13. Glewen W, Wagner R, Edwards D and Daw S. Analysis of cyclic variability in spark-assisted HCCI combustion using a double Wiebe function. P Combust Inst 2009; 32: 2885–2892.
14. Maurya RK and Agarwal AK. Statistical analysis of the cyclic variations of heat release parameters in HCCI com- bustion of methanol and gasoline. Appl Energ 2012; 89: 228–236.
15. Granet V, Vermorel O, Lacour C, Enaux B, Dugue´ V and Poinsot T. Large-Eddy Simulation and experimental study of cycle-to-cycle variations of stable and unstable operating points in a spark ignition engine. Combust Flame 2012; 159: 1562–1575.
16. Larimore J, Hellstrom E, Sterniak J, Li J and Stefano- poulou AG. Experiments and analysis of high cyclic variability at the operational limits of spark-assisted HCCI combustion. In: Proceedings of the 2012 American control conference, Montreal, QC, Canada, 27–29 June 2012. New York: IEEE.
17. Hellstrom E, Stefanopoulou A, Vavra J, Babajimopoulos A, Assanis D, Jiang L and Yilmaz H. Understanding the dynamic evolution of cyclic variability at the operating

limits of HCCI engines with negative valve overlap. SAE paper 2012-01-1106, 2012.
18. Xie H, Hou S, Qin J, Zhang Y, Li N and Zhao H. Control strategies for steady and transient operation of a 4-stroke gasoline engine with CAI combustion using a 4-variable valve actuating system (4VVAS). SAE paper 2006-01-1083, 2006.
19. Olesky LM, Martz JB, Lavoie GA, Vavra J, Assanis DN and Babajimopoulos A. The effects of spark timing, unburned gas temperature, and negative valve overlap on the rates of stoichiometric spark assisted compression ignition combustion. Appl Energ 2013; 105: 407–417.
20. Persson H, Hultqvist A, Johansson B and Remo´ n A. Investigation of the early flame development in spark assisted HCCI combustion using high speed chemilumi- nescence imaging. SAE paper 2007-01-0212, 2007.
21. Heywood J. Internal combustion engine fundamentals. McGraw-Hill, 1988.
Appendix 1NotationCA02 crank angle at 2% burned mass CA10 crank angle at 10% burned mass CA50 crank angle at 50% burned mass CA90 crank angle at 90% burned mass CA-Pmax crank angle at maximum pressure ISFC indicated specific fuel consumption Pmax maximum pressurePVO positive valve overlap


![Analysis of CAPF Aptitude & Reasoning [last 5years]](https://static.fdocuments.in/doc/165x107/61bd251161276e740b0fd10c/analysis-of-capf-aptitude-amp-reasoning-last-5years.jpg)

![[Result] UPSC CAPF Assistant Commandant (AC) 2012 Result Announced (and PET Tips) « Mrunal](https://static.fdocuments.in/doc/165x107/56d6caf71a28ab30169c9e2a/result-upsc-capf-assistant-commandant-ac-2012-result-announced-and-pet.jpg)