06- Geotechnical Effects on Critical Facilities-19 June 2014
30
6. GEOTECHNICAL EFFECTS ON CRITICAL STRUCTURES DURING THE MARCH 5 TH FLOOD EVENT Flood induced geotechnical failures were investigated by the GEER team during their deployment for the March 5 th flood event. Bridge scour was investigated on bridges along the Avon and Heathcote Rivers. The GEER team visited the port in Lyttelton to explore damage that may have been induced by the flood event. Updates to GEER’s reconnaissance conducted after the February 2011 Christchurch earthquake are also presented that could not be previously released due to economic sensitivities for Lyttelton Port Christchurch (LPC). Lastly, the potential failure of a newly constructed earth retaining wall in the Port Hills is explored. Bridge scour Scour represents one of the major failure mechanisms of bridges (Melville and Coleman, 2000). In particular, the increase in water flow velocities during heavy rain and flood events can lead to increased sediment erosion in the vicinity of bridge piles, and by doing so, potentially lead to failure of the bridge. Due to the complex and interdisciplinary nature of the processes (Sumer and Fredsoe 2002), the prediction of scour and potential bridge pile failure is still a subject of research. In Christchurch the impact of the previous earthquake related damage to the bridges and possible changes in river morphology represent another variable that is still in the process of being considered and investigated. The GEER team conducted a rough survey of possible scour at four Avon River bridges identified in Figure 6-1 and two Heathcote River bridges identified in Figure 6-2. Figure 6-3 shows how the water depth was sounded along the bridges, using a diving weight and a marked rope. Indications for scour were mainly found at Pages Street Bridge and Wainoni Road (Bower) Bridge (both crossing the Avon River; Figure 6-1). However, large uncertainties have to be considered regarding the simple and coarse sounding technique. Detailed investigations including more measurements around the foundations would allow more definitive conclusions to be made. In the following sections, a background of the bridges is given and the results of the soundings presented.
-
Upload
cophongsuong -
Category
Documents
-
view
213 -
download
1
description
06- Geotechnical Effects on Critical Facilities-19 June 2014
Transcript of 06- Geotechnical Effects on Critical Facilities-19 June 2014

6. GEOTECHNICAL EFFECTS ON CRITICAL STRUCTURES DURING
THE MARCH 5TH
FLOOD EVENT
Flood induced geotechnical failures were investigated by the GEER team during their
deployment for the March 5th
flood event. Bridge scour was investigated on bridges along the
Avon and Heathcote Rivers. The GEER team visited the port in Lyttelton to explore damage that
may have been induced by the flood event. Updates to GEER’s reconnaissance conducted after
the February 2011 Christchurch earthquake are also presented that could not be previously
released due to economic sensitivities for Lyttelton Port Christchurch (LPC). Lastly, the potential
failure of a newly constructed earth retaining wall in the Port Hills is explored.
Bridge scour
Scour represents one of the major failure mechanisms of bridges (Melville and Coleman, 2000).
In particular, the increase in water flow velocities during heavy rain and flood events can lead to
increased sediment erosion in the vicinity of bridge piles, and by doing so, potentially lead to
failure of the bridge. Due to the complex and interdisciplinary nature of the processes (Sumer
and Fredsoe 2002), the prediction of scour and potential bridge pile failure is still a subject of
research. In Christchurch the impact of the previous earthquake related damage to the bridges
and possible changes in river morphology represent another variable that is still in the process of
being considered and investigated.
The GEER team conducted a rough survey of possible scour at four Avon River bridges
identified in Figure 6-1 and two Heathcote River bridges identified in Figure 6-2. Figure 6-3
shows how the water depth was sounded along the bridges, using a diving weight and a marked
rope. Indications for scour were mainly found at Pages Street Bridge and Wainoni Road (Bower)
Bridge (both crossing the Avon River; Figure 6-1). However, large uncertainties have to be
considered regarding the simple and coarse sounding technique. Detailed investigations
including more measurements around the foundations would allow more definitive conclusions
to be made. In the following sections, a background of the bridges is given and the results of the
soundings presented.

Figure 6-1 Bridges surveyed regarding possible scour along the Avon River.
Figure 6-2 Bridges surveyed regarding possible scour along the Heathcote River.

(a) (b)
Figure 6-3 (a) Depth soundings at Anzac Drive Bridge and (b) depth reading using a marked
rope.
A) Avon River Bridges
Bridge Street Bridge
The South Brighton Bridge, or Bridge Street Bridge, crosses the Avon River in an east-west
orientation, connecting the suburbs of South New Brighton and Bromley (Figure 6-1). It is the
final crossing on the Avon before it enters the Avon-Heathcote Estuary, and provides the
primary link for the suburbs of South New Brighton and Southshore.
Original structure
The original bridge was constructed in 1981 and had a total length of 65 m over three spans of
in-situ cast concrete supported by precast post-tensioned concrete I-beams (21.5 m-22 m-21.5 m)
and a total width of 15.2 m. Details of the original plan and elevation are provided in Figure 6-4
and Figure 6-5. To construct the bridge, two approach embankments approximately 4 m in height
were extended out into a wetland area, with the bridge structure spanning the river channel.
The spans are supported by octagonal precast concrete piers with hammerhead pier caps and
seat-type concrete abutments. Elastomeric bearings have been used to isolate the super-structure
in both the longitudinal and transverse directions. Both piers and abutments are supported by
raked pre-tensioned reinforced concrete octagonal piles (450 mm wide and 18.7 m in length).
These are installed at the piers with a rake of 14° from vertical. Each abutment has ten piles, and
each pier is supported by a pile cap with twelve piles.
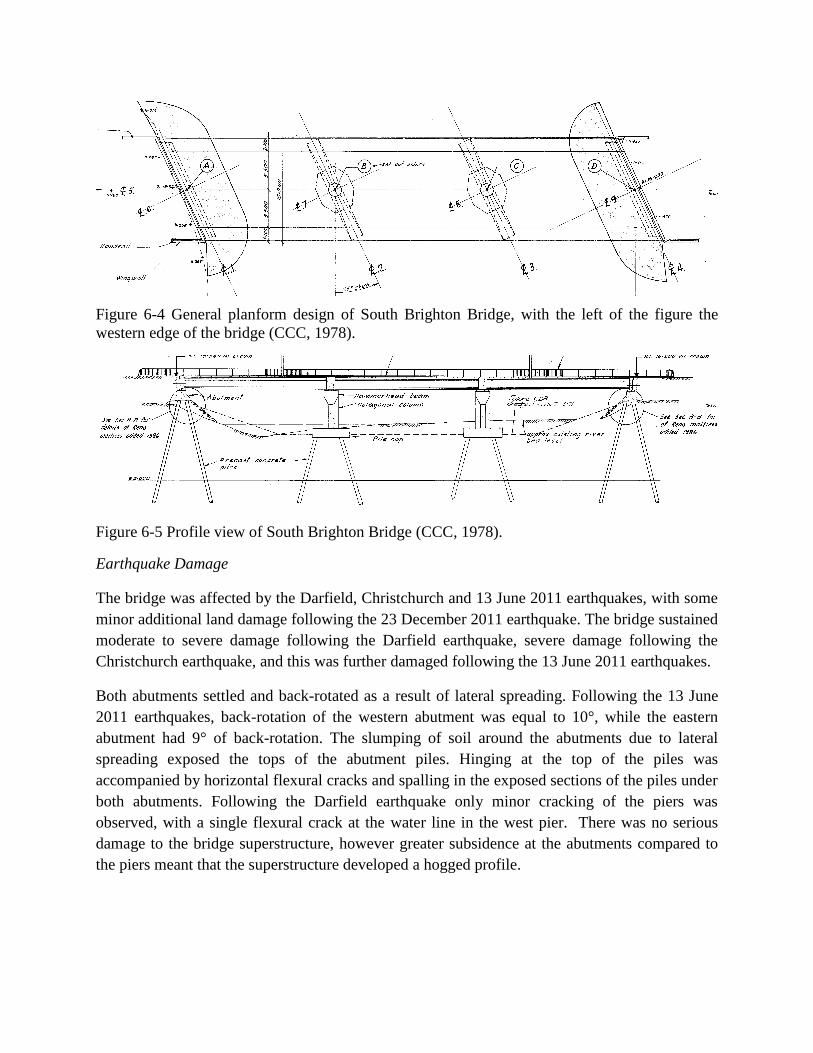
Figure 6-4 General planform design of South Brighton Bridge, with the left of the figure the
western edge of the bridge (CCC, 1978).
Figure 6-5 Profile view of South Brighton Bridge (CCC, 1978).
Earthquake Damage
The bridge was affected by the Darfield, Christchurch and 13 June 2011 earthquakes, with some
minor additional land damage following the 23 December 2011 earthquake. The bridge sustained
moderate to severe damage following the Darfield earthquake, severe damage following the
Christchurch earthquake, and this was further damaged following the 13 June 2011 earthquakes.
Both abutments settled and back-rotated as a result of lateral spreading. Following the 13 June
2011 earthquakes, back-rotation of the western abutment was equal to 10°, while the eastern
abutment had 9° of back-rotation. The slumping of soil around the abutments due to lateral
spreading exposed the tops of the abutment piles. Hinging at the top of the piles was
accompanied by horizontal flexural cracks and spalling in the exposed sections of the piles under
both abutments. Following the Darfield earthquake only minor cracking of the piers was
observed, with a single flexural crack at the water line in the west pier. There was no serious
damage to the bridge superstructure, however greater subsidence at the abutments compared to
the piers meant that the superstructure developed a hogged profile.

Retrofit of structure
Retrofit of Bridge St Bridge commenced in 2013, involving strengthening of the bridge structure
and stabilisation of the river bank and embankment slopes at the abutments with a jet grouted
column lattice structure to mitigate liquefaction and lateral spreading effects. Four 1.2 m
diameter concrete filled steel tube piles will be installed at each abutment to a depth of
approximately 40 m into dense gravels. The superstructure will be jacked level to reduce stresses
caused by the hogging, and abutments were rebuilt with geogrid (Keepa et al., 2014). This work
is estimated to be completed in mid-late 2014.
Scour
With the original river bed level (Figure 6-5), scour would correspond to the octagonal columns,
probably reaching the pile caps and making them a scour protection. With full exposure of the
pile caps, scour would be expected to develop in a different shape, in response to the sharp pile
cap edges. However, destabilization of the bridge due to scour is very unlikely, because of the
support provided by the concrete piles. Surveying was limited due to construction work (Figure
6-6, Figure 6-7, and Figure 6-8). Figure 6-8 shows the soundings generally indicating a
deepening towards the east in the channel, and the downstream side was generally deeper by
~30-40 cm. An irregularity was found at a distance of 24-26 m from the western lightpost which
served as datum. Due to the limited soundings, it cannot be determined if the shoaling or the
deepening represents the irregularity, or if this might be related to scour processes and/or an
increase of erosion during the flood. A shoaling could be related to a gravel bank deployed
around the piers for a remediation of the pier pile caps. A more detailed investigation after the
conclusion of the construction work would answer this question.

Figure 6-6 Sounding at South Brighton Bridge with construction work in the background on 19
March 2014.
Figure 6-7 Location of upstream (yellow) and downstream transects superimposed on aerial
photo from 24 December 2011 (Canterbury Geotechnical Database 2012).
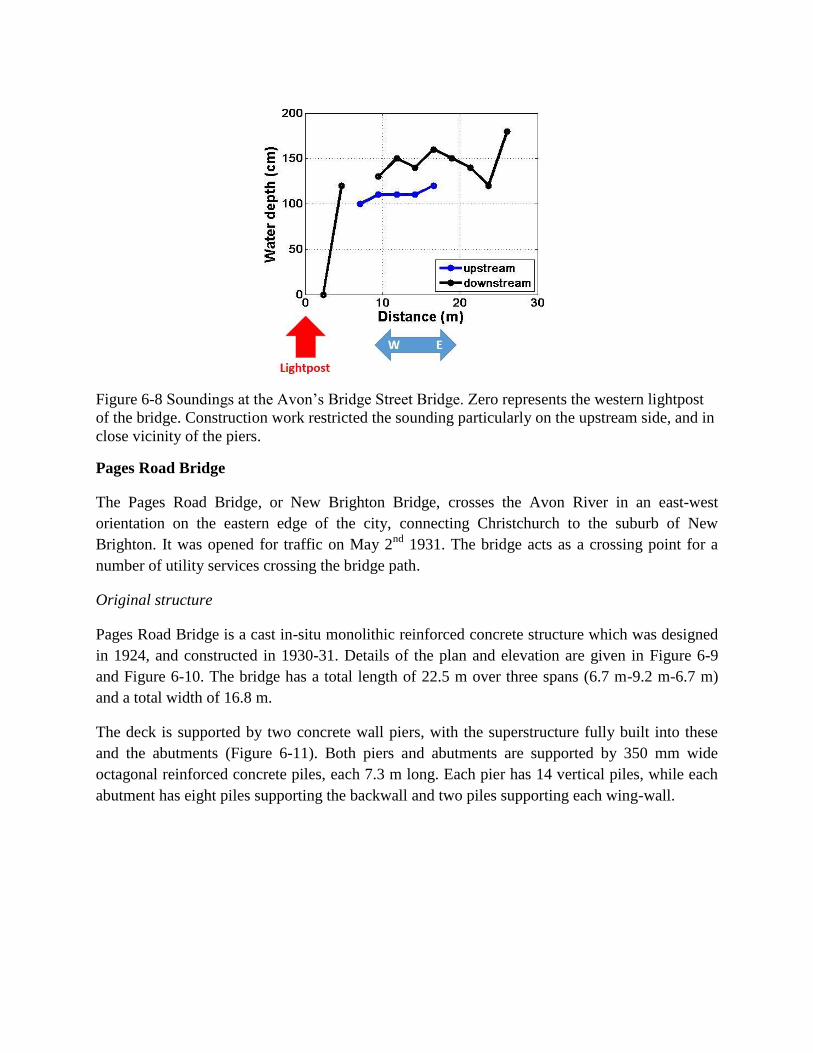
Figure 6-8 Soundings at the Avon’s Bridge Street Bridge. Zero represents the western lightpost
of the bridge. Construction work restricted the sounding particularly on the upstream side, and in
close vicinity of the piers.
Pages Road Bridge
The Pages Road Bridge, or New Brighton Bridge, crosses the Avon River in an east-west
orientation on the eastern edge of the city, connecting Christchurch to the suburb of New
Brighton. It was opened for traffic on May 2nd
1931. The bridge acts as a crossing point for a
number of utility services crossing the bridge path.
Original structure
Pages Road Bridge is a cast in-situ monolithic reinforced concrete structure which was designed
in 1924, and constructed in 1930-31. Details of the plan and elevation are given in Figure 6-9
and Figure 6-10. The bridge has a total length of 22.5 m over three spans (6.7 m-9.2 m-6.7 m)
and a total width of 16.8 m.
The deck is supported by two concrete wall piers, with the superstructure fully built into these
and the abutments (Figure 6-11). Both piers and abutments are supported by 350 mm wide
octagonal reinforced concrete piles, each 7.3 m long. Each pier has 14 vertical piles, while each
abutment has eight piles supporting the backwall and two piles supporting each wing-wall.

Figure 6-9 General plan of Pages Road Bridge, with the left of the figure the western edge of the
bridge (Toogood, 1929).
Figure 6-10 Elevation view of Pages Road Bridge (Toogood, 1929).

Figure 6-11 Pages Road Bridge on 19 March 2014.
Earthquake Damage
The bridge was mainly affected by the Christchurch earthquake, with some minor additional land
damage following the 13 June 2011 earthquake. The bridge sustained moderate damage
following the Christchurch earthquake due to liquefaction and lateral spreading, and this was
further progressed following the 13 June 2011 earthquakes.
Both abutments developed minor back-rotation and cracking, and there was significant
settlement of the approaches as a result of liquefaction and lateral spreading during the
Christchurch earthquake. There was a slight increase in the abutment back rotation following the
13 June 2011 earthquakes. Minor cracking at the interface between the eastern pier and the deck
beam was identified following the Christchurch earthquake.
Retrofit of structure
The planned retrofit of this bridge, involving improvements to the approach and abutments, had
yet to commence at the time of the March 2014 flood event and post-flood GEER
reconnaissance.
Scour
Figure 6-12 shows the sounding results at Pages Road Bridge indicating a deepening by ~ 0.4 m
and narrowing of the Avon River downstream. The cross-bridge profiles do not indicate scour.
However, at the western pier measurements at a distance of ~1 m (cross-profile) and at ~0.1 m
were conducted. Downstream of the pier, the water depth equalled ~1.8 m, which was in accord
with the general channel profile (Figure 6-12). Close to the pier foundation the water depth was

only ~1.5 m, possibly corresponding to sediment accumulation in the lee of the structure as is
typically seen when scour occurs. On the upstream side, a water depth of ~1.6 m was measured
at a distance of ~1 m from the piers, while at the pier foundation a water depth of 1.8-1.9 m was
measured over four soundings, likely representing a scour hole as typically seen at the upstream
side of a structure. Thus, the results hint at scour at the pier foundations of Pages Road Bridge
with erosion reaching scour depths and sediment accumulations in the range of ~ 0.3 m. Such
scour depths will unlikely represent a hazard, however, monitoring of scour development should
be considered in cases of an increasing occurrence of flood events, and results might be
considered for the retrofit of the bridge.
Figure 6-12 Soundings at Pages Road Bridge. Measurements level with the piles are indicated as
red circles. Zero corresponds to the eastern lightpost.
Wainoni Road Bridge (Bower)
The Wainoni Road Bridge, or Bower Bridge, crosses the Avon River in an approximately north-
south orientation on the eastern edge of the city, connecting the suburbs of Wainoni and New
Brighton. The bridge was opened in 1942.
Original structure
Wainoni Road Bridge is a three span reinforced concrete structure with the deck supported by
two concrete wall piers.
Earthquake Damage
The bridge was mainly affected by the Christchurch earthquake, with slumping and minor lateral
spreading of the approaches to the bridge. This only has a minor effect on the bridge structure.

Retrofit of structure
There had been no retrofit applied to this bridge at the time of the flood event.
Scour
The soundings shown in Figure 6-13 were conducted only on the downstream side of the bridge
only due to traffic. The channel profile appears generally approximately symmetric. Different
measurements have been conducted in the vicinity of the pier foundations. Behind the piers, the
water depths corresponded well to the general profile, possibly showing some slight sediment
accumulation at the southern pier foundations. However, both corners were characterized by
significant deepening by 0.3-0.7 m. Approximately 4 m downstream of the southern pier,
sediment accumulation of ~ 0.4 m was identified. This was not confirmed at the northern pier.
Nevertheless, these results suggest the development of some scour at Bower Bridge. A more
sophisticated survey strategy is recommended to investigate the scour and possible related
hazards in more detail. The coarse and very simple method presented here is certainly not
sufficient to draw any definitive conclusions.
Figure 6-13 Soundings at Bowers Bridge. No measurements were conducted on the upstream
side of the bridge due to traffic. Regarding measurements at the pier pile foundations, red circles
indicate sounding behind the square piles, green circles at the corner and blue circles ~ 4 m
downstream.
Anzac Drive Bridge
The Anzac Drive Bridge, shown in Figure 6-14, is located on State Highway 74 and crosses the
Avon River in a north-south orientation. The bridge also acts as a crossing point for a number of
utility service lines.
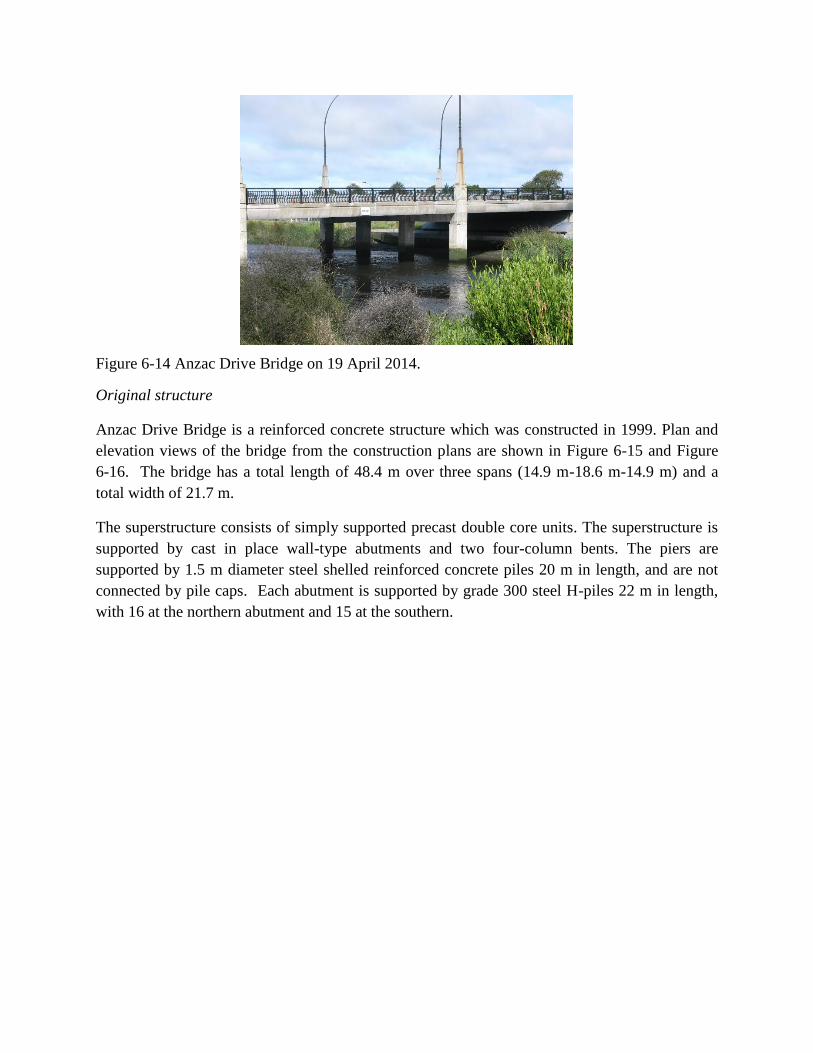
Figure 6-14 Anzac Drive Bridge on 19 April 2014.
Original structure
Anzac Drive Bridge is a reinforced concrete structure which was constructed in 1999. Plan and
elevation views of the bridge from the construction plans are shown in Figure 6-15 and Figure
6-16. The bridge has a total length of 48.4 m over three spans (14.9 m-18.6 m-14.9 m) and a
total width of 21.7 m.
The superstructure consists of simply supported precast double core units. The superstructure is
supported by cast in place wall-type abutments and two four-column bents. The piers are
supported by 1.5 m diameter steel shelled reinforced concrete piles 20 m in length, and are not
connected by pile caps. Each abutment is supported by grade 300 steel H-piles 22 m in length,
with 16 at the northern abutment and 15 at the southern.

Figure 6-15 General plan of Anzac Drive Bridge, with the left of the figure the southern edge of
the bridge (CCC, 1999).
Figure 6-16 Elevation view of Anzac Drive Bridge (CCC, 1999).
Earthquake Damage
The bridge sustained moderate to severe damage following the Christchurch earthquake due to
liquefaction and lateral spreading, and this was further progressed in the subsequent events,
mainly the 13 June 2011 earthquakes.
Both the abutments settled and back-rotated as a result of the lateral spreading in the
Christchurch and June 2011 earthquakes. Following the Christchurch earthquake, the northern

abutment developed approximately 4° of back rotation, while the southern abutment to back
rotated by 6° and displaced towards the river. There was slight additional rotation of the
abutments following the 13 June 2011 earthquakes.
Following the Christchurch earthquake, both pier frames suffered extensive cracking of the
concrete columns and beams as well as the beam-column joint regions of the pier cap. Spalling
of the concrete cover appears to be primarily as a result of interaction between the transverse
motion of the bridge and the rotation of the piers due to lateral spreading. There was no serious
damage to the bridge superstructure.
Retrofit of structure
No details of the repair and retrofit approach are available at this stage.
Scour
Figure 6-17 shows the riverbed profile determined from soundings. The riverbed at Anzac Drive
Bridge is defined by directing the major part of the flow through the piers. No significant
variation in morphology can be observed at the piers. Immediate deepening in front and slightly
more at the pier foundations corners can possibly be related to scour, but (i) has no significant
impact on channel morphology, and (ii) from this limited data set, cannot be determined if
related to scour.

Figure 6-17 Soundings at Anzac Drive Bridge. Only upstream measurements were possible due
to traffic.
B) Heathcote River
Heathcote River Bridge
Figure 6-18 Heathcote River Bridge on 20 March 2014.
The Heathcote River Bridge shown in Figure 6-18 is located on State Highway 74 and crosses
the Heathcote River in a north-south orientation. The bridge also acts as a crossing point for a
number of service lines.
Original structure
Heathcote River Bridge is a reinforced concrete structure which was constructed in 1963. The
bridge has a total length of 52 m over three spans and a total width of 10.6 m.
The superstructure consists of 10 prestressed concrete precast I-beams simply supported at the
abutments. The superstructure is supported by reinforced concrete abutments and three column
reinforced concrete piers and pile cap. The piers are supported by ten 4.32 m vertical octagonal
reinforced concrete piles. Each abutment is supported by the same number of raked piles.
Earthquake Damage
The bridge was undamaged during the Darfield earthquake. During the Christchurch earthquake
there was a significant amount of lateral spreading and cracking of the approach soils and
approach settlement. There was approximately 1° of back rotation of the north abutment towards
the river.
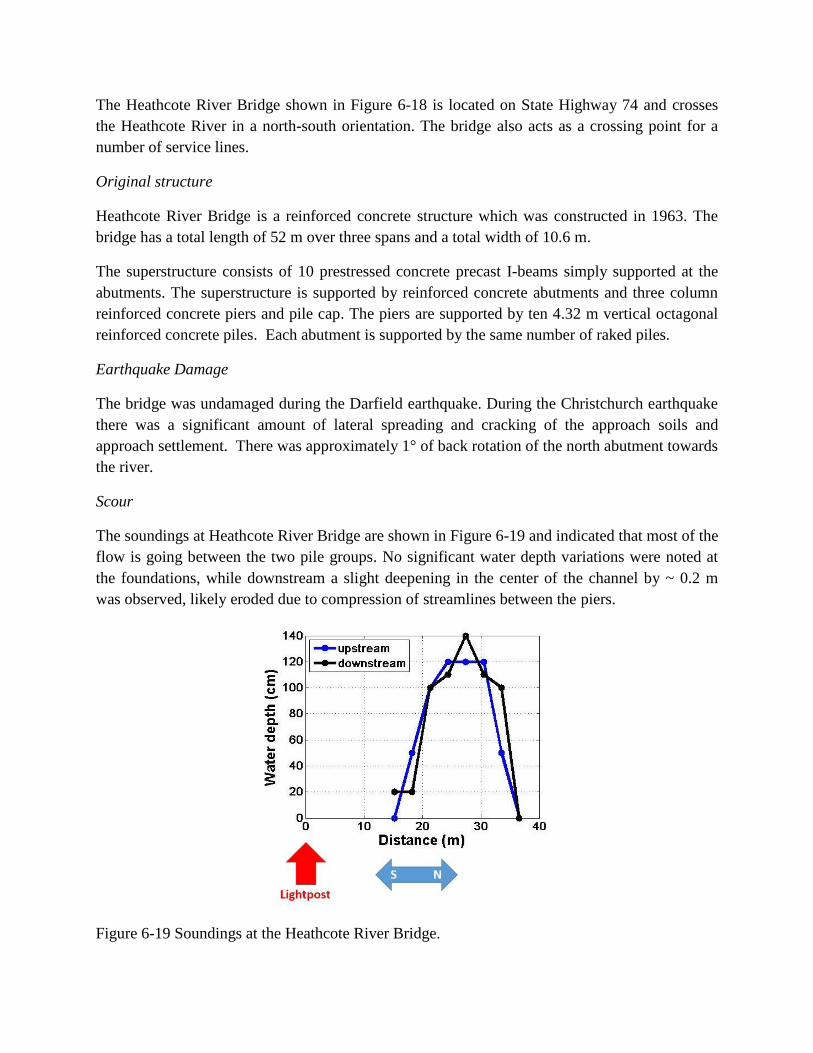
Scour
The soundings at Heathcote River Bridge are shown in Figure 6-19 and indicated that most of the
flow is going between the two pile groups. No significant water depth variations were noted at
the foundations, while downstream a slight deepening in the center of the channel by ~ 0.2 m
was observed, likely eroded due to compression of streamlines between the piers.
Figure 6-19 Soundings at the Heathcote River Bridge.

Rutherford Street Bridge
The Rutherford Street Bridge is shown in Figure 6-20 and located on State Highway 74. It
crosses the Heathcote River in a north-south orientation. The bridge also acts as a crossing point
for a number of service lines.
Figure 6-20 Rutherford Street Bridge on 20 March 2014.
Original structure
Rutherford Street Bridge is a reinforced concrete structure which was constructed in 1983. The
bridge has a total length of 39.7 m over three spans and a total width of 18.6 m.
The superstructure consists of 13 reinforced T-beams simply supported at the abutments. The
superstructure is supported by tall reinforced concrete abutments and two wall-type piers. The
piers are supported by twelve 4.5 m raked octagonal prestressed concrete piles. Each abutment is
supported by the same foundation system.
Earthquake Damage
The bridge was undamaged during the Darfield earthquake. During the Christchurch earthquake
the high abutment walls rotated and displaced horizontally, closing the abutment joint gaps, and
the approach had settled by approximately 0.1 m. Lateral spreading may have been a factor
causing this damage.
Scour
The soundings shown in Figure 6-21 highlighted that flow is funneled through the two pier
structures, but no indicators for scour were observed.

Figure 6-21 Soundings at Rutherford Street Bridge. Pier pile locations are indicated in green.
Lyttelton Port of Christchurch
The GEER team visited Lyttelton Port of Christchurch (LPC) on 21 March 2014 for an update on
the port’s development after the earthquakes in 2010 and 2011 and to investigate possible flood
impacts on the port (Figure 6-22).

Figure 6-22 Google Earth image showing the location of Lyttelton (43° 36’ 13.61” S; 172° 43’
9.79” E) in comparison to the city of Christchurch. Additionally, the image highlights Lyttelton’s
location at the foot of the steep slope characterizing particularly this northern region of the
harbour. While the port location offers a great advantage regarding the protection from energetic
wave action, heavy rainfall events in conjunction with steep slopes might represent a hazard
here.
Port Overview
LPC is the NZ South Island’s biggest port and documented 525 ship visits and the handling of
185,748 Total Container Volumes (TEUs) in the second half of 2013. The port was able to
sustain its steady increase in revenues (6.4%) to $57.6 million (July-Dec 2013). This highlights
the performance success during and post-earthquakes, despite the immediate vicinity to the
epicenter of especially the 2011 earthquake and significant damages to port structures. The port
has specialized facilities for containerized cargo, coal, fishery products, forestry products and
petrochemical products (LPC, 2005). The layout of the main wharves at the port is indicated in
Figure 6-23. Prior to the Canterbury earthquake sequence the majority of this cargo was handled
on the four Cashin Quay wharves. The Z berth was used by the fishing industry, the Oil Wharf
by the petrochemical industry, and the remainder handled dry bulk, vehicles and passengers. All
wharves are supported by vertical pile foundations that are constructed of hardwood timber,
reinforced concrete or steel tubes.

Figure 6-23 Layout of Lyttelton Port of Christchurch highlighting the main wharves (Ragued et
al. 2014).
Earthquake Damage
The port was initially damaged during the Darfield earthquake, with subsoil movements resulting
in settlement and lateral deformation. In the main port area these movements were attributed to a
slope failure in the soft clay and silty sand layers, and were not believed to be due to any
liquefaction effects. However, liquefaction and lateral spreading in the Oil Terminal area
affected the Oil Wharf, tanks and pipe work.
More significant movements and damage to wharves, breakwaters, quays and reclaimed land
occurred as a result of the Christchurch earthquake, with up to 0.5 m of vertical movement and 1
m of lateral movement recorded. There was further significant movement and damage from the
13 June 2011 earthquakes. Cashin Quay moved seaward, and piles, beams and tiebacks
fractured. Paved areas were cracked due to lateral movements, and container cranes were
knocked off their rails. Following the June earthquakes, temporary stabilization works were put
in place. Wharf damage at Z berth mean that it could not be used following these events.
After the earthquakes the port was operating with a third less land in the Cashin Quay area due to
the damage and repair works. Despite the severity of the earthquakes, the port was basically
operational within hours following the Darfield earthquake, and within 96 hours following the
Christchurch and 13 June 2011 earthquakes (LPC, 2011).
200 mCashin Quay 1 - 4
Z Berth
No.1 Wharf
No.2 Wharf
Oil Wharf
No.3 Wharf
No.7 Wharf

Port development post-earthquakes
A mediation process with the port insurers concluded in December 2013. A settlement of claims
arising from earthquake damage involves the payment of $450 million (gross). An amount of
$66 million has already been expended on keeping the port operational after the earthquakes,
while the remaining funds will be invested in future port development. The extended mediation
process also contributed to the fact that some earthquake damage was still visible during the NZ-
GEER team visit in March 2014 (Figure 6-24).
Figure 6-24 Example of visible earthquake induced damage to Cashin Quay in March 2014.
Early development of the port structures after the earthquakes has been mainly focused on the Te
Awaparahi Bay land reclamation shown in Figure 6-25 and the investigation of engineering
strategies to stabilize Cashin Quay wharves 1-3 (Figure 6-22). For the latter, stabilization with
piles to sustain a vertical port wall or a sloped rubble-mound support structure have been
considered. The Te Awaparahi Bay land reclamation has already reached an expansion of 5
hectares using reusable rubble from demolitions in Christchurch, half of the 10 hectare initial
target (Figure 6-25 and Figure 6-26). The gained land will offer the required space for a further
increase in shipping activities, and arguably offered an adhoc solution for demolition material
from Christchurch once the reclamation had overcome legal issues arising from initial
emergency, uncleaned and uncontained reclamation works and the decontamination and

containment of fill was sorted out. Further planned developments will include the expansion of
cruise boat tourism in LPC.
Figure 6-25 Planned area of reclamation in Te Awaparahi Bay (LPC, 2011).
Figure 6-26 Te Awaparahi Bay land reclamation area on 21 March, 2014.
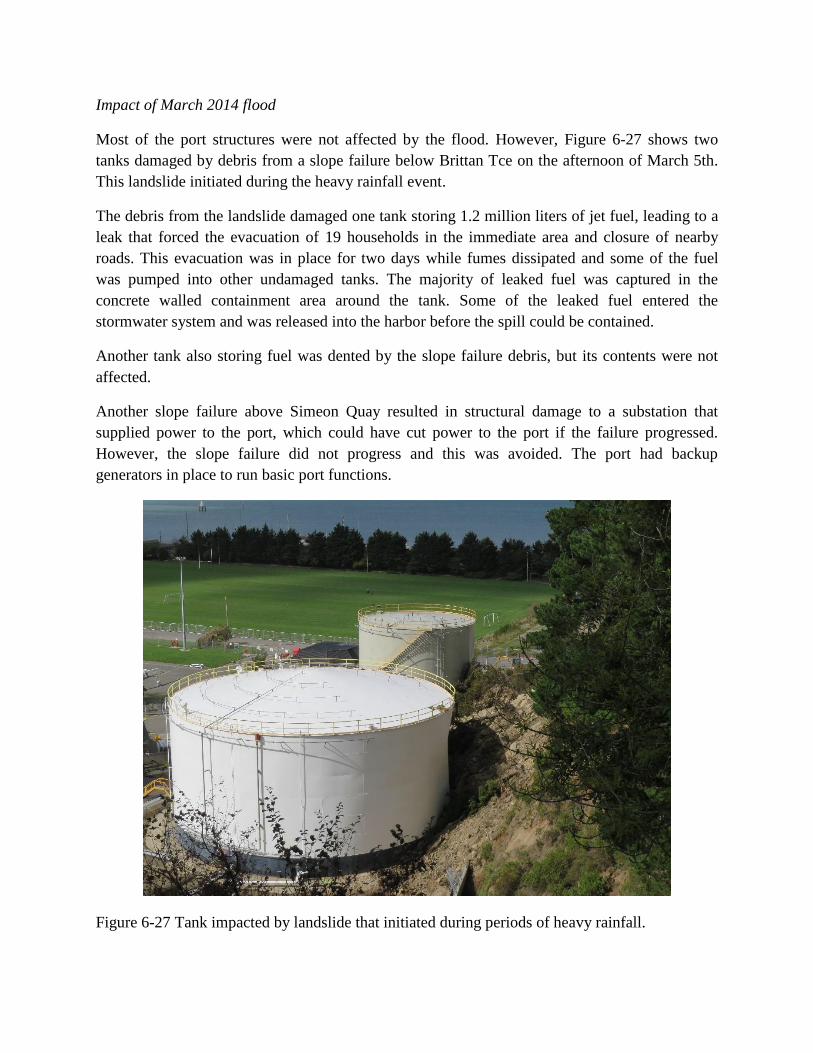
Impact of March 2014 flood
Most of the port structures were not affected by the flood. However, Figure 6-27 shows two
tanks damaged by debris from a slope failure below Brittan Tce on the afternoon of March 5th.
This landslide initiated during the heavy rainfall event.
The debris from the landslide damaged one tank storing 1.2 million liters of jet fuel, leading to a
leak that forced the evacuation of 19 households in the immediate area and closure of nearby
roads. This evacuation was in place for two days while fumes dissipated and some of the fuel
was pumped into other undamaged tanks. The majority of leaked fuel was captured in the
concrete walled containment area around the tank. Some of the leaked fuel entered the
stormwater system and was released into the harbor before the spill could be contained.
Another tank also storing fuel was dented by the slope failure debris, but its contents were not
affected.
Another slope failure above Simeon Quay resulted in structural damage to a substation that
supplied power to the port, which could have cut power to the port if the failure progressed.
However, the slope failure did not progress and this was avoided. The port had backup
generators in place to run basic port functions.
Figure 6-27 Tank impacted by landslide that initiated during periods of heavy rainfall.

Concerns were expressed regarding the safety issue and current closure of (Old) Sumner Rd.
These roads represented an alternative access route to Lyttelton and the port in the case of tunnel
closure. Significant destabilization of the steep slopes along these roads as shown in Figure 6-28
made them a major safety issue and led to closure. An alternative trucking route to the port is
highly desired as a backup to the tunnel. The tunnel entrances are subject to risk of closure due
to landslides, which risk may even increase during heavy rain events. If it came to a flood in the
tunnel at the same time, the port could theoretically become inaccessible. No such observations
were made during the flood and heavy rainfalls in March 2014, but it was mentioned as a
possible concern related to flood and heavy rainfall events.
Figure 6-28 Steep slopes and destabilized debris still represent a risk for Sumner Rd.
Lyttelton stormwater failure
The over topping of the storm water inlet shown in Figure 6-29 at the top of Canterbury Street in
Lyttelton led to progressive failures downstream during the March 5th
flood event. This storm
water inlet is at the top of the drainage system and collects water that flows off the top of the Port
Hills in an undeveloped section above Lyttelton. The GEER team found the culvert unplugged
and free flowing at the time of its field reconnaissance. Evidence was found that the inlet became
plugged at some point during the storms leading to overtopping of the collection basin and
undermining/erosion downstream of the inlet structure as shown in Figure 6-29b.

(a) (b)
Figure 6-29 Storm water inlet at the top of Canterbury Street that was overtopped during the
March 5th
event (Canterbury Street: -43.596225°, 172.723001°).
Water then eroded the pavement and base course exposing the storm water pipe as shown in
Figure 6-30a. As shown in Figure 6-30b, the erosion of pavement and the base course continued
down Canterbury Street. Repairs to the streets shown in Figure 6-30c had been made at the time
of the GEER team’s reconnaissance.
(a) (b)

(c)
Figure 6-30 Erosion as a result of the storm water inlet in Figure 6-29 overtopping. (Photos (a)
and (b) courtesy of Michael Hayes) (c) Canterbury Street restored to grade (93 Canterbury
Street: -43.596590°, 172.722847°).
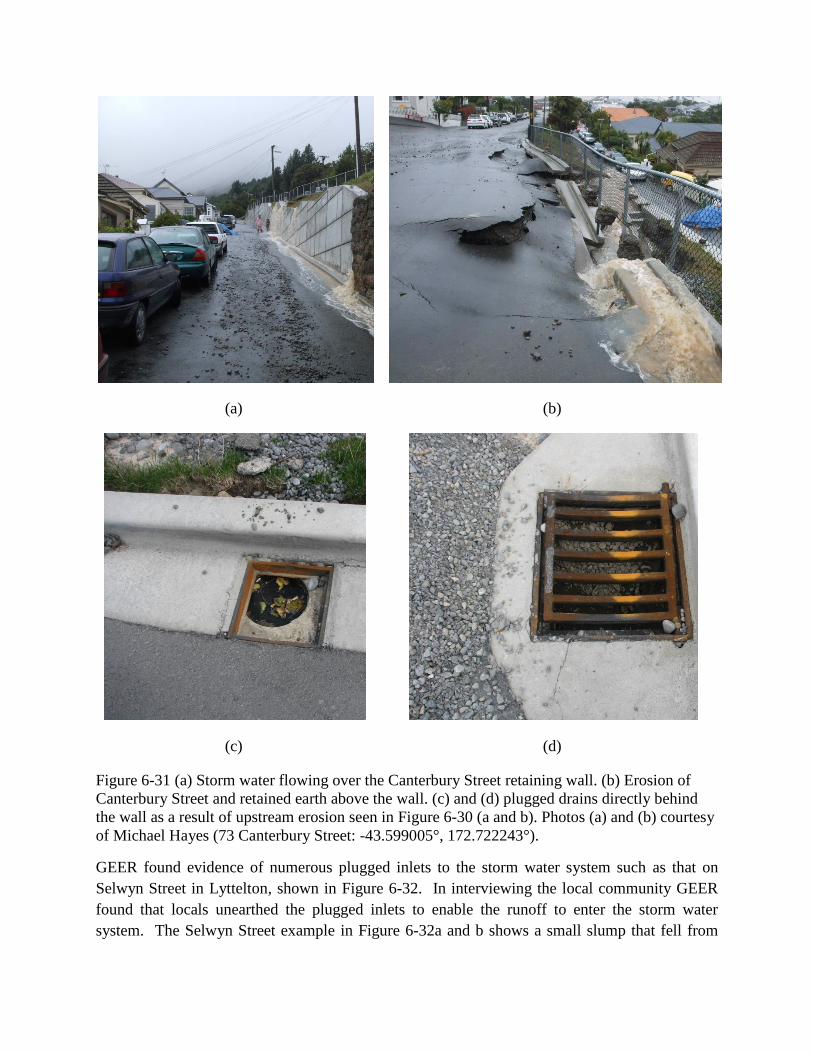
Further down Canterbury Street, water eroded the retained earth and street above a retaining wall
shown in Figure 6-31, which had previously failed and been replaced in 2013 by SCIRT. The
new retaining wall consists of a wet cast block. As shown in Figures 6-31c and 6-31d, the
drainage system behind the wall was found to be plugged at the time of the GEER teams visit on
March 22, 2014. SCIRT reported that the wall was found to be safe. GEER found no
noticeable horizontal wall movement. SCIRT also reported damage to a new retaining wall
being constructed on Sumner Road as a result of the flood event.
(a) (b)
(c) (d)
Figure 6-31 (a) Storm water flowing over the Canterbury Street retaining wall. (b) Erosion of
Canterbury Street and retained earth above the wall. (c) and (d) plugged drains directly behind
the wall as a result of upstream erosion seen in Figure 6-30 (a and b). Photos (a) and (b) courtesy
of Michael Hayes (73 Canterbury Street: -43.599005°, 172.722243°).
GEER found evidence of numerous plugged inlets to the storm water system such as that on
Selwyn Street in Lyttelton, shown in Figure 6-32. In interviewing the local community GEER
found that locals unearthed the plugged inlets to enable the runoff to enter the storm water
system. The Selwyn Street example in Figure 6-32a and b shows a small slump that fell from

above the drainage inlet and plugged it resulting in the flow being routed down Selwyn Street
instead of into the storm water system.
It’s plausible that had the culvert not been unplugged during the storm event that water pressure
behind the walls in Figures Figure 6-32c and Figure 6-32d could have resulted in failure, or
failure of another type further downstream. A previous landslide below the sheet pile wall in
Figure 6-32c had occurred prior to the 2010-2011 Canterbury earthquake sequence resulting in
damage to the home below which is no longer present.
(a) (b)
(c) (d)
Figure 6-32 Unplugged culvert on Selwyn Street above crib retaining wall, Photo courtesy of
Michael Hayes (a). Post cleanup by CCC at the drain inlet (b). Previous slope failure and

installed sheet pile retaining wall (c) adjacent to crib wall with culvert out let picture left (d) (17
Selwyn Road: -43.598748°, 172.716026°).
Avon River stop-banks
Before the Canterbury earthquake sequence, the crest level of the majority of stop-banks were at
a river level (RL) or stage of 11.2 m (CCD datum). Along Hulverstone Drive in Avondale, the
stopbank crest level was at 10.9 m (Harris, 2003). The 11.2 m RL was based on a 1% annual
exceedance probability storm surge event with 0.2 m of freeboard (GHD 2012). The crest level
for much of this system was at a similar elevation as the residential areas surrounding the river.
Although subsidence occurred as a result of the Darfield earthquake along the Avon River the
majority occurred as a result of the Christchurch earthquake. As a result of that subsidence, CCC
constructed a new system of stop-banks along both sides of the river from the edge of the CBD
to the mouth of the Avon River to the east. In some locations, stop-banks had to be built over a
meter above the ground level of the surrounding areas.
Prior to a pergiean spring side or king tide event in July 2011, more than 11 km of stop-banks
were built up to a 10.8 m RL along the Avon River in four days. A silty gravel was used for
construction, as this was easily accessible and was reasonably impermeable. In some areas sand
bagging was used as a temporary means of flood control. Due to the time constraints imposed by
the king tide event, no improvement of the soils below the stop-banks could be carried out to
mitigate the effects of liquefaction and lateral spreading in future earthquakes. These new stop-
banks were damaged multiple times during the most severe aftershocks. This system of
temporary stop-banks performed reasonably well during the king tide event.
Following the emergency king tide event in July of 2011, the stop-banks were restored to a RL of
11.2 m. The primary design used 3:1 or 4:1 battered slopes with a 2.5 m wide top where space
was available. When space was limited along the river’s edge diamond block walls and
reinforced earthen walls were used in place of the stopbank design.
During the March 5th
flood event the Avon River stop-banks performed as expected by CCC.
The March 5th
flood event also happened to coincide with a pergiean spring tide which caused
flood waters to be retained behind the stop-banks once the river level had dropped below the
flood water level. This posed a lack of drainage which may extend or exacerbate a flood
depending upon the duration and intensity of the event.

References
Canterbury Geotechnical Database (2012). Aerial Photography, Map Layer CGD0100-1 June
2012, retrieved from https://canterburygeotechnicaldatabase.projectorbit.com
Christchurch City Council (1978). South Brighton Bridge – Pile Layout Plan and Details, City
Engineers Department, Christchurch, NZ.
Christchurch City Council (1999). Woolston-Burwood Expressway Avon River Bridge, City
Design, Christchurch, NZ.
Keepa, C., Saul, G., A, Murashev & McMillan, J. (2014). South Brighton Bridge: Lateral spread
mitigation using jet grout lattice structures. 2014 New Zealand Society for Earthquake
Engineering Annual Conference, 21-23 March, Auckland, New Zealand.
Lyttelton Port Company. (2005). The History of the Lyttelton Port of Christchurch. Retrieved
from Welcome to Lyttelton Port of Christchurch: http://www.lpc.co.nz/RP.jasc?Page=/N33P2
Lyttelton Port Company. (2011). Port Talk – Community Newsletter Winter 2011, Lyttelton Port
Company.
Melville, B. W., & Coleman, S. E. (2000). Bridge scour. Water Resources Publication.
Ragued, B, Popovich, B, Wotherspoon, L, Ingham, J. (2014). Exposure of New Zealand Ports to
Natural Hazards, Research Report, University of Auckland.
Sumer, B. M., & Fredsøe, J. (2002). The mechanics of scour in the marine environment. World
Scientific.
Toogood, H. F. (1929). New Brighton Borough Council-Avon River Bridge, Christchurch, NZ.