05.08.2015Schmelzer, Hlaimi 1 Unemployment and its scarring effect on post- unemployment career in...
28
21.03.22 Schmelzer, Hlaimi 1 Unemployment and its scarring effect on post-unemployment career in UK Paul Schmelzer, Boubaker Hlaimi 24.07.2007 QMSS Conference, Prague, Check Republic
-
Upload
henry-lawson -
Category
Documents
-
view
215 -
download
0
Transcript of 05.08.2015Schmelzer, Hlaimi 1 Unemployment and its scarring effect on post- unemployment career in...

19.04.23 Schmelzer, Hlaimi 1
Unemployment and its scarring effect on post-unemployment career in UKPaul Schmelzer, Boubaker Hlaimi
24.07.2007
QMSS Conference, Prague, Check Republic

Schmelzer, Hlaimi 219.04.23
Outline
1. Introduction
2. Theoretical Background
3. Main Hypotheses
4. Data, Variables, Methods
5. Main Results
6. Summary

Schmelzer, Hlaimi 319.04.23
Introduction – Research Question
Analytical Focus:
Has unemployment a scarring effect on the re-enter status and the growth for different educational groups in UK
Specific questions: Re-entering the labor market after unemployment do employment
career take a different future profile compared to those who have not been unemployed?
Does prolonged unemployment duration has a scarring effect on re-enter opportunities and subsequent growth of unemployment career?

Theoretical Background
Many studies strongly suggest a scarring effect of unemployment (for UK Arulampalam 2001, Gregory an Jukes 2001, Gregg 2001)
There have been a shift towards unemployment benefits and positive effects on duration of unemployment (for USA and Germany: Gangl 2004, for Canada Belzil: 2001)
unemployment benefits => longer job search => better match However they do not differentiate between educational groups Many studies compare only pre- and post-unemployment
wages and have not control group (lacking unemployment spells)
Researchers mainly focus on income for gains/losses and not on status
Schmelzer, Hlaimi 419.04.23

Main Hypotheses
Human capital theory: unemployment devaluates firm-specific skills
and thus has a scarring effect on post-unemployment career
But we analyze early careers with
1. few employment experience and
2. high rate of mismatches (unstandardized educational system)
unemployment can be used to find a better match
position However, we believe that impact of unemployment is different for
different educational groups
Schmelzer, Hlaimi 519.04.23

Main Hypotheses (Re-entry into the labor market) High productivity workers (tertiary education) might use unemployment
phase to find a better match
Higher educated do not take the first available job they get They have got higher previous income
Return wages are higher (employment insurance)
Partner usually also have high wages supporting them by the work search
There is no competition for tertiary education by other educational groups Higher educated have got an option to decide for an adequate job
They are pulled into the labor market
They perform better re-entering labor market than lower qualified
They do not loose in status by re-entering labor market compared to the end of the
last job
Prolonged searching phase might even improve the re-entry status and growth
Schmelzer, Hlaimi 619.04.23

Main Hypotheses (Re-entry into the labor market) Low productivity workers (primary education) are in competition with
more qualified workers
Lower educated are forced to take the first available job Low previous income
Return wages are low (employment insurance)
Low or no support by partners
Sanctions by job agencies when not taking an offer
=> They are pushed into the labor market
=> They perform worse re-entering the labor market than higher educated
=> They loose in status compared to the end of the last job
=> Prolonged unemployment phase does not improve re-entry status and growth (no
offers before)
Schmelzer, Hlaimi 719.04.23

Schmelzer, Hlaimi 819.04.23
Data
British Household Panel Survey (BHPS) from 1980 to 2003
(including retrospective data from 1980 to 1990), Northern Ireland
and the North and West Highlands are excluded
Sample definition: Persons who left the educational system between 1980 and 2004, excluding
persons older than 30
Gaps of less than 8 months between two educational episodes are closed
Starting sample: 2900 young men and women
Schmelzer, Hlaimi 919.04.23
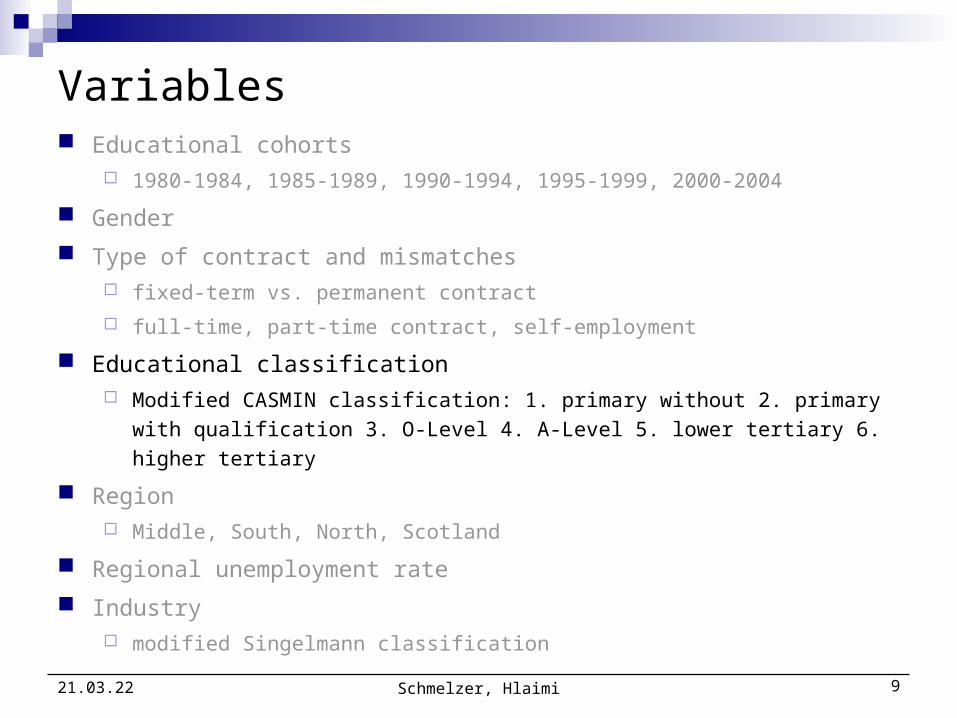
Variables Educational cohorts
1980-1984, 1985-1989, 1990-1994, 1995-1999, 2000-2004
Gender
Type of contract and mismatches fixed-term vs. permanent contract
full-time, part-time contract, self-employment
Educational classification Modified CASMIN classification: 1. primary without 2. primary with qualification 3.
O-Level 4. A-Level 5. lower tertiary 6. higher tertiary
Region Middle, South, North, Scotland
Regional unemployment rate
Industry modified Singelmann classification
Schmelzer, Hlaimi 1019.04.23
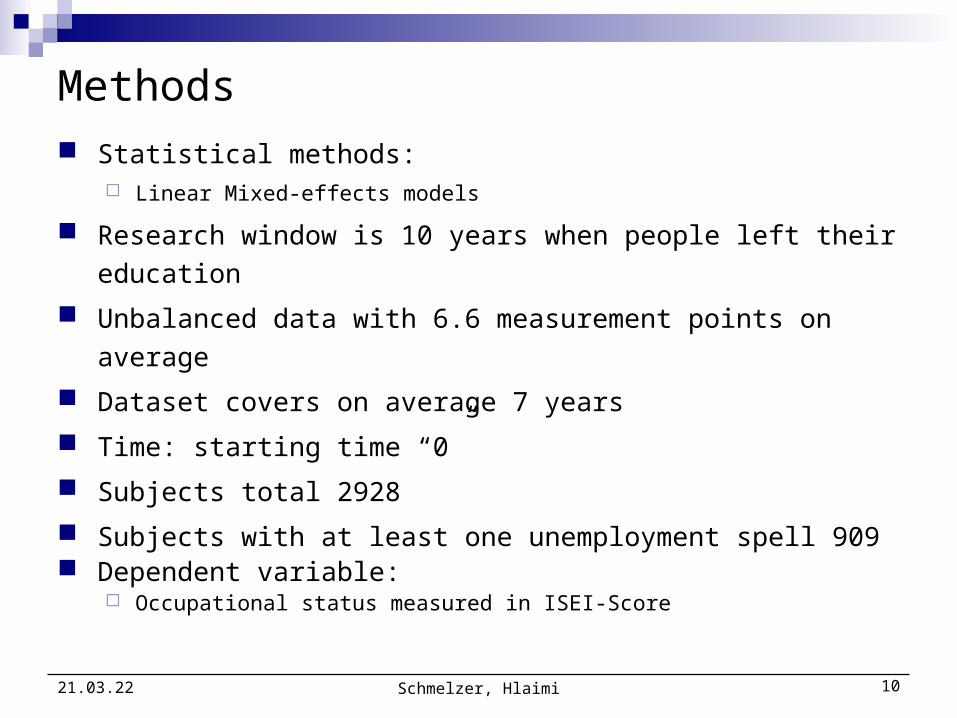
Methods Statistical methods:
Linear Mixed-effects models
Research window is 10 years when people left their education
Unbalanced data with 6.6 measurement points on average
Dataset covers on average 7 years
Time: starting time “0”
Subjects total 2928
Subjects with at least one unemployment spell 909 Dependent variable:
Occupational status measured in ISEI-Score

Schmelzer, Hlaimi 1119.04.23
Methods (random effect models)
Closure of inactivity (unemployment) gaps but using this information
for random effects models (gaps are not missings)
Modeling two phases: pre-unemployment phase and post-
unemployment phase

Schmelzer, Hlaimi 1219.04.23
Methods
Table 1: Person-period data with unemployment and full-time educational spells
ID S.N. Time1 Status Dur. Un. Dur. Educ ISEI
1 1 12 1 0 0 40
1 2 24 1 0 0 40
1 3 36 2 12 0 -
1 4 48 2 12 0 -
1 5 60 3 0 12 -
1 6 72 1 0 0 30
1 7 84 1 0 0 30 ID S. N. Time1 Time2 Status Last job Re-employm. Dur. Un. Dur. Educ ISEI
1 1 12 0 1 0 0 0 0 40
1 2 24 0 1 1 0 0 0 40
1 6 72 0 1 1 1 24 12 30
1 7 84 12 1 1 1 24 12 30

30
35
40
45
50
55
60
65
70
0 6 12 18 24 30 36 42 48 54 60 66 72 78 84 90 time analysis: months
ISEI
Pre-unemployment intercept
Pre-unemployment slope
Post-unemployment intercept
Post-unemployment slope
Inactivity spell (unemployment, full-time education, something else)

Pre-unemployment phase
Schmelzer, Hlaimi 1419.04.23
30
35
40
45
50
55
60
65
70
0 6 12 18 24 30 36 42 48 54 60 66 72 78 84 90 time analysis: months
Primary
without qual. Primary with
qual.
O-Level A-Level
Lower tertiary Higher tertiary
ISEI

Schmelzer, Hlaimi 1519.04.23
Model 1 Model 2 Model 3 Model 4
Time -0.00 0.00 0.00 0.00
time1: post-unemployment 0.02 * 0.03 ** 0.02 * 0.02 *
Primary without qual. (ref.)
Primary with qual. 2.56 * 2.41 * 2.44 * 2.48 * O-Level 5.09 *** 5.05 *** 5.06 *** 5.11 *** A-Level 9.06 *** 8.98 *** 8.99 *** 9.02 *** Lower tert iary 17.73 *** 17.52 *** 17.55 *** 17.61 *** Higher tert iary 25.42 *** 25.31 *** 25.32 *** 25.37 ***
Last job
Primary without qual. -0.33 0.14 0.17 0.15 Primary with qual. -0.65 -0.84 -0.85 -0.88 O-Level -1.29 *** -1.00 ** -0.99 ** -1.08 *** A-Level -1.46 *** -1.07 ** -1.03 ** -1.11 *** Lower tert iary -3.11 *** -3.81 *** -3.79 *** -3.86 *** Higher tert iary -2.52 *** -2.44 *** -2.39 *** -2.51 ***
Post-unemployment job
Primary without qual. -1.66 * -1.52 * -1.55 * Primary with qual. 0.64 0.79 0.77 O-Level -1.12 * -0.92 + -0.83 A-Level -1.52 ** -1.31 * -1.31 * Lower tert iary 2.78 ** 2.93 ** 2.92 ** Higher tert iary -0.31 -0.16 -0.31
Duration first employment -0.01 * -0.02 *
Why left job (before unemployment)
Promoted 0.18 Temporary contract 0.82 Made redundant 0.99 Dis missed 0.66 Other reasons -0.15 Missing -1.24
Results: pre- and post-unemployment phase

Schmelzer, Hlaimi 1619.04.23
continued
Time x
Primary without qual. (ref.)
Primary with qual. -0.00 -0.01 -0.01 -0.01 O-Level 0.03 ** 0.03 * 0.03 * 0.03 * A-Level 0.05 *** 0.04 *** 0.04 *** 0.05 *** Lower tert iary 0.07 *** 0.06 *** 0.06 *** 0.06 *** Higher tert iary 0.07 *** 0.07 *** 0.07 *** 0.07 ***
Constant 30.44 *** 30.43 *** 30.40 *** 30.44 ***
Level 2.1 RI (l s.d.) -2.42 -2.42 -2.42 -2.42 Level 2.1 RS (l s.d.) -1.61 -1.61 -1.61 -1.61 Level 2.2 RI (l s.d.) 1.89 1.88 1.88 1.87 Level 2.2 RS (l s.d.) 2.33 2.33 2.33 2.33 Corr(time, t ime 1) -0.39 -0.39 -0.39 -0.39 Corr(time, interc 2) -0.09 -0.09 -0.09 -0.10 Corr(time, interc 1) -0.28 -0.28 -0.28 -0.28 Corr(time 1, interc 2) -0.30 -0.31 -0.31 -0.31 Corr(time 1, interc 1) 0.08 0.09 0.09 0.09 Corr(interc 1, interc 2) -0.43 -0.45 -0.45 -0.44 lnsig_e 2.00 2.00 2.00 2.00 Number of subects 18365 18365 18365 18365 Log likelihood -67323 -67309 -67306 -67303 AIC 134739 134722 134719 134720 BIC 135099 135128 135134 1351655 + p<0.10, * p<0.05, ** p<0.01, *** p<0.001 Full set of control variables (intercept): dummies for cohorts, panel vs. retrospective, sex, durat ion first employment squared (before first job), full-t ime vs. part-t ime, self-employed, permanent vs. temporary, b ranch of industry, regional unemployment rate for youths, regional dummies.

Results: pre- and post-unemployment phase
Schmelzer & Skopek 1719.04.23
Model 1 Model 2 Model 3
Time 0.00 0.00 0.01
Time1: post-unemployment 0.02 * 0.02 * 0.02 +
Last job x -0.16 -0.11 -0.05 Primary with qual. -0.44 -0.46 -0.47 O-Level -1.03 * -1.06 * -1.05 * A-Level -1.13 * -1.17 ** -1.14 * Lower tert iary -3.27 *** -3.30 *** -3.28 *** Higher tert iary -2.63 *** -2.72 *** -2.64 ***
Duration unemployment x -0.18 * -0.16 * -0.16 * Primary with qual. 0.06 0.07 0.07 O-Level 0.03 0.04 0.04 A-Level -0.10 -0.10 -0.10 Lower tert iary 0.40 ** 0.43 ** 0.41 ** Higher tert iary 0.31 + 0.30 + 0.29 +
Why left job (before unemployment) Promoted -0.20 0.40 Temporary contract 0.65 1.11 + Made redundant 0.66 1.29 + Dis missed 0.13 0.69 Other reasons -0.40 0.09 Missing -1.66 * -1.12
Duration first employment -0.05 **
Duration employment square 0.00 *
Constant 30.36 *** 30.40 *** 30.42 ***

Schmelzer, Hlaimi 1819.04.23
Continued
Level 2.1 RI (l s.d.) -2.42 -2.42 -2.42 Level 2.1 RS (l s.d.) -1.61 -1.61 -1.61 Level 2.2 RI (l s.d.) 1.89 1.88 1.88 Level 2.2 RS (l s.d.) 2.33 2.33 2.33 corr(time, t ime 1) -0.38 -0.38 -0.38 corr(time, interc 2) -0.10 -0.10 -0.10 corr(time, interc 1) -0.28 -0.28 -0.28 corr(time 1, interc 2) -0.30 -0.30 -0.30 corr(time 1, interc 1) 0.10 0.10 0.10 corr(interc 1, interc 2) -0.45 -0.45 -0.44 lnsig_e 2.00 2.00 2.00 Number of subects 18365.00 18365.00 18365.00 Log likelihood -67306.54 -67300.53 -67295.68 AIC 134719.08 134719.07 134713.37 BIC 135133.44 135180.34 135190.28 + p<0.10, * p<0.05, ** p<0.01, *** p<0.001 Full set of control variables like in previous model . Additional variables (slope 2): duration in full time education, duration something else.

Schmelzer & Skopek 1919.04.23
30
35
40
45
50
55
60
65
70
0 6 12 18 24 30 36 42 48 54 60 66 72 78 84 90 time analysis: months
ISEI
Pre-unemployment intercept
Pre-unemployment slope
Post-unemployment intercept
Post-unemployment slope
Inactivity spell (unemployment, full-time education, something else)

Schmelzer, Hlaimi 2019.04.23
Wald test statistics
estimator in they variablit thereflects )ˆ(ˆ
valuesedhypothesiz and estimatedbetween distance themeasures ˆ
constants of vector r
constants ofmatrix Q
parameters ofector vˆ
ˆ )ˆ(ˆ ˆ
1
1 - '
QVQ
rQ
rQQVQrQW

Schmelzer 2119.04.23
Time in months
chi2(d.f. = 1) p Amount (ISEI)
For one month Primary without qualification 1 0.08 0.7833 -0.10 Primary with qualification 1 0.42 0.5192 0.43 O-Level 1 10.04 0.0015 0.97 A-Level 1 9.23 0.0024 0.93 Lower tertiary 1 40.20 0.0000 3.58 Higher tertiary 1 16.83 0.0000 2.82 Predicted median life time (predicted time) Primary with qualification 8.8 2.70 0.1001 -1.40 Primary without qualification 6.8 0.01 0.9255 -0.12 O-Level 6 0.43 0.5110 0.36 A-Level 5 0.05 0.8179 -0.11 Lower tertiary 4 27.80 0.0000 4.33 Higher tertiary 4.5 8.71 0.0032 3.26 20% still in unemployment (predicted time) Primary with qualification 23 3.73 0.0534 -3.66 Primary without qualification 17 0.21 0.6442 -1.04 O-Level 14 0.33 0.5627 -0.62 A-Level 12 4.19 0.0407 -1.93 Lower tertiary 8 15.49 0.0001 5.59 Higher tertiary 9 3.68 0.0550 4.10

Schmelzer 2219.04.23
0
.02
.04
.06
.08
.1
.12
.14
.16
.18
.2
.22
.24
Haz
ard
rate
0 2 4 6 8 10 12 14 16 18 20
time analysis: months
Primary without qualification
Primary with qualification
O-Level
A-Level
Lower tertiary
Higher tertiary
.1
.2
.3
.4
.5
.6
.7
.8
.9
1
Sur
viva
l pro
babi
lity
0 2 4 6 8 10 12 14 16 18 20
time analysis: months
Primary without qualification
Primary with qualification
O-Level
A-Level
Lower tertiary
Higher tertiary
Hazard rate and survaval probability for leaving first unemployment

Pre-unemployment phase
Schmelzer & Skopek 2319.04.23
30
35
40
45
50
55
60
65
70
0 6 12 18 24 30 36 42 48 54 60 66 72 78 84 90 time analysis: months
Primary
without qual. Primary with qual.
O-Level A-Level
Lower tertiary Higher tertiary
ISEI
4.5
4
5
8.8
6.8
6
Schmelzer & Skopek 2419.04.23
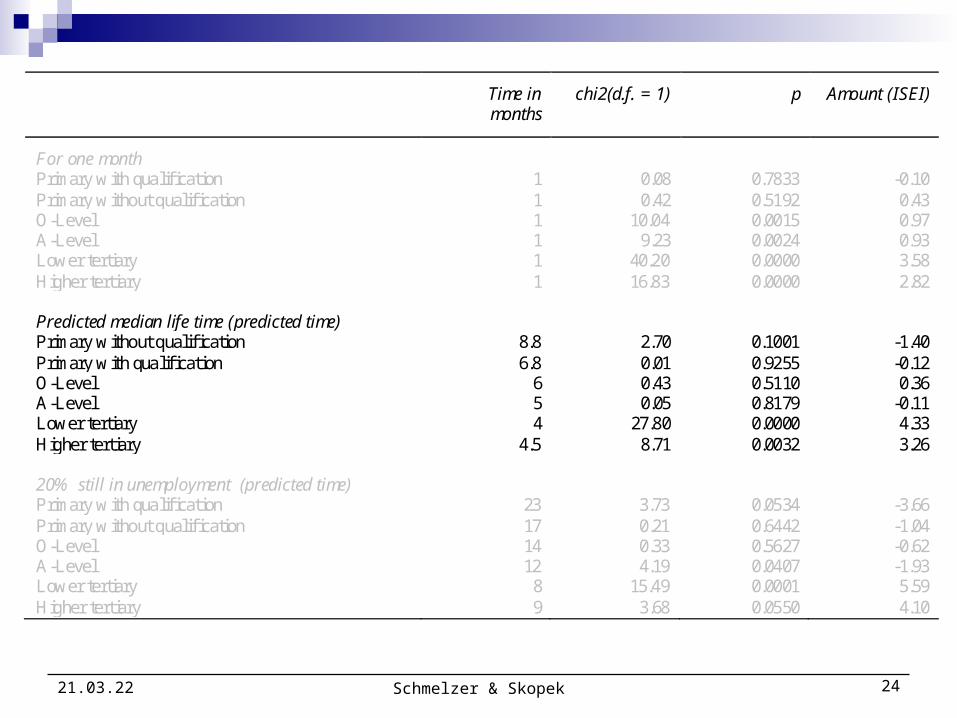
Time in months
chi2(d.f. = 1) p Amount (ISEI)
For one month Primary with qualification 1 0.08 0.7833 -0.10 Primary without qualification 1 0.42 0.5192 0.43 O-Level 1 10.04 0.0015 0.97 A-Level 1 9.23 0.0024 0.93 Lower tertiary 1 40.20 0.0000 3.58 Higher tertiary 1 16.83 0.0000 2.82 Predicted median life time (predicted time) Primary without qualification 8.8 2.70 0.1001 -1.40 Primary with qualification 6.8 0.01 0.9255 -0.12 O-Level 6 0.43 0.5110 0.36 A-Level 5 0.05 0.8179 -0.11 Lower tertiary 4 27.80 0.0000 4.33 Higher tertiary 4.5 8.71 0.0032 3.26 20% still in unemployment (predicted time) Primary with qualification 23 3.73 0.0534 -3.66 Primary without qualification 17 0.21 0.6442 -1.04 O-Level 14 0.33 0.5627 -0.62 A-Level 12 4.19 0.0407 -1.93 Lower tertiary 8 15.49 0.0001 5.59 Higher tertiary 9 3.68 0.0550 4.10

Schmelzer & Skopek 2519.04.23
Time in months
chi2(d.f. = 1) p Amount (ISEI)
For one month Primary with qualification 1 0.08 0.7833 -0.10 Primary without qualification 1 0.42 0.5192 0.43 O-Level 1 10.04 0.0015 0.97 A-Level 1 9.23 0.0024 0.93 Lower tertiary 1 40.20 0.0000 3.58 Higher tertiary 1 16.83 0.0000 2.82 Predicted median life time (predicted time) Primary with qualification 8.8 2.70 0.1001 -1.40 Primary without qualification 6.8 0.01 0.9255 -0.12 O-Level 6 0.43 0.5110 0.36 A-Level 5 0.05 0.8179 -0.11 Lower tertiary 4 27.80 0.0000 4.33 Higher tertiary 4.5 8.71 0.0032 3.26 20% still in unemployment (predicted time) Primary without qualification 23 3.73 0.0534 -3.66 Primary with qualification 17 0.21 0.6442 -1.04 O-Level 14 0.33 0.5627 -0.62 A-Level 12 4.19 0.0407 -1.93 Lower tertiary 8 15.49 0.0001 5.59 Higher tertiary 9 3.68 0.0550 4.10

Schmelzer & Skopek 2619.04.23
Time in months
chi2(d.f. = 1) p Amount (ISEI)
For one month Primary without qualification 1 0.08 0.7833 -0.10 Primary with qualification 1 0.42 0.5192 0.43 O-Level 1 10.04 0.0015 0.97 A-Level 1 9.23 0.0024 0.93 Lower tertiary 1 40.20 0.0000 3.58 Higher tertiary 1 16.83 0.0000 2.82 Predicted median life time (predicted time) Primary without qualification 8.8 2.70 0.1001 -1.40 Primary with qualification 6.8 0.01 0.9255 -0.12 O-Level 6 0.43 0.5110 0.36 A-Level 5 0.05 0.8179 -0.11 Lower tertiary 4 27.80 0.0000 4.33 Higher tertiary 4.5 8.71 0.0032 3.26 20% still in unemployment (predicted time) Primary without qualification 23 3.73 0.0534 -3.66 Primary with qualification 17 0.21 0.6442 -1.04 O-Level 14 0.33 0.5627 -0.62 A-Level 12 4.19 0.0407 -1.93 Lower tertiary 8 15.49 0.0001 5.59 Higher tertiary 9 3.68 0.0550 4.10

Schmelzer 2719.04.23
Summary
30
35
40
45
50
55
60
65
70
0 6 12 18 24 30 36 42 48 54 60 66 72 78 84 90 time analysis: months
Primary
without qual. Primary with
qual.
O-Level A-Level
Lower tertiary Higher tertiary
ISEI

Thank you for your
attention.
Schmelzer, Hlaimi 2819.04.23