05 Jayne ACSM - CIREScires.colorado.edu/jimenez-group/UsrMtgs/UsersMtg9/05_Jayne_ACSM.pdf · ACSM...
30
ACSM Topics System Design -Lower cost Data acquisition thru Ethernet line and OPC , laptop Igor interface. Builds off of Squirrel tools Design Philosophy -fill the matrix -file formats -runtime view and archived data Performance -IE cal results -Noble gas mixture, ion transmission -EM gain Design tasks to do -auto inlet valve -auto filter sample -beam block by solenoid, externally mounted Sample data -2 month time series, unattended -noise analysis -time series comparison to QAMS Deployment planned in Feb/March 2009 Barcelona, Queens Summer 2009 Outstanding Issues -stream line data collection and analysis -particle bounce -PM2.5 lens
Transcript of 05 Jayne ACSM - CIREScires.colorado.edu/jimenez-group/UsrMtgs/UsersMtg9/05_Jayne_ACSM.pdf · ACSM...

ACSM Topics
System Design
-Lower cost Data acquisition thru Ethernet line and OPC , laptop
Igor interface. Builds off of Squirrel tools
Design Philosophy-fill the matrix-file formats-runtime view and archived data
Performance-IE cal results-Noble gas mixture, ion transmission-EM gain
Design tasks to do-auto inlet valve-auto filter sample-beam block by solenoid, externally mounted
Sample data-2 month time series, unattended-noise analysis-time series comparison to QAMS
Deployment planned in Feb/March 2009 Barcelona, Queens Summer 2009
Outstanding Issues-stream line data collection and analysis-particle bounce-PM2.5 lens

Aerosol Chemical Speciation Monitor
ACSM• Continuous monitoring of aerosol composition.
• Limited sizing information.
• Designed for long term unattended operation.
• Builds on Q and ToF AMS concepts. Same vaporizer and ionizer
• Lower cost, lower sensitivity.Sally Ng, Tim Onasch, Achim Trimborn, Scott Herndon,
Donna Sueper, John Jayne
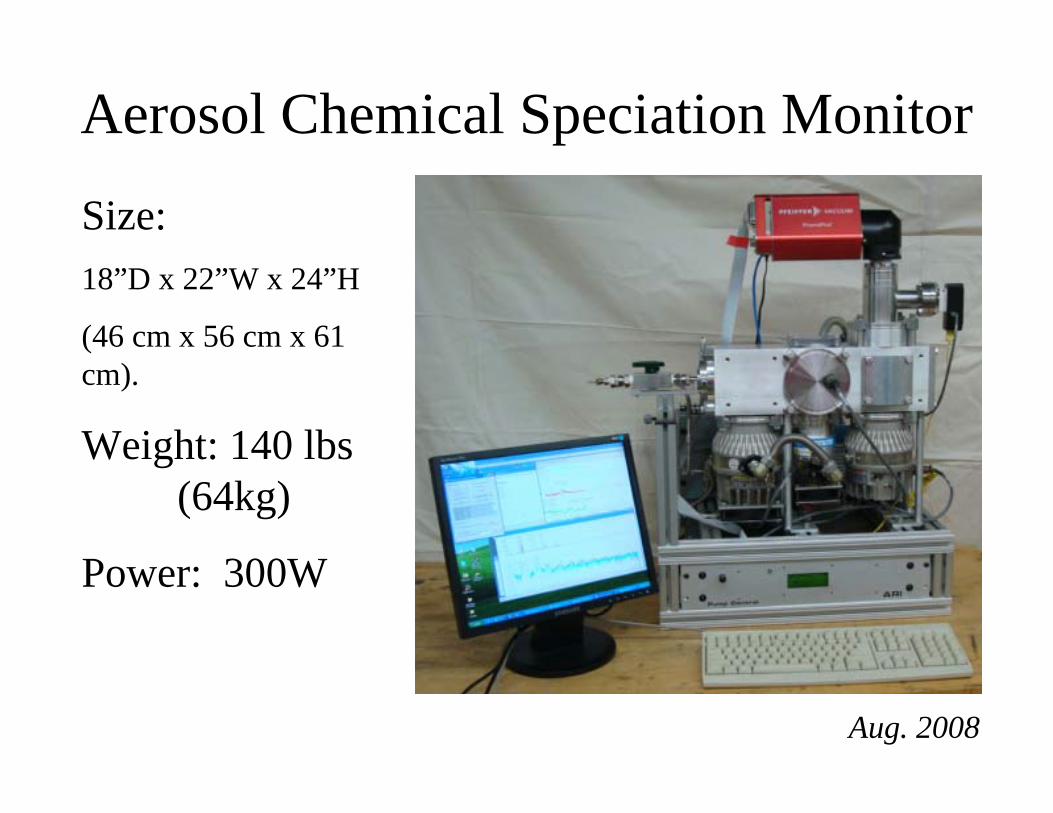
Size: 18”D x 22”W x 24”H
(46 cm x 56 cm x 61 cm).
Weight: 140 lbs (64kg)
Power: 300W
Aug. 2008
Aerosol Chemical Speciation Monitor
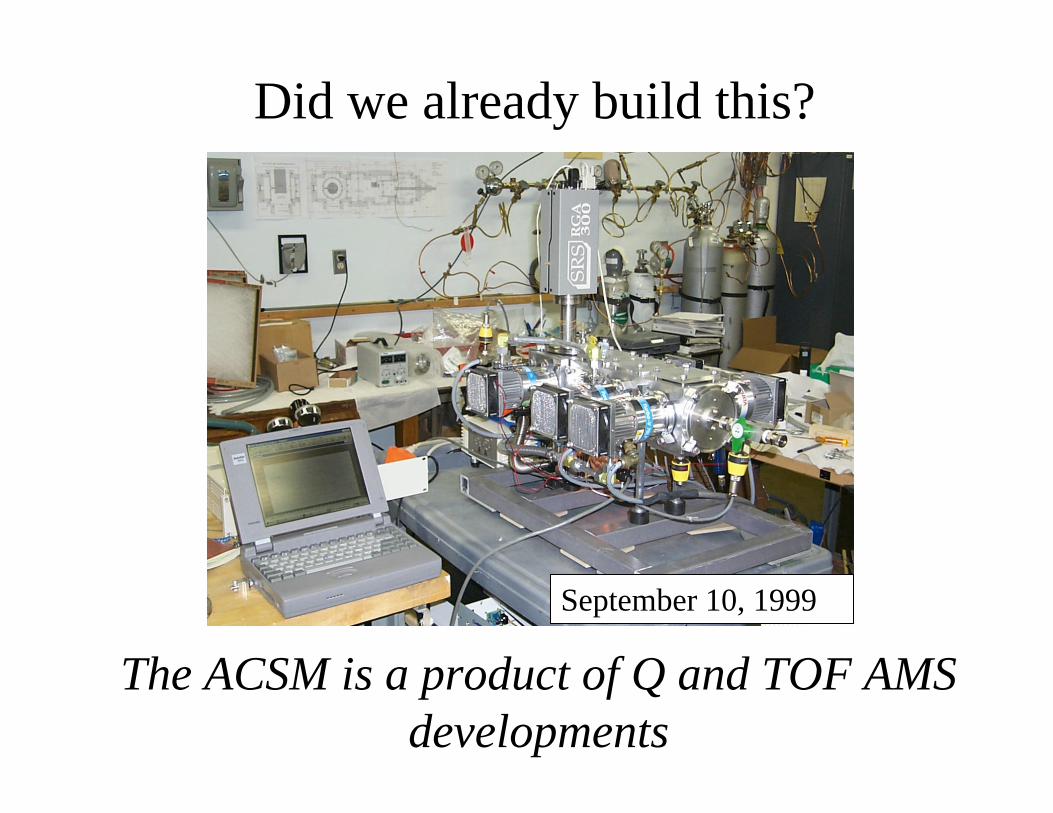
September 10, 1999
Did we already build this?
The ACSM is a product of Q and TOF AMS developments

ACSM Designed Around Pfeiffer Prisma RGA
• Prisma electronics supports:– Ethernet connectivity with OPC1 interface.– A Windows CE computer/OS.– Built-in digital and analog I/O.– 6mm diameter rods with 100, 200 and 300 amu
range heads.– 1 mA/mbar sensitivity to Ar (200 amu head)
1OPC is a standard software interface which enables data communication between applications of different manufacturers. OPC stands for Openness, Productivity, Collaboration (formerly OLE for Process Control).
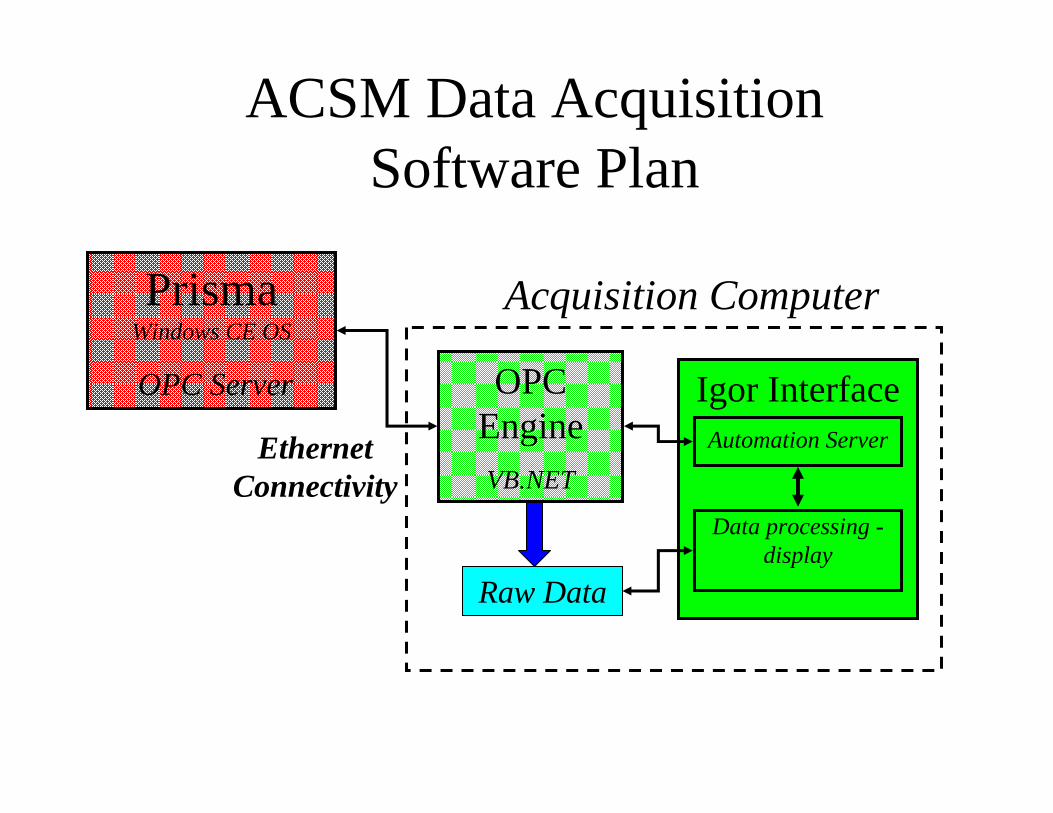
OPC EngineVB.NET
Igor InterfaceAutomation Server
Data processing -display
PrismaWindows CE OS
OPC Server
ACSM Data Acquisition Software Plan
Acquisition Computer
Raw Data
Ethernet Connectivity
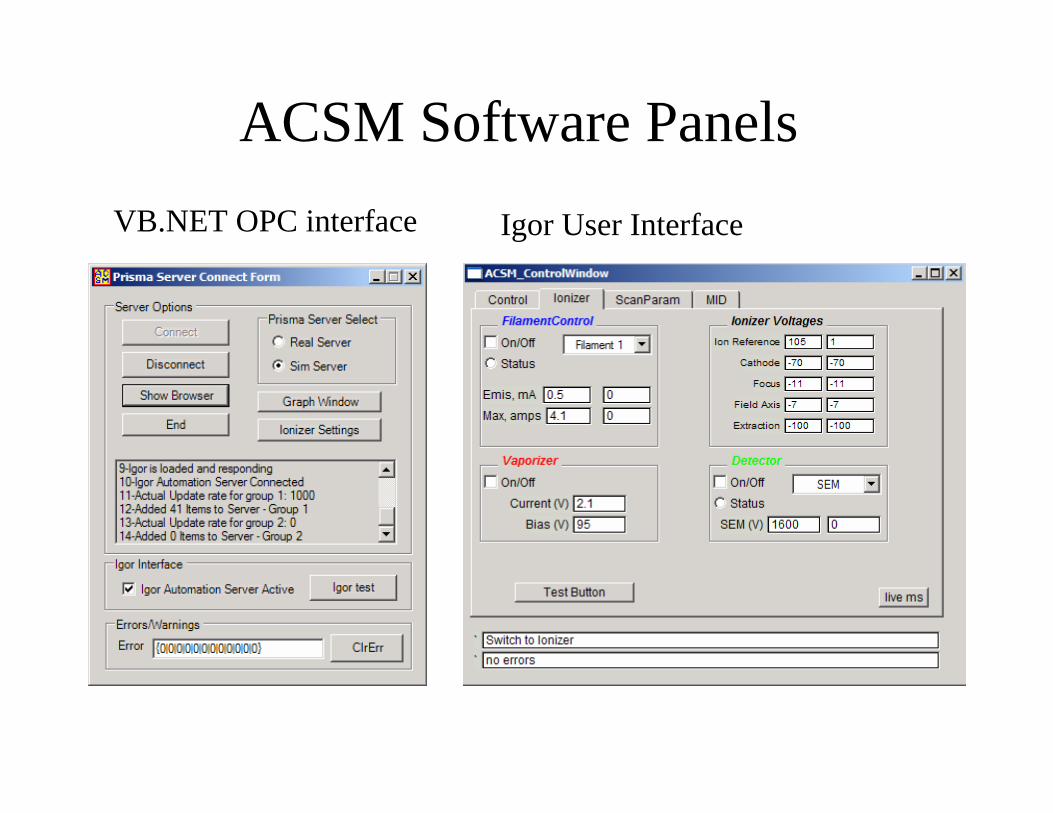
ACSM Software PanelsVB.NET OPC interface Igor User Interface

Raw Data files• Currently, MSOpen and MSClosed files are
saved.• Data files written as *.itx scaled waves.• File names are UTC time stamp, 1 sec
resolution.• Each year is a new folder.• Each day is a new sub folder.• ~2 GB/year data size at 30 min. data rate.
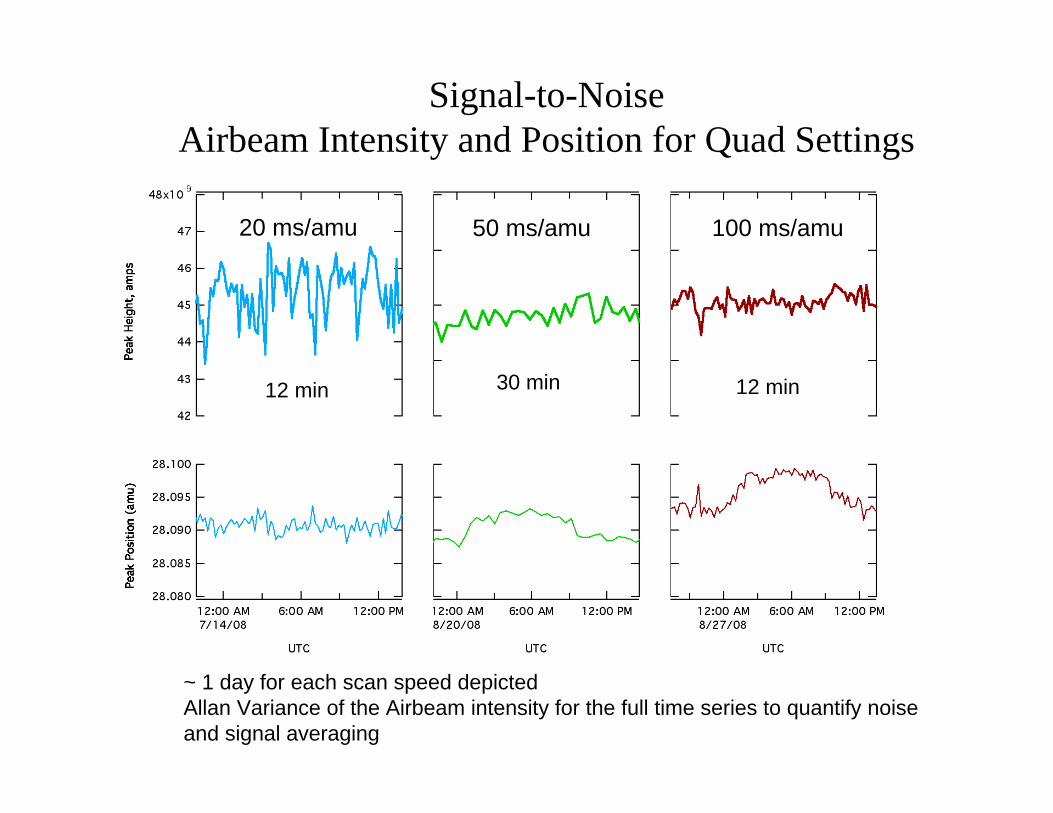
Signal-to-Noise Airbeam Intensity and Position for Quad Settings
20 ms/amu 50 ms/amu 100 ms/amu
12 min12 min 30 min
~ 1 day for each scan speed depictedAllan Variance of the Airbeam intensity for the full time series to quantify noise and signal averaging
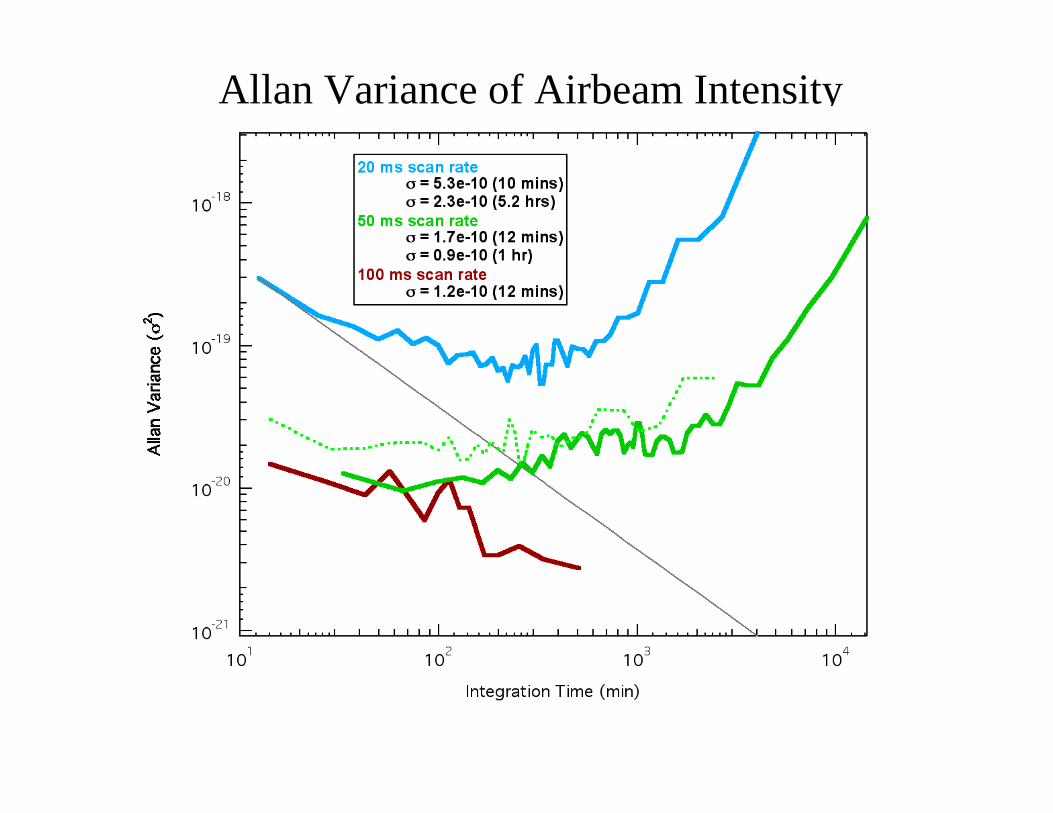
Allan Variance of Airbeam Intensity

150x10-9
100
50
0
Sign
al (a
mps
)
29.028.027.026.0
m/z
Resolution 100 80 60 40 20
200x10-9
150
100
50
0S
igna
l (am
ps)
120100806040200Resolution Setting
Prisma Resolution and Signal Intensity
N2

2.5x10⁻⁹
2.0
1.5
1.0
0.5
0.0
Sig
nal (
amps
)
302928272625
m/z
Resolution Setting 100 80 60 40 20
50
45
40
35
30
25
20
Res
olut
ion
(M/∆Μ)
120100806040200
Resolution Setting
N2
Prisma Resolution
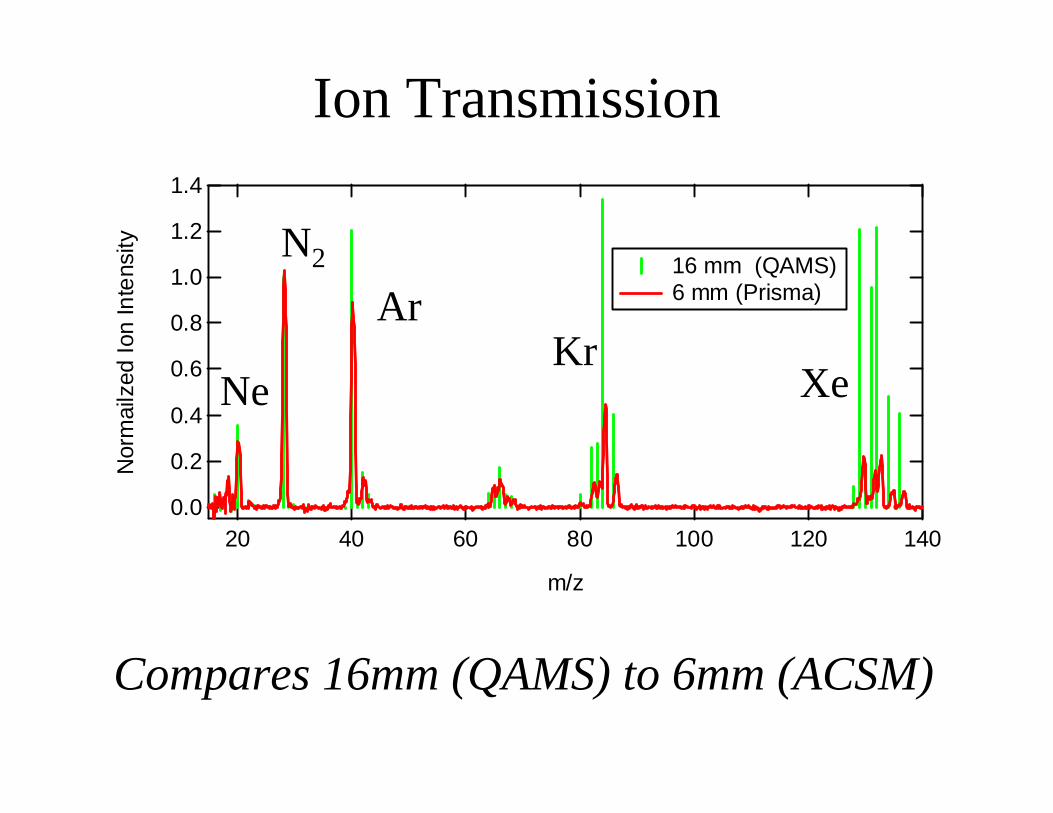
Ion Transmission1.4
1.2
1.0
0.8
0.6
0.4
0.2
0.0
Nor
mai
lzed
Ion
Inte
nsity
14012010080604020
m/z
16 mm (QAMS) 6 mm (Prisma)
Ne
N2
ArKr
Xe
Compares 16mm (QAMS) to 6mm (ACSM)
1.2
1.0
0.8
0.6
0.4
0.2
0.0
Rel
ativ
e Io
n Tr
ansm
issi
on
140120100806040200
m/z
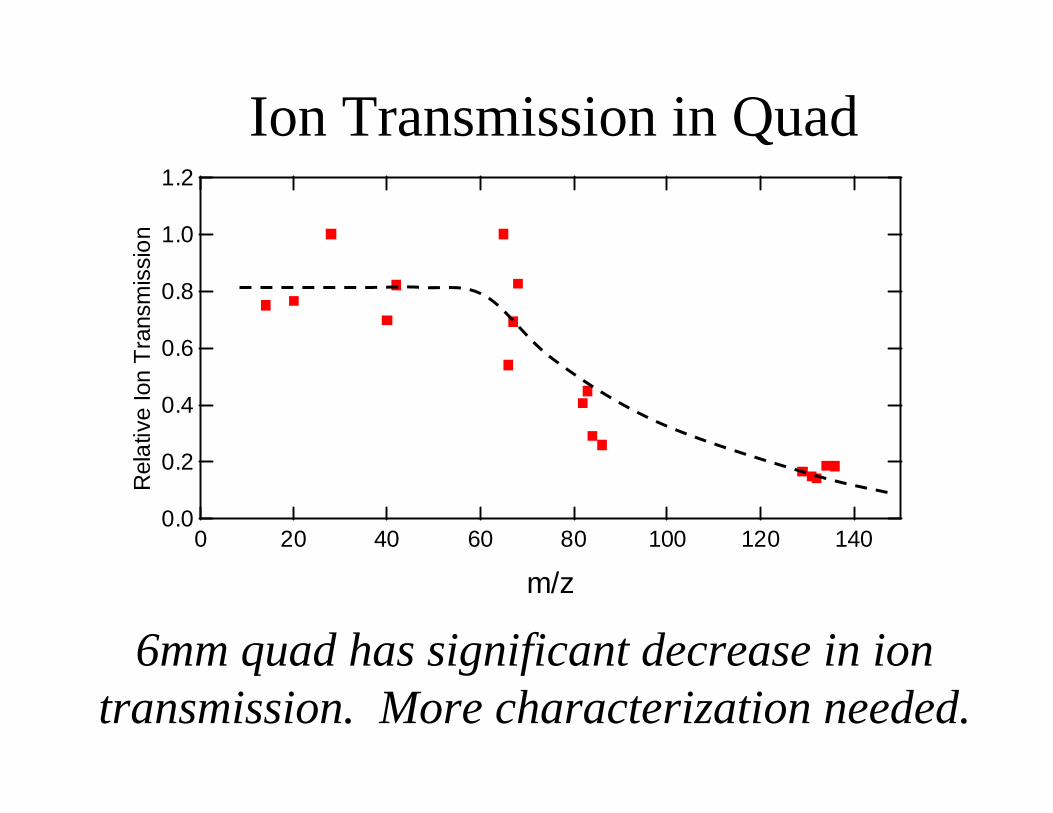
Ion Transmission in Quad
6mm quad has significant decrease in ion transmission. More characterization needed.
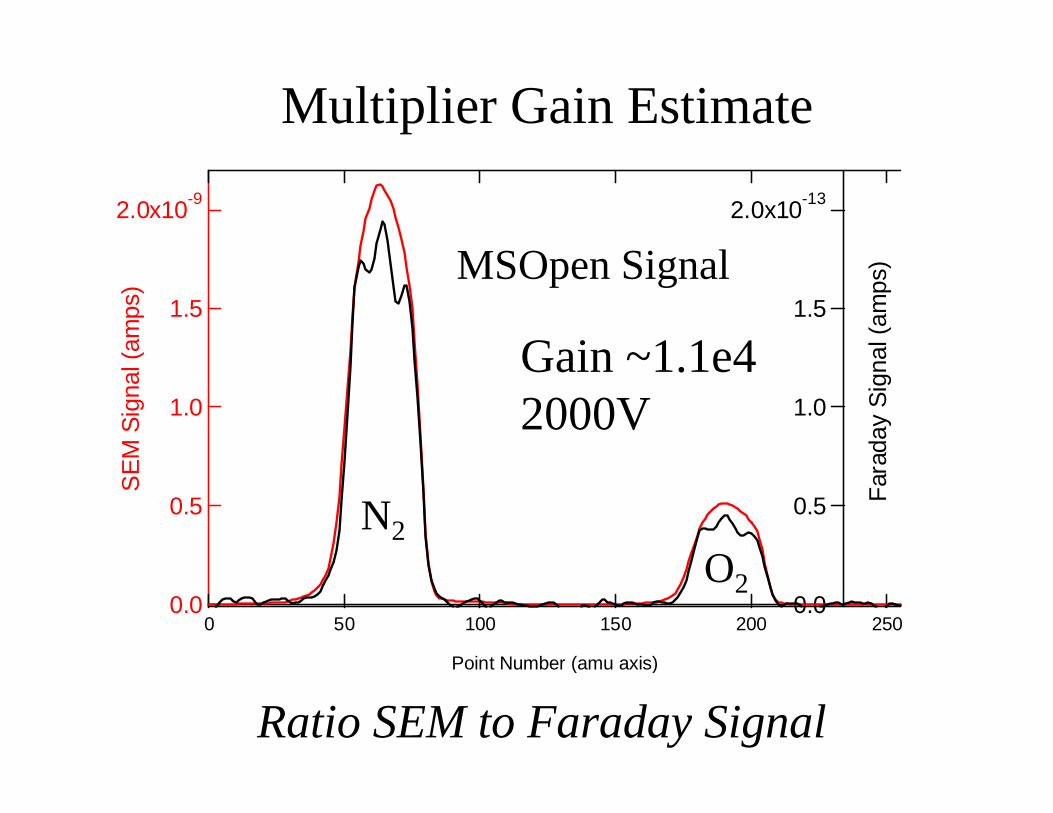
Multiplier Gain Estimate
Ratio SEM to Faraday Signal
Gain ~1.1e42000V
MSOpen Signal
N2O2
2.0x10⁻⁹
1.5
1.0
0.5
0.0
SEM
Sig
nal (
amps
)
250200150100500
Point Number (amu axis)
2.0x10⁻¹³
1.5
1.0
0.5
0.0
Fara
day
Sign
al (a
mps
)

Gain plot
104
2
3
4
5678
105
2
3
4
5678
106
Gai
n
22002100200019001800170016001500SEM_voltage
At 2000V, gain = 5e5

ACSMDMA
CPC
Atomizer
AerosolDiluter
Setup for Mass Based IE Determination
By-pass
Input Mass = ρ x Volume(size) x Number Measured Mass
filter
Plot Measured Mass vs Input Mass
Drier
Must consider lens transmission and multiply charged diameters from DMA
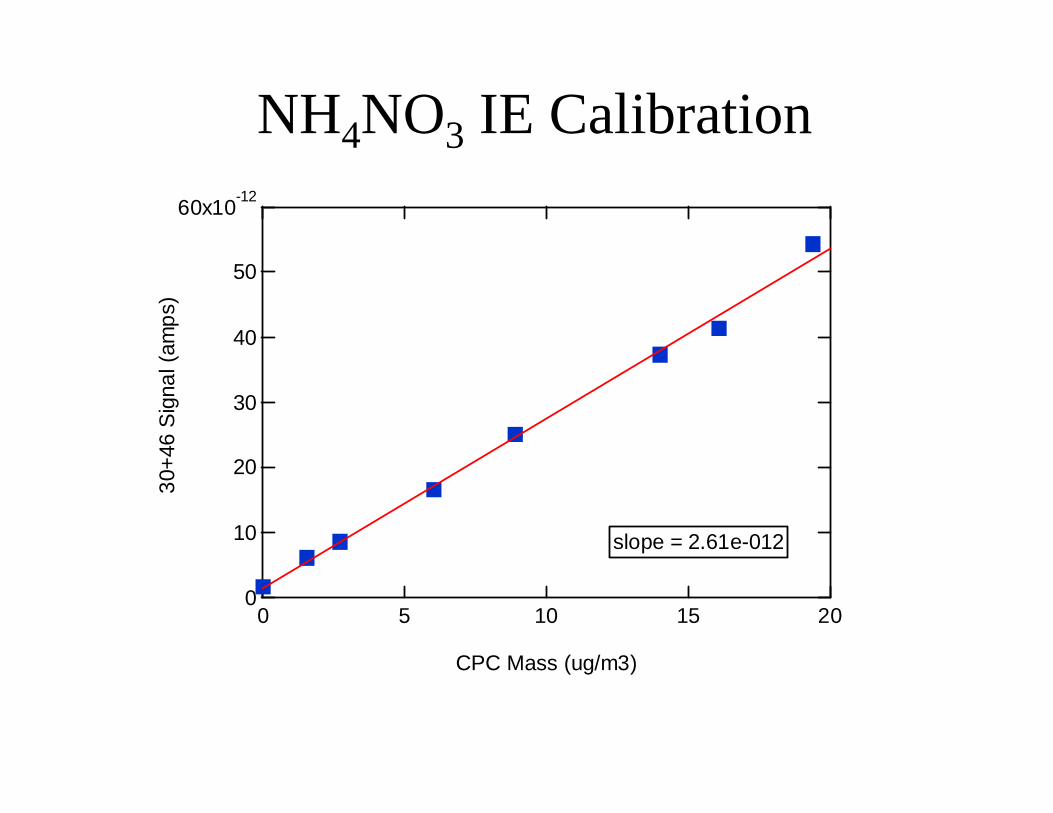
NH4NO3 IE Calibration60x10-12
50
40
30
20
10
0
30+4
6 S
igna
l (am
ps)
20151050
CPC Mass (ug/m3)
slope = 2.61e-012
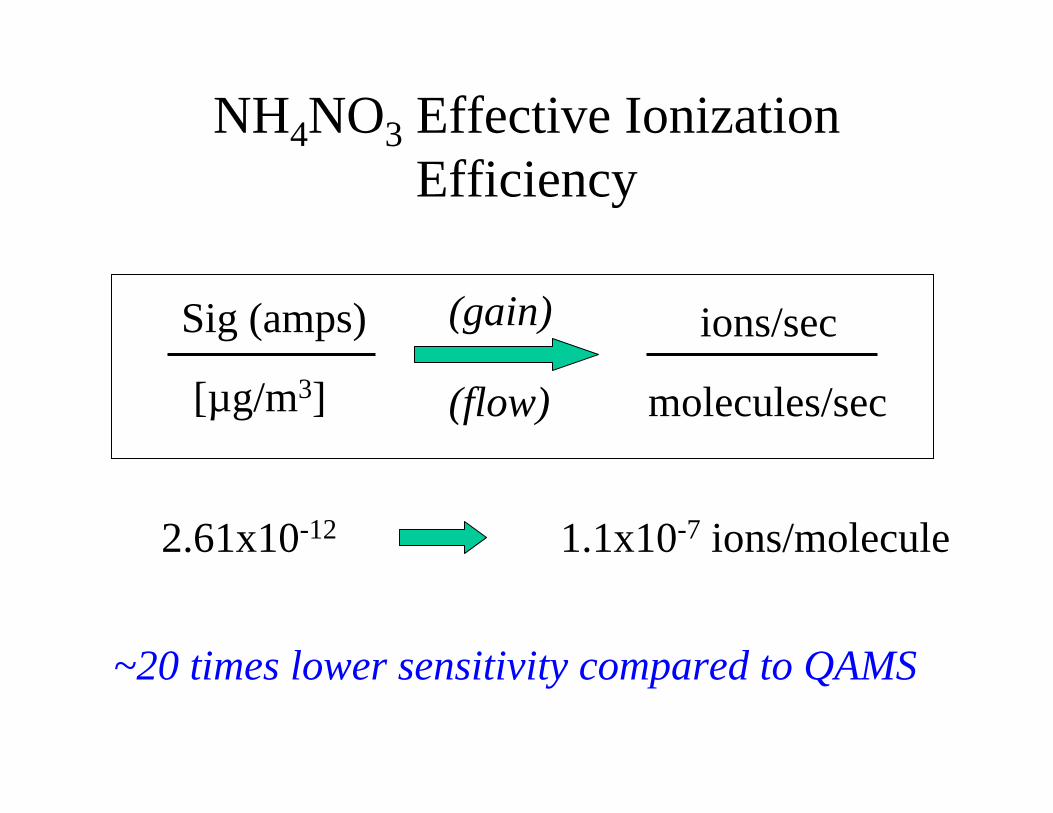
NH4NO3 Effective Ionization Efficiency
Sig (amps) ions/sec
[µg/m3]
(gain)
(flow) molecules/sec
2.61x10⁻¹² 1.1x10⁻⁷ ions/molecule
~20 times lower sensitivity compared to QAMS

System Calibration Number
IE/AB = [ug/m3] / amps2
= 3.85x10¹¹ / 1.20x10-9
= 3.2x10²⁰
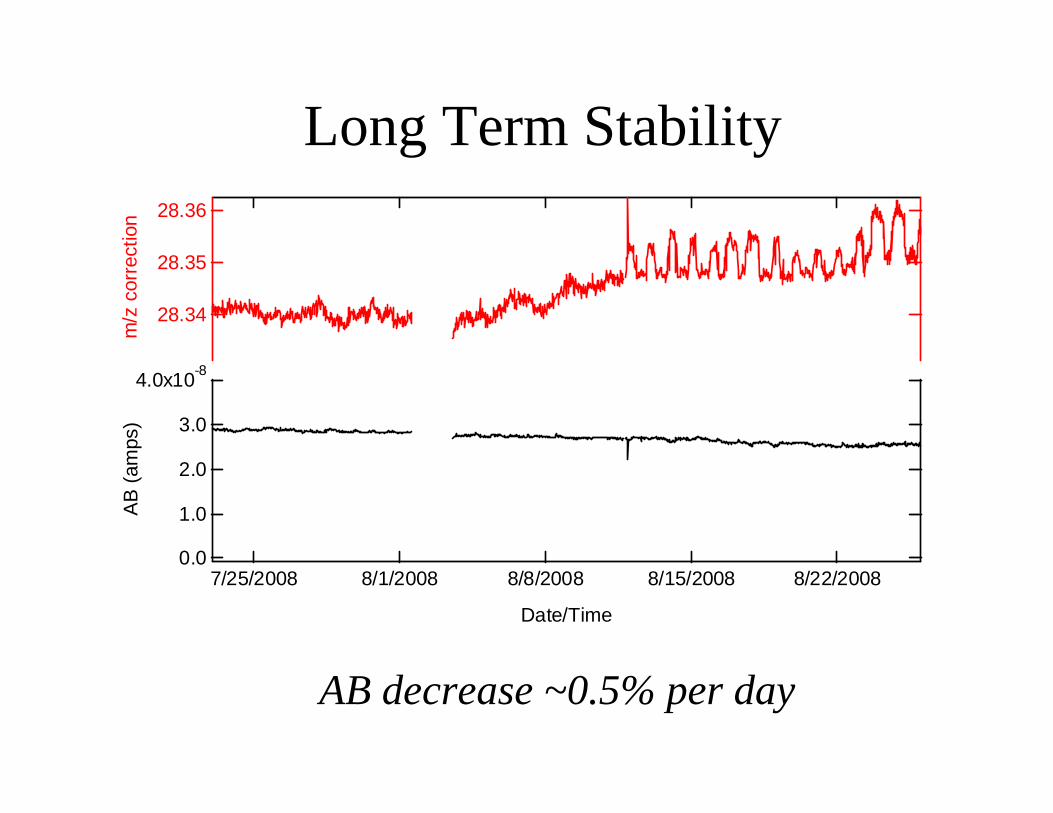
Long Term Stability
AB decrease ~0.5% per day
4.0x10⁻⁸
3.0
2.0
1.0
0.0
AB
(am
ps)
7/25/2008 8/1/2008 8/8/2008 8/15/2008 8/22/2008
Date/Time
28.36
28.35
28.34
m/z
cor
rect
ion

AMU Calibration Issue1.0
0.8
0.6
0.4
0.2
amu
Offs
et
140120100806040200
AUM
Xe
Kr
ArNeN2
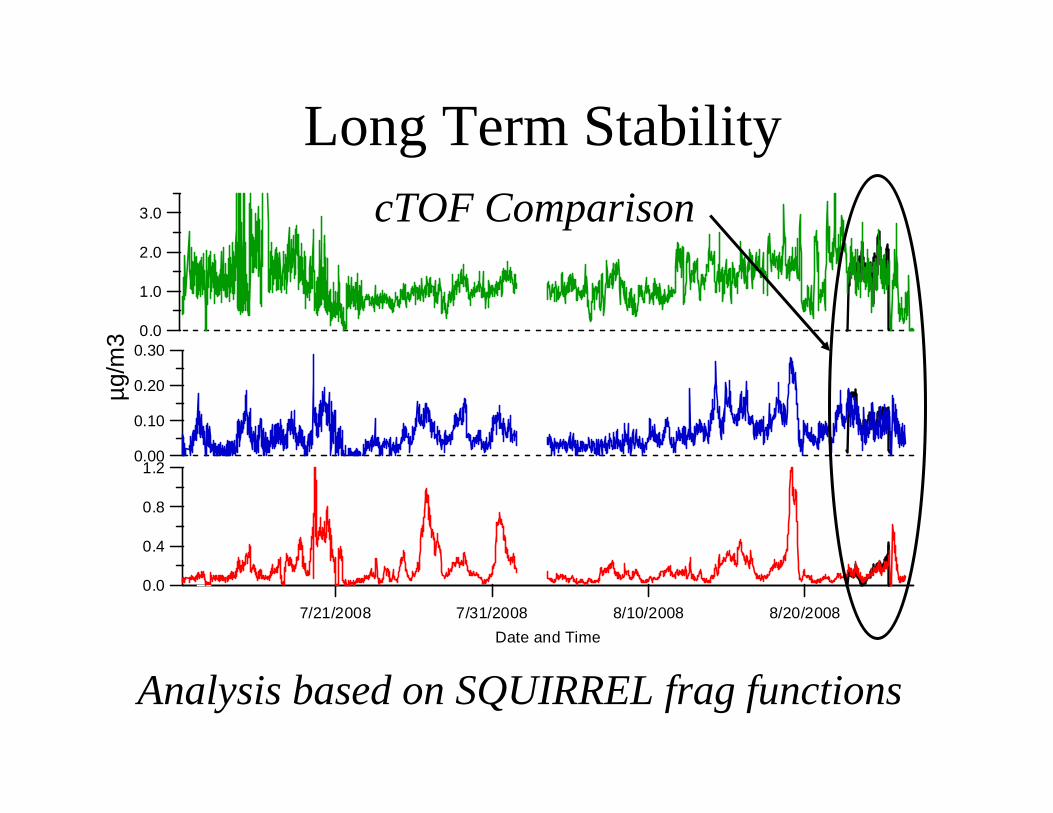
Long Term Stability
Analysis based on SQUIRREL frag functions
1.2
0.8
0.4
0.0
µg/m
3
7/21/2008 7/31/2008 8/10/2008 8/20/2008Date and Time
0.30
0.20
0.10
0.00
3.0
2.0
1.0
0.0
cTOF Comparison

ACSM - cTOF Comparison
SO4
NO3
m/z55
14 min ACSM Data Rate
0.30
0.20
0.10
0.00
µg/m
3
12:00 AM8/23/2008
12:00 PM 12:00 AM8/24/2008
12:00 PM 12:00 AM8/25/2008
12:00 PM
Date and Time
0.20
0.15
0.10
0.05
0.00
3.0
2.0
1.0
0.0
Summary• Stable over long periods. • Sensitivity of ~0.1 µg/m3 in 15 min.• Ion transmission corrections? • Data analysis based on SQUIRREL frag
functions. • Sizing by velocity selection to be
demonstrated.• Possible field deployments: Barcelona
March 2009 and Queens, NY Summer 2009.

END

Velocity Selector• Allows for size resolved particle sampling
without the need for fast detection.• Application for Aerosol Chemical
Speciation Monitor (ACSM).
Motor
Two chopper wheels with the slits offset rotating at a known speed
Poldisperse in “monodisperse” out
Variables:Angular velocitySlit offset angleSlit widthDisc separation
Particle Beam
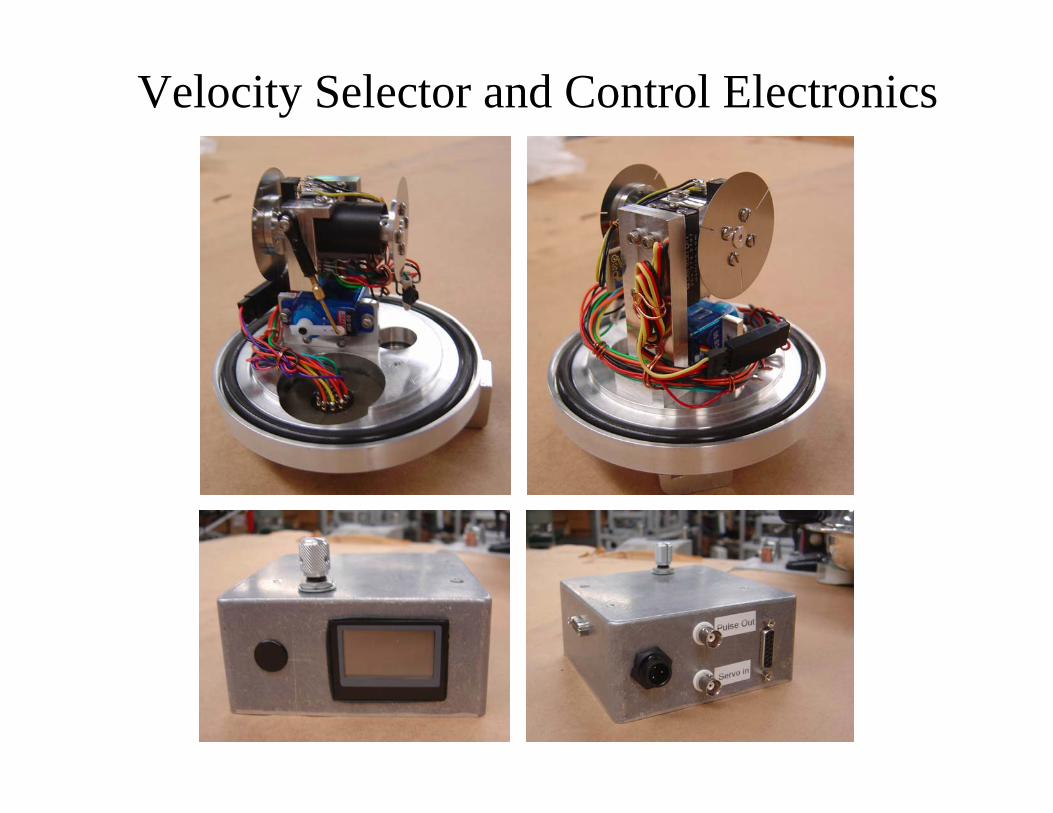
Velocity Selector and Control Electronics

Velocity selector mounts on an NW63 port
Velocity SelectorStandard Chopper
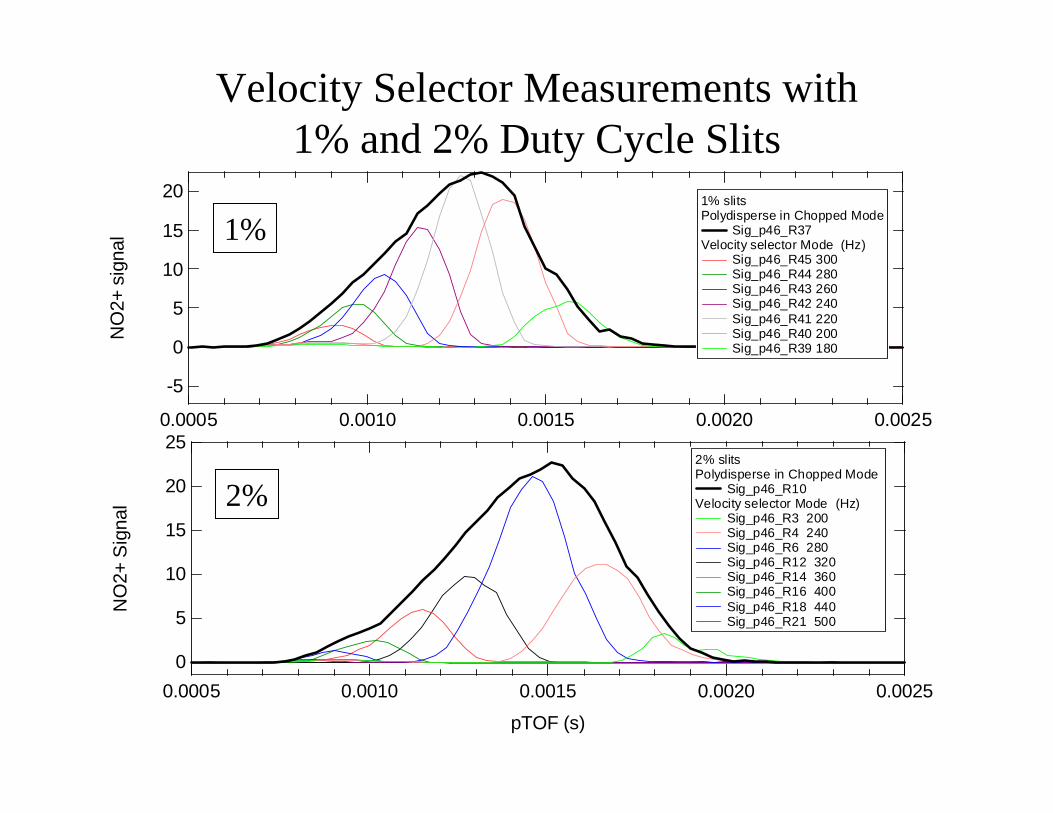
Velocity Selector Measurements with 1% and 2% Duty Cycle Slits
1%
2%
25
20
15
10
5
0
NO
2+ S
igna
l
0.00250.00200.00150.00100.0005
pTOF (s)
2% slits Polydisperse in Chopped Mode
Sig_p46_R10Velocity selector Mode (Hz)
Sig_p46_R3 200 Sig_p46_R4 240 Sig_p46_R6 280 Sig_p46_R12 320 Sig_p46_R14 360 Sig_p46_R16 400 Sig_p46_R18 440 Sig_p46_R21 500
20
15
10
5
0
-5
NO
2+ s
igna
l
0.00250.00200.00150.00100.0005
1% slitsPolydisperse in Chopped Mode
Sig_p46_R37Velocity selector Mode (Hz)
Sig_p46_R45 300 Sig_p46_R44 280 Sig_p46_R43 260 Sig_p46_R42 240 Sig_p46_R41 220 Sig_p46_R40 200 Sig_p46_R39 180