04.11 Climate Model Berlin - Planning Advices Urban ...€¦ · Web viewThe adjoining residential...
60
04.11 Climate Model Berlin - Planning Advices Urban Climate (Edition 2016) This text is essentially based on the contents of the supplementary publication "Planning advice map for urban climate 2015 - Accompanying document for online version" (SenStadtUm 2015), which can be downloaded from here . Only the core statements are given here as the contents, in order to avoid redundancies. In the accompanying document, all important topics are dealt with in adequate detail and all evaluation methods are also described in detail. Overview A central objective of the Berlin Urban Development is to maintain / create an urban climate healthy for humans (SenStadtUm 2011). In the shape of the planning advice map (hereinafter: PHK) urban climate, an instrument for supporting this objective becomes available to the Administration since 2004. The task of the PHK is "to highlight the areas and planning tasks relevant for a possibly optimum space classification under aspects of climate and air hygiene . It takes up the climatic and air-hygiene phenomena relevant for planning, which as part or small-scale special features or characteristics deviate significantly from the general climatic conditions and the large-scale air- hygiene situation and effect the health and well-being of humans […] " (Association of German Engineers 2015). Since the air-hygiene effect complex has already adequately been covered by the Berlin air cleaning plan 2011-2017 (SenStadtUm 2013), the PHK edition 2015 puts the focus on the thermal components of the urban climate of Berlin, without however completely ruling out the air-hygiene area. The 2016 edition represents the second update of the technical map and with its publication in the environment atlas / FIS Broker replaces the 2009 edition as the basis for technical planning and evaluation for considering the city-climatic issues in the urban development of Berlin. The update was carried out in the scope of the EFRE project "GIS-supported modelling of parameters relevant for urban climate on the basis of high resolution building and vegetation data" between 2013 and 2015. This project was financed by European Funds for Regional Development (EFRE) and the City State of Berlin (project number: 027EFRE GDI) for measures for building up the geo-data infrastructure (GDI) (SenStadtUm 2015b). As compared to the 2009 version of the planning advice map, mainly the following enhancements relevant for the planning process can be made out: 1
Transcript of 04.11 Climate Model Berlin - Planning Advices Urban ...€¦ · Web viewThe adjoining residential...

04.11 Climate Model Berlin - Planning Advices Urban Climate (Edition 2016)This text is essentially based on the contents of the supplementary publication "Planning advice map for urban climate 2015 - Accompanying document for online version" (SenStadtUm 2015), which can be downloaded from here. Only the core statements are given here as the contents, in order to avoid redundancies. In the accompanying document, all important topics are dealt with in adequate detail and all evaluation methods are also described in detail.
OverviewA central objective of the Berlin Urban Development is to maintain / create an urban climate healthy for humans (SenStadtUm 2011). In the shape of the planning advice map (hereinafter: PHK) urban climate, an instrument for supporting this objective becomes available to the Administration since 2004.
The task of the PHK is "to highlight the areas and planning tasks relevant for a possibly optimum space classification under aspects of climate and air hygiene. It takes up the climatic and air-hygiene phenomena relevant for planning, which as part or small-scale special features or characteristics deviate significantly from the general climatic conditions and the large-scale air-hygiene situation and effect the health and well-being of humans […]" (Association of German Engineers 2015).
Since the air-hygiene effect complex has already adequately been covered by the Berlin air cleaning plan 2011-2017 (SenStadtUm 2013), the PHK edition 2015 puts the focus on the thermal components of the urban climate of Berlin, without however completely ruling out the air-hygiene area. The 2016 edition represents the second update of the technical map and with its publication in the environment atlas / FIS Broker replaces the 2009 edition as the basis for technical planning and evaluation for considering the city-climatic issues in the urban development of Berlin. The update was carried out in the scope of the EFRE project "GIS-supported modelling of parameters relevant for urban climate on the basis of high resolution building and vegetation data" between 2013 and 2015. This project was financed by European Funds for Regional Development (EFRE) and the City State of Berlin (project number: 027EFRE GDI) for measures for building up the geo-data infrastructure (GDI) (SenStadtUm 2015b).
As compared to the 2009 version of the planning advice map, mainly the following enhancements relevant for the planning process can be made out:
The horizontal resolution of the models could be increased from 50 m to 10 m (factor of 25),
individual green structures and buildings are now considered explicitly by the model,
the increased spatial accuracy permits statements not only for the overall city planning (F-plan, landscape plan, StEP), but also for the B-plan level,
along with the settlement areas and the green/open spaces, the public roads, paths and places are also viewed individually,
along with the night situation, the situation during the day is also equally included in the evaluation,
the contents of the PHK are agreed upon intensively with representatives of the responsible departments at the senate and district level,
the viewed catalogue of measures is much more extensive, differentiated with respect to content and aligned more individually to the viewed partial areas.
The relationship between human health and the urban climate, which is considered in the PHK at least rudimentarily with the inclusion of demographic factors, is viewed in a separate excursus (Scherber 2016) under special consideration of results present for Berlin.
1

Statistical baseThe application of the climate model Berlin in its current version is based on the following components building upon one another:
1. the evaluation of long-term operation of measurement stations in Berlin and Potsdam as the basis for calibrating the model results (04.13, long-term development of selected climatic parameters, SenStadtUm 2015a).
2. extensive analysis steps for working out a well-founded data basis (topic area 04.10 - publication under preparation), as well as
3. the preparation of three planning advice maps that supplement one another.
Following data bases were used mainly for conducting the process steps 2 and 3:
GEO-NET Umweltconsulting GmbH, Hanover: GIS supported modelling of parameters relevant for urban climate based on high-resolution building and vegetation data; EFRE project 027 Urban climate Berlin (SenStadtUm 2015b),
Data of the Urban and Environmental Information System (ISU) of SenStadtUm, III D 1, version 31.12.2010:
Block map 1: 5,000 (ISU5_UA),
Area usage data (SenStadtUm 2010),
Criteria for evaluating the soil functions, map of closeness to nature (SenStadtUm 2013a),
Uncorrected degrees of sealing (grid data) - intermediate result of the rule-based classification (SenStadtUm 2012),
Building and vegetation heights (SenStadtUm 2014),
Ground level (DGM5) (SenStadtUm 2010a),
Automated land register map Berlin (ALK), version 01.06.2014 (SenStadtUm 2015c),
Locations of the social infrastructure (Planning area related information system for monitoring and analysis (PRISMA) (SenStadtUm 2015e) as well as Regional Office for Health and Social Affairs (LAGeSo) (LAGeSo 2014),
Detailed map of the Berlin's network of roads, version 11/2014 (SenStadtUm 2014a),
State of Brandenburg:
ALKIS database Building and actual use, version 10/2013 (LGB 2013),
Ground levels (DGM25) (LGB 2013a),
Methodology Model-based urban climate analysisUnder the complete project, two model runs were conducted with the meso-scale climate model FITNAH for a high-summer weather situation with a horizontal resolution of 10 m. The first model run is based on an allochthonous west wind weather condition occurring relatively frequently in Berlin during the summer months. The second model run is based on an autochthonous weather condition without higher-level wind influence used regularly for an analysis of the urban climate. Additional data, differentiated in space, were derived for the specific climatological parameters from the resulting meteorological fields. On the whole, therefore, three supplementing extensive data sets are available.
It is state-of-the-art technology that only one meteorological situation can be consulted for deriving the PHK. The autochthonous peak-summer high pressure weather condition without the higher-level wind influence was selected to do this for PHK 2015. It represents the weather condition, in which the urban climatic process sequence is most clearly pronounced, and accordingly on whose basis useful planning instructions can be derived. Since for specific questions (e.g. B-plan process, effect analyses of measures) the results of the analysis phase can also become relevant, its data can also be retrieved in the geo-portal (under preparation).
2

Structure of planning advice mapThe 2004 and 2009 editions of the planning advice map for urban climate consisted respectively of a map as well as brief, explanatory texts for the environment atlas. The PHK 2015 consists, for the first time, of three supplementary maps as well as an explanatory accompanying document:
a main map
supplementary planning instructions, as well as
measures.
This method accommodates, on one hand, the high complexity of the topic, the enhanced significance within the inclusion of urban-climatic aspects in the urban development policy as well as the enhanced user requirements for accuracy of statements.
The "Main map" 04.11.1 is (enhanced in content and substantiated spatially) the equivalent to the PHK 2004 and 2009 editions. The map contains an extensive evaluation of the urban-climatic stress situations during the day and in the night (as well as summarised for an overall evaluation) and relief functions, and thus represents the technical basis for evaluation and decision-making for plans aligned to entire city as well as to partial spaces. In the "supplementary planning instructions" 04.11.2, selected partial topics of urban development were linked with the evaluation results shown in the main map as well as with further spatially high-resolution technical and geo-data. They act as basis for decision-making for specific technical plans or queries (e.g. urban redevelopment, sensitive uses, demography).
The "measures level" 04.11.3 contains, depending upon area type and actual space, the assignment of 30 individual measures to all ISU5 block (partial) areas as well as to all sections of "Detailed network" of the road network of Berlin. The level primarily focuses on improving or maintaining the status quo in the stock. However, those measures have also been expressed, which are relevant especially for the intensive new construction projects in Berlin.
Spatial units observedThe PHK main map differentiates mainly between three spatial evaluation units:
Settlement area Green and open spaces Public roads, paths, places.
Those areas are assigned to the settlement area, which primarily fulfil the functions of living, working and public facilities. The human being stays mainly in the residential areas during the day as well as in the night. Green and open spaces comprise of all areas, which are primarily meant either for human relaxation (e.g. parks, gardens, forests) or provide other climate-ecological services (e.g. arable lands). From the perspective of urban climate, the green and open spaces can provide a dual benefit. Firstly, they are visited actively during the day and form an counter-weight to the possible thermal or air-hygienic stress in the road and settlement areas. Secondly, they produce and/or transport cold and fresh air, especially in the night and enable the adjacent population to have a relaxing sleep even during bio-climatic stressful weather conditions. Public roads, paths and places, on the other hand, play a role during the day as temporary staying places for the human being. They are visited either for longer stays (e.g. town squares) or as means to an end, in order to reach a destination (e.g. going to work or shopping).
The units of the ISU5 block map form the geometric space reference. In doing so, each area has been assigned uniquely to one of the three usage categories. The assignment was done on the basis of the so-called area types (see SenStadt 2010). The spatial unit "Public roads, paths and places" represents a special case. Their partial areas are recruited partly from ISU5 area types with a traffic-related usage allocation (incl. town square, promenade, parking place). The major part of the around 22,000 individual areas were derived from the detailed map of Berlin road network and represents actual screen sections so that in this way a spatial link could be made possible between the air-hygienic and thermal stress levels on the roads.
Out of the approx. 890 km² of Berlin city area, 373 km² (41.9 %) have been classified as settlement area, and 351 km² (39.5 %) and 121 km² as road space (13.7 %). The remaining 5 % of the total area of Berlin constitute flowing and stationary water bodies. Owing to their climatic compensation function, the open water bodies occupy an essential position in the city-climatic process sequence of Berlin.
3

However, since the water bodies are normally not subject to any conversion or development pressure, they are shown in the PHK only for the purpose of information.
Approach, data basis and method of the process used for updating the climate data take into account a largest possible, simultaneously extensive detailing of the resulting statements. However, owing to the dynamic development in the city, the initial prerequisites for the evaluation on individual areas change faster than the possible update cycle of the maps in the environment atlas. Therefore, it is recommended to use the overlay function with the respectively latest air patterns in the geo-portal for an area check as well as for a comparison with the technical data of the PHK. From this, one can drawn inferences for the usability of the evaluation results.
Map descriptionMap 04.11.1 Main mapSettlement areaThe thermal situation is classified as "unfavourable" or "less favourable" in around 60% of the settlement area. Especially for the evaluation class "unfavourable", proactive measures for improving the situation as well as a more responsible handling of the resources is advised urgently. With a view on extreme events as well as the climate change, this can be extended to the areas of the class "less favourable". In contrast, 40% of the settlement area is to be classified as favourable or as very favourable (see Figure 1). In case of construction measures, it is to be pointed out here that these do not lead to extensive negative impacts on the area itself as well as on adjacent areas for the day or night situation.
Figure 1: Percentage distribution of evaluation classes for the overall thermal situation in the settlement areas (linking of day and night situation) of Berlin.
The thermal focus areas of the thermal stresses combined during day time lie in the districts of Friedrichshain-Kreuzberg and Mitte (see Figure 2 and Figure 3). Here, 80 % of the settlement areas fall in the classes "less favourable" or "unfavourable", which results in a recommendation for improving the situation. Closed perimeter developments (area types 2 and 7) as well as the extensive retail trade (type 30) use more than 40 % of the area in both the districts. Accordingly high are construction volume and degree of sealing, and accordingly low is the volume of greenery. Both lead to high stresses in partial areas mainly in the night, but in some areas also during the day.
Comparatively good is the thermal situation in the districts Steglitz-Zehlendorf, Marzahn-Hellersdorf and Treptow-Köpenick, in which measures for improvement are necessary on less than 50 % of the area. The areas can be beneficial firstly because of their high share of greenery and their connection
4

with the cold air origin areas in the city and in the surrounding regions (including Forst Grunewald in Steglitz-Zehlendorf, expanded forest areas between Müggelsee and Dahme in Treptow-Köpenick). Secondly, the historically more open development structure also favours a comparatively lower thermal stress level. Thus, "Single detached houses with garden" (type 23) are taking up the highest area portion in all districts. In Marzahn-Hellersdorf, this percentage is almost 50 %.
However, these values may not hide the fact that attention must be paid to a maintenance/development favouring the urban climate even in the bio-climatically favourable districts and in partial areas, measures are even advised for improving the thermal situation. A good example for this are the localities of Marzahn and Hellersdorf, whose "large settlement areas and high-rises" (type 23) show an unfavourable thermal total evaluation to almost 80 %, the main reason for which is the day situation or the situation on the public (road) space.
Figure 2: Spatial distribution of evaluation classes for the overall thermal situation in the settlement areas (linking of day and night situation ) of Berlin.
5

Figure 3: Balancing of the overall thermal situation in the settlement area of 12 districts of Berlin
Public roads, paths, placesAround 55 % of the public roads, paths and places of Berlin can be assigned to both the highest evaluation classes (see Figure 4) For the road sections and places of class 4, it is recommended to implement the short-term measures for improving the thermal situation. These should unfold an effect for the day situation (mainly shadowing measures). If a settlement area designated as thermally stressed in the night situation adjoins directly, additional measures must be taken (mainly the ones, which reduce the heat storage). While doing so, a special focus should be laid on those sections, for which an unfavourable thermal situation as well as a high or very high traffic air stress was modelled.
In the medium-term, measures are also recommended on some areas, which were assigned to the class "less favourable". During the heat periods, clearly higher stresses can be achieved here than the ones mapped in the modelling. In addition, the climate change will gradually increase the stress level of an average summer day on the public road space too.
On the remaining 45 % of the area of the spatial unit, the thermal situation can currently be identified as favourable or as very favourable. Measures for further improvement are not absolutely necessary, but should be taken into consideration, if possibly adjoining settlement areas show a stress and the measures cannot either be implemented there or not to an adequate extent.
6

Figure 4: Percentage distribution of the evaluation classes for overall thermal situation on public roads, paths and places in Berlin.
The spatial focus areas of the thermal load on the public roads, paths and places show a close relationship with the green volume or the portion of the area of road sections covered by road trees (both the parameters are present as calculated values from the captured vegetation structure (SenStadtUm 2014)). The base area coverage by the road trees is on an average only 8 % in the district of Marzahn-Hellersdorf. Even in case of green volume on the public road space, the district shows the lowest percentages; Steglitz-Zehlendorf, on the other hand, with the lowest percentages (24.5 %) of "less favourable" or "unfavourable" thermal conditions on public roads, paths and places, has in this spatial unit about 2.5 times the green volume as compared to Marzahn-Hellersdorf (see Figure 5 and Figure 6).
In most of the remaining districts, the area percentage of the cumulated values for the load situation lies between 55 % and 65 %. According to the current evaluation, the most pleasant bio-climate on the public road space is present in the districts of Steglitz-Zehlendorf, Charlottenburg-Wilmersdorf and Reinickendorf. The cumulative area percentages of the classes 3 and 4 here are between just 25 to below 40%. The percentage of the area of road sections covered with trees shows that potential for improvement is still present in these areas. For both the last two mentioned districts, they lie between 14 % and 16 %.
7

Figure 5: Overall evaluation of the thermal situation on public roads, paths and places in Berlin.
Figure 6: Balancing of the overall thermal situation on public roads, paths and places of the 12 districts of Berlin.
Air exchange
8

The extensive air-exchange system of Berlin consists primarily of three components:
Air conducting and ventilation pathways,
orographically-thermally induced, extensive cold air outflows,
thermally induced, line-like cold air pathways.
The air conducting and ventilation pathways, important for Berlin, follow the valleys of Havel, Dahme and Spree. They are significant mainly in case of allochthonous weather conditions, in which regional wind systems are formed because of more or less extensive air pressure differences. In Berlin, these weather conditions occur in the long-term mean (2001-2010), depending upon the station observed, between 61.9 % (Berlin-Grunewald) and 91.5 % (Berlin-Dahlem) (SenStadtUm 2015a). In doing so, western wind directions are prevalent. In the valleys, the introduced cold air is channelised, accelerated and transported in this way to the inner city having comparatively weaker winds ("jet effect"). To be able to make an optimum use of this phenomenon, the shore areas should be kept free and the development should be kept open in the transition areas to the water bodies.
Autochthonous weather conditions without (or with only weakly pronounced) higher-level wind systems occur rather rarely in Berlin (8.5 % - 38.1 % of the yearly hours). However, they are normally connected with stronger stresses for the health of the urban population, because the transportation of air pollutants is inhibited because of inversions and there is a characterisation of the urban heat island. For these weather situations, local, thermal and/or orographically induced cold air flows and floor wind systems take up the supply of the city with cold/fresh air.
The thermally-orographically induced cold air outflow is to be traced back to relief differences, which in the morning hours leads to an outflow of the cooling air parallel to the slope. The prerequisite for cold air outflow volume relevant for planning is an extensive slope inclination of > 1 %, which should also be assigned in the direction of a (thermally stressed) settlement area. Grunewald has the biggest, area-wise cold air outflow potential. The cold air can outflow here to almost 3,500 ha. The adjoining residential development benefits directly from this, in particular, in the northern and eastern part.
Purely thermally induced cold air pathways are, on the other hand, more frequent and also distributed more homogeneously over the city area. The reason for these is the small-scale succession of local high and low pressure area within Berlin during the night hours of autochthonous weather conditions and they see to it that air rising over the warm, densely built settlement areas is replaced at ground level by comparatively cooler air masses from their surroundings, especially larger green/open spaces. In particular for the inner city area, they represent the most important relief effects.
Demarcating their effective areas against one another and against those of the other components of the air-exchange system based on clearly defined areas is not possible without further model and technical measurement analyses owing to spatial overlaps. However, the core areas of the individual pathways can be demarcated spatially on the basis of modelling and approximately balanced and compared. The greenways are suitable to a large extent as core area of the thermally induced pathway type. They not only transport further the cold air generated in the outer area, but also enrich the air stream with additional volume of cold air. Relevant quantities of cold air can also be transported to the city over broad streets. The pathways with air-hygiene stress must be differentiated here from the unstressed pathways (VDI 2015).
The identification of the pathways and their corridors was done manually as an advisory estimate and is based on the characterisation of the autochthonous flow field of the FITNAH simulation carried out. In doing so, the demarcation of the pathway corridors is not for clearly defined areas and in the actual planning case (e.g. a construction project) requires at least one additional expert assessment.
For the city area of Berlin, a total of 21 pathways were identified (see Figure 7). Their core regions include a total area of around 1,250 ha, which is the same as 1.4% of the complete city area. Each pathway represents a central component of the air-exchange system of Berlin. For this reason, all structural obstacles are to be avoided, which could cause a cold air jam. The basic objective should be to maintain the portion of green and open areas. In case of a construction, the construction height should be kept as low as possible and the new structure should be aligned longitudinally to the pathway. Perimeter developments are to be avoided completely.
9

Figure 7: Core zones of cold air pathways ("pathway corridors") in Berlin
For all the three main components of Berlin's air-exchange system, it is equally true that their individual structures (air conducting and ventilation pathways), potential areas (cold air outflows) or core zones (cold air pathways) can be derived from model results and other technical and geo-data. A demarcation of their specific effective areas with respect to area or component - which as a rule go much beyond the areas shown above - cannot be ensured with adequate surety without further in-depth studies owing to mutual spatial overlapping and influencing.
However, it is possible to map and balance the complete cold air effective area of Berlin's exchange system (see Figure 8). A part of this analysis is also the cold air flowing out of the many smaller and bigger green areas as well as from the strongly green settlement areas. These local phenomena form the smallest piece of mosaic of Berlin's air-exchange and offer a climate-ecological welfare impact mainly to the partial areas of settlement areas with cold air pathways or away from cold air outflow (this mainly concerns the districts of Mitte and Friedrichshain-Kreuzberg).
10

Figure 8: Summary effective area of the components of Berlin's air-exchange system in case of autochthonous weather conditions.
As shown by Figure 9, there are big differences among the Berlin's districts with respect to the absolute and relative portion of the residents benefiting from cold air as well as the settlement area influenced. In all the mentioned categories, the districts of Reinickendorf, Pankow and Spandau have the three most favourable ranks. They benefit the most from the air exchange. The district of Reinickendorf is highlighted especially in the statistics: approximately 80 % of the residents or of the settlement area are connected to cold air flows. It can, therefore, be assumed in a justified way that the clear, below-average nightly thermal stress and mainly the very low portion of block (partial) areas of the class "unfavourable thermal situation" in the three areas is connected very closely with the good supply of cold air. This context can also be assumed in the opposite way for the districts of Tempelhof-Schöneberg and mainly Friedrichshain-Kreuzberg. In both the districts, only a few more than 20,000 residents (same as < 10 %) benefit from the cold air flows. On the whole in Berlin, based on the model results, around 1 million residents (same as approx. 30 % of the total population) benefit from the cold air transported to the city via the versatile air-exchange system or else from the cold air directly produced in it.
These values illustrate the central importance of the cold air management for Berlin. They also show an improvement potential, which can be exploited with the help of measures.
11
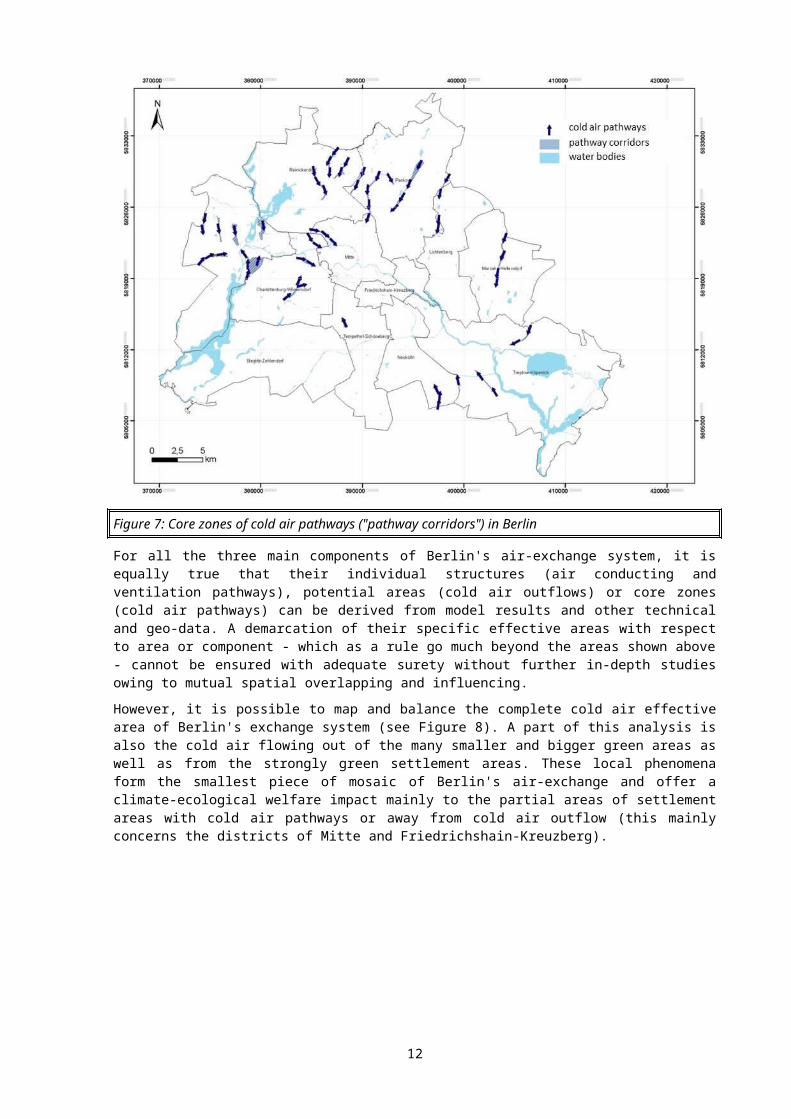
Figure 9: Balancing of cold air effect on the settlement area in Berlin according to districts
Green and open spacesThe highest worthiness for protection has been assigned to a little more than half of the green and open spaces of Berlin (Figure 10 and Figure 11). These areas include the climate-ecological compensation areas important for the current settlement structures. Their climate functions are very important. Structural interventions should be avoided or, if already prepared under the planning law (FNP construction areas), should be done under consideration of the fundamental climate functions. For optimising the ecosystem service, the objective should be a good flowing of the adjoining development, a networking with the neighbouring green and open spaces as well as an increase of micro-climate diversity. Along with all core-urban green/open spaces (incl. park at triangular junction, Tempelhof field, Great Zoo), some agriculturally useful areas to the north of Berlin are also part of the highest evaluation class.
A high worthiness of protection can be ascribed to around one-third of all green and open spaces of Berlin. The expanded forest areas of Berlin make up a major part of this at around 85%. Under the remaining portion of the areas, there is a dominance of parks, small gardens and fallow land with vegetation.
For the current settlement structure, these areas represent important climate-ecological compensation areas. Structural interventions should be done very moderately or, if already prepared under the planning law (FNP construction areas), under consideration of the fundamental climate functions. For optimising the ecosystem service, the objective should be a good flowing of the adjoining development, a networking with the neighbouring green and open spaces as well as an increase of micro-climate diversity.
Like this, around 95 % of all Berlin's green and open spaces show a high to very high climate-ecological worthiness of protection. This illustrates the high relevance of most of the green and open spaces for a healthy climate of Berlin. Areas with an average worthiness of protection represent the supplementary space to the urban-climatic compensation system, but make up only a very low percentage of the complete area of the spatial unit. The adjacent development benefits from the provided climate function, but is normally not dependent on it. A low worthiness of protection was assigned to all remaining areas. For the current settlement structure, they do not provide any service relevant for climate-ecology. It is true for all areas with a low or average worthiness of protection that their evaluation in case of their construction or a construction in their immediate environment must be done again.
12

Figure 10: Percentage distribution of evaluation classes for climate-ecological worthiness of protection of open/green spaces in Berlin
Figure 11: Spatial distribution of evaluation classes for climate-ecological worthiness of protection of open/green spaces in Berlin
13

Map 04.11.2 Supplementary planning instructionsAreas with special urban-climatic drawbacksFor all block (partial) areas of the settlement area or all road sections with a less favourable and mainly with an unfavourable thermal situation, it is recommended to implement the measures. Apart from this, there exists for some open and green spaces a potential for improving their climatic ecosystem services (e.g. in the context of micro-climate diversity). The areas with a special urban-climatic drawback are those sections of the areas, for which there is a priority need for action because of high stress level, which can be covered in the scope of an urban sanitation or an urban redevelopment.
To be able to give concrete instructions for the three spatial units (settlement area, green/open spaces, road space) of the main map, a differentiation has been done below in the following six area categories (see Table 1). Four of these refer to the settlement area. One differentiates here between the function of living, trade/industry, public utility/special uses and core areas. A category of priority action space was assigned each to public roads, paths and places as well as green and open spaces. The evaluation is based on purely climatic aspects as defined in a planning instruction. A linking with further vulnerability factors is done in a further step (see Section "Areas with a special vulnerability as compared to the urban climate").
Settlement area Living WOZ* 10 or 21 as well as unfavourable thermal situation during the day and in the night
Trade/industry WOZ 40 as well as percentile P90 of the class of unfavourable thermal situation during the day
Public utility/special uses WOZ 50 as well as percentile P90 of the class of unfavourable thermal situation during the day
Core area WOZ 30 as well as unfavourable thermal situation during the day and in the night
Public roads, paths, places
Road sections Unfavourable thermal situation during the day as well as very high air stress caused by traffic.
Green and open spaces
Park | Green area | Town square | Promenade
Type 53 or 54 as well as percentile P95 of the block (partial) area-space mean value PET 02:00 p.m.
* WOZ= Abbreviation for the categories of the structural uses, stands for "Living number"; detailed description see SenStadt 2010
Table 1: Categories and methods for identifying the areas having special urban-climatic drawbacks
Over all the area categories, 751 priority action spaces have been identified. The highest share in this is shown by the category "Road sections" at almost 60 %. To about one-third, the categories assigned to the settlement space are subsumed. The settlement type "Living" represents here the biggest group with 107 block (partial) areas. The remaining approx. 10 % falls on the category park | green area | town square | promenade (Figure 12).
14

Figure 12: Percentage distribution of the area categories with special urban-climatic drawbacks in Berlin.
It can basically be determined that areas with priority need for action have been identified in all districts. The spatial focus lies in the districts Mitte (relevant for all area categories) and Charlottenburg-Wilmersdorf (the road space is mainly significant here). In both these districts, almost 40 % of the areas to be sanitised on priority are located. A subordinated focus point are the districts of Tempelhof-Schöneberg, Marzahn-Hellersdorf and Freidrichshain-Kreuzberg. In the districts Reinickendorf and Steglitz-Zehlendorf, on the other hand, there are only a few hot spots (Figure 13 and Figure 14).
15

Figure 13: Balancing of areas with special urban-climatic drawbacks for the 12 districts of Berlin
Figure 14: Areas with special urban-climatic drawbacks in Berlin
Areas with a special vulnerability as compared to the urban climate
16

The identification of areas with a special urban-climatic drawback is based on a purely planning, climatic perspective. Their connection with further non-climatic criteria can disclose additional decision-making helps in the context of implementation of measures especially for the spatial unit "settlement area" as defined in a spatially differentiated vulnerability study.
To what extent the block areas of the settlement area are vulnerable to the city-climatic situation depends on primary criteria of time of stay/use as well as on further secondary factors. These include, above all, the demographic composition of the quarters observed. Apart from this, the availability of specific sensitive building/area uses as well as the degree of supply of residential areas with adequate green areas are the factors that influence the level of vulnerability.
Special vulnerability based on demographic composition
Especially sensitive to the thermal (heat) stress are mainly the older people in the population (above 65 years [Ü65] owing to the susceptibility to cardiovascular disorders increasing with age as well as small children below 6 years (U6), and mainly infants because of their lacking or not fully developed ability for thermal regulation (Jendritzky 2007). A relationship between an increased mortality and the occurrence of heat periods can be shown empirically for the areas of Berlin-Brandenburg and can also be mapped in a model (Scherber 2014, Scherer et al. 2013, Fenner et al. 2015).
In-depth information about the relationships between "Health and urban climate" is offered by the related excursus (Scherber 2016).
About 850,000 people live in Berlin, for whom a special thermal sensitivity can be assumed owing to their age (Statistics BBB 2014). The ratio of the sensitive older and the sensitive younger percentage of the population is approx. 3.4:1. It applies equally to all districts that the risk group of older people is much higher than that of small children and infants. This phenomenon is most strongly pronounced in the district Steglitz-Zehlendorf (5.3:1), where just about 90,000 of the thermally most sensitive residents of Berlin live. In Friedrichshain-Kreuzberg – the district with the lowest number of thermally sensitive residents (approx. 45,000) - there are only 1.6 Ü65 year old for one person in the age of U6.
To what extent can an actual vulnerability also be derived from this sensitivity, depends essentially on the geographic distribution of the risk groups in the spatially differentiated stress field. In the result, there is a high or very high demographic vulnerability in approx. one third of all block areas , Approx. three quarters of all heat-sensitive Berliners live in these areas (around 650,000 residents). Vice versa, it also means that measures need to be implemented only in a comparatively small area, in order to give thermal relief to a high percentage of vulnerable population group.
A spatially differentiated analysis at the level of Berlin's districts shows that although there is a fundamental agreement in the distribution of population groups sensitive to climate with the space patterns of the actual demographic vulnerability, but there are still some essential differences (Figure15 and Figure 16).
Thus, although the district Steglitz-Zehlendorf is the biggest group of thermally sensitive persons, the district has only rank 7 in case of demographic vulnerability. The reason for this is firstly that the stress level lies on the whole below the average. Secondly, the risk groups are currently living in thermally favourable areas. The reverse case applies to Pankow. Seen absolutely, there is the highest demographic vulnerability here, although the district has only the fourth largest sensitive population.
At the lower end of the scale, both the results match in contrast: Spandau, Marzahn-Hellersdorf and Friedrichshain-Kreuzberg show the lowest number of sensitive persons as well as the demographic vulnerability. However, it applies to Friedrichshain-Kreuzberg that the majority of the sensitive population also lives in areas with thermal stress (approx. 80 %). A higher percentage is also seen in the district of Lichtenberg (82 %). Even Mitte and Neukölln lie at the same level.
17

Figure 15: Demographic vulnerability as compared to thermal stress - Spatial analysis at the level of block areas in Berlin
Figure 16: Demographic vulnerability as compared to thermal stress - Balancing at the level of Berlin's districts
18

Special vulnerabilities based on building/areas uses sensitive to urban climate
Uses of areas/buildings sensitive from the perspective of urban climate are mainly the ones, which are preferably used by the risk groups. For the present analysis, a total of eight different usage types were differentiated: Hospitals, care homes, libraries, child day care centres, schools, after-school care centres, play areas and sports complexes. In the partial areas of the three higher-level space units of PHK 2015, there are currently a total of around 7,300 corresponding individual uses. The main share is constituted by about 64 % of play areas and child day-care centres.
On the whole, at least one climate-sensitive usage type is found in around 25 % of the settlement areas, approx, 12 % of all green and open spaces and 5 % of all partial areas of the space unit public roads, paths and places. In over 90 % of the cases, not more than two different usage types occur simultaneously for each partial area, but in the individual case up to six types occur as cluster.
The spatial distribution of the sensitive area/building uses within Berlin is relatively homogeneous and shows a high correlation with the total population with respect to the districts. The following applies: The more residents a district has, the more climate-sensitive uses also occur. Accordingly, the district of Pankow with almost 700 affected block areas is present at the upper end of the scale, while the district of Spandau is at the lower end with more than 350 block areas with at least one climate-sensitive use. The evaluation shows that there is a relevance for this topic too in all districts of Berlin.
To what extent an actual vulnerability of the individual areas results from this spatial distribution, depends essentially on the geographical position in the differentiated stress field. The absolutely viewed largest number of areas with vulnerable uses lies in the district of Pankow, which also shows the highest number of sensitive (also potentially vulnerable) uses of areas/buildings. Apart from this condition, the result does not disclose any relationship between the frequency of occurrence of vulnerable and sensitive uses / the population strength. The reason for this is the spatially divergent percentage share of sensitive uses in a thermally sensitive environment. With respect to complete Berlin, the corresponding value is 33 %. However, within the twelve districts of Berlin, this value fluctuates considerably between approx. 15 % in Steglitz-Zehlendorf and almost 66 % in Marzahn-Hellersdorf (Figure 17).
Figure 17: Absolute number and relative percentage of aggregated sensitive uses in thermally stressed environment in the 12 districts of Berlin.
In contrast, the sequence of the absolute number of vulnerable usage types matches exactly that of the ranking for the sensitive types. Play areas and child day care centres also occur here very frequently as the remaining usage types. They clearly make up more than 50 % of the total 2618 partial areas having vulnerable area/building uses. Similar to the district-wise evaluation, there are here also higher differences in the scope, in which the climate-sensitive uses also become actually
19
vulnerable uses. Especially relevant is the high rate in case of care homes and hospitals, which are located in a thermally stressed environment to more than 50 % and for which a highlighted, prioritised need for action can be derived.
Figure 18: Absolute number and relative percentage of sensitive use types in thermally stressed environment in Berlin.
Special vulnerabilities based on a shortage of green areas
Apart from providing cold air, the open and green areas of Berlin also provide a second, central climate-ecological service: They are cool islands during the day, which can be visited actively by the (thermally) stressed residents of the city and provide for their relaxation. Unlike the production of cold air - which is dependent on larger consistent areas (> 1-2 ha) for the supply of relevant volume - a regular mosaic made of smaller green areas is especially suitable for a short-term relaxation. Only in this way it can be ensured in the sense of a social-ecological fairness that the residents of the city of all parts can fulfil their need for relaxation (Scherer 2007).
Viewed on a small-scale, the green and open spaces with a high percentage of shade are mainly important in such areas, in which a relevant thermal stress level occurs during the day together with a shortage of private green areas. A linking of both these parameters shows the partial block areas, on which there is a special city-climatic vulnerability because of a shortage of green areas. These areas require a special attention in the provision of thermal comfort islands (so-called "pocket parks") in the private and public space.
On the whole, 807 partial block areas of the settlement area show a vulnerability against the urban climate because of a shortage of green area (matches about 5 % of all partial block areas or 4 % with reference to their area). The affected quarters have around 375,000 residents, of whom approx. 80,000 belong to a risk group. This implies that approximately each 10th Berliner or each 10th member of the risk group based on age structure is affected by the studied drawback.
The areas are distributed over the complete urban area of Berlin, but the spatial focus areas can be made out. The hot spots include the districts of Mitte and Pankow, which show the mostly affected partial block areas as well as the mostly affected residents. Together, they make up for a percentage of each approx. 30 % (130,000 residents, 250 blocks). During the day, both the districts are not among the most strongly stressed areas of Berlin, which indicates that the supply of green area is distributed unfavourably here with respect to thermal relaxation and/or there are too few relaxation areas on the whole. The reverse case applies to the district of Spandau. In comparison, it shows a lot of areas thermally stressed during the day, but only few vulnerable areas/residents owing to a shortage of
20

green areas. The best situation exists in Steglitz-Zehlendorf, where a thermally relevant short supply can be ascertained for less than 10,000 residents (Figure 19 and Figure 20).
Figure 19: Spatial representation of areas with a special vulnerability as compared to the urban climate based on a shortage of green areas in Berlin
21

Figure 20: Balancing of the vulnerability as compared to the urban climate based on a shortage of green areas in the 12 districts of Berlin.
Map 04.11.3 MeasuresIn the third main level of PHK 2015, 413 individual combinations of 30 different measures and planning instructions have been assigned to around 45,000 partial block areas and road sections. With 312 different measures combinations, a major part of this falls on the settlement areas, which also becomes clear in the area background of the individual measures. Moreover, 88 different measures combinations are assigned to green/open spaces, 12 to the spatial unit of public roads, paths and places as well as 1 to water bodies.
The assignment of measures depends upon the area type, the individual evaluations in the main map as well as in the supplementary planning instructions and some additional technical and geo-information. Based on the scale for the entire city, not all area specifications could be included comprehensively in the analysis so that the results summarised in Table 2 are to be understood as suggestions, which need to be checked and substantiated again when viewing an actual area or a specific measure (= search areas). In this context, there should also be an in-depth discussion on the supporting instruments and tools for implementing the measures.
Detailed statements for the 30 individual measures can be taken from the accompanying document of PHK (SenStadtUm 2015). More information can also be taken from the Urban Development Plan of Berlin for Climate and its substantiation (under preparation) (SenStadtUm 2011), the Climate Booklet for Urban Development (MVI 2012) as well as the Manual of Urban climate (MUNLV 2010).
22

Short title Recommended for the spatial unit
Settlement area
Public roads, paths, places
Green and open spaces
Water bodies
Measure 01 Shading of roads and footpaths no yes yes no
Measure 02 Greening and shadowing of parking spaces yes yes yes no
Measure 03 Reduction of anthropogenic heat emissions yes yes no no
Measure 04 Greening of rail tracks no yes no no
Measure 05 Demolition (de-densification) yes no no no
Measure 06 Unsealing yes yes no no
Measure 07 Creation of pocket parks yes yes yes no
Measure 08 Improvement of accessibility of public parks and green areas
yes no no no
Measure 09 Greening of inner courtyard / backyard yes no no no
Measure 10 Shadowing of buildings yes no no no
Measure 11 Increase of albedo of surfaces yes yes no no
Measure 12 Water in the public space yes yes yes no
Measure 13 Energetic building development yes no no no
Measure 14 Roof greening yes no no no
Measure 15 Greening of façade yes no no no
Measure 16 Summer heat protection in buildings yes no no no
Measure 17 Adjustment of space usage concept yes no no no
Measure 18 Technical building cooling yes no no no
Measure 19 Pay attention to building position in new structures
yes no yes no
Measure 20 Urban climate-related uncoupling of new construction and re-densification areas
yes no yes no
Measure 21 Expansion of social infrastructure and networks
yes no no no
Measure 22 Increase in the micro-climate diversity no no yes no
Measure 23 Protection of the areas relevant for cold air management
yes yes yes no
Measure 24 Networking of the areas relevant for cold air management
yes yes yes no
Measure 25 Avoidance of exchange barriers yes yes yes yes
Measure 26 Improvement of air quality in cold air pathways no yes no no
Measure 27 Protection of existing large-area parks / green areas
no no yes no
Measure 28 Creation of new large-area parks / green areas no no yes no
Measure 29 Protection of forest areas no no yes no
Measure 30 Protection of open water areas no no yes yes
total 22 12 14 2
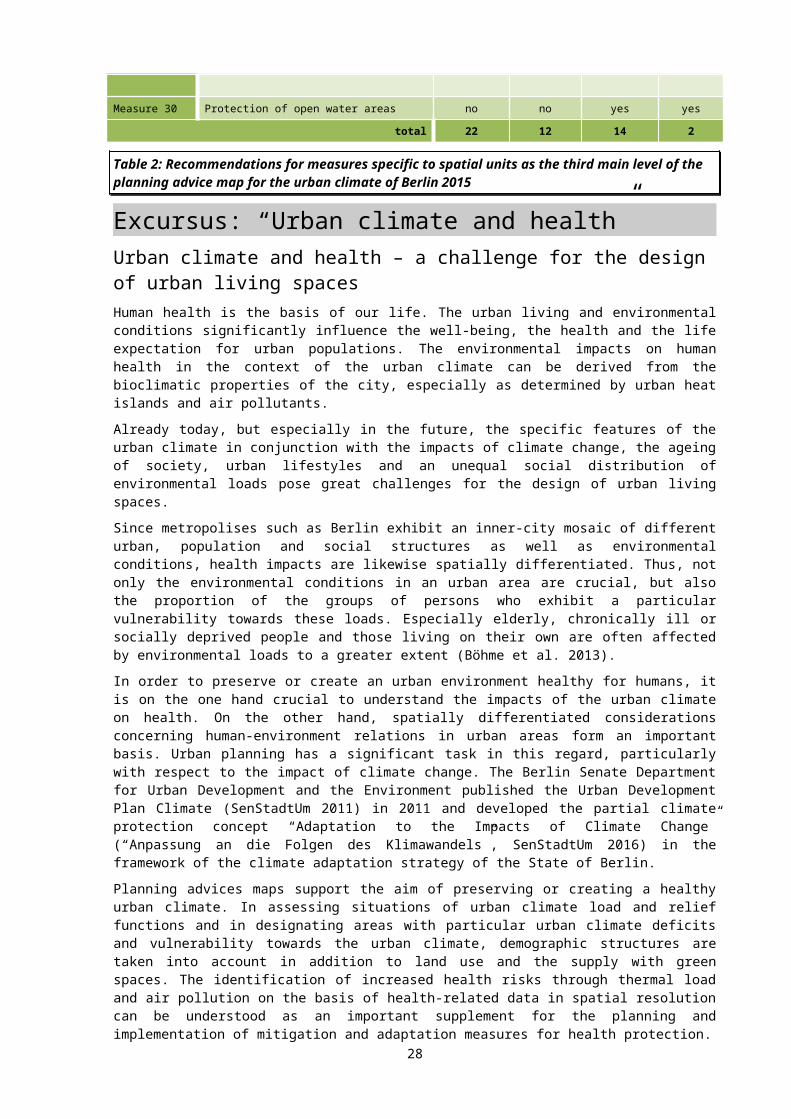
Table 2: Recommendations for measures specific to spatial units as the third main level of the planning advice map for the urban climate of Berlin 2015
23

Excursus: “Urban climate and health”Urban climate and health – a challenge for the design of urban living spacesHuman health is the basis of our life. The urban living and environmental conditions significantly influence the well-being, the health and the life expectation for urban populations. The environmental impacts on human health in the context of the urban climate can be derived from the bioclimatic properties of the city, especially as determined by urban heat islands and air pollutants.
Already today, but especially in the future, the specific features of the urban climate in conjunction with the impacts of climate change, the ageing of society, urban lifestyles and an unequal social distribution of environmental loads pose great challenges for the design of urban living spaces.
Since metropolises such as Berlin exhibit an inner-city mosaic of different urban, population and social structures as well as environmental conditions, health impacts are likewise spatially differentiated. Thus, not only the environmental conditions in an urban area are crucial, but also the proportion of the groups of persons who exhibit a particular vulnerability towards these loads. Especially elderly, chronically ill or socially deprived people and those living on their own are often affected by environmental loads to a greater extent (Böhme et al. 2013).
In order to preserve or create an urban environment healthy for humans, it is on the one hand crucial to understand the impacts of the urban climate on health. On the other hand, spatially differentiated considerations concerning human-environment relations in urban areas form an important basis. Urban planning has a significant task in this regard, particularly with respect to the impact of climate change. The Berlin Senate Department for Urban Development and the Environment published the Urban Development Plan Climate (SenStadtUm 2011) in 2011 and developed the partial climate protection concept “Adaptation to the Impacts of Climate Change” (“Anpassung an die Folgen des Klimawandels”, SenStadtUm 2016) in the framework of the climate adaptation strategy of the State of Berlin.
Planning advices maps support the aim of preserving or creating a healthy urban climate. In assessing situations of urban climate load and relief functions and in designating areas with particular urban climate deficits and vulnerability towards the urban climate, demographic structures are taken into account in addition to land use and the supply with green spaces. The identification of increased health risks through thermal load and air pollution on the basis of health-related data in spatial resolution can be understood as an important supplement for the planning and implementation of mitigation and adaptation measures for health protection.
What is the connection between urban climate and human health?Urban structures modify the bioclimatically relevant parameters air temperature, humidity and airflows, and the exchange of radiation and energy. The urban climate can impact on humans directly and indirectly, since urban heat islands and air pollutants in the urban atmosphere not only have a direct influence on humans, but also on water, soil, flora and fauna in the city. And through these partial spheres (hydrosphere, pedosphere, biosphere), indirect effect pathways to humans can also be traced. In the following, the focus of the considerations will be on the direct impacts of the urban thermal load on human health.
Urban heat islandsThe urban heat island has both a beneficial and a detrimental bioclimatic impact on human health. A shortening of the winter frost season and a reduction of the number of heating days, through which air pollutant immissions decrease (Kuttler 1998) and the risk of cold-related illnesses and deaths is reduced, is to be assessed positively. However, shortened frost seasons and milder winters also entail an extension of the vegetation period and thus the pollen season, which can increase and exacerbate allergies and change the allergen spectrum (Eis et al. 2010). Increased risks of infection are also to be expected, as the conditions for alternate animal hosts and carriers (vectors) of pathogenic organisms to live and proliferate are more favourable (Eis et al. 2010). The urban overheating has negative effects especially in the summer months, when the intensity is greatest at night. As these particularly heavy loads coincide with the nocturnal recovery phase of humans, they constitute an additional strain for the human organism on continuously hot days (Koppe et al. 2004). However, high air temperatures, low wind intensities and spatially diverse radiation conditions can lead to heat stress also during daytime in the summer. The degree of thermal load is mainly determined by the insolation.
24

Heat waves, i.e. several consecutive days with thermal load, are a special problem in cities, as buildings and impervious areas heat up over days, store this heat and release it with a delay. If there is no adequate night-time ventilation in these cases, residents in these urban areas experience a continuous thermal stress across the day and night hours, whereas residents in favourable urban areas experience heat relief overnight through the cooling influence of adjacent open spaces. Berlin distinguishes itself with its outstanding mixture of developed and green areas through a mosaic of different micro-scale climates and thus large differences in the thermal conditions in a small space. Assessing their climatic impact is a priority task of the three-part Planning Advices Urban Climate Map.
Thermal loadThermal load is understood as a health-relevant assessment of the thermal environment. The thermal load is determined either by means of simple methods, e.g. threshold values of the air temperature (climatological threshold days), or by means of complex methods, e.g. via the Predicted Mean Vote (PMV), the perceived temperature, the Physiological Equivalent Temperature (PET) or the Universal Thermal Climate Index (UTCI), an update of the Klima-Michel model applied by the German Meteorological Service and of the perceived temperature (Koppe 2005, Jendritzky et al. 2009). The thermal load is divided into heat load and cold stimulus. A severe thermal load is also referred to as a heat load or heat stress, but the terms are often used synonymously and there are no standardised definitions.If the mortality (mortality or mortality rate related to the total population) and e.g. the air temperatures are considered across the calendar year, one usually finds a U-shaped curve (cf. Figure 21).
Figure 21: Schematic representation of the air-temperature-mortality relationship according to Eis et al. (2010), Koppe et al. (2004), Laschewski (2008), Schneider et al. (2009) and Breitner et al. (2013).Continuous line: Temperature-mortality relationship across the calendar year. Dotted line: Temperature-mortality relationship during phases of great thermal load or during summer months (Scherber 2014)
The curve progression can vary depending on the regional climate, the season under consideration and the cause of death (Koppe et al. 2004, Michelozzi et al. 2009, Schneider et al. 2009). In the middle latitudes, the total mortality (all causes of death) exhibits a maximum in winter and a minimum in summer. However, in particularly hot summers, as was the case in Berlin in 1994, 2006 and 2010, the total mortality can exceed the winter maximum (cf. Figure 22).
25

Figure 22: Daily deaths (all causes) and daily maxima of the Universal Thermal Climate Index (UTCI) in Berlin in 2010 compared to mean values based on 2000-2010 (Scherber 2014)
Heat-related diseasesThe human organism tolerates deviations of the body's core temperature only to a small extent. By contrast, the body shell (arms, legs and skin) can tolerate varying temperatures to a much greater extent. If the body’s core temperature increases, if the upper limit of the so-called thermal comfort is exceeded or the human thermal regulation is disturbed, the organism increasingly suffers from heat stress. Even healthy persons can experience significant increases of the pump performance of the heart, even under conditions of physical rest, and may therefore suffer from reduced physiological functional reserves and limited intellectual cognitive performance (BMU 2011). The body reacts with discomfort, reduced physical performance and lack of concentration. Symptoms of heat stress are a feeling of impairment and strain. Increased medication may be necessary for people who are already ill. A continuous exposure to high temperatures can result in heat-related emergency situations (e.g. heat cramps, heat stroke), diseases and even death. Heat-related diseases mainly affect the cardiac, vascular and respiratory system, which is strained due to additional effects of air pollutants and pollen (BMU 2011, Michelozzi et al. 2009, Schneider et al. 2011). In addition, high temperatures and low humidity can dehydrate the mucous membranes, which is relevant both in summer and indoors in winter. Pathogenic organisms which cause diseases of the respiratory system or worsen existing symptoms can easily settle on dry mucous membranes.
Persons at risk and risk factors with respect to thermal load
The water loss via the skin when sweat evaporates significantly increases when the surrounding temperature is higher and is further reinforced under conditions of physical work or an existing disease which is itself water-consuming (e.g. diabetes mellitus, diarrhoea). High water loss is particularly problematic for elderly and sick people, infants and toddlers, as their thermal regulation system is restricted, their perception of thirst is reduced, and the hormonal regulation of the water and electrolyte balance is modified. If the water and electrolyte regulation is not balanced accordingly, the water loss leads to a lack of volume in the circulatory system, and the circulatory function and renal activity are impaired, which may result in the collapse of the organism. In the short term, young adults can compensate even severe water loss solely by drinking. Elderly people often need several days for this (Wichert, von 2004).
People at heat risk further include persons with existing severe health impairments e.g. by diseases of the cardiovascular and respiratory systems and persons who are bedridden or have neurological or psychiatric diseases. They may not be able to provide for themselves independently and usually take
26

medication which impacts on the electrolyte and thermal regulation, e.g. diuretics (flushing out water), neuroleptics (antipsychotic), beta blockers (reducing blood pressure) and barbiturates (enhancing sleep). In addition to age and pre-existing diseases, further risk factors for heat-related diseases are alcohol and drug abuse, exhausting physical activities during extreme weather conditions, lack of acclimatisation, low levels of fitness, overweight, physical fatigue, physical and social isolation, low socio-economic status, living in conurbations and lack of or insufficient air conditioning (Eis et al. 2010, Koppe et al. 2004).
Acclimatisation
Acclimatisation is an essential aspect regarding the impacts of thermal load. Acclimatisation is to be understood as the physiological adaptation of the human organism to changed climatic conditions. The thermal load impacting on the body is reduced through increased efficiency in the thermal regulation system and hormonal changes. A short-term heat acclimatisation is usually reached after 3-12 days, whereas a long-term heat acclimatisation can take several years. The effects of short-term heat acclimatisation include increased sweat production, even at a lower body temperature, and a reduced concentration of salt in sweat and urine. However, this form of acclimatisation is only reached if the heat exposure occurs for several hours daily, and it reverts within several weeks after the heat exposure (Koppe et al. 2004). The speed and extent of the acclimatisation depend on different individual factors such as age, gender, genetic predisposition, state of health, physical performance and fitness. External factors, e.g. the use of air conditioning, and national, geographical and seasonal differences are also crucial for the acclimatisation and individual heat tolerance (Koppe 2005).
Due to the relevance of the physiological adaptation in assessing the thermal environment, the HeRATE method (Heat Related Assessment of the Thermal Environment) was introduced (Koppe 2005). This method is taken into account in calculating the threshold values of the thermal index “perceived temperature” for heat alerts of the German Meteorological Service. For this reason, the threshold values of the perceived temperature for heat alerts are slightly lower for early summer heat waves and at higher latitudes, and slightly higher in midsummer and at lower latitudes.
How can impacts of urban climate on health be studied?On the one hand, connections between urban climate and human health can be studied on the basis of the impacts of thermal load and air pollution on mortality, morbidity (frequency of diseases), or e.g. on individual physical and psychological parameters. These health indicators often come from data from death statistics, hospital diagnosis statistics (e.g. patient admissions in hospitals), statutory health insurance funds (e.g. billing data) or emergency rescue services. In order to capture thermal load and air pollution, data are obtained from stationary monitoring networks, mobile measurements or based on spatial interpolation.In investigating the connections between environmental exposures and health impacts, a distinction is made between short-term and long-term effects. Short-term effects occur in immediate temporal proximity to the exposure (i.e. within a few days). However, in the long run chronic diseases may result (Breitner et al. 2013).On the other hand, the risk for health effects of thermal load and air pollution can also be derived from urban, population and social structures. Taking further health and meteorological indicators into account, this approach results in vulnerability, environmental risk or heat stress maps that spatially represent the potential risk for heat stress or further environmental loads (cf. Chapter “Special vulnerability based on demographic composition”, Dugord et al. 2014, Kim et al. 2014, SenStadtUm 2015d).The connection between thermal or heat load, air pollutants and health impacts is most frequently investigated on the basis of epidemiological studies. Epidemiology is a scientific discipline that deals with the causes and effects and the diffusion of health-related conditions and events in populations (Mücke et al. 2013). In time series analyses, data from environmental exposures and so-called health endpoints (e.g. disease, death) on the level of aggregated populations (instead of individuals) are taken as a basis, and changes in the strength of environmental influences and certain health effects are investigated using regression analyses in different temporal resolutions (mostly day or month). Possible perturbations, such as seasonal influences, temporal trends, meteorology and socio-economic status of the investigated population can also be taken into account. Since health impacts do not always manifest immediately after changes in the environmental influences, the observed temporal delay of the health impacts is also called a time lag or lag (Breitner et al. 2013). Time series analyses allow for including large numbers of cases and long time periods, and for high resolutions on the spatial level, which is especially relevant for intra-urban differentiations of environmental impacts on the urban population.However, connections between environmental exposures and health impacts can also be captured on the basis of persons or groups of persons, e.g. by means of case-control studies, cohort studies or by
27
surveying exposed persons regarding their health condition, performance and well-being. These study designs consider fewer case numbers but allow for a better control of confounding factors and for representing connections at the individual level.Table 3 shows an overview of studies that investigate the impacts of thermal load and air pollution on health in Berlin and specifies the data and the temporal and spatial resolutions used.
Tab. 3: Overview of studies investigating the impacts of thermal load and air pollution on health in Berlin (as of 2015, selection)
Authors and Title
Data Short description
Investigation period Variables Temporal
resolutionSpatial
resolution
Burkart et al. 2013: Interactive short-term effects of equivalent temperature and air pollution on human mortality in Berlin and Lisbon.
1998-2010
Deaths; all causes
Day
State of Berlin
Investigation of effects of heat, cold and air pollutants; calculation of mortality risks
Universal Thermal Climate Index (UTCI), calculated on the basis of meteorological parameters
DWD station Tempelhof
PM10, ozone
BLUME stations Neukölln, Wedding, Buch
Fenner et al. 2015: Inner-city air temperature as indicator of health-related loads in cities, using the example of Berlin (“Innerstädtische Lufttemperatur als Indikator gesundheitlicher Belastungen in Großstädten am Beispiel Berlins”).
2001-2010
Deaths; all causes; age groups (in total, 0-64, 65+)
Day
State of Berlin
Investigation of thermal effects dependent on climatic conditions differing within the city; quantification of excess mortalities on the basis of the heat-event-based risk model by Scherer et al. 2013
Air temperature
DWD stations Tegel, Tempelhof; Urban Climate Observation Network stations (TU Berlin) Dahlemer Feld, Dessauer Straße
Gabriel and Endlicher 2011: Urban and rural mortality rates during heat waves in Berlin and Brandenburg.
1990-2006
Deaths; all causes; age groups (< 50, > 50); gender
Day
State of Berlin; boroughs
Epidemiological study; investigation of thermal effects; calculation of heat-related excess mortalities
Meteorological parameters; perceived temperature
DWD stations Tempelhof, Dahlem
Land use (degree of imperviousness) Year State of Berlin
Jehn et al. 2013: Telemonitoring reduces exacerbation of COPD in the context of climate change--a randomized controlled trial.
June 1-August 31, 2012
Lung function, clinical status (CAT), 6-min walking test
Day
State of Berlin Clinical study with 62 COPD patients; investigation of thermal effects; telemedical study
Days of thermal load based on the air temperature
DWD station Tempelhof
Jehn et al. 2014: Heat Stress is Associated with Reduced Health Status in Pulmonary Arterial Hypertension: A Prospective Study Cohort.
April 1-September 30, 2011
Steps, symptom score
Day
State of Berlin Prospective cohort study with 15 PAH patients; investigation of thermal effects by means of activity and symptom monitorings
Days of thermal load based on the air temperature, humidity
DWD station Tempelhof
28

Scherber 2014: Impacts of thermal load and air pollution on fully inpatient admissions and deaths in hospitals during summer months in Berlin and Brandenburg (“Auswirkungen von Wärme- und Luftschadstoffbelastungen auf vollstationäre Patientenaufnahmen und Sterbefälle im Krankenhaus während Sommermonaten in Berlin und Brandenburg”).
1994-2010
Patient admissions and deaths in hospitals; all causes, RS, CVS; age groups (in total, 0-14, 15-44, 45-64, 65-74, 75+)
Day
State of Berlin
Investigation of thermal and air pollutant effects; spatial analyses; projections for heat-related morbidity and mortality
Universal Thermal Climate Index (UTCI), calculated on the basis of meteorological parameters
DWD stations Tempelhof, Tegel, Schönefeld
Ozone, PM10, NO2
BLUME stations Buch, Wedding, Neukölln
Scherber et al. 2014: Spatial analysis of hospital admissions for respiratory diseases during summer months in Berlin taking bioclimatic and socio-economic aspects into account.
2000-2009
Patient admissions in hospitals; RS; age group 65+
Month
Postcode areas
Spatial analysis of the risk for RS hospital admissions taking socio-economic factors and thermal load into account
Social index Year
Annual mean days of thermal load
Scherer et al. 2013: Quantification of heat-stress related mortality hazard, vulnerability and risk in Berlin.
2001-2010
Deaths; all causes; age groups (in total, 0 – 64, 65+)
Day, month
State of Berlin Investigation of thermal effects; quantification of excess mortalities on the basis of a heat-event-based risk modelAir temperature DWD station
Tempelhof
Schuster et al. 2014: Heat mortality in Berlin – Spatial variability at the neighbourhood scale.
2006-2010
Deaths; all causes
Month
Planning areas
Inner-city spatial analysis of heat-related excess mortality risksAir temperature; DWD
heat alerts
DWD stations Tempelhof, Tegel, Schönefeld
Turowski and Haase 1987: Meteoro-pathological study of the climate and weather dependency of mortality (“Meteoropathologische Untersuchung über die Klima- und Wetterabhängigkeit der Sterblichkeit”).
1958-1967
Deaths; differentiated according to causes, age groups, gender
Day, monthEast Berlin, inner and outer boroughs
Investigation of the weather influence; calculation of excess mortalities
Meteorological parameters
Abbreviations
RS: diseases of the respiratory system
BLUME: Berlin Air Quality Monitoring Network
CAT: COPD Assessment Test
COPD: chronic obstructive pulmonary disease
DWD: German Meteorological Service
CVS: diseases of the cardiovascular system
PAH: pulmonary arterial hypertension
Table 3: Overview table of studies investigating the impacts of thermal load and air pollution on health in Berlin (as of 2015, sample)
29

Urban climate and health in Berlin – an overview of research findingsAs early as in the 1980s, Turowski and Haase explored the question which bioclimatic impact factors influence the daily mortality, and they statistically analysed death certificates, including from East Berlin, for the period of 1958-1967 with respect to the influence of climate and weather. The study showed that a higher mortality in the summer half-year was accompanied by higher values of air temperature, humidity and global radiation. The mortality due to diseases of the cardiovascular system was significantly higher in the case of above-average air temperatures in summer in East Berlin (up to 10% deviation from the expected value). For the mortality due to diseases of the respiratory system, the deviation from the expected value was up to 45 %. Using the example of the common cold affecting children in Berlin, a heat island effect could be detected. Children living in the inner city were significantly more frequently affected by the common cold in summer in case of above-average air temperatures, whereas these effects did not show for the outer boroughs (Turowski 1998, Turowski and Haase 1987).By using data on the total mortality (all causes) and meteorological parameters in day resolution, Gabriel was able to illustrate for the investigation period of 1990-2006 that in Berlin and Brandenburg mainly the elderly (> 50-year-olds) and especially women exhibit a higher heat vulnerability. In the investigation period, the mortality rates were higher during the heat waves (up to 67 % in the summer of 1994 in the Berlin city centre), and a connection between mortality rates and the density of urban structures within Berlin could be detected. The mortality rates increased with the density of urban structures (Gabriel 2009, Gabriel and Endlicher 2011).For the investigation period of 1998-2010, Burkart et al. showed in a statistical assessment of total mortality, weather and air quality data in day resolution that in Berlin the mortality risk increases with increasing thermal load, and high ozone and fine particulate matter (PM10) concentrations are linked with a higher heat-related mortality (Burkart et al. 2013). As air temperature and air pollution are often closely linked, the study also investigated possible interactions between the thermal load (determined via the Universal Thermal Climate Index) and the ozone and PM10 concentrations, on the one hand, and their influence on mortality, on the other hand. The result shows that the mortality greatly increases under conditions of high thermal and ozone load (cf. Figure 23). These interaction effects are less pronounced for PM10 (cf. Figure 24).
Fig. 23: Connection between thermal load (Universal Thermal Climate Index (UTCI), 2-day mean) and ozone (2-day mean) as well as the total mortality (logarithmised relative risk) in Berlin. The bivariate response surface model has been adapted for trend, year and day of the week. A logarithmised relative risk of 0.2 corresponds to 22% more deaths (Burkart et al. 2013)
30

Fig. 24: Connection between thermal load (Universal Thermal Climate Index (UTCI), 2-day mean) and ozone (2-day mean) as well as the total mortality (logarithmised relative risk) in Berlin. The bivariate response surface model has been adapted for trend, year and day of the week. A logarithmised relative risk of 0.2 corresponds to 22% more deaths (Burkart et al., 2013)
Scherer et al. also used data regarding the total mortality (all causes) in order to quantify the mortality in Berlin connected to the thermal load using a heat-event-based risk model. The model identifies heat events based on air temperature data in day resolution. A heat event is defined as a series of at least three consecutive days on which the air temperature exceeds a certain threshold value. The study shows that approx. 5% of all deaths in Berlin between 2001 and 2010 are statistically correlated with increased air temperatures. The persons affected are usually 65 years or older, whereas the connection between increased air temperatures and mortality is statistically not very pronounced in the case of younger persons. The best results were achieved based on daily mean values of the air temperature and when the threshold value of 21 °C was exceeded (cf. Figure 25). On the basis of spatially distributed data, the risk analysis would also be able to take spatial variations of the urban climate and demographic characteristics into account (Scherer et al. 2013).
31

Fig. 25: Total mortality (all causes), represented as deaths per 1 million inhabitants per day, and daily mean temperatures in the period of 2001-2010. The blue/red line represents the best fit line for the days with low/high air temperatures. The intersection of these lines marks the mean minimum of the mortality rate (21.5 deaths per 1 million inhabitants per day) under conditions of a daily mean temperature of 21 °C (Scherer et al. 2015)
The highest so-called excess mortalities, which are understood as heat-related additional mortality (in addition to the base rate of the total mortality) and represent a statistically calculated value, were determined for the years 2006 and 2010 using the heat-event-based risk model by Scherer et al. (2013) (cf. Tab. 4). The studies by Gabriel and Endlicher (2011), Scherber (2014) and Schuster et al. (2014) also show an increased mortality in the particularly hot summers of 2006 and 2010 in Berlin.
Year N (1/a) Days (d/a) Rate (10-6/d) Deaths (P/a)
2001 4 21 6,2 8442002 4 27 6,1 9622003 3 30 6,1 9012004 2 13 5,6 3892005 5 21 4,9 7542006 6 39 7,0 13012007 3 18 5,5 6042008 3 18 5,4 5442009 5 22 2,7 4122010 5 27 7,4 1154
Tab. 4: Annual overview regarding the heat-related excess mortality based on the heat-event-based risk model by Scherer et al. (2013). The number of heat waves (heat events) per year (N), the sum of heat wave days per year (days), the mean daily rate of the excess mortality (rate) and the number of excess deaths per year are listed (Scherer et al. 2015)
Fenner at al. investigated for the period of 2001-2010 in Berlin to what extent the climatic conditions within densely developed areas differ from conditions in open spaces and outside of the developed
32

urban areas and what effect these conditions have on the mortality risk. The mortality risk (total mortality) was determined with the heat-event-based risk model by Scherer et al. (2013), and the climatological threshold days “hot day” (daily maximum temperature ≥ 30 °C) and “tropical night” (daily minimum temperature ≥ 20 °C) were calculated for the purpose of identifying heat.While the number of hot days is similar at the four different measurement stations, tropical nights are significantly more frequent within the dense development structure than in open spaces (cf. Figure 26).
Fig. 26: Representation of the number of (a) hot days (Tmax ≥ 30 °C) and (b) tropical nights (Tmin ≥ 20 °C) per year for selected measurement stations in Berlin in the period of 2001-2010. The dashed coloured lines show the arithmetic mean value of the years 2001-2010 of the respective station. The black hatching shows the number of days on which hot days and tropical nights occurred in combination. Stations: DAHF - Dahlemer Feld, DESS - Dessauer Straße, TGL - Berlin-Tegel, THF - Berlin-Tempelhof. In August 2004, there were measurement failures at the DAHF station. The DAHF and DESS stations are part of the Urban Climate Observation Network of the Chair of Climatology, Ecology Department, Technical University Berlin. The TGL and THF stations are operated by the German Meteorological Service (Fenner et al. 2015)
It becomes clear at all four stations that the majority of the tropical nights occur in combination with hot days (hatching in Fig. 26). From a bioclimatic point of view, these are extremely problematic situations in which people are not only exposed to great heat outdoors during daytime but in which the body can also be subjected to high air temperature in the night hours. For the measurement stations Dessauer Straße (dense development) and Tempelhof (open space), the heat-related additional deaths show that approx. 4-5 % of deaths in the investigation period can be statistically linked with heat events (Fenner et al. 2015).Deaths are the most serious consequence of environmental impacts. It can be assumed that under extreme environmental conditions even otherwise healthy people are impaired regarding performance and well-being, and that people with a disease-related lack of adaptation capacity react with a deterioration in their condition even to small external perturbations (Laschewski, 2008). In order to establish adequate preventive measures and avoid heat-related deaths, it is important to conduct studies regarding the impacts of thermal load already at the level of health indicators, e.g. cases of disease or treatment or physiological parameters (e.g. physical activity, lung function).In the summers of 2011 and 2012 in Berlin, clinical studies at the Charité Berlin (Department of Pneumatological Oncology) investigated to what extent thermal load impacts on patients with chronic obstructive pulmonary disease (COPD) or with pulmonary arterial hypertension (PAH) (Jehn et al. 2013, 2014). For this purpose, the lung function, clinical status and physical activity of the patients were determined and assessed depending on the air temperature and the thermal load. The results show that thermal load worsens the patients' symptoms, yet there are possibilities of reacting to the deteriorations at an early stage, e.g. through telemedical care for the patients (Jehn et al. 2013).An epidemiological study for the period of 1994-2010 in Berlin investigating the connections between thermal load and air pollution and patient admissions as well as deaths in hospitals has shown that the relative risk for both mortality (deaths) and morbidity (patient admissions) increases from a heavy thermal load onwards (UTCImax = 32 °C) and that particularly elderly people and the chronically ill suffer from heat stress (Scherber 2014). This risk increase is more pronounced for the mortality than
33

for the morbidity. However, it must be taken into account that the case counts for patient admissions are several times higher than for deaths. Besides the cardio-vascular diseases and the totality of all diseases, the diseases of the respiratory system showed the strongest effects of thermal load. Thermal load impacts on both the cardio-vascular system and the respiratory system. The respiratory system is further strained by additional air pollution effects and concomitant diseases (Michelozzi et al. 2009, Schneider et al. 2011). In the investigation of the air pollution effects, fine particulate matter (PM10) has shown the strongest associations, especially for patient admissions and deaths in hospitals with the diagnosis of diseases of the respiratory system (Scherber 2014).With respect to an increase of the thermal load in Berlin related to climate change (SenStadtUm 2015a), the question arises how thermal load effects could impact on patient admissions and deaths in the close future.Assuming mean population prognoses (SenStadtUm/AfS 2012) and air temperature scenarios for the daily maximum (STAR2 projections, 2 K scenario, realisation 50) until 2030, an increase in patient admissions and deaths in hospitals could be determined for the summer months for Berlin (Scherber 2014). The increase is most pronounced for ≥ 65-year-olds and diseases of the cardio-vascular system (cf. Tab. 5).
Diagnosis 2001-2010 2021-2030 DifferenceCVS PA 242 265 +23 (+9 %)CVS PA 65+ 197 265 +68 (+34 %)CVS D 14 15 +1 (+7 %)RS PA 98 108 +10 (+10 %)RS PA 65+ 41 55 +14 (+34 %)RS D 6 7 +1 (+16 %)
Tab. 5: Expected cases on day basis for fully inpatient admissions (PA) of the total of all age groups and for ≥ 65-year-olds as well as deaths (D) in hospitals for diseases of the cardiovascular (CVS) and respiratory system (RS) in Berlin in the mean of the summer periods (June-September) of 2001-2010 and 2021-2030, taking the influence factors population prognosis, air temperature projections and air temperature effects into account (Scherber 2014)
As big cities such as Berlin have an inner-city mosaic with respect to urban, population and social structures, health impacts of the thermal load can also exhibit spatial differences.Spatial epidemiological analyses are thus an important approach for identifying urban areas with increased health risks towards thermal load, especially with respect to the development of specific intervention and prevention strategies in the health system and also, in the long run, for taking them into account in urban planning. For Berlin, deaths and patient admissions in association with thermal load were therefore also investigated with spatial differentiation (Gabriel and Endlicher 2011, Scherber et al. 2014, Schuster et al. 2014).Schuster et al. considered the total mortality (all causes) for a spatial analysis of heat-related excess mortality at the level of the planning areas (SenStadt 2009) in the investigation period of 2006-2010 for Berlin. The heat-related excess mortality was calculated using the ratio of the total mortality in the hot months of July 2006 and 2010 to the total mortality in the rather cool months of July 2007-2009, which exhibited the lowest monthly means of the daily air temperature maximum in the investigation period (cf. Fig. 27).
34

Fig. 27: Ratio of the monthly mean of the daily maximum of the air temperature (meteorological stations Tegel, Tempelhof, Schönefeld) to the monthly sum of the deaths (all causes) in Berlin for the month of July in the period of 2001-2010 (Schuster et al. 2014)
The excess mortality calculation was age-standardised, in order to exclude influences of different age characteristics of the population in individual planning areas (PLAs). The result shows an intra-urban variability of the heat-related excess mortality, expressed via the relative risk (RR) (cf. Figure 28).
Fig. 28: Spatial pattern of the age-standardised heat-related excess mortality, calculated as relative risk (hot Julys of 2006 and 2010 compared to the cooler Julys of 2007-2009). Values greater than 1 indicate an increased risk. A value of 1.5 means that the risk in the respective planning area (PLA) is 1.5 times higher in proportion to the average of the relative risk of all PLAs (Schuster et al. 2014)
Planning areas with a higher or lower relative risk were relatively evenly distributed across the city area. An increased relative risk (RR > 1) was determined for more than two thirds of the planning
35
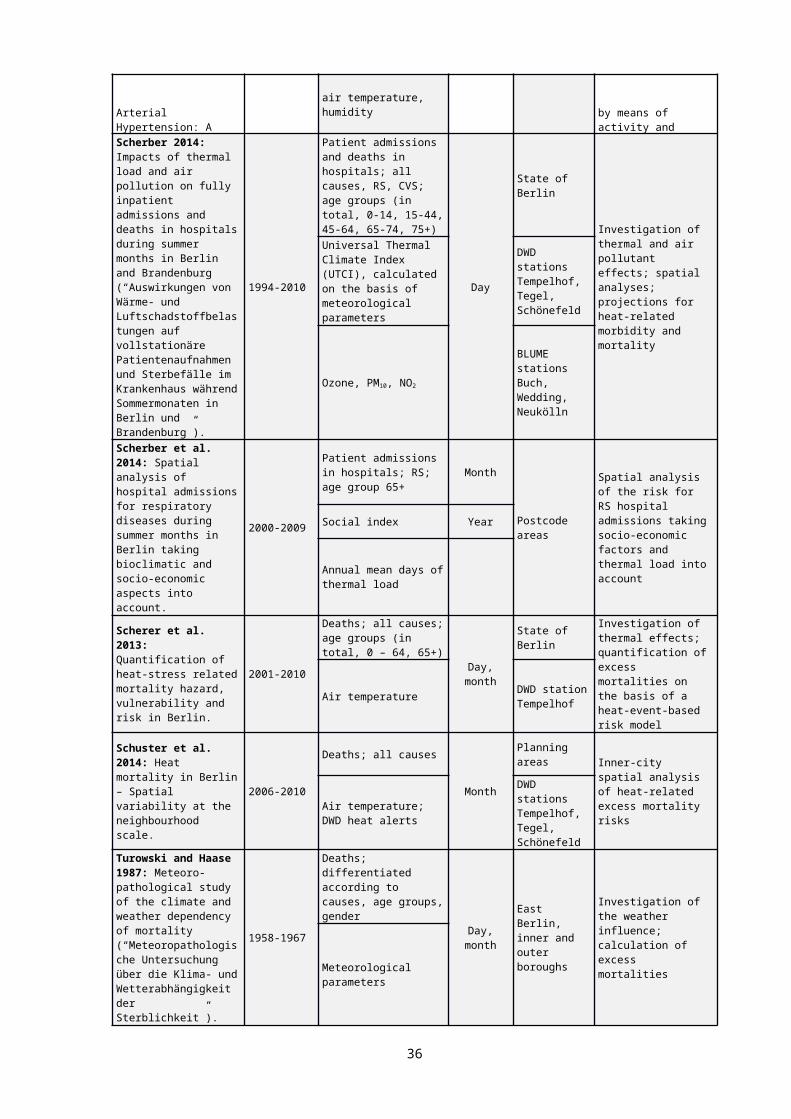
areas, in which a total of 2.26 million out of 3.35 million inhabitants live (as of December 31, 2007). A general mortality gradient from the centre to the outskirts, corresponding to the urban heat island effect, could not be observed. Planning areas with a high relative risk were located both inside and outside of the inner city ring. Planning areas with the highest relative risks (RR > 4) were identified in the borough of Neukölln (PLA Rollberg) but also in outlying areas (PLA Döberitzer Weg, PLA Bucher Forst, PLA Schlangenbader Str.) (Schuster et al. 2014).If all diagnoses and age groups are included, spatial manifestations of heat-related mortality risks for Berlin show no clear links between densely built-up urban areas and increased health risks. A differentiated look at groups of persons vulnerable to heat yields a different picture.On the basis of postcode areas, relative risks for patient admissions and deaths in hospitals during the summer months in the period of 2000 - 2009 were correlated with spatially resolved data on thermal load (SenStadtUm 2010b) (Scherber 2014). A significant weakly positive connection could be identified between the mean thermal load and the relative risks for patient admissions with diseases of the respiratory system for ≥ 65-year-olds at the postcode level (patients' places of residence) (Scherber et al. 2014). The different population shares of the ≥ 65-year-olds in the postcode areas were not taken into consideration. Since diseases of the respiratory system and an age above 65 are among the risk factors towards thermal load, these groups are particularly relevant. In a search for spatial clusters with increased relative risks (as a risk rate) for patient admissions with diseases of the respiratory system affecting ≥ 65-year-olds, five significant clusters could be identified (cf. Fig. 29). Within these clusters, the following places of residence of the patients exhibit the highest relative risks (RR > 1.5): the districts Gesundbrunnen, Mitte, Moabit, Tiergarten and Wedding in the borough Mitte and the district Neukölln in the borough Neukölln. These urban areas exhibit both high densities of development and high thermal loads in summer, and at the same time they have socio-economic conditions detrimental to health (SenGUV 2011, SenStadtUm 2015d).
36

Fig. 29: Relative risks for patient admissions in hospitals for ≥ 65-year-olds with diseases of the respiratory system during the summer months of 2000-2009 in Berlin for the patients' places of residence (postcode areas). The red dots indicate the significant clusters with increased risk. Values greater than 1 indicate an increased risk. A value of 1.5 means that the risk in the corresponding cluster is 1.5 times higher than outside of the cluster. In addition, the risks of the postcode areas within the clusters are shown in quartiles (Scherber et al. 2014)
Literature[1] BMU (Bundesministerium für Umwelt, Naturschutz und Reaktorsicherheit) [Federal
Ministry for the Environment, Nature Conservation and Nuclear Safety] (ed.) 2011:Klimawandel, Extremwetterereignisse und Gesundheit [Climate Change, Extreme Weather Events and Public Health]. Conference Report on the International Symposium November 29 and 30, 2010 in Bonn, Bonn.Internet: http://www.bmub.bund.de/fileadmin/Daten_BMU/Pools/Broschueren/klimawandel_extremwetter_konferenzbericht_bf.pdf(accessed on February, 19, 2018)
[2] Böhme, C., Bunge, C., Bunzel, A., Preuß, T. 2013: Umweltgerechtigkeit im städtischen Raum - Zwischenergebnisse eines Forschungsvorhabens [Environmental justice in the urban space - intermediate results of a research project], Umwelt und Mensch - Informationsdienst (UMID) [Environment and Humans - Information Service], Vol. 1, 35-41. Internet: https://www.umweltbundesamt.de/sites/default/files/medien/419/publikationen/umweltgerechtigkeit_im_staedtischen_raum.pdf(accessed January 8, 2016)
[3] Breitner, S., Schneider, A., Peters, A. 2013: Thermische Belastung, Feinstaub und Ozon – Gesundheitliche Auswirkungen und mögliche Wechselwirkungen [Thermal load, fine particulate matter and ozone – health impacts and
37

possible interactions]. In: Jahn, H.J., Krämer, A. and Wörmann, T. (eds.), Klimawandel und Gesundheit. Internationale, nationale und regionale Herausforderungen [Climate Change and Health. International, national and regional challenges]. Berlin, Heidelberg, 39-62.
[4] Burkart, K., Canário, P., Scherber, K., Breitner, S., Schneider, A., Alcoforado, M. J., Endlicher, W. 2013: Interactive short-term effects of equivalent temperature and air pollution on human mortality in Berlin and Lisbon, Environmental Pollution, Vol. 183, 54-63.
[5] Dugord, P.-A., Lauf, S., Schuster, C., Kleinschmit B. 2014: Land use patterns, temperature distribution, and potential heat stress risk – The case study Berlin, Germany. Computers, Environment and Urban Systems, 48, 86–98.
[6] Eis, D., Helm, D., Laußmann, D., Stark, K. 2010: Klimawandel und Gesundheit - Ein Sachstandsbericht [Climate change and health - an assessment report], Robert Koch-Institut (ed.), Berlin. Internet:http://www.rki.de/DE/Content/Gesund/Umwelteinfluesse/Klimawandel/Klimawandel-Gesundheit-Sachstandsbericht.pdf?__blob=publicationFile(accessed January 1, 2016)
[7] Fenner, D., Meier, F., Scherer, D., Polze, A. 2014: Spatial and temporal air temperature variability in Berlin, Germany, during the years 2001-2010. Urban Climate 10 (2), 308–331.
[8] Fenner, D., Mücke, H.-G., Scherer, D. 2015: Innerstädtische Lufttemperatur als Indikator gesundheitlicher Belastungen in Großstädten am Beispiel Berlins [Inner-city air temperature as indicator of health-related loads in cities, using the example of Berlin]. Umwelt und Mensch - Informationsdienst (UMID) [Environment and Humans - Information Service], Vol. 1, 30-38. Internet:https://www.umweltbundesamt.de/sites/default/files/medien/378/publikationen/innerstaedtische_lufttemperatur_30-38.pdf(accessed January 8, 2016)
[9] Gabriel, K. 2009: Gesundheitsrisiken durch Wärmebelastung in Ballungsräumen. Eine Analyse von Hitzewellen-Ereignissen hinsichtlich der Mortalität im Raum Berlin-Brandenburg, Dissertation, Geographisches Institut, Humboldt-Universität zu Berlin [Health risks through thermal load in metropolitan areas. An analysis of heat-wave events with respect to mortality in the Berlin-Brandenburg area, dissertation, Geographical Institute, Humboldt University of Berlin], Berlin. Internet:http://edoc.hu-berlin.de/dissertationen/gabriel-katharina-2009-11-20/PDF/gabriel.pdf(accessed January 8, 2016)
[10] Gabriel, K., Endlicher, W. 2011: Urban and rural mortality rates during heat waves in Berlin and Brandenburg, Germany, Environmental Pollution, Vol. 159, 2044-2055.
[11] Jehn, M., Gebhardt, A., Liebers, U., Kiran, B., Scherer, D., Endlicher, W., Witt, C. 2014:Heat Stress is Associated with Reduced Health Status in Pulmonary Arterial Hypertension: A Prospective Study Cohort. Lung, 1-6.
[12] Jehn, M., Donaldson, G., Kiran, B., Liebers, U., Mueller, K., Scherer, D., Endlicher, W., Witt, C. 2013: Telemonitoring reduces exacerbation of COPD in the context of climate change--a randomized controlled trial, Environmental Health: A Global Access Science Source, 12(1), 99.
[13] Jendritzky G. 2007:Folgen des Klimawandels für die Gesundheit [Consequences of climate change for health]. In: Endlicher W., Gerstengarbe F.-W. (eds.): Der Klimawandel – Einblicke, Rückblicke und Ausbli-cke [Climate change – insights, restrospectives and prospects]. Potsdam-Institut für Klimafolgenforschung e.V. [Potsdam Institute for Climate Impact Research], Potsdam: 108–118.
[14] Jendritzky, G., Bröde, P., Fiala, D., Havenith, G., Weihs, P., Batchvarova, E., DeDear, R. 2009: Der Thermische Klimaindex UTCI, Klimastatusbericht Deutscher Wetterdienst [The Thermal Climate Index UTCI, climate status report German Meteorological Service], 96-101.
38

Internet:https://www.dwd.de/DE/leistungen/klimastatusbericht/publikationen/ksb2009_pdf/artikel11.pdf?__blob=publicationFile&v=1(accessed January 8, 2016)
[15] Kim, K. R., Yi, C., Lee, J.-S., Meier, F., Jänicke, B., Fehrenbach, U., Scherer, D. 2014:BioCAS: Biometeorological Climate impact Assessment System for building-scale impact assessment of heat-stress related mortality. Die Erde [The Earth], 145(1), 62–79.Internet:http://www.die-erde.org/index.php/die-erde/article/view/118/78(accessed January 8, 2016)
[16] Koppe, C. 2005: Gesundheitsrelevante Bewertung von thermischer Belastung unter Berücksichtigung der kurzfristigen Anpassung der Bevölkerung an die lokalen Witterungsverhältnisse, Dissertation, Albert-Ludwigs-Universität [Health-relevant assessment of thermal load taking the short-term adaptation of the population to the local weather conditions into account], Freiburg i. Brsg.. Internet:https://www.freidok.uni-freiburg.de/data/1802(accessed January 8, 2016)
[17] Koppe, C., Kovats, S., Jendritzky, G., Menne, B. 2004: Heat-waves: risks and responses, WHO Europe (ed.), Copenhagen.Internet: http://www.euro.who.int/__data/assets/pdf_file/0008/96965/E82629.pdf(accessed January 8, 2016)
[18] Kuttler, W. 1998: Stadtklima [Urban climate]. In: Sukopp, H., Wittig, R. (eds.), Stadtökologie. Ein Fachbuch für Studium und Praxis. [Urban ecology. A reference book for study and practice.] Stuttgart, Jena, Lübeck, Ulm, 125-167.
[19] Landesamt für Gesundheit und Soziales (LAGeSo) [State office for health and social affairs] (ed.) 2014: Verzeichnis der Krankenhäuser und Privatentbindungsanstalten [Directory of the hospitals and private maternity clinics], as of 06/2014, Berlin.Internet:http://www.berlin.de/lageso/service/downloadcenter/(accessed: November 26, 2015)
[20] Landesvermessung und Geobasisinformation Brandenburg (LGB) [Brandenburg State Office of Surveying and Geo-Base Information] 2013:Amtliches Liegenschaftskatasterinformationssystem (ALKIS) [official property cadastre information system], Potsdam.Internet:https://www.geobasis-bb.de/geodaten/alk-vektor.html(accessed on February, 19, 2018)
[21] Landesvermessung und Geobasisinformation Brandenburg (LGB) [Brandenburg State Office of Surveying and Geo-Base Information] 2013a:Digitales Geländemodell (DGM) [Digital Terrain Model], Potsdam.Internet:https://www.geobasis-bb.de/geodaten/dgm_allg.html(accessed on February, 19, 2018)
[22] Laschewski, G. 2008: Das Humanbioklima: Wirkungen und Wandel. [The human bioclimate: effects and change.] In: Lozán, J.L., Graßl, H., Jendritzky, G., Karbe, L., Reise, K. and Maier, W.A. (eds.), Warnsignal Klima: Gesundheitsrisiken. Gefahren für Menschen, Tiere und Pflanzen. [Alarm signal climate: Health risks. Threats to humans, animals and plants.] Hamburg, 35-43.
[23] Michelozzi, P., Accetta, G., De Sario, M., D'Ippoliti, D., Marino, C., Baccini, M., Biggeri, A., Anderson, H. R., Katsouyanni, K., Ballester, F., Bisanti, L., Cadum, E., Forsberg, B., Forastiere, F., Goodman, P. G., Hojs, A., Kirchmayer, U., Medina, S., Paldy, A., Schindler, C., Sunyer, J., Perucci, C. A., PHEWE Collaborative Grp 2009: High Temperature and Hospitalizations for Cardiovascular and Respiratory Causes in 12
39

European Cities, American Journal of Respiratory and Critical Care Medicine, Vol. 179, 5, 383-389.
[24] Mücke, H.-G., Straff, W., Faber, M., Haftenberger, M., Laußmann, D., Scheidt-Nave, C., Stark, K. 2013: Klimawandel und Gesundheit. Allgemeiner Rahmen zu Handlungsempfehlungen für Behörden und weitere Akteure in Deutschland. [Climate change and health. General framework for action recommendations for authorities and further actors in Germany.] Robert-Koch-Institut, Umweltbundesamt [Robert Koch Institute, Federal Environment Agency] (eds.), Berlin.Internet:https://www.rki.de/DE/Content/Kommissionen/UmweltKommission/Stellungnahmen_Berichte/Downloads/klimawandel_gesundheit_handlungsempfehlungen_2013.pdf?__blob=publicationFile(accessed on February, 19, 2018)
[25] MUNLV (Ministerium für Umwelt und Naturschutz, Landwirtschaft und Verbraucherschutz des Landes Nordrhein-Westfalen) [Ministry for the Environment and Nature Conservation, Agriculture and Consumer Protection of the State of North Rhine-Westphalia] (ed.) 2010:Handbuch Stadtklima. Maßnahmen und Handlungskonzepte für Städte und Ballungsräume zur Anpassung an den Klimawandel [Urban climate handbook. Measures and action concepts for cities and metropolitan areas for adaptation to climate change].Internet: https://www.umwelt.nrw.de/fileadmin/redaktion/PDFs/klima/handbuch_stadtklima_kurzfassung.pdf (accessed November 26, 2015)
[26] MVI (Ministerium für Verkehr und Infrastruktur Baden-Württemberg) [Ministry of Transport and Infrastructure of Baden-Württemberg] (ed.) 2012:Städtebauliche Klimafibel. Hinweise für die Bauleitplanung [Urban development climate handbook. Suggestions for urban land-use planning].
[27] Scherber, K. 2014:Auswirkungen von Wärme- und Luftschadstoffbelastungen auf vollstationäre Patientenaufnahmen und Sterbefälle im Krankenhaus während Sommermonaten in Berlin und Brandenburg [Impacts of thermal load and air pollution on fully inpatient admissions and deaths in hospitals during summer months in Berlin and Brandenburg]. Dissertation, Geographisches Institut, Humboldt-Universität zu Berlin [Dissertation, Geographical Institute, Humboldt University of Berlin], Berlin. Internet: http://edoc.hu-berlin.de/dissertationen/scherber-katharina-2014-06-13/PDF/scherber.pdf (accessed January 8, 2016)
[28] Scherber, K., Langner, M., Endlicher, W. 2014: Spatial analysis of hospital admissions for respiratory diseases during summer months in Berlin taking bioclimatic and socio-economic aspects into account, Die Erde [The Earth], 144 (3), 217-237.Internet:http://www.die-erde.org/index.php/die-erde/article/view/63/pdf_2(accessed January 8, 2016)
[29] Scherber, K. 2016:Stadtklima und Gesundheit, Beitrag zum Begleittext zur Umweltatlaskarte 04.11 (Ausgabe 2016) [Urban Climate and Health, contribution to the text accompanying Map 04.11 (Edition 2016) of the Environmental Atlas], on behalf of the Senate Department for Urban Development and the Environment, Berlin.Internet: http://www.stadtentwicklung.berlin.de/umwelt/umweltatlas/ib411.htm(accessed January 25, 2016)
[30] Scherer, D. 2007:Viele kleine Parks verbessern Stadtklima. Mit Stadtplanung Klima optimieren. TASPO Report Die grüne Stadt [Many small parks improve urban climate. Optimising climate with urban planning. TASPO Report The green city], 15.
[31] Scherer, D., Fehrenbach, U., Lakes, T., Lauf, S., Meier, F., Schuster, C. 2013: Quantification of heat-stress related mortality hazard, vulnerability and risk in Berlin, Germany. Die Erde [The Earth], 144 (3-4), 238-259.
40

Internet:http://www.die-erde.org/index.php/die-erde/article/view/49/pdf_3(accessed January 8, 2016)
[32] Scherer, D., Fehrenbach, U., Fenner, D., Jänicke, B., Holtmann, A., Meier, F., 2015:© Fachgebiet Klimatologie, Institut für Ökologie, Technische Universität Berlin [Chair of Climatology, Department of Ecology, Technical University Berlin], Rothenburgstr. 12, 12165 Berlin.Internet:https://www.klima.tu-berlin.de/(accessed February 15, 2018)
[33] Schneider, A., Breitner, S., Brüske, I., Wolf, K., Rückerl, R., Peters, A. 2011: Health Effects of Air Pollution and Air Temperature. In: Krämer, A., Khan, M.H. and Kraas, F. (eds.), Health in Megacities and Urban Areas, Heidelberg, 119-134.
[34] Schneider, A., Breitner, S., Wolf, K., Hampel, R., Peters, A., Wichmann, H.-E. 2009:Ursachenspezifische Mortalität, Herzinfarkt und das Auftreten von Beschwerden bei Herzinfarktüberlebenden in Abhängigkeit von der Lufttemperatur in Bayern (MOHIT), Helmholtz Zentrum München – Deutsches Forschungszentrum für Gesundheit und Umwelt, Institut für Epidemiologie [Cause-specific mortality, heart attack and the occurrence of medical conditions in heart attack survivors in dependence on the air temperature in Bavaria (MOHIT), Helmholtz Centre Munich – German Research Centre for Health and the Environment, Institute of Epidemiology] (ed.), München.Internet:https://www.helmholtz-muenchen.de/fileadmin/EPI_II/PDF/Schlussbericht_Endfassung_MOHIT_Dec2009.pdf(accessed January 8, 2016)
[35] Schuster, C., Burkart, K., Lakes T. 2014: Heat mortality in Berlin – Spatial variability at the neighborhood scale. Urban Climate, 10 (1), 134-147.Internet:https://www.sciencedirect.com/science/article/pii/S2212095514000807(accessed on February, 19, 2018)
[36] SenGUV (Senate Department for Health, Environment and Consumer Protection) (ed.) 2011: Basisbericht 2010/2011. Gesundheitsberichterstattung Berlin, Daten des Gesundheits- und Sozialwesens [Basic report 2010/2011. Berlin Health reporting, data of the health and social sectors], Berlin.Internet:https://www.berlin.de/sen/gessoz/gesundheits-und-sozialberichterstattung/gesundheitsberichterstattung-epidemiologie/basisberichte/(accessed January 8, 2016)
[37] SenStadt (Senate Department for Urban Development) (ed.) 2009: Lebensweltlich orientierte Räume (LOR) in Berlin [Living environment areas (LEAs) in Berlin].Internet:http://www.stadtentwicklung.berlin.de/planen/basisdaten_stadtentwicklung/lor/(accessed January 8, 2016)
[38] SenStadt (Senate Department for Urban Development Berlin) (ed.) 2010:Flächennutzung und Stadtstruktur - Dokumentation der Kartiereinheiten und Aktualisierung des Datenbestandes [Land use and urban structure - documentation of the mapping units and update of the data base], Berlin.Internet:http://www.stadtentwicklung.berlin.de/umwelt/umweltatlas/download/Nutzungen_Stadtstruktur_2010.pdf(accessed November 26, 2015)
41

[39] SenStadtUm (Senate Department for Urban Development and the Environment Berlin) (ed.) 2011: Stadtentwicklungsplan Klima [Urban Development Plan Climate]. Internet: http://www.stadtentwicklung.berlin.de/planen/stadtentwicklungsplanung/de/klima/ (accessed October 26, 2015)
[40] SenStadtUm (Senate Department for Urban Development and the Environment Berlin) (ed.) 2013:Weniger Schadstoffe. Mehr Lebensqualität. Der Luftreinhalteplan 2011-2017 des Landes Berlin [Less pollution. More quality of life. The Clean Air Plan of the State of Berlin].Internet: http://www.berlin.de/senuvk/umwelt/luftqualitaet/de/luftreinhalteplan/ (accessed: February 15, 2018)
[41] SenStadtUm (Senate Department for Urban Development and the Environment Berlin) (ed.) 2015:Planungshinweiskarte Stadtklima 2015 - Begleitdokument zur Online-Version [Planning Advices Urban Climate Map 2015 - document accompanying the online version], Berlin.Internet:http://www.stadtentwicklung.berlin.de/umwelt/umweltatlas/download/Planungshinweise_StadtklimaBerlin_2015.pdf(accessed November 26, 2015)
[42] SenStadtUm (Senate Department for Urban Development and the Environment Berlin) (ed.) 2015b:GEO-NET Umweltconsulting GmbH, Hannover: GIS-gestützte Modellierung von stadtklimatisch relevanten Kenngrößen auf der Basis hochaufgelöster Gebäude- und Vegetationsdaten; EFRE Projekt 027 Stadtklima Berlin, Abschlussbericht [GIS-based modelling of parameters relevant to urban climate on the basis of high-resolution data on buildings and vegetation; ERDF Project 027 Urban Climate Berlin, final report].Internet:http://www.stadtentwicklung.berlin.de/umwelt/umweltatlas/download/Projektbericht_StadtklimaBerlin_SenStadtUm_IIID_2015.pdf(accessed January 7, 2016)
[43] SenStadtUm (Senate Department for Urban Development and the Environment Berlin) (ed.) 2015e:PRISMA – Planungsraumbezogenes Informationssystem für Monitoring und Analyse [Planning-area Related Information System for Monitoring and Analysis], Berlin.Internet:http://www.stadtentwicklung.berlin.de/soziale_stadt/sozialraumorientierung/de/prisma.shtml(accessed November 26, 2015)
[44] SenStadtUm (Senate Department for Urban Development and the Environment Berlin) (ed.) 2016:Anpassungskonzept an die Folgen des Klimawandels (AFOK) [Concept for Adaptation to the Impacts of Climate Change], Berlin.Internet:http://www.berlin.de/senuvk/klimaschutz/klimawandel/de/anpassungskonzept_berlin/index.shtml(accessed February 15, 2018)
[45] SenStadtUm/AfS (Senate Department for Urban Development and the Environment, Statistical Office for Berlin-Brandenburg) (eds.) 2012: Bevölkerungsprognose für Berlin und die Bezirke 2011-2030, Kurzfassung [Population prognosis for Berlin and the boroughs 2011-2030, synopsis], Berlin.Internet: http://www.stadtentwicklung.berlin.de/planen/bevoelkerungsprognose/download/bevprog_2011_2030_kurzfassung.pdf(accessed on February, 19, 2018)
42

[46] Statistik BBB 2014:Amt für Statistik Berlin-Brandenburg [Statistical Office for Berlin-Brandenburg]: 'Melderechtlich registrierte Einwohnerinnen und Einwohner am Ort der Hauptwohnung am 30.06.2014' [‘Legally registered inhabitants at the primary place of residence on June 30, 2014’].Internet: https://www.statistik-berlin-brandenburg.de/Publikationen/OTab/2014/OT_A08-01-00_192_201401_BE.pdf(accessed May 31, 2016)
[47] Turowski, E., Haase, C. 1987: Meteoropathologische Untersuchung über die Klima- und Wetterabhängigkeit der Sterblichkeit, Dissertation, Humboldt-Universität zu Berlin [Meteoro-pathological study of the climate and weather dependency of mortality, dissertation, Humboldt University of Berlin], Berlin.
[48] Turowski, E. 1998: Klima- und Wettereinfluss [Climate and weather influence]. In: Moriske, H.-J. and Turowski, E. (eds.), Handbuch für Bioklima und Lufthygiene. Mensch, Wetter, Klima, Innenraum- und Außenlufthygiene, Grundlagen, Forschungsergebnisse, Trends [Handbook for bioclimate and air hygiene. Humans, weather, climate, indoors and outdoors air hygiene, fundamentals, research results, trends], II-4, Landsberg am Lech, 1-44.
[49] VDI (Verband Deutscher Ingenieure) [Association of German Engineers] 2015:Richtlinie 3787, Blatt 1 Umweltmeteorologie - Klima- und Lufthygienekarten für Städte und Regionen [Guideline 3787, Leaf 1 Environmental Meteorology - climate and air hygiene maps for cities and regions]. Internet:https://www.vdi.de/richtlinie/vdi_3787_blatt_1-umweltmeteorologie_klima_und_lufthygienekarten_fuer_staedte_und_regionen/(accessed November 26, 2015)
[50] Wichert von, P. 2004: Hitzefolgekrankheiten: Bericht zu einer Stellungnahme der Kommission „Hitzetote“ der Arbeitsgemeinschaft der Wissenschaftlichen Medizinischen Fachgesellschaften (AWMF), Epidemiologisches Bulletin [Illnesses resulting from heat: Report on an opinion of the “heat deaths” commission of the Association of the Scientific Medical Societies, Epidemiological Bulletin], Vol. 24, 189-191.
Maps:[51] SenStadt (Senate Department for Urban Development Berlin) (ed.) 2010a:
Berlin Digital Environmental Atlas, Edition 2010, Map 01.08 Terrain Elevations, Berlin.Internet:http://www.stadtentwicklung.berlin.de/umwelt/umweltatlas/eia108.htm(accessed November 26, 2015)
[52] SenStadt (Senate Department for Urban Development Berlin) (ed.) 2010b:Berlin Digital Environmental Atlas, Edition 2010, Map 04.12 Future Climatic Change and Thermal Load, Berlin.Internet:http://www.stadtentwicklung.berlin.de/umwelt/umweltatlas/ei412.htm(accessed January 8, 2016)
[53] SenStadtUm (Senate Department for Urban Development and the Environment Berlin) (ed.) 2011a:Berlin Digital Environmental Atlas, updated and expanded edition, 2011, Map 06.07 Urban Structure, Berlin.Internet:http://www.stadtentwicklung.berlin.de/umwelt/umweltatlas/eid607.htm(accessed November 26, 2015)
[54] SenStadtUm (Senate Department for Urban Development and the Environment Berlin) (ed.) 2012:Berlin Digital Environmental Atlas, updated and expanded edition, 2012, Map 01.02 Impervious Soil Coverage, Berlin.Internet:
43

http://www.stadtentwicklung.berlin.de/umwelt/umweltatlas/eic102.htm(accessed November 26, 2015)
[55] SenStadtUm (Senate Department for Urban Development and the Environment Berlin) (ed.) 2013a:Berlin Digital Environmental Atlas, updated and expanded edition, 2013, Map 01.11.3 Near-Natural Quality, Berlin.Internet:http://www.stadtentwicklung.berlin.de/umwelt/umweltatlas/eic111.htm(accessed November 26, 2015)
[56] SenStadtUm (Senate Department for Urban Development and the Environment Berlin) (ed.) 2014:Berlin Digital Environmental Atlas, Edition 2014, Map 06.10 Building and Vegetation Heights, Berlin.Internet:http://www.stadtentwicklung.berlin.de/umwelt/umweltatlas/ei610.htm(accessed November 26, 2015)
[57] SenStadtUm (Senate Department for Urban Development and the Environment Berlin) (ed.) 2014a:Detailnetz Berlin [Detailed network Berlin], as of November 2014, current version available via Geoportal Berlin, Berlin. Internet:http://fbinter.stadt-berlin.de/fb/index.jsp(accessed November 26, 2015)
[58] SenStadtUm (Senate Department for Urban Development and the Environment Berlin) (ed.) 2015a:Berlin Digital Environmental Atlas, Edition 2015, Map 04.13 Long-term Development of Selected Climate Parameters, Berlin.Internet:http://www.stadtentwicklung.berlin.de/umwelt/umweltatlas/ei413.htm(accessed November 26, 2015)
[59] SenStadtUm (Senate Department for Urban Development and the Environment Berlin) (ed.) 2015c:Automatisierte Liegenschaftskarte Berlin (ALK) [Automated Property Map of Berlin], as of June 1, 2014, current version available in the new standard: ALKIS [Authoritative Real Estate Information System] via Geoportal Berlin, Berlin.Internet: http://fbinter.stadt-berlin.de/fb/index.jsp(accessed January 8, 2016)
[60] SenStadtUm (Senate Department for Urban Development and the Environment Berlin) (ed.) 2015d:Berlin Digital Environmental Atlas, Edition 2015, Map 09.01 Environmental Justice, Berlin. Internet:http://www.stadtentwicklung.berlin.de/umwelt/umweltatlas/ei901.htm(accessed November 26, 2015)
Further sources on the excursus “Urban climate and health”Berlin:[61] Buchin, O., Hoelscher, M.-T., Meier, F., Nehls, T., Ziegler F. 2015:
Evaluation of the health-risk reduction potential of countermeasures to urban heat islands. Energy and Buildings, in print.
[62] Endlicher, W., Jendritzky, G., Fischer, J., Redlich, J.-P. 2008: Heat Waves, Urban Climate and Human Health. In: Marzluff, J.M., Shulenberger, E., Endlicher, W., Alberti, M. and Bradley, G. (eds.), Urban Ecology. New York, 269-278.
44

[63] Endlicher, W., Lanfer, N. 2003: Meso- and microclimatic aspects of Berlin’s urban climate, Die Erde [The Earth], Vol. 134, pp. 147-168.
[64] Freie Universität Berlin – AG Stadtklima und Gesundheit [Free University of Berlin – Working Group Urban Climate and Health] 2016:Internet: http://www.geo.fu-berlin.de/met/ag/Stadtklima/index.html(accessed January 8, 2016)
[65] Innovationsnetzwerk Klimaanpassung Brandenburg Berlin (INKA BB) [Innovation Network of Climate Change Adaptation Brandenburg Berlin] 2016:Internet:http://www.inka-bb.de/(accessed January 8, 2016)
[66] Jänicke, B. 2015: Stadtklima und Hitzestress. Anpassungsmaßnahmen müssen die Komplexität von Städten berücksichtigen. [Urban climate and heat stress. Adaptation measures must take the complexity of cities into account.] Umwelt Aktuell [Environment Update], Vol. 10, 2-3.
[67] Jänicke, B., Meier, F., Hoelscher, M., Scherer, D. 2015: Evaluating the Effects of Façade Greening on Human Bioclimate in a Complex Urban Environment. Advances in Meteorology, Vol. 2015, Article ID 747259.
[68] KiezKlima – Gemeinsam für ein besseres Klima im Brunnenviertel [NeighbourhoodClimate – Together for a better climate in the Brunnen neighbourhood] 2016:Internet:http://e-p-c.de/kiezklima/2015/(accessed January 8, 2016)
[69] Scherer, D., Endlicher W. 2014: Special Issue: Urban climate and heat-stress. Part 2. Die Erde [The Earth], Vol. 145, No 1-2.Internet: http://www.die-erde.org/index.php/die-erde/issue/view/13(accessed January 8, 2016)
[70] Scherer, D., Endlicher W. 2013: Special Issue: Urban climate and heat-stress. Part 1. Die Erde [The Earth], Vol. 144, No 3-4.Internet:http://www.die-erde.org/index.php/die-erde/issue/view/12(accessed January 8, 2016)
[71] Schubert, S., Grossman-Clarke S. 2013: The Influence of Green Areas and Roof Albedos on Air Temperatures during Extreme Heat Events in Berlin, Germany. Meteorologische Zeitschrift [Meteorological Magazine], 22 (2), 131-143.Internet:http://pubman.mpdl.mpg.de/pubman/item/escidoc:2043067:2/component/escidoc:2043071/Met-Z-80283.pdf(accessed January 8, 2016)
[72] UCaHS – Urban Climate and Heat Stress in mid-latitude cities in view of climate change 2016: Internet:http://www.ucahs.org/?lan=en(accessed January 8, 2016)
[73] Walikewitz, N., Jänicke, B., Langner, M., Endlicher, W. 2015: Assessment of indoor heat stress variability in summer and during heat warnings: A case study using the UTCI in Berlin, Germany. International Journal of Biometeorology, 1-14.
[74] Walikewitz, N., Jänicke, B., Langner, M., Meier, F., Endlicher, W. 2015: The difference between the mean radiant temperature and the air temperature within indoor environments: A case study during summer conditions. Building and Environment, 84, 151-161. Internet:
45

https://www.klima.tu-berlin.de/aktuell/Walikewitz_et_al_2015.pdf(accessed February 15, 2018)
Germany:[75] Aktionsprogramm Umwelt und Gesundheit (APUG) [Action Programme Environment and
Health] 2016: Internet:http://www.apug.de/(accessed January 8, 2016)
[76] Amt für Umweltschutz Stuttgart – Abteilung Stadtklimatologie [Office for Environmental Protection – Section of Urban Climatology] 2016:Internet: http://www.stadtklima-stuttgart.de(accessed January 8, 2016)
[77] Bundesministerium für Umwelt, Naturschutz, Bau und Reaktorsicherheit [Federal Ministry for the Environment, Nature Conservation, Building and Nuclear Safety] (ed.) 2008:Deutsche Anpassungsstrategie an den Klimawandel (DAS) [German Strategy for Adaptation to Climate Change].Internet:http://www.bmub.bund.de/fileadmin/bmu-import/files/english/pdf/application/pdf/das_gesamt_en_bf.pdf(accessed January 8, 2016)
[78] DWD (Deutscher Wetterdienst) [German Meteorological Service] 2016: Klima und Umweltberatung – Gesundheit [Climate and Environmental Consulting – Health].Internet:http://www.dwd.de/DE/klimaumwelt/ku_beratung/gesundheit/gesundheit_node.html(accessed January 8, 2016)
[79] DWD (Deutscher Wetterdienst) [German Meteorological Service] 2016: Fachnutzer – Gesundheit [Special users – Health].Internet:http://www.dwd.de/EN/specialusers/health/health.html(accessed January 8, 2016)
[80] GERICS (Climate Service Center Germany) (ed.) 2014: Gesundheit und Klimawandel. Handeln, um Risiken zu minimieren [Health and climate change. Acting to minimise risks].Internet: http://www.climate-service-center.de/imperia/md/content/csc/csc_broschueren/broschure_gesundheit_und_klimawandel.pdf(accessed January 8, 2016)
[81] GERICS (Climate Service Center Germany) 2016: Stadtbaukasten, Herausforderungen erkennen, rechtzeitig handeln - Module für eine nachhaltige, klimaangepasste Stadtplanung [City kit, recognising challenges, acting in time - modules for sustainable urban planning adapted to climate change].Internet: http://www.climate-service-center.de/imperia/md/content/csc/projekte/stadtbaukasten_kompakt_20151022.pdf(accessed on February, 19, 2018)
[82] GERICS (Climate Service Center Germany) 2016a:Climate-Focus-Paper "Cities and Climate Change". Internet:http://www.climate-service-center.de/products_and_publications/fact_sheets/climate_focus_paper/index.php.en(accessed on February, 19, 2018)
[83] Klimaanpassungsschule der Charité – Universitätsmedizin Berlin [Climate adaptation school of the Charité – University Hospital Berlin] 2016: Internet:http://www.klimawandelundgesundheit.de
46

[84] NABU (Naturschutzbund Deutschland e.V.) [Nature And Biodiversity Conservation Union] 2010: StadtKlimaWandel. Rezepte für mehr Lebensqualität und ein besseres Klima in der Stadt [CityClimateChange. Recipes for more quality of life and a better climate in the city].Internet: https://www.nabu.de/imperia/md/content/nabude/Stadtklimawandel/nabu_broschuere_stadtklimawandel_finalweb.pdf(accessed January 8, 2016)
[85] Stadtklimalotse [Urban climate guide] 2016: Internet:http://www.stadtklimalotse.net/(accessed January 8, 2016)
[86] UBA (Umweltbundesamt) [Federal Environment Agency] 2016:KlimaExWoSt – Urbane Strategien zum Klimawandel [KlimaExWoSt – Urban Strategies for Climate Change].Internet:https://www.umweltbundesamt.de/en/topics/climate-energy/climate-change-adaptation/adaptation-tools/project-catalog/klimaexwost-urban-strategies-for-climate-change(accessed on February, 19, 2018)
Europe:[87] European Commission, Public health responses to heat waves 2016:
Internet: http://ec.europa.eu/health/climate_change/extreme_weather/heatwaves/index_en.htm#fragment2(accessed January 8, 2016)
[88] WHO (World Health Organization Europe) (ed.) 2008: Heat-health action plans, Guidance, Copenhagen.Internet:http://www.euro.who.int/__data/assets/pdf_file/0006/95919/E91347.pdf(accessed January 8, 2016)
[89] WHO (World Health Organization Europe) (ed.) 2009: Improving public health responses to extreme weather/heat-waves – EuroHEAT. Technical summary, Copenhagen.Internet:http://www.euro.who.int/__data/assets/pdf_file/0010/95914/E92474.pdf(accessed January 8, 2016)
47