03rd Feb 2018 -...
11
03rd Feb 2018 RETAIL TECHNICAL RESEARCH IndiaNivesh Securities Ltd 03rd Feb 2018 1 of 11 IndiaNivesh Weekly Pulse Once again the markets proved - A vertical rise is followed by a vertical fall ! Chart 1 : Nifty - Daily Source: IndiaNivesh Research Market Outlook The week went by; proved to be catastrophic for the domestic markets. We observed a sell off on the D – Street after the Finance Minister announced that the golden days are over for Equities and there will be 10% tax on LTCG; during the Budget 2018. This did not bode well with the participants and we observed panic selling in the individual stocks. The Nifty index lost more than 2.5% and settled below the 10800 mark. But the most painful part was the Midcap and the Small Cap stocks. The MIDCAP index collapsed by more than 7% whereas the SMALL CAP index lost more than 10%. Meanwhile, the Nifty bank index too lost almost 3%. After a relentless rally during the past few months this kind of correction was already on the cards. In fact, we were not surprised with the magnitude of the correction since past few weeks we have been warning traders to stay light and avoid any kind of leveraged positions. . In our previous edition we already mentioned that the “number of overbought stocks from Nifty has reached at 13. Historically, whenever this Exactly in line with that view, the markets underwent heavy selling. number reaches 13 we have observed some profit booking in the markets” . Now, the index Nifty has corrected more than 400 points from the all-time high of 11172. The recent low of 10736 precisely coincides with the 38.2% Fibonacci retracement level of the entire rally which began from the 10000 mark as shown in the inset. Thus, going ahead a close below 10736 could lead to further correction towards 10600 and 10465 which are the 50% and 61.8% retracement levels. Since the corrective move has just begun; we advise traders to avoid any attempt for bottom fishing until any clear reversal signs. In case of any bounce from the current levels, 10840 -11000 might act as intermediate resistance for the index. Close 10761 R1 / R2 10840/ 11000 S1 / S2 10600/ 10465 50 EMA 10625 100 EMA 10391 200 EMA 10017 Mehul Kothari Sr. Technical Analyst - Equity Tel: +91 22 62406416 [email protected]
Transcript of 03rd Feb 2018 -...
03rd Feb 2018
RETAIL TECHNICAL RESEARCH
IndiaNivesh Securities Ltd
03rd Feb 2018
1 of 11
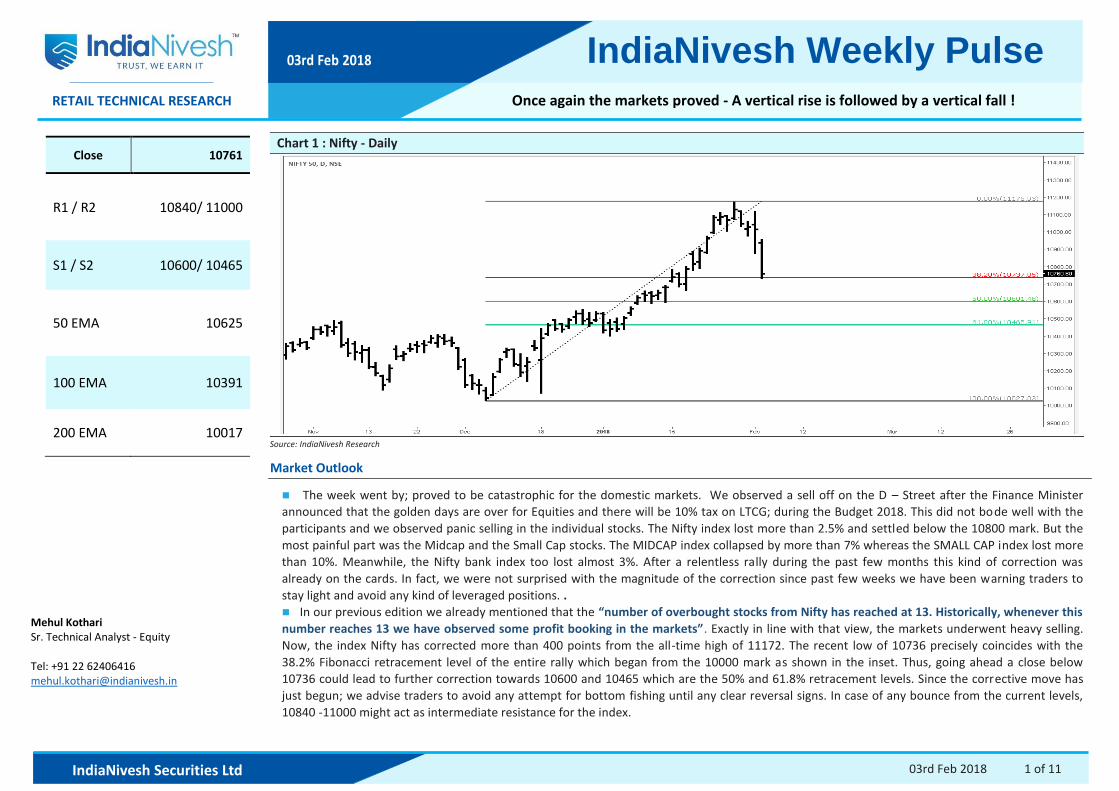
IndiaNivesh Weekly Pulse Once again the markets proved - A vertical rise is followed by a vertical fall !
Chart 1 : Nifty - Daily
Source: IndiaNivesh Research
Market Outlook
The week went by; proved to be catastrophic for the domestic markets. We observed a sell off on the D – Street after the Finance Minister
announced that the golden days are over for Equities and there will be 10% tax on LTCG; during the Budget 2018. This did not bode well with the
participants and we observed panic selling in the individual stocks. The Nifty index lost more than 2.5% and settled below the 10800 mark. But the
most painful part was the Midcap and the Small Cap stocks. The MIDCAP index collapsed by more than 7% whereas the SMALL CAP index lost more
than 10%. Meanwhile, the Nifty bank index too lost almost 3%. After a relentless rally during the past few months this kind of correction was
already on the cards. In fact, we were not surprised with the magnitude of the correction since past few weeks we have been warning traders to
stay light and avoid any kind of leveraged positions. .
In our previous edition we already mentioned that the “number of overbought stocks from Nifty has reached at 13. Historically, whenever this
Exactly in line with that view, the markets underwent heavy selling. number reaches 13 we have observed some profit booking in the markets”.
Now, the index Nifty has corrected more than 400 points from the all-time high of 11172. The recent low of 10736 precisely coincides with the
38.2% Fibonacci retracement level of the entire rally which began from the 10000 mark as shown in the inset. Thus, going ahead a close below
10736 could lead to further correction towards 10600 and 10465 which are the 50% and 61.8% retracement levels. Since the corrective move has
just begun; we advise traders to avoid any attempt for bottom fishing until any clear reversal signs. In case of any bounce from the current levels,
10840 -11000 might act as intermediate resistance for the index.
Close 10761
R1 / R2 10840/ 11000
S1 / S2 10600/ 10465
50 EMA 10625
100 EMA 10391
200 EMA 10017
Mehul Kothari Sr. Technical Analyst - Equity Tel: +91 22 62406416 [email protected]

IndiaNivesh Weekly Pulse
IndiaNivesh Securities Ltd
03rd Feb 2018
2 of 11
Chart 2 : CENTURYTEX – Weekly (Prev. Close : 1270) Chart 3 : VOLTAS – Weekly (Prev. Close : 570)
Fresh trend line breakdown on the weekly chart after a long time indicates change of trend and
further correction. (Bearish)
Fresh trend line breakdown on the weekly chart after a long time indicates change of trend and further
correction. (Bearish)
Chart 4 : MOTHERSUMI - Weekly (Prev. Close : 354) Chart 5: ARVIND – Weekly (Prev. Close : 380)
Fresh trend line breakdown on the weekly chart after a long time indicates change of trend and further correction. (Bearish)
Even ARVIND is at the threshold of a trend line breakdown. A move below the same could lead to some correction. (Neutral)
Source: IndiaNivesh Research
Trend lines are a visual representation of support and resistance in any timeframe and a simple tool available for trend analysis. The greater the number of touch points increases the importance, break on the either side may lead to major moves or trend reversals. The above charts will help you go through recent trend line breakouts / breakdowns.
Trend lines in Actions

IndiaNivesh Weekly Pulse
IndiaNivesh Securities Ltd
03rd Feb 2018
3 of 11
Chart 6 : GSFC – Weekly (Prev. Close : 129) Chart 7 : ADANIENT – Daily (Prev. Close : 197)
Fresh trend line breakdown on the weekly chart after a long time indicates change of trend and
further correction. (Bearish)
The stock has already confirmed a trend line breakdown. Now the stock is in sell on rise mode. (Bearish)
Chart 8 : M&MFIN - Daily (Prev. Close : 447) Chart 9: ULTRACEMO – Daily (Prev. Close : 4138)
The stock has already confirmed a trend line breakdown on the daily chart. Now the stock is in sell on rise mode. (Bearish)
Even ULTRACEMO has confirmed a trend line breakdown. A move below the immediate low could lead to some correction. (Neutral)
Source: IndiaNivesh Research
Trend lines are a visual representation of support and resistance in any timeframe and a simple tool available for trend analysis. The greater the number of touch points increases the importance, break on the either side may lead to major moves or trend reversals. The above charts will help you go through recent trend line breakouts / breakdowns.
Trend lines in Actions

IndiaNivesh Weekly Pulse
IndiaNivesh Securities Ltd
03rd Feb 2018
4 of 11
Chart 10 : COX&KINGS – Weekly (Prev. Close : 241) Chart 11 : KSCL – Weekly (Prev. Close : 489)
Heavy volumes and that too on a weekly chart along with breakdown in the price indicates further correction in the stock. (Bearish)
Heavy volumes along with price breakdown indicate fresh momentum going ahead. (Bearish)
Chart 12 : MRPL – Daily (Prev. Close : 117) Chart 13 : TECHNO – Weekly (Prev. Close : 360)
The stock registered a breakdown with exceptional volumes on daily chart which suggest fresh downside from here on. (Bearish)
Extra ordinary volumes (after four years) when the stock is near life high; suggests possibility of a buying climax and that means correction. (Bearish)
Source: IndiaNivesh Research
The given stocks witnessed climatic volumes during the week went by.
Volume Shockers

IndiaNivesh Weekly Pulse
IndiaNivesh Securities Ltd
03rd Feb 2018
5 of 11
Chart 14 : DCBBANK - Weekly (Prev. Close : 167) Chart 15 : KAJARIA- Weekly (Prev. Close : 612)
A range breakdown with a close below the Bollinger band on the weekly chart indicates fresh corrective move. (Bearish)
A range breakdown with a close below the Bollinger band on the weekly chart indicates fresh corrective move. (Bearish)
Chart 16 : RBLBANK - Weekly (Prev. Close : 483) Chart 17 : BAJAJFINANCE - Weekly (Prev. Close : 1633)
A close below Bollinger band after a squeeze in prices indicates fresh downside. (Bearish) A close below Bollinger band and at breakdown point on weekly chart indicates fresh downside. (Bearish)
Source: IndiaNivesh Research
Bollinger Band contraction represents period of low volatility and may be considered by traders for a potential sign of future increased volatility and possible trading opportunities. Thus, in the
above examples we have shared few stocks which underwent a breakout / breakdown from the Bollinger band that indicating further acceleration in the on-going trend.
Trend lines in Actions
Bollinger Band breakouts / breakdowns

IndiaNivesh Weekly Pulse
IndiaNivesh Securities Ltd
03rd Feb 2018
6 of 11
Source: IndiaNivesh Research
The Averages
An exponential moving average (EMA) is a variant of moving average which is similar to a simple moving average, apart from the weightage as more weight is given to the recent closing prices.
We have added 50, 100 and 200 DEMA to our analysis which represents short-term, medium term and long term trend respectively. As short term traders can use 50 DEMA swing trading decisions, while 100 DEMA can be used by medium term. The long-term investors will focus on 200 DEMA and could consider the same for accumulation & distribution of their investments.
The Daily Exponential Moving Average (DEMA) is suited for trending market however it could possibly witness multiple cross over in sideways trend. When the market is trending and in oscillation mode as well has sustained trending nature, the DEMA will also show a similar oscillation & vice-versa.
However to limit the multiple whipsaws to a certain extent, the stocks mentioned in the table have closed 1% above or below the respective moving averages.
Going ahead, these averages can act as initial filter to on-going trend, or could possibly consider as support & resistance.

IndiaNivesh Weekly Pulse
IndiaNivesh Securities Ltd
03rd Feb 2018
7 of 11
Stocks above 70 & below 30 Relative Strength Index
Source: IndiaNivesh Research
RSI- The above shown chart represents the comparison of price action of benchmark index Nifty vis a vis the overbought/ oversold zone of Nifty 50 stocks considering the value of daily RSI.
The Overbought zone occurs when the RSI value crosses 70 levels while the oversold zone occurs when it plunges below 30 levels.
As per last three years data, we can analyse that, whenever the number of overbought stocks in Nifty 50 goes above 13 the market tend to make an intermediate top, while oversold position
occurs when number of oversold stocks of Nifty 50 goes above 13 the market tend to form intermediate bottom.
During the previous week the overbought number of stocks in Nifty reached 13 and in line with our view we witness massive selling in the markets. Now the numbers have stabilized.
Nifty 50 – Overbought / Oversold

IndiaNivesh Weekly Pulse
IndiaNivesh Securities Ltd
03rd Feb 2018
8 of 11
Open Interest Shockers
Source: IndiaNivesh Research
Nifty Option Snapshot
Source: IndiaNivesh Research
Since the index Nifty spot breached the level of 11000 we observed massive shift in OIs in both Calls and Puts. Huge unwinding was observed in 11000 strike PEs to the tune of almost 1.4 million
shares followed by 10900 Pes. This indicates that the put writers got trapped. On the Calls front we observed heavy addition in 11000 – 10900 and 10800 CEs to the tune of almost 4.5 million
shares which indicates major resistance at every levels on the upside. The OI concentration is now at 11500 CEs and 10500 PE which at least suggests that the c correction might get halted before
the 10500 levels.
Weekly Derivatives Analysis

IndiaNivesh Weekly Pulse
IndiaNivesh Securities Ltd
03rd Feb 2018
9 of 11
Weekly Pulse MIS

IndiaNivesh Weekly Pulse
IndiaNivesh Securities Ltd
03rd Feb 2018
10 of 11
Disclaimer: This document has been prepared by IndiaNivesh Securities Limited (“INSL”), for use by the recipient as information only and is not for circulation or public distribution. INSL includes subsidiaries, group and associate companies, promoters, employees and affiliates. This document is published in accordance with Regulation 18 of the Securities and Exchange Board of India (Research Analysts) Regulations, 2014. INSL researches, aggregates and faithfully reproduces information available in public domain and other sources, considered to be reliable and makes them available for the recipient, though its accuracy or completeness has not been verified by INSL independently and cannot be guaranteed. This document is not to be altered, transmitted, reproduced, copied, redistributed, uploaded or published or made available to others, in any form, in whole or in part, for any purpose without prior written permission from INSL. This document is solely for information purpose and should not to be construed as an offer to sell or the solicitation of an offer to buy any security. Recipients of this document should be aware that past performance is not necessarily a guide for future performance and price and value of investments can go up or down. The suitability or otherwise of any investments will depend upon the recipients particular circumstances. INSL does not take responsibility thereof. The information contained in this document has been obtained from sources that are considered as reliable though its accuracy or completeness has not been verified by INSL independently and cannot be guaranteed. INSL has not independently verified all the information contained within this document. The research analysts of INSL have adhered to the code of conduct under Regulation 24 (2) of the Securities and Exchange Board of India (Research Analysts) Regulations, 2014. Nothing in this document constitutes investment, legal, accounting and/or tax advice or a representation that any investment or strategy is suitable or appropriate to recipients’ specific circumstances. INSL does not accept any responsibility or whatever nature for the information, assurances and statements given or made available herein or for any omission or for any liability arising from the use of this document. Information mentioned is the current information as of the date appearing on this document only. INSL directors/ employees and its clients may have holdings in the stocks mentioned in the document. This report is based on technical and derivative analysis on studying charts of a stock's price movement, outstanding positions and trading volume, as opposed to focusing on a company's fundamentals and, as such, may not match with a report on a company's fundamentals. Following table contains the disclosure of interest in order to adhere to utmost transparency in the matter.
Disclosure of Interest Statement
1 Details of business activity of IndiaNivesh Securities Limited (INSL) INSL is a Stock Broker registered with BSE, NSE and MCX - SX in all the major segments viz. Cash, F & O and CDS segments. INSL is also a Depository Participant and registered with both Depository viz. CDSL and NSDL. Further, INSL is a Registered Portfolio Manager and is registered with SEBI.
2 Details of Disciplinary History of INSL No disciplinary action is / was running / initiated against INSL
3 Details of Associates of INSL Please refer to the important 'Stock Holding Disclosure' report on the IndiaNivesh website (investment Research Section -http://www.indianivesh.in/Research/Holding_Disclosure.aspx?id=10 link). Also, please refer to the latest update on respective stocks for the disclosure status in respect of those stocks. INSL and its affiliates may have investment positions in the stocks recommended in this report.
4 Research analyst or INSL or its relatives'/associates' financial interest in the subject company and nature of such financial interest
No (except to the extent of shares held by Research analyst or INSL or its relatives'/associates')
5 Research analyst or INSL or its relatives'/associates' actual/beneficial ownership of 1% or more in securities of the subject company, at the end of the month immediately preceding the date of publication of the document.
Please refer to the important 'Stock Holding Disclosure' report on the IndiaNivesh website (investment Research Section - http://www.indianivesh.in/Research/Holding_Disclosure.aspx?id=10 link). Also, please refer to the latest update on respective stocks for the disclosure status in respect of those stocks. INSL and its affiliates may have investment positions in the stocks recommended in this report.
6 Research analyst or INSL or its relatives'/associates' any other material conflict of interest at the time of publication of the document
No
7 Has research analyst or INSL or its associates received any compensation from the subject company in the past 12 months
No
8 Has research analyst or INSL or its associates managed or co-managed public offering of securities for the subject company in the past 12 months
No
9 Has research analyst or INSL or its associates received any compensation for investment banking or merchant banking or brokerage services from the subject company in the past 12 months
No
10 Has research analyst or INSL or its associates received any compensation for products or services other than investment banking or merchant banking or brokerage services from the subject company in the past 12 months
No
11 Has research analyst or INSL or its associates received any compensation or other benefits from the subject company or third party in connection with the document.
No
12 Has research analyst served as an officer, director or employee of the subject company No
13 Has research analyst or INSL engaged in market making activity for the subject company No
14 Other disclosures No

IndiaNivesh Weekly Pulse
IndiaNivesh Securities Ltd
03rd Feb 2018
11 of 11
INSL, its affiliates, directors, its proprietary trading and investment businesses may, from time to time, make investment decisions that are inconsistent with or contradictory to the recommendations expressed herein. The views contained in this document are those of the analyst, and the company may or may not subscribe to all the views expressed within. This information is subject to change, as per applicable law, without any prior notice. INSL reserves the right to make modifications and alternations to this statement, as may be required, from time to time.
IndiaNivesh Securities Limited
Research Analyst SEBI Registration No. INH000000511
Corporate Office: Lodha Supremus, 17th Floor, Senapati Bapat Marg, Lower Parel (West), Mumbai - 400 013.
Registered Office: 601 & 602, Sukh Sagar, N. S. Patkar Marg, Girgaum Chowpatty, Mumbai - 400 007.
Tel (Board): 022 6240 6240 | Fax: 022 6240 6241
e-mail: [email protected] | Website: www.indianivesh.in