
*0300/402* - Hillpark Secondary School · STANDARD GRADE Credit Level ... Page seven Marks KU PS DO...
28
FOR OFFICIAL USE C 0300/402 NATIONAL THURSDAY, 28 MAY QUALIFICATIONS 10.50 AM – 12.20 PM 2009 BIOLOGY STANDARD GRADE Credit Level LI 0300/402 6/28720 © Fill in these boxes and read what is printed below. Full name of centre Town Forename(s) Surname Date of birth 1 All questions should be attempted. 2 The questions may be answered in any order but all answers are to be written in the spaces provided in this answer book, and must be written clearly and legibly in ink. 3 Rough work, if any should be necessary, as well as the fair copy, is to be written in this book. Additional spaces for answers and for rough work will be found at the end of the book. Rough work should be scored through when the fair copy has been written. 4 Before leaving the examination room you must give this book to the invigilator. If you do not, you may lose all the marks for this paper. Day Month Year Number of seat Scottish candidate number *0300/402* Total Marks KU PS
Transcript of *0300/402* - Hillpark Secondary School · STANDARD GRADE Credit Level ... Page seven Marks KU PS DO...

FOR OFFICIAL USE C
0300/402
N A T I O N A L T H U R S D A Y , 2 8 M A YQ U A L I F I C A T I O N S 1 0 . 5 0 A M – 1 2 . 2 0 P M2 0 0 9
BIOLOGYSTANDARD GRADECredit Level
L I 0 3 0 0 / 4 0 2 6 / 2 8 7 2 0 ©
Fill in these boxes and read what is printed below.
Full name of centre Town
Forename(s) Surname
Date of birth
1 All questions should be attempted.
2 The questions may be answered in any order but all answers are to be written in thespaces provided in this answer book, and must be written clearly and legibly in ink.
3 Rough work, if any should be necessary, as well as the fair copy, is to be written in thisbook. Additional spaces for answers and for rough work will be found at the end of thebook. Rough work should be scored through when the fair copy has been written.
4 Before leaving the examination room you must give this book to the invigilator. If you donot, you may lose all the marks for this paper.
Day Month Year Number of seat Scottish candidate number
*0300/402*
Total Marks
KU PS

DO NOT
WRITE IN
THIS
MARGIN
1. (a) Rabbits were first brought to Australia by European settlers.
The graph below shows the change in rabbit population in Australia
since their introduction.
(i) Describe the changes in the rabbit population between times
A and E.
(ii) Suggest one reason for the population change between times
B and C.
(b) To control over-grazing by rabbits, a disease was introduced in 2005
which was fatal to rabbits but not to other species.
If this disease had wiped out the rabbit population, what effect could it
have had on the population of:
(i) Eastern wallabies which are herbivores?
(ii) Dingoes which are carnivorous wild dogs?
Explain your answers.
(i) Effect on Eastern wallabies
Explanation
(ii) Effect on Dingoes
Explanation
Page two[0300/402]
KU PS
2
1
2
Marks
A B C D E
Increasing
number of
rabbits
Time

2. (a) Coal-burning and nuclear power stations are used to produce electricity
in Britain.
Draw lines to connect each type of power station with features
considered to be adverse effects of their operation.
Type of power station Features
• Waste can cause high levels of acid rain
• Waste must be sealed before it is stored
• High volume of greenhouse gas
production
• Waste is dangerous for hundreds of years
(b) Environmental protection analysis was carried out on water samples
from three burns.
The Mains Burn had the highest pH at 8.0. It also had the highest
oxygen saturation at 94% compared to Bell’s Burn which had the lowest
at 65%.
The Hatchery Burn had the lowest value for suspended solids at
4.0 mg/l, with an oxygen saturation of 91.5%.
Bell’s Burn had a suspended solids reading of 5.6 mg/l and the lowest
pH at 7.7 compared to a value of 7.9 for the Hatchery Burn. The
highest reading for suspended solids was recorded in the Mains Burn
with a value of 6.0 mg/l.
(i) Complete the following table with the data in the passage using
suitable column headings.
(ii) Calcium in the water of the burns raises the pH.
Water snails need calcium for shell growth. Which burn would
you expect to have the highest number of water snails?
Page three[0300/402] [Turn over
DO NOT
WRITE IN
THIS
MARGIN
KU PSMarks
coal burning
nuclear
Analysis site
Hatchery Burn
Bell’s Burn
Mains Burn
2
3
1

3. (a) The diagram below represents a wind-pollinated flower.
Explain how each of the labelled structures contributes to wind
pollination.
Anther
Stigma
(b) The chart below shows the peak times for airborne pollen from six
wind-pollinated plants.
(i) How many months are shown to be free of pollen?
(ii) The above plants account for most pollen allergy in Britain.
Most allergy sufferers are affected for 3– 4 months each year.
Give a conclusion which can be drawn about pollen allergy from
these facts.
[0300/402]
KU PSMarks
DO NOT
WRITE IN
THIS
MARGIN
Page four
2
1
1
MonthType of plant Jan Feb Mar Apr May Jun Jul Aug Sep Oct Nov DecHazel
Yew
Willow
Oil seed rape
Grass
Nettle
anther
stigma

DO NOT
WRITE IN
THIS
MARGIN
3. (b) (continued)
(iii) In summer, air carries an average of 100 pollen grains per litre.
If a person inhales 12.6 litres of air per minute, calculate the total
number of pollen grains inhaled each hour.
Space for calculation
grains per hour
(c) What essential stage in plant reproduction must take place after
pollination and before fertilisation?
(d) Give one example of a plant which relies on wind for seed dispersal and
describe how its seeds are adapted to dispersal in this way.
Plant
Description
(e) The list below describes groups of organisms.
1 a patch of strawberry plants produced from the runners of one
plant
2 a field of barley grown from seeds
3 a litter of pedigree West Highland Terrier puppies
4 a group of potato tubers harvested from the same plant
5 all the pea plants grown from peas from the same pod
Use the numbers from the list to identify each of the groups which form
a clone.
Numbers
[0300/402]
KU PSMarks
1
1
2
1
[0300/402] Page five
[Turn over

4. (a) The table below shows some features of five British butterflies.
Complete the key using the information given in the table.
1 Pale wing shading . . . . . . . . . . . . . . . . . . . . . . go to 2
Dark wing shading . . . . . . . . . . . . . . . . . . . . . .
2 . . . . . . . . . . . . . . . . . . . . . . . . . . . . . . . . . . . . .
Orange wing tip . . . . . . . . . . . . . . . . . . . . . . . . Orange Tip
3. Spots on wings . . . . . . . . . . . . . . . . . . . . . . . . Large White
No spots on wings . . . . . . . . . . . . . . . . . . . . . .
4. Blue wing tip . . . . . . . . . . . . . . . . . . . . . . . . . . Peacock
. . . . . . . . . . . . . . . . . . . . . . . . . . . . . . . . . . . . .
[0300/402]
KU PSMarks
DO NOT
WRITE IN
THIS
MARGIN
Page six
3
Butterfly species Wing shading Wing tip Wing spots
Large White pale black yes
Orange Tip pale orange no
Peacock dark blue yes
Red Admiral dark white yes
Wood White pale black no

4. (continued)
(b) The earliest sighting of these butterflies in Britain was recorded in 1956
and again in 2006. The information is shown in the table below.
(i) What evidence suggests that the average temperatures in 2006
were higher than in 1956?
(ii) What name is given to organisms, such as these butterflies, which
can be used to provide information about environmental factors?
Page seven[0300/402]
KU PSMarks
DO NOT
WRITE IN
THIS
MARGIN
[0300/402]
Earliest sighting
Butterfly species 1956 2006
Large White mid June early June
Orange tip late May mid May
Peacock mid March early March
Red Admiral early June late May
Wood White mid May early May
[Turn over
1
1

DO NOT
WRITE IN
THIS
MARGIN
5. (a) The table below shows information on the number of eggs fertilised and
the survival of offspring for four different animals.
(i) Calculate the percentage survival rate for the dog and complete
the table with the result.
Space for calculation
(ii) Explain the difference in the survival rates between humans and
trout.
(b) Embryos of mammals exchange substances with their mother through
the placenta.
Name a substance which passes through the placenta from an embryo to
its mother.
Page eight[0300/402]
KU PSMarks
1
1
1
AnimalAverage numberof eggs fertilised
at one time
Average numberof surviving
offspring
Percentagesurvival rate
Dog 5 4
Human 1 1 100
Bird 4 3 75
Trout 1000 20 2

DO NOT
WRITE IN
THIS
MARGIN
6. The diagram below shows Paramecium, a single-celled organism which lives
in water.
(a) The water concentration outside the cell is higher than the water
concentration of the cytoplasm. This causes water to enter the cell
constantly.
(i) What is the name for this movement of water?
(ii) From the information given, state whether Paramecium is likely to
live in fresh water or salt water.
(b) Paramecium must get rid of excess water. Pure water is collected in the
vacuoles by removing it from the cytoplasm. The vacuoles are emptied
to the surrounding water as soon as they are full.
(i) What would happen to the Paramecium cell if the vacuoles
stopped working properly?
(ii) The vacuoles are not filled by the diffusion of water.
What evidence is there to support this statement?
[0300/402]
KU PSMarks
1
1
1
1
[0300/402] Page nine
[Turn over
cytoplasm
cell membranenucleus
vacuole filling
vacuole emptying

7. (a) Underline one word in each bracket to make the paragraph about water
balance correct.
When a large volume of water is taken into the body, the water
concentration of the blood . The volume of ADH
released into the blood by the pituitary gland .
This causes water reabsorption by the kidneys to
and the volume of urine produced increases.
(b) The diagram below represents a nephron from a kidney.
(i) Which letter on the diagram shows where filtration occurs?
(ii) Which letter on the diagram shows a collecting duct?
DO NOT
WRITE IN
THIS
MARGIN
[0300/402]
KU PSMarks
Page ten
2
1
1
{ }increases
decreases
{ }increases
decreases
{ }increase
decrease
A
B
C
D
E
blood flow
blood flow

7. (continued)
(c) The table below shows the concentration of some substances found in
samples taken from the blood, the kidney filtrate and the urine of a
volunteer.
(i) Which substance was present in the blood but was not filtered out
of it?
(ii) Which substance was filtered from the blood and then completely
reabsorbed back into it?
(d) A person produces an average of 1.8 litres of urine per day and this is
1% of the kidney filtrate.
What is the average volume of filtrate reabsorbed daily?
Space for calculation
litres
[0300/402]
KU PSMarks
1
1
1
DO NOT
WRITE IN
THIS
MARGIN
[Turn over
Page eleven
SubstanceConcentration
in blood(g/100cm3)
Concentration in filtrate
(g/100cm3)
Concentration in urine
(g/100cm3)
urea 0.25 0.25 2.00
glucose 0.10 0.10 0.00
protein 7.50 0.00 0.00
salts 0.62 0.62 1.50

8. (a) Stages of mitosis are shown in their correct order in the diagrams below.
(i) Label the spindle on one of the diagrams.
(ii) Stage C would be followed by stage D. Describe what would
happen in stage D.
(b) Typical timings of the stages of mitosis are shown in the table below.
What percentage of the total time for mitosis is taken by stage C?
Space for calculation
%
(c) Scientists can grow liver tissue in the laboratory. This is done by
making a few liver cells divide by mitosis to form a large mass of cells.
Why is it important that the daughter cells contain the same number of
chromosomes as the original mother cells?
[0300/402]
KU PSMarks
1
1
1
1
DO NOT
WRITE IN
THIS
MARGIN
Page twelve
Stage A B C D
Time (minutes) 88 33 25 54
Stage A Stage B Stage C

[0300/402]
KU PSMarks
DO NOT
WRITE IN
THIS
MARGIN
9. (a) The diagram below represents a hinge joint.
Complete each of the boxes with the missing name or function of the
part labelled.
(b) Tendons attach muscle to bone.
Explain why it is important that tendons are inelastic.
KU PSMarks
2
2
DO NOT
WRITE IN
THIS
MARGIN
Page thirteen
[Turn over
Name
Function
Name
Synovial fluid
Function

10. (a) The following statements refer to breathing.
1 ribs move up and out
2 ribs move down and in
3 diaphragm relaxes
4 diaphragm contracts
5 chest volume decreases
6 chest volume increases
7 lung pressure decreases
8 lung pressure increases
Complete the box by inserting the statement numbers which refer to
breathing in.
(b) The table below shows how exercise at different work rates affects heart
rate, breathing rate and the lactic acid concentration in the blood.
(i) Calculate the percentage increase in lactic acid concentration as
the work rate increases from 0 to 200 watts.
Space for calculation
%
[0300/402]
KU PS
DO NOT
WRITE IN
THIS
MARGIN
Page fourteen
Statements referring to breathing in
Work rate(watts)
Heart rate(beats/min)
Breathing rate(breaths/min)
Lactic acidconcentration
(mg/l)
0 76 12 1.0
40 92 13 1.5
80 112 15 1.8
120 132 16 3.5
160 156 18 4.5
200 172 30 9.0
Marks
2
1

DO NOT
WRITE IN
THIS
MARGIN
[0300/402]
KU PSMarks
1
2
1
Page fifteen
10. (b) (continued)
(ii) Explain why the lactic acid concentration increases as the work rate
increases.
(iii) The graph uses information from the table to show how the
breathing rate varies with work rate.
On the same grid, add a scale and label to the vertical axis on the left
side and plot a line graph to show how the heart rate varies with
work rate.
(An additional graph, if needed, will be found on Page twenty-six.)
(iv) Describe the relationship between work rate and both breathing and
heart rates.
[Turn over
0 20 40 60 80 100 120 140 160 180 200
30
25
20
15
10
5
0
Work Rate (watts)
Breathing
Rate
(breaths/min)

11. The flow chart shows what happens in a typical sewage treatment works.
sewage from homes water from road drains
(a) What material, which passes through the screens in Stage A, does not
reach the tank in Stage C?
(b) Name the gas needed for the final treatment in Stage D and explain
why the gas is needed for this process.
Gas
Explanation
Page sixteen[0300/402]
KU PSMarks
1
2
DO NOT
WRITE IN
THIS
MARGIN
Stage A - filter screens
removes large insoluble material
Stage B - first settling tank
grit falls to bottom
Stage C - second settling tank
sludge sinks to bottom
Stage D - final treatment tank
biological breakdown of
organic matter in liquid
Stage E - sludge fermenter
grit removed for disposal
treated water returned to river
methane
produced by
fermentation
is collected
remaining
solid sludge is
removed
emergency
overflow to river

11. (continued)
(c) When liquid from Stage D was sampled, it was found to contain over
80 different species of micro-organisms. Explain why this was seen as a
good result.
(d) Under what environmental conditions could untreated sewage enter the
river, even if the sewage treatment plant was working correctly?
Page seventeen[0300/402]
KU PSMarks
1
1
DO NOT
WRITE IN
THIS
MARGIN
[Turn over

12. Read the following passage and answer the questions using information
from it.
Salve Imperator Adapted from “The Life of Birds”
by David Attenborough.
Reproduction for Emperor penguins involves extreme hardship. They
start their breeding cycle in March at the beginning of the Antarctic
winter. At this time the fringe of ice that surrounds the Antarctic
continent is at its narrowest. The penguins walk across it for several
miles to the permanent ice which is their breeding ground. Up to
25 000 penguins gather and mating takes place in April.
As the temperature falls, the sea ice expands by 2 miles per day. In May
the female produces one large egg which she places on the top of her
feet. The male takes the egg, juggles it onto the top of his feet and
covers it with a fold of his densely feathered abdomen to keep it warm.
Producing the egg has taken a significant proportion of the female’s
body reserves. She needs to replenish them urgently and heads back to
sea to feed.
As the winter winds begin to blow, the temperature falls. The male
Emperors huddle closer together for warmth and shelter. They use
their tiny stump of a tail as the third leg of a tripod and rest on their
heels. Their upwardly turned toes keep their precious eggs off the ice.
There is nothing to eat and for a month there is total darkness.
After 60 days the eggs hatch. The males, close to starvation, manage to
produce a little milky secretion from their gullets for their chicks. At
this critical moment the females reappear. They have had a long
journey as the ice has extended considerably. The females regurgitate
their chicks’ first real meal. The males now start the long trek back to
the sea to feed for the first time in four months.
Three weeks later, the males are back to take over the care of the chicks,
allowing the females to return to the sea. As winter slackens its grip, the
ice begins to break up. The journey to the sea gets shorter and the
parents can increase the frequency of feeding. In November the parents
stop feeding the young and long processions of adults and young waddle
down to the sea.
(a) Why is it necessary for the females to leave their eggs and return to the
sea?
Page eighteen
KU PSMarks
1
DO NOT
WRITE IN
THIS
MARGIN
[0300/402]
12. (continued)
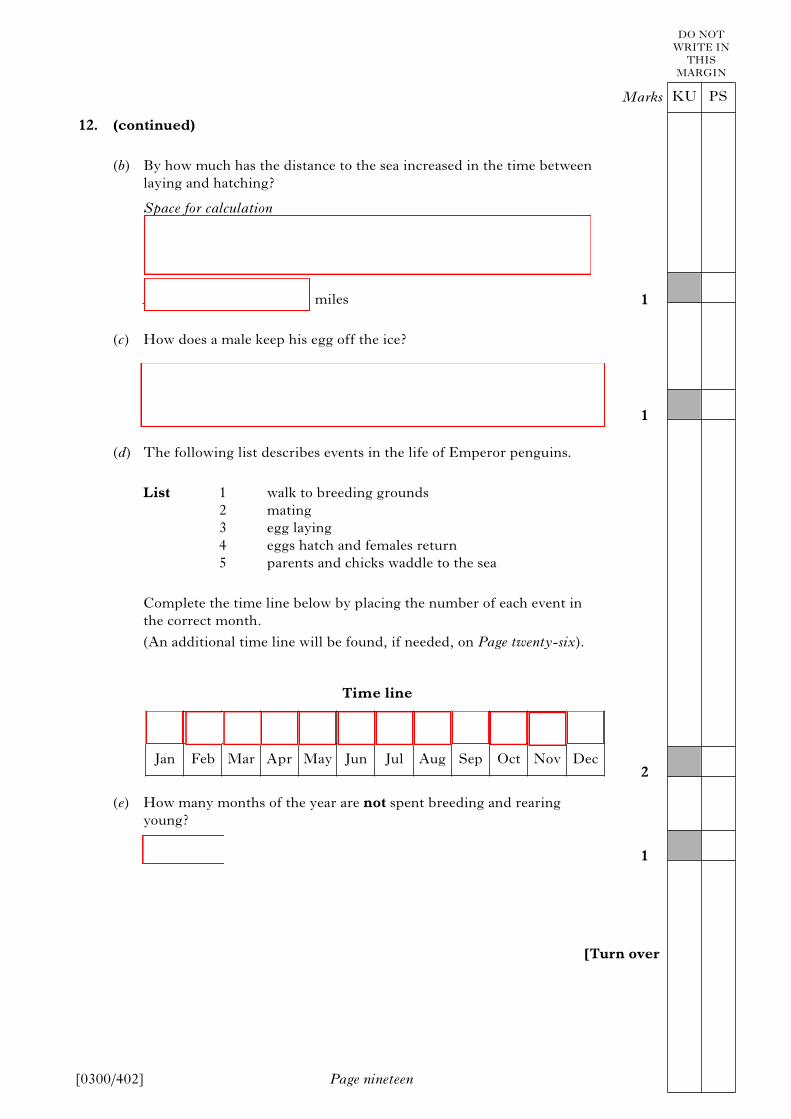
(b) By how much has the distance to the sea increased in the time between
laying and hatching?
Space for calculation
miles
(c) How does a male keep his egg off the ice?
(d) The following list describes events in the life of Emperor penguins.
List 1 walk to breeding grounds
2 mating
3 egg laying
4 eggs hatch and females return
5 parents and chicks waddle to the sea
Complete the time line below by placing the number of each event in
the correct month.
(An additional time line will be found, if needed, on Page twenty-six).
(e) How many months of the year are not spent breeding and rearing
young?
Page nineteen[0300/402]
KU PSMarks
1
1
2
1
DO NOT
WRITE IN
THIS
MARGIN
Jan Feb Mar Apr May Jun Jul Aug Sep Oct Nov Dec
[Turn over
Time line

13. The following apparatus was used to investigate the effectiveness of washing
powders.
Identical pieces of stained cloth were washed using different washing
powders.
The cloths were dried and the degree of stain removal was measured by
recording light reflected from the cloth with a light meter. The meter was
set to read 100% when the cloth was perfectly clean. Any stain left on the
cloth reduced the intensity of light recorded.
(a) (i) Various precautions were taken to ensure that the experimental
procedure was valid.
Identify the point(s) which contributed to this.
Tick (✓) the correct box(es).
The procedure used gave appropriate information
about the effectiveness of washing powders.
All significant variables were controlled and were
identical except the one being investigated.
Several results were collected and used to calculate an
average.
(ii) Explain why it was necessary to carry out the investigation in a
light-proof box.
[0300/402]
KU PSMarks
DO NOT
WRITE IN
THIS
MARGIN
1
1
Page twenty
Light-proof box
Light source
Sample
of cloth
Light
sensor
Light meter
96.0%

13. (continued)
(b) The results obtained using two different washing powders at various
temperatures are shown below.
(i) At which temperature was there the greatest difference between
the effectiveness of the two washing powders?
°C
(ii) Each one degree Celcius reduction in the washing temperature
saves 2p in the cost of electricity used to heat the water for each
wash.
Calculate the annual saving in the electricity costs to achieve 100%
stain removal with biological washing powder compared to a
non-biological one, for a household which does one wash per
week.
Space for calculation
annual saving = £
(iii) What type of biological substance gives biological washing
powders their properties?
(iv) Explain why the effectiveness of the biological washing powder
decreases between 40°C and 45°C.
Page twenty-one
DO NOT
WRITE IN
THIS
MARGIN
[0300/402]
KU PSMarks
1
1
1
1
[Turn over
0 10 20 30 40 50 60
100
80
60
40
20
0
Temperature (°C)
Light
reflected
(%)
Biological
Key
Non-biological

14. Micro-organisms living in water use dissolved oxygen for respiration.
The mass of oxygen they use is called the Biochemical Oxygen Demand
(BOD).
The table below shows the BOD of a river and the concentration of solid
material carried by the river during five months of the year.
(a) Use the information in the table to complete the bar chart below for
January and November.
(An additional chart, if needed, will be found on Page twenty-seven.)
DO NOT
WRITE IN
THIS
MARGIN
[0300/402]
KU PSMarks
Page twenty-two
1
MonthConcentration of
solid material(mg/l)
BOD(mg/l)
January 6.75 1.0
March 7.25 1.2
May 10.75 1.9
September 5.50 0.5
November 9.00 1.5
January March May September November
11
10
9
8
7
6
5
4
3
2
1
0
2.2
2.0
1.8
1.6
1.4
1.2
1.0
0.8
0.6
0.4
0.2
0
Month
Concentration
of solid
material (mg/l)
BOD
(mg/l)

14. (continued)
(b) Describe the relationship between the concentration of solid material in
the river water and the BOD.
(c) After heavy rains in December, the concentration of solid material in
the water was found to be 10.0 mg/l.
What would be the expected BOD for this sample?
Tick (✓) the correct box.
7.5 mg/l
5.0 mg/l
1.75 mg/l
1.25 mg/l
DO NOT
WRITE IN
THIS
MARGIN
[0300/402]
KU PSMarks
Page twenty-three
1
1
[Turn over

15. Candytuft is a plant with white or pink flowers. The two forms of the gene
responsible for the flower colour are:
P = pink flowers and p = white flowers.
(a) A plant breeder crossed two pink flowered plants as shown below.
Parents Pp × Pp
(i) What is the expected ratio of pink to white flowered plants in the
offspring?
:
pink : white
(ii) If 48 offspring had been produced, how many white flowered
plants would have been expected?
Space for calculation
white flowered plants
(iii) The offspring actually consisted of 24 pink flowered and 16 white
flowered plants.
What is the simplest whole number ratio of pink to white
flowered plants in the offspring?
Space for calculation
:
pink : white
(iv) Suggest a reason for the difference between the expected ratio and
the observed ratio.
[0300/402]
KU PSMarks
DO NOT
WRITE IN
THIS
MARGIN
1
1
1
1
Page twenty-four

DO NOT
WRITE IN
THIS
MARGIN
15. (continued)
(b) What name is given to two different forms of a gene?
(c) Some plant characteristics show discontinuous variation. What is
meant by “discontinuous variation”?
Page twenty-five[0300/402]
KU PSMarks
1
1
[END OF QUESTION PAPER]

ADDITIONAL GRAPH FOR QUESTION 10 (b) (iii)
ADDITIONAL TIME LINE FOR QUESTION 12 (d)
Page twenty-six[0300/402]
Jan Feb Mar Apr May Jun Jul Aug Sep Oct Nov Dec
0 20 40 60 80 100 120 140 160 180 200
30
25
20
15
10
5
0
Work Rate (watts)
Breathing
Rate
(breaths/min)
Time line
KU PS
DO NOT
WRITE IN
THIS
MARGIN

ADDITIONAL CHART FOR QUESTION 14 (a)
Page twenty-seven[0300/402]
January March May September November
11
10
9
8
7
6
5
4
3
2
1
0
2.2
2.0
1.8
1.6
1.4
1.2
1.0
0.8
0.6
0.4
0.2
0
Month
Concentration
of solid
material (mg/l)
BOD
(mg/l)
KU PS
DO NOT
WRITE IN
THIS
MARGIN

SPACE FOR ANSWERS
AND FOR ROUGH WORKING
Page twenty-eight[0300/402]
KU PS
DO NOT
WRITE IN
THIS
MARGIN


![RNAi pathway components and function in Paramecium bursaria · 2021. 5. 20. · Paramecium tetaurelia Cid1 (Marker, 2014) [PTETP9100013001] Paramecium biaurelia [PBIGNP26212] Paramecium](https://static.fdocuments.in/doc/165x107/613a827d0051793c8c011555/rnai-pathway-components-and-function-in-paramecium-bursaria-2021-5-20-paramecium.jpg)


