#030 Effect of Increasing Axle Loads on Rail Fatigue Life ...
12
AREA Bulletin 685 Vol. 83 (1982) Effect of Increasing Axle Loads on Rail Fatigue Life by Allan M. Zarembski* EXECUTIVE SUMMARY This report presents the results of an investigation into the effects of increasing axle loads on the fatigue life of tangent, continuous welded rail (CWR). Two independent studies were conducted. The first utilized a statistical analysis technique, which obtained probability distribution curves for rail defect data. The second utilized a fatigue analysis methodology for the prediction of rail service life. Both techniques have shown good correlation between calculated results and service experience. For the first study, rail defect data was obtained from two mining railroads: one operating 100-ton car unit trains; the other 70-ton car unit trains. These were then compared with data from both a "typical" mixed freight traffic railroad and from FAST (l00-ton cars). For the second study, a rail fatigue life model was used to calculate the rail life under loadings that were representative of the same three types of operations. The results of both analyses show that increasing the axle loadings results in increased rail defect occurrences, with a corresponding decrease in rail fatigue life for tangent CWR. This reduction is by about 40% of the life of the rail, in million gross tons (MGT), when the loading is increased from 70-ton car (200,000 lb.)** to 100-ton car (236:000 lb.) loading conditions. This effect, which is seen for both heavy (132 lb.) and medium (119 lb.) rail sections is quite significant, and must be taken into account in any future studies and economic analysis. ACKLOWLEDGEMENTS The author would like to acknowledge the invaluable assistance of Mr. Tim Wells of the AAR for his work with the Rail Fatigue Life Analysis Program, and Mr. Rob Armstrong currently on loan to AAR from British Rail Research, for his aid in verifying the rail defect data analysis. The author would also like to express his sincere thanks to Mr. M. Rougas, Chief Engineer, Bessemer and Lake Erie Railroad, and Chairman, Engineering Division General Committee, 1980-1981, for his guidance and assistance in collecting the rail defect data. Finally, the author would like to express his thanks to Messrs. G. Liljeblad of the Duluth, Missabe and Iron Range Railway Co. and N. A. Vydykhan of the Quebec Cartier Mining Co. for the rail defect data and histories that formed such an important part of this investigation. INTRODUCTION Increasing freight car axle loads have long been recognized as a major contributor to increasing maintenance of way costs. However, recently the necessity of including all the costs associated with the operation of heavy cars has led to the need to better understand the effect of their operation on track life. In particular, the effect of increasing axle loads on rail life has emerged as a key issue. Rail life was historically determined by either end batter or head wear. However, with the increasing use of continuous welded rail (CWR), which eliminates rail joints, and with in- creasing traffic and wheel loads, the development of fatigue "defects" in the rail has emerged as an important replacement criterion for mainline track. In fact, for mainline tangent track, fatigue now appears to be the major replacement criterion for rail in service. 1,2
Transcript of #030 Effect of Increasing Axle Loads on Rail Fatigue Life ...

AREA Bulletin 685 Vol. 83 (1982)
Effect of Increasing Axle Loads on Rail Fatigue Life
by Allan M. Zarembski* EXECUTIVE SUMMARY
This report presents the results of an investigation into the effects of increasing axle loads on the fatigue life of tangent, continuous welded rail (CWR). Two independent studies were conducted. The first utilized a statistical analysis technique, which obtained probability distribution curves for rail defect data. The second utilized a fatigue analysis methodology for the prediction of rail service life. Both techniques have shown good correlation between calculated results and service experience.
For the first study, rail defect data was obtained from two mining railroads: one operating 100-ton car unit trains; the other 70-ton car unit trains. These were then compared with data from both a "typical" mixed freight traffic railroad and from FAST (l00-ton cars). For the second study, a rail fatigue life model was used to calculate the rail life under loadings that were representative of the same three types of operations.
The results of both analyses show that increasing the axle loadings results in increased rail defect occurrences, with a corresponding decrease in rail fatigue life for tangent CWR. This reduction is by about 40% of the life of the rail, in million gross tons (MGT), when the loading is increased from 70-ton car (200,000 lb.)** to 100-ton car (236:000 lb.) loading conditions. This effect, which is seen for both heavy (132 lb.) and medium (119 lb.) rail sections is quite significant, and must be taken into account in any future studies and economic analysis.
ACKLOWLEDGEMENTS
The author would like to acknowledge the invaluable assistance of Mr. Tim Wells of the AAR for his work with the Rail Fatigue Life Analysis Program, and Mr. Rob Armstrong currently on loan to AAR from British Rail Research, for his aid in verifying the rail defect data analysis.
The author would also like to express his sincere thanks to Mr. M. Rougas, Chief Engineer, Bessemer and Lake Erie Railroad, and Chairman, Engineering Division General Committee, 1980-1981, for his guidance and assistance in collecting the rail defect data.
Finally, the author would like to express his thanks to Messrs. G. Liljeblad of the Duluth, Missabe and Iron Range Railway Co. and N. A. Vydykhan of the Quebec Cartier Mining Co. for the rail defect data and histories that formed such an important part of this investigation. INTRODUCTION
Increasing freight car axle loads have long been recognized as a major contributor to increasing maintenance of way costs. However, recently the necessity of including all the costs associated with the operation of heavy cars has led to the need to better understand the effect of their operation on track life. In particular, the effect of increasing axle loads on rail life has emerged as a key issue.
Rail life was historically determined by either end batter or head wear. However, with the increasing use of continuous welded rail (CWR), which eliminates rail joints, and with in- creasing traffic and wheel loads, the development of fatigue "defects" in the rail has emerged as an important replacement criterion for mainline track. In fact, for mainline tangent track, fatigue now appears to be the major replacement criterion for rail in service.1,2

AREA Bulletin 685 Vol. 83 (1982)
Recent studies have led to the development of various techniques for analyzing and predicting the life of rail in track. For tangent, mainline (CWR) track, two major techniques have emerged. The first technique involves the statistical analysis of rail defect data to obtain probability distribution curves.3,4 The second technique utilizes a fatigue analysis methodology for the prediction of rail service life.1,5 Both techniques have shown good correlation between the calculated results and service experience.
In order to examine the effect of increasing axle loads on the service life of tangent, continuous welded rail, both of these analytical techniques were used. To accomplish this, rail defect data was obtained from various railroads operating equipment with different axle loadings. In particular, two mining railroads, operating unit trains with different axle loads, were studied and compared to a "typical" mixed traffic railroad. Concurrently, a rail fatigue life model was utilized to calculate the rail life, under load spectra representative of the same three types of operations. The results of these analyses are presented in this report. RAIL DEFECT STUDY
Analysis of rail defect data has shown that the probability of occurrence of rail defects, as a function of tonnage (MGT),* follows a Weibull distribution.3,4 This means that rail defect data, specifically cumulative defect data can be shown to form a linear relationship with accumulated MGT, when the defect probability is plotted against MGT on a Weibull scale (Figure 1).
Since the rail defect probability (PD) is simply the cumulative number of defects found in the test section, divided by the number of rails in the test section + 1 (e.g., 271 rails per track mile), and the rail usage is the accumulated tonnage (in MGT) at the time the defect was found, rail defect data can be readily reduced to and displayed in the format shown in Figure 1.
In order to use this approach to examine the effect of axle loads on tangent CWR life, rail defect data was obtained from two mining railroads utilizing different axle loads. The first railroad, the Duluth, Missabe and Iron Range Railway Company (DM & IR), operates 70-ton car unit train traffic, in which 95% of the tonnage is carried in unit trains of either 178,400 or 205,000 lb. gross car weights. The rail defect data was taken from a thirteen mile stretch of tangent track, laid in 1967 with 132 lb. CWR. As of 1980, the total tonnage over that track was 304 MGT.
The second railroad, operated by the Quebec Cartier Mining Company (QC), operates 100-ton, 263,000 lb. gross car weight, unit trains. The rail defect data was taken from 51.5 miles of tangent track, laid in 1973 with 132 lb. CWR. As of 1980, the total tonnage over that track was 162 MGT. The defect data, tonnage data and rail defect probabilities are presented in Table 1, for the DM & IR Railway, and in Table 2, for the QC Mining Co. In both cases, all rail defects, except for some early failures attributed to the welding plant, are included in the tabulations. All of the rail studied was standard carbon, 132 lb. CWR.
Additional data were also available from published sources. These include mixed traffic loadings of 136 lb. CWR, taken from the New Mexico Division of the Atchison, Topeka and Santa Fe Railway Co. (Site No.2. Reference4) and shown in Table 3. The track had accumulated 640 MGT by 1978, and consist of predominantly tangent track with a small percentage of slight curves. Also included are data taken from the Facility for Accelerated Service Testing (FAST) at Pueblo, Colorado. At FAST, a test train, consisting primarily of 100-ton 263,000 lb. freight cars, is used to accumulate tonnage on the test track. A section of tangent, standard carbon rail in Test Section 22 provided additional defect data on 136 lb. rail.6 shown in Table 4.
* Million Gross Tons

AREA Bulletin 685 Vol. 83 (1982)

AREA Bulletin 685 Vol. 83 (1982)
TABLE 1. Rail Defect Data from the Duluth, Missabe and Iron Range Railway
*PD = ⎟
⎠⎞
⎜⎝⎛
+1ni where n = 3520 rails (13 miles)
TABLE 2. Rail Defect Data from the Quebec Cartier Mining Co.
*PD = ⎟
⎠⎞
⎜⎝⎛
+1ni , where n = 13.945 rails (51.5 miles)
MGT ALL
DEFECTS CUMULATIVE
DEFECTS (i) PD* 13 1 1 0.0003 37 0 – – 61 1 2 0.0006 88 0 – – 109 0 – – 130 0 – – 155 0 – – 182 3 5 0.0014 202 2 7 0.0020 222 2 9 0.0026 237 2 11 0.0031 261 3 14 0.0040 284 2 16 0.0045 304 5 21 0.0060
MGT ALL
DEFECTS CUMULATIVE
DEFECTS (i) PD* 0.5 1 1 0.00007 1 1 2 0.00014 6 2 4 0.00029 31 1 5 0.00036 34 2 7 0.0005 39 6 13 0.0009 60 1 14 0.0010 84 4 18 0.0013 88 4 22 0.0016 100 3 25 0.0018 104 3 28 0.0020 109 3 31 0.0022 117 1 32 0.0023 137 4 36 0.0026 142 1 37 0.00265 154 1 38 0.0027 158 7 45 0.0032 162 10 55 0.0039
AREA Bulletin 685 Vol. 83 (1982)
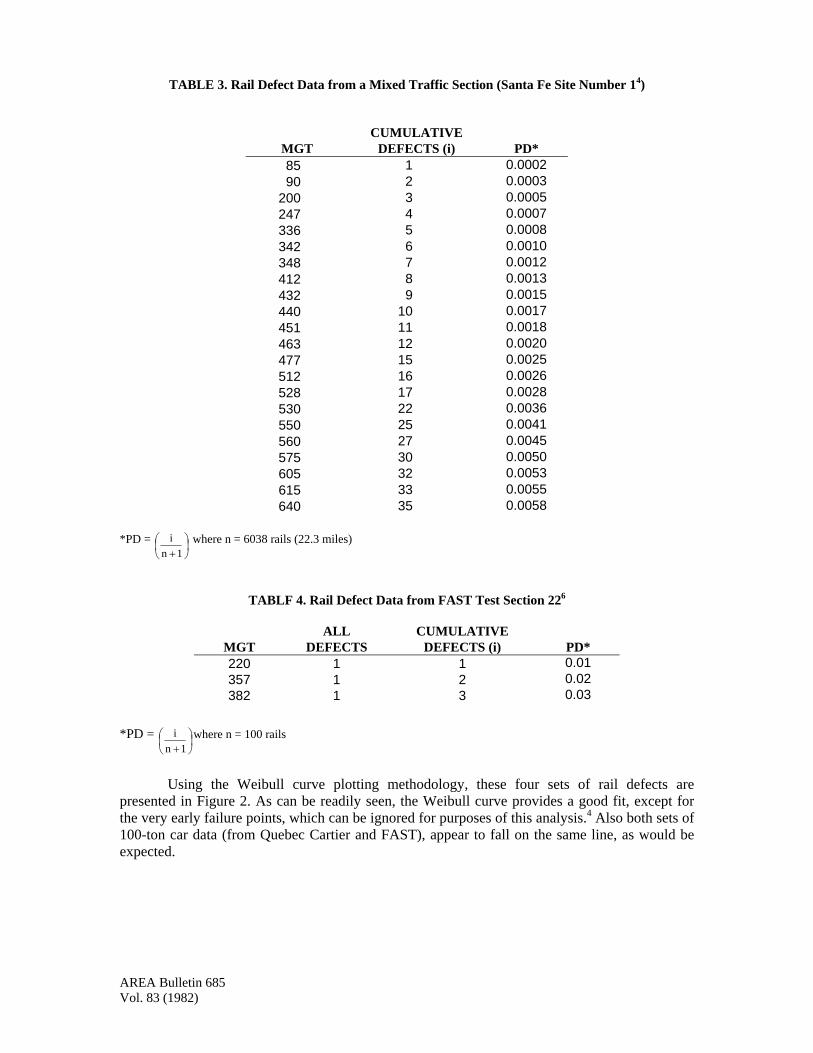
TABLE 3. Rail Defect Data from a Mixed Traffic Section (Santa Fe Site Number 14)
*PD = ⎟
⎠⎞
⎜⎝⎛
+1ni where n = 6038 rails (22.3 miles)
TABLF 4. Rail Defect Data from FAST Test Section 226
*PD = ⎟
⎠⎞
⎜⎝⎛
+1ni where n = 100 rails
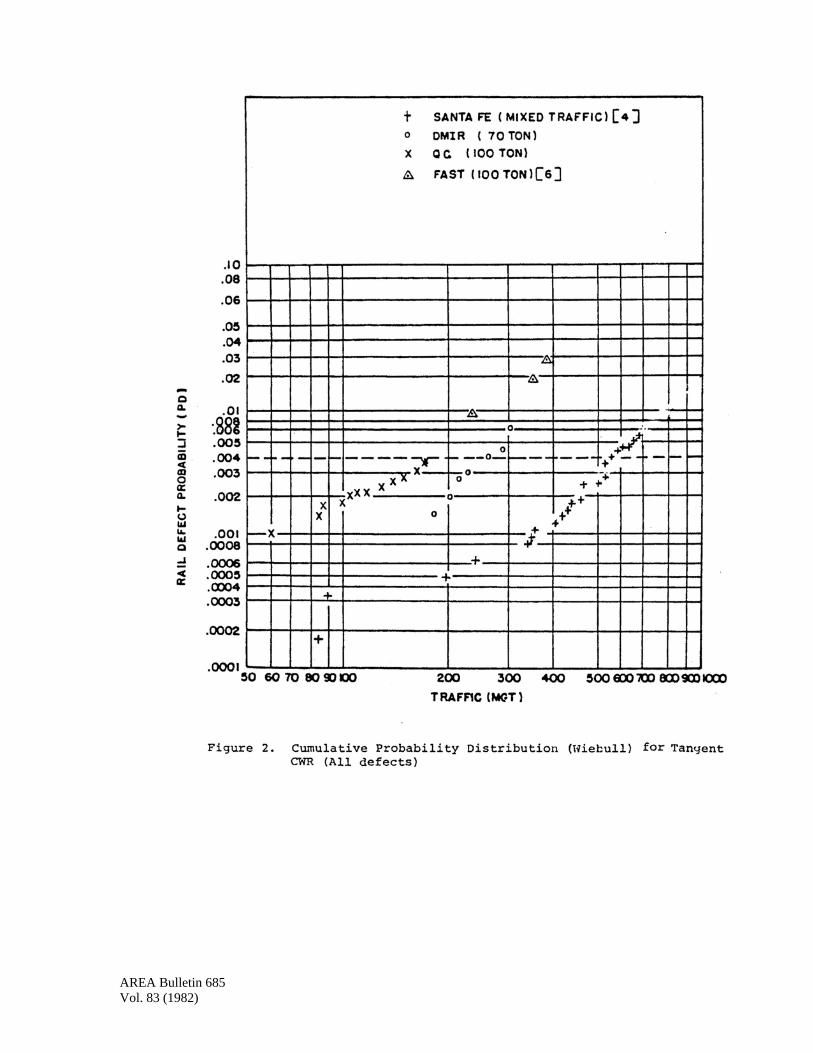
Using the Weibull curve plotting methodology, these four sets of rail defects are
presented in Figure 2. As can be readily seen, the Weibull curve provides a good fit, except for the very early failure points, which can be ignored for purposes of this analysis.4 Also both sets of 100-ton car data (from Quebec Cartier and FAST), appear to fall on the same line, as would be expected.
MGT CUMULATIVE
DEFECTS (i) PD* 85 1 0.0002 90 2 0.0003 200 3 0.0005 247 4 0.0007 336 5 0.0008 342 6 0.0010 348 7 0.0012 412 8 0.0013 432 9 0.0015 440 10 0.0017 451 11 0.0018 463 12 0.0020 477 15 0.0025 512 16 0.0026 528 17 0.0028 530 22 0.0036 550 25 0.0041 560 27 0.0045 575 30 0.0050 605 32 0.0053 615 33 0.0055 640 35 0.0058
MGT ALL
DEFECTS CUMULATIVE
DEFECTS (i) PD* 220 1 1 0.01 357 1 2 0.02 382 1 3 0.03
AREA Bulletin 685 Vol. 83 (1982)

AREA Bulletin 685 Vol. 83 (1982)
In Figure 2, the heavy axle loadings show a more severe (to the left) occurrence of rail defects. In particular, the 100-ton car unit train loadings are more severe than the 70-toncar unit train loadings, which in turn are more severe than the mixed traffic loadings. Note that the mixed traffic site represents an "average" dynamic wheel load of approximately 15 Kips,* which would correspond to a gross car weight of 120,000 Ins., significantly less than for the 70-ton unit train cars. Thus, data shows that increasing axle loads result in higher numbers of defects for equivalent cumulative tonnages. RAIL MODEL STUDY
Concurrent with the development of the rail defect probability approach, a second methodology was developed for the analysis of the fatigue life of rail in service. This analysis is based on calculation of the initiation time for a fatigue defect in a railhead on tangent CWR track. By combining the traffic load characterization, calculated rail head stresses, material properties of the rail steel and linear cumulative damage fatigue theory, it enables the user to calculate the fatigue life of rail, for given types of service environments.1,5
In order to examine independently the effect of axle .loadings on rail fatigue life, the life of rail subject to 100 and 70-ton car unit train operations and "typical" mixed freight type operations was calculated.
This was done by means of a modified version of the Fatigue Life Analysis Program.7 The primary differences between the three cases were the input load spectra, which represented the wheel-rail load environments experienced by the rail in track. Figure 3 shows the three wheel-rail load spectra used in this analysis, presented in the form of cumulative probability curves. The 100-ton car unit train data was taken from the Facility for Accelerated Service Testing (FAST), where the vertical wheel loads were measured as the train, consisting of 100-ton cars, passed by. The 70-ton car unit train spectrum was obtained by scaling down the 100-ton spectrum by an appropriate ratio. The mixed freight load spectrum was obtained by monitoring instrumented track sites on the Union Pacific Railroad.1
The resulting fatigue life, in MGT, for 136 lb. CWR is given in Table 5, together with the ratios of the fatigue lives for three classes of traffic. It must be noted that the definition of rail fatigue life, as defined by the analytical approach, is the point at which the absolute number of defects and the rate of defect occurrence increases sharply.1,5 Thus, while the calculated values of the fatigue lives for the three cases may not always coincide with measured values, the ratio of the calculated values, as given in Table 5, present a useful set of data for comparative study. It can be readily seen that the heavy axle loadings decrease the fatigue life of the rail.
*Based on the averaging of "typical" mixed freight traffic spectra, such as shown in Figure 3. This mix includes a small percentage of 100-ton cars.
TABLE 5. Calculated Rail Fatigue Lives (136 lb Rail)
Fatigue Life, in MGT (136 lb. Rail)
Ratio w.r.t.* 100-ton cars
Ratio w.r.t.* 70-ton cars
Ratio w.r.t.* Mixed Freight
100-ton car Unit Trains 267 1.0 0.64 0.46 70-ton car Unit Trains 416 1.56 1.0 0.72 Mixed Freight 580 2.17 1.39 1.0 *with respect to

AREA Bulletin 685 Vol. 83 (1982)
AREA Bulletin 685 Vol. 83 (1982)
RESULTS In analyzing the results, using both the defect cumulative probability approach and the fatigue
analysis methodology, it is quite apparent that increased axle loadings result in an increased incidence of rail defect occurrences, with a corresponding decrease in the fatigue life of tangent CWR.
This is quite evident from Table 5, where the life of rail under 100-ton cars, as currently designed, is calculated to be about 64% of the life of rail under 70-ton cars. Furthermore, according to this analysis, even the 70-ton car unit train traffic results in a significantly shorter rail life than that normally experienced by "typical" mixed freight traffic. In this case, the rail life is reduced to 70% of the corresponding value for mixed traffic, while the l00-ton car unit train traffic reduced the rail life to only 46% of the corresponding value for mixed freight traffic. These represent significant reductions in rail life.
These figures are firmly supported by the separate analysis of rail defect data, using the cumulative probability approach. These results, which were presented in Figure 2, show that increased axle loads shift the cumulative defect (PD) curves, with the earlier and more severe occurrence of defects corresponding to the heavier axle loads. In order to obtain corresponding ratios of rail life for these analyses, the 0.004 PD point, which corresponds to a cumulative defect occurrence of one per mile, was examined. It should be further noted that this 0.004 PD point corresponds approximately to the fatigue life value calculated by the fatigue analysis methodology.2 Thus, it is an appropriate point on the PD curve to compare with the fatigue calculations. Examination of the defect data in Figure 2 (Tables 1-4) shows that the 0.004 PD point occurred as follows:
100-ton car Unit Train (QC) 162 MGT 70-ton car Unit Train (DMIR) 261 MGT Mixed Traffic (SF # I) 550 MGT
Thus, the life (0.004 PD point) of rail under 100-ton cars is 62% of the life of rail under 70-ton curs. Similarly, it is seen that the life (0.004 PD point) of rail under 70-ton cars is about half of the life of rail under mixed freight traffic.
In both analyses, the calculated fatigue life of rail in tangent CWR track was reduced by about 40% when the axle loadings were increased from 70-ton cars to 100-ton cars.
This effect is further supported by the consensus of the General Committee of the Engineering Division of the AAR 9 (see Appendix), where the general rule-of-thumb is: "The life of continuous welded rail on tangent track, measured in MGT, under 263,000 lb. (100-ton)* cars is approximately 5/8 (62.5%)* of the corresponding rail life under 220,000 lb. (70-ton)* cars." Finally, additional studies on the effects of very heavy axle loadings, e.g., 125-ton cars,8 also show that there is a significant decrease in rail life. This can be clearly seen in Figure 4, where the percentage failure of the rail defects (100 x PD) is plotted on a Weibull curve for both 125-ton car unit train traffic (Waynesburg Southern) and for mixed traffic (Santa Fe Site #2).4,8 This shows that lighter rail sections, such as 119 lb. rail, are subject to the same significant effect of axle loading on rail life.
Thus, it may be concluded that an increase in axle loading will result in a decrease in rail fatigue life, measured in terms of cumulative tonnage, and this reduction appears to occur for both heavy and lighter rail sections.
When the axle loading is increased from 27.5 to 33 tons, corresponding to an increase from 70 to 100-ton cars, the resulting decrease in rail life is approximately 40%. This effect is quite significant, and must he taken into account in any future studies and economic analyses.
While measures can he taken to increase rail life, such as increasing rail section size, improving material properties, or by reducing stresses on rail by the use of dynamically more stable cars, these measures do entail increased costs. Even so, the extent of these improvements is still not fully defined. *author's parentheses

AREA Bulletin 685 Vol. 83 (1982)

AREA Bulletin 685 Vol. 83 (1982)
REFERENCES 1. Zarembski, A. M., "Effect of Rail Section and Traffic on Rail Fatigue Life," Bulletin
of the American Railway Engineering Association, Volume 80, 1979.
2. Wells, T. R., and Gudiness, T. A., "Rail Performance Model: Technical Background and Preliminary Results," Association of American Railroads, Research Report No. R-474, March 1981.
3. Besuner, P. M., et al., "Probability Analysis of Rail Defect Data," Heavy Haul Railways Conference, Perth, Western Australia, September, 1979.
4. Besumer, P. M., et al, "Statistical Analysis of Rail Defect Data," Association of American Railroads, Research Report No. R-302, June 1978.
5. Zarembski, A. M., and Abbott, R. A., "Fatigue Analysis of Rail Subject to Traffic and Temperature Loading," Heavy Haul Railways Conference, Perth, Western Australia, September, 1979.
6. "Evaluation of Rail Wear at the Facility for Accelerated Service Testing," FAST Technical Note, FAST/TTC/TN-80/4, March 1980.
7. Abbott, R. A., and Zarembski, A. M., "User's Manual, Rail Fatigue Life Program," Association of American Railroads, Research Report No. R-336, January, 1980.
8. Stone, D. H., "Comparison of Rail Behavior with 125-Ton and 100)-Ton Cars," Bulletin of the American Railway Engineering Association, Volume 81, 1980.
9. AREA News, Railway Track & Structures, May 1981.

AREA Bulletin 685 Vol. 83 (1982)
APPENDIX
RESOLUTION9
The General Committee of the Engineering Division of the AAR meeting on March 22, 1981, and in response to the Cost and Analysis Organization of the Economics and Finance Department of the AAR offers the opinion below. This opinion is based on the practical experience, with presently in-use equipment, of those on the Committee. It in no way implies that a 203,000 lb. or heavier car may not be an optimum gross weight on four axles from an overall railroad standpoint. The optimum axle load for any particular situation is subject to the analysis of the individual details of that situation. Much heavier cars than 203,000 lb. on four axles have been and are safely operated under various conditions. As more physical data are developed, these statements may change.
Keeping in mind the above statements, the following is offered as a general rule of thumb, regarding maintenance of way costs alone:
The life of continuous welded rail on tangent track measured in MGT under 263,000 lb. cars is approximately 5/8 of rail life under 220,000 lb. cars. The other variable maintenance of way costs, per MGT, will be increased 20% for 263.000 lb. cars vs. 220,000 lb. cars on heavy duty track in good condition. This percentage will increase as the condition of a given track decreases, and on poor track, the cost of maintenance may be several times higher for 263,000 lb. cars than for 220,000 lb. cars.