025.057.106 021.067.132 FY2018 036.083.161 PRELIMINARY … · 456.3 491.3 FY17 FY18 FY2018 –...
30
FY2018 PRELIMINARY RESULTS November 16, 2018
Transcript of 025.057.106 021.067.132 FY2018 036.083.161 PRELIMINARY … · 456.3 491.3 FY17 FY18 FY2018 –...

051.102.204
150.150.150
000.204.153
255.204.000
000.102.204 153.204.255
235.185.052
036.083.161
227.230.232
083.086.090
021.067.132
149.154.162
255.153.000
025.057.106
FY2018 PRELIMINARY RESULTS
November 16, 2018

051.102.204
150.150.150
000.204.153
255.204.000
000.102.204 153.204.255
235.185.052
036.083.161
227.230.232
083.086.090
021.067.132
149.154.162
255.153.000
025.057.106
1
Disclaimer
Stabilus S.A. (the “Company“, later “Stabilus”) has prepared this presentation solely for your information. It should not be treated as giving investment
advice. Neither the Company, nor any of its directors, officers, employees, direct or indirect shareholders and advisors nor any other person shall have
any liability whatsoever for any direct or indirect losses arising from any use of this presentation.
While the Company has taken all reasonable care to ensure that the facts stated in this presentation are accurate and that the opinions contained in it
are fair and reasonable, this presentation is selective in nature. Any opinions expressed in this presentation are subject to change without notice and
neither the Company nor any other person is under any obligation to update or keep current the information contained in this presentation. Where this
presentation quotes any information or statistics from any external source, you should not interpret that the Company has adopted or endorsed such
information or statistics as being accurate. This presentation contains forward-looking statements, which involve risks, uncertainties and assumptions
that could cause actual results, performance or events to differ materially from those described in, or expressed or implied by, such statements. These
statements reflect the Company’s current knowledge and its expectations and projections about future events and may be identified by the context of
such statements or words such as “anticipate,” “believe”, “estimate”, “expect”, “intend”, “plan”, “project” and “target”. No obligation is assumed to
update any such statement.

051.102.204
150.150.150
000.204.153
255.204.000
000.102.204 153.204.255
235.185.052
036.083.161
227.230.232
083.086.090
021.067.132
149.154.162
255.153.000
025.057.106
2
Agenda
1. Financial highlights
2. Results by region
3. Results by market
4. Outlook
5. Appendix

051.102.204
150.150.150
000.204.153
255.204.000
000.102.204 153.204.255
235.185.052
036.083.161
227.230.232
083.086.090
021.067.132
149.154.162
255.153.000
025.057.106
3
Agenda
2.
3.
4.
1. Financial highlights
4.
5.

051.102.204
150.150.150
000.204.153
255.204.000
000.102.204 153.204.255
235.185.052
036.083.161
227.230.232
083.086.090
021.067.132
149.154.162
255.153.000
025.057.106
4
FY2018 highlights
Fiscal year-end September
Revenue up by 5.8% to €962.6m (+€52.6m vs. FY17); revenue growth w/o FX: +8.8% y/y
Asia / Pacific and RoW up by 19.5% y/y, Europe up by 7.7% y/y, NAFTA - 0.7% y/y (+ 7.0% y/y w/o FX)
Automotive Powerise + 10.3% y/y, Commercial Furniture + 8.6% y/y, Vibration & Velocity Control + 8.2% y/y,
Capital Goods + 7.6% y/y and Automotive Gas Spring + 0.5% y/y
Revenue
Adj. EBIT1 up by 8.5% to €149.3m (vs. €137.6m in FY17)
Adj. EBIT margin at 15.5% (vs. 15.1% in FY17)
Adj. EBIT
Net leverage ratio1 at 1.1x (vs. 1.5x as of end FY17)
Net financial debt1 at €199.2m Net leverage ratio
Profit at €105.4m in FY18 (vs. €79.2m in FY17)
Profit margin at 10.9% (vs. 8.7% in FY17)
Earnings per share at €4.27 (vs. €3.21 in FY17)
Profit
Note:
1 For definition/calculation of KPIs like adj. EBIT, net leverage ratio etc. refer to appendix and/or our financial reports and quarterly statements under www.ir.stabilus.com.
FX = currency effect resulting from translation of NAFTA revenue from USD to EUR. Avg. fx rate of 1.16$/€ in Q4 FY18 versus 1.18$/€ in Q4 FY17.
Numbers rounded to one decimal. Due to rounding, numbers presented may not add up precisely to the totals provided.
FY2019 revenue outlook: c. 5% y/y at constant $/€ rate vs. FY18 of 1.19; STAR 2025 mid- and long-term
guidance for average annual growth of at least 6% confirmed
FY2019 adj. EBIT margin forecasted at c. 15.5%
Outlook

051.102.204
150.150.150
000.204.153
255.204.000
000.102.204 153.204.255
235.185.052
036.083.161
227.230.232
083.086.090
021.067.132
149.154.162
255.153.000
025.057.106
5
10.2
32.8
Q4 FY17 Q4 FY18
25.2
28.3
Q4 FY17 Q4 FY18
220.9
230.8
Q4 FY17 Q4 FY18
34.2 36.6
Q4 FY17 Q4 FY18
Stabilus shows strong operating performance in Q4 FY2018 (y-o-y)
Revenue (€m) Adj. EBIT (€m)
FCF (€m)
15.5% 15.9%
% margin
11.4% 12.3%
% revenue
Note: FX = currency effect resulting from translation of NAFTA revenue from USD to EUR. Avg. fx rate of 1.16$/€ in Q4 FY18 versus 1.18$/€ in Q4 FY17.
Profit (€m)
4.6% 14.2%
% margin
FX: 1.6
w/o FX:
229.2
+ 3.8%
051.102.204
150.150.150
000.204.153
255.204.000
000.102.204 153.204.255
235.185.052
036.083.161
227.230.232
083.086.090
021.067.132
149.154.162
255.153.000
025.057.106
6
79.2
105.4
FY17 FY18
77.8
100.2
FY17 FY18
910.0 962.6
FY17 FY18
137.6 149.3
FY17 FY18
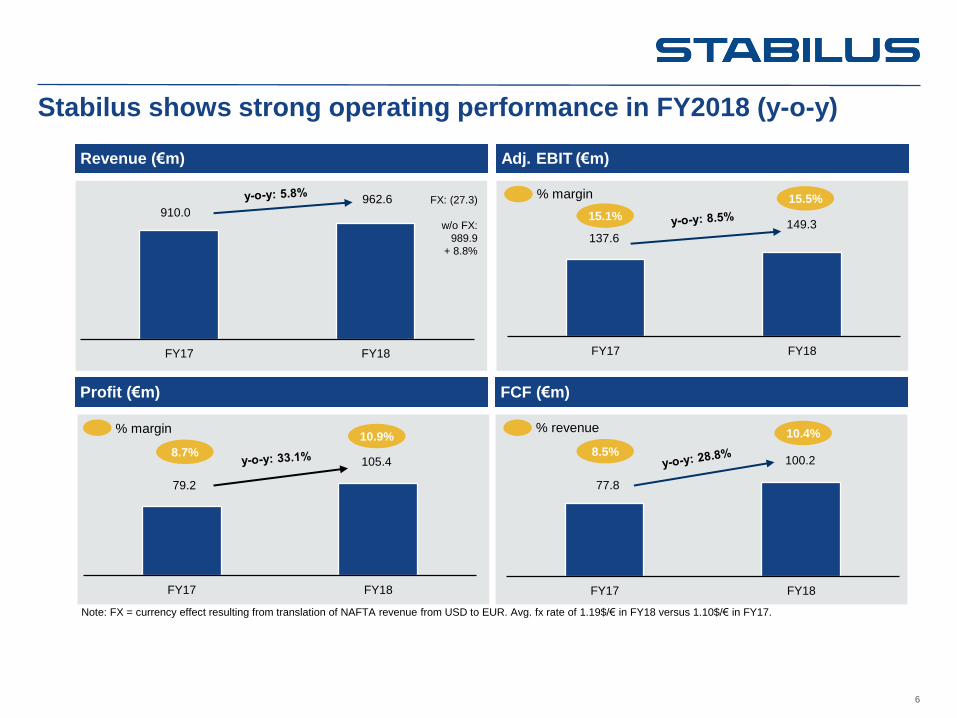
Stabilus shows strong operating performance in FY2018 (y-o-y)
Revenue (€m) Adj. EBIT (€m)
FCF (€m)
15.1%
15.5% % margin
8.5%
10.4% % revenue
Note: FX = currency effect resulting from translation of NAFTA revenue from USD to EUR. Avg. fx rate of 1.19$/€ in FY18 versus 1.10$/€ in FY17.
Profit (€m)
8.7%
10.9% % margin
FX: (27.3)
w/o FX:
989.9
+ 8.8%
051.102.204
150.150.150
000.204.153
255.204.000
000.102.204 153.204.255
235.185.052
036.083.161
227.230.232
083.086.090
021.067.132
149.154.162
255.153.000
025.057.106
7
Agenda
3.
4.
1.
2. Results by region
4.
5.

051.102.204
150.150.150
000.204.153
255.204.000
000.102.204 153.204.255
235.185.052
036.083.161
227.230.232
083.086.090
021.067.132
149.154.162
255.153.000
025.057.106
8
110.9 114.3
83.1 86.2
27.0 30.2
220.9
230.8
Q4 FY17 Q4 FY18
Europe NAFTA Asia / Pacific and RoW
17.9 19.3
12.5 12.6
3.7 4.6
34.2
36.6
Q4 FY17 Q4 FY18
Europe NAFTA Asia / Pacific and RoW
Q4 FY2018 revenue and adj. EBIT growth – by region (y-o-y)
11.9%
3.7%
3.1%
Revenue by region1 (€m) Adj. EBIT by region (€m)
24.3%
0.8%
7.8%
Note: Stabilus fiscal year-end is September. Numbers rounded to one decimal. Due to rounding, numbers presented may not add up precisely to the totals provided.
FX = currency effect resulting from translation of NAFTA revenue from USD to EUR. Avg. fx rate of 1.16$/€ in Q4 FY18 versus 1.18$/€ in Q4 FY17.
1 Billed-from view, without intersegment revenue.
Growth Growth
w/o FX:
+ 1.8%
051.102.204
150.150.150
000.204.153
255.204.000
000.102.204 153.204.255
235.185.052
036.083.161
227.230.232
083.086.090
021.067.132
149.154.162
255.153.000
025.057.106
9
456.3 491.3
350.7 348.1
103.0 123.1
910.0
962.6
FY17 FY18
Europe NAFTA Asia / Pacific and RoW
68.0 77.4
55.1 51.9
14.5
20.0
137.6
149.3
FY17 FY18
Europe NAFTA Asia / Pacific and RoW
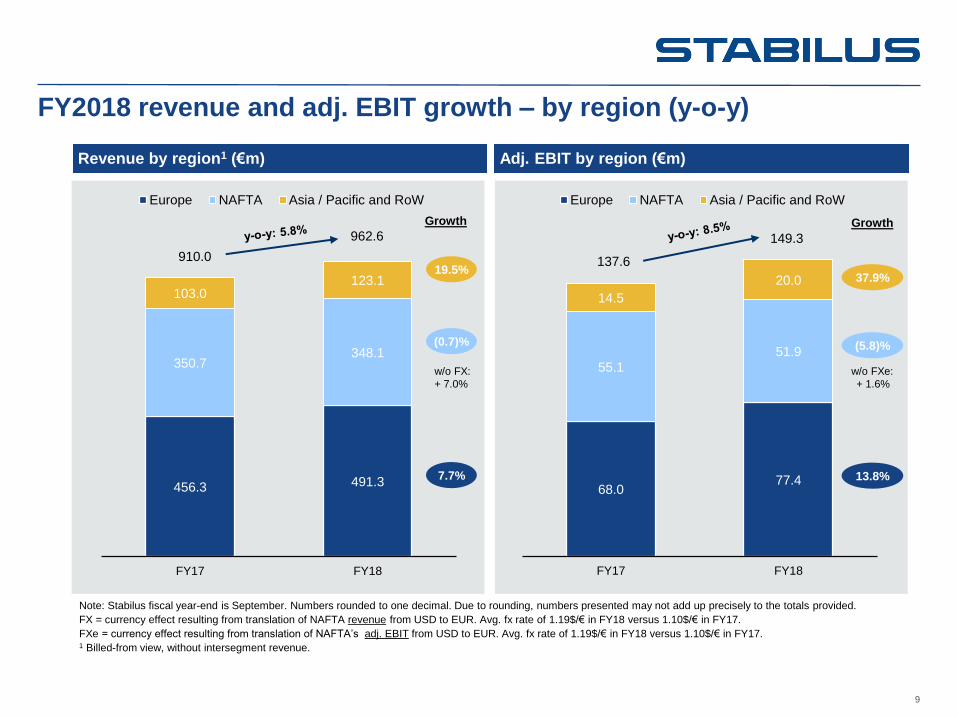
FY2018 revenue and adj. EBIT growth – by region (y-o-y)
19.5%
(0.7)%
7.7%
Revenue by region1 (€m) Adj. EBIT by region (€m)
37.9%
(5.8)%
13.8%
Note: Stabilus fiscal year-end is September. Numbers rounded to one decimal. Due to rounding, numbers presented may not add up precisely to the totals provided.
FX = currency effect resulting from translation of NAFTA revenue from USD to EUR. Avg. fx rate of 1.19$/€ in FY18 versus 1.10$/€ in FY17.
FXe = currency effect resulting from translation of NAFTA’s adj. EBIT from USD to EUR. Avg. fx rate of 1.19$/€ in FY18 versus 1.10$/€ in FY17. 1 Billed-from view, without intersegment revenue.
Growth Growth
w/o FX:
+ 7.0%
w/o FXe:
+ 1.6%
051.102.204
150.150.150
000.204.153
255.204.000
000.102.204 153.204.255
235.185.052
036.083.161
227.230.232
083.086.090
021.067.132
149.154.162
255.153.000
025.057.106
10
68.0 77.4
FY17 FY18
456.3
491.3
FY17 FY18
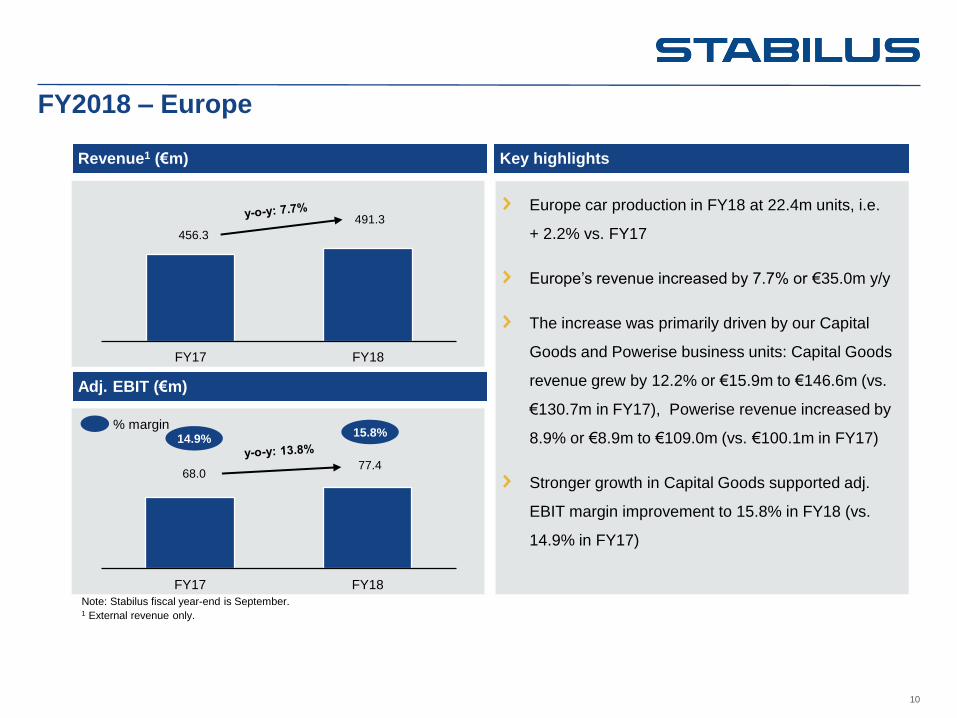
FY2018 – Europe
Revenue1 (€m) Key highlights
Note: Stabilus fiscal year-end is September. 1 External revenue only.
Europe car production in FY18 at 22.4m units, i.e.
+ 2.2% vs. FY17
Europe’s revenue increased by 7.7% or €35.0m y/y
The increase was primarily driven by our Capital
Goods and Powerise business units: Capital Goods
revenue grew by 12.2% or €15.9m to €146.6m (vs.
€130.7m in FY17), Powerise revenue increased by
8.9% or €8.9m to €109.0m (vs. €100.1m in FY17)
Stronger growth in Capital Goods supported adj.
EBIT margin improvement to 15.8% in FY18 (vs.
14.9% in FY17)
Adj. EBIT (€m)
% margin 14.9%
15.8%
051.102.204
150.150.150
000.204.153
255.204.000
000.102.204 153.204.255
235.185.052
036.083.161
227.230.232
083.086.090
021.067.132
149.154.162
255.153.000
025.057.106
11
55.1 51.9
FY17 FY18
% margin 14.9%
350.7 348.1
FY17 FY18
FX: (27.3)
w/o FX:
375.4
+7.0%
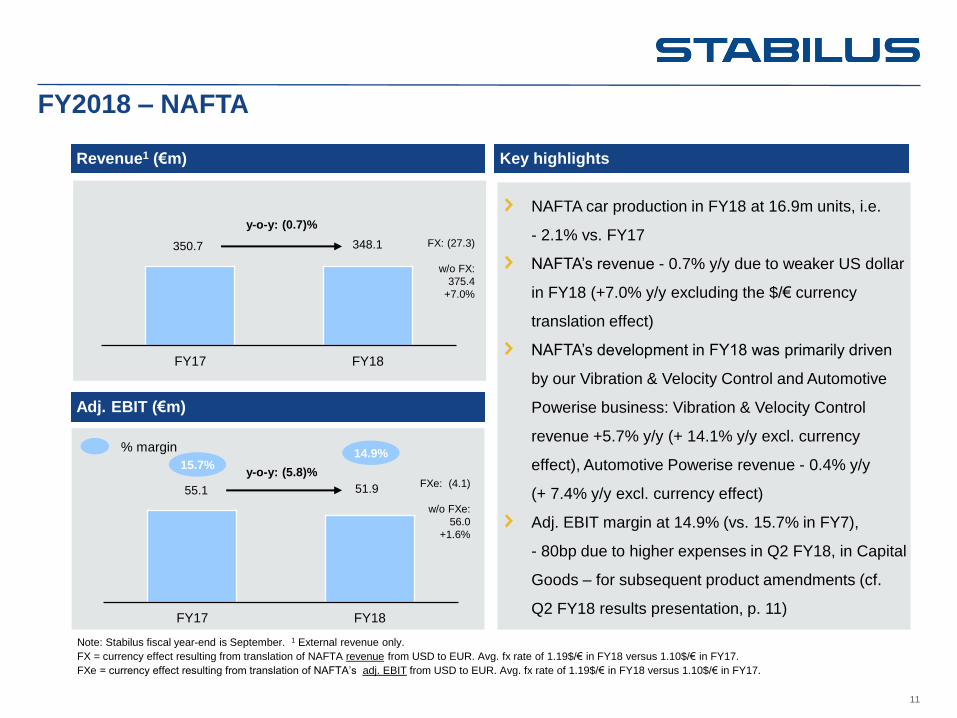
FY2018 – NAFTA
Revenue1 (€m) Key highlights
NAFTA car production in FY18 at 16.9m units, i.e.
- 2.1% vs. FY17
NAFTA’s revenue - 0.7% y/y due to weaker US dollar
in FY18 (+7.0% y/y excluding the $/€ currency
translation effect)
NAFTA’s development in FY18 was primarily driven
by our Vibration & Velocity Control and Automotive
Powerise business: Vibration & Velocity Control
revenue +5.7% y/y (+ 14.1% y/y excl. currency
effect), Automotive Powerise revenue - 0.4% y/y
(+ 7.4% y/y excl. currency effect)
Adj. EBIT margin at 14.9% (vs. 15.7% in FY7),
- 80bp due to higher expenses in Q2 FY18, in Capital
Goods – for subsequent product amendments (cf.
Q2 FY18 results presentation, p. 11)
y-o-y: (0.7)%
Adj. EBIT (€m)
y-o-y: (5.8)%
Note: Stabilus fiscal year-end is September. 1 External revenue only.
FX = currency effect resulting from translation of NAFTA revenue from USD to EUR. Avg. fx rate of 1.19$/€ in FY18 versus 1.10$/€ in FY17.
FXe = currency effect resulting from translation of NAFTA’s adj. EBIT from USD to EUR. Avg. fx rate of 1.19$/€ in FY18 versus 1.10$/€ in FY17.
15.7%
FXe: (4.1)
w/o FXe:
56.0
+1.6%

051.102.204
150.150.150
000.204.153
255.204.000
000.102.204 153.204.255
235.185.052
036.083.161
227.230.232
083.086.090
021.067.132
149.154.162
255.153.000
025.057.106
12
14.5
20.0
FY17 FY18
103.0
123.1
FY17 FY18
FY2018 – Asia / Pacific and RoW
Revenue1 (€m) Key highlights
Asia/Pacific and RoW car production in FY18 at
56.7m units, i.e. + 1.5% vs. FY17 (China: + 1.0%,
Japan/Korea: - 3.1%, South America: + 11.0%)
Asia/Pacific and RoW’s revenue increased by 19.5%
The increase was primarily driven by our Powerise
business: Powerise revenue grew from €5.8m in
FY17 to €22.4m in FY18 reflecting increased
shipments to VW, GM, Chrysler as well as local
Chinese OEMs
Adj. EBIT margin improved from 14.1% in FY17 to
16.2% in FY18 primarily due to higher capacity
utilization of the Powerise line in China
Note: Stabilus fiscal year-end is September. 1 External revenue only.
Adj. EBIT (€m)
% margin
14.1% 16.2%
051.102.204
150.150.150
000.204.153
255.204.000
000.102.204 153.204.255
235.185.052
036.083.161
227.230.232
083.086.090
021.067.132
149.154.162
255.153.000
025.057.106
13
Agenda
2.
4.
1.
3. Results by market
4.
5.

051.102.204
150.150.150
000.204.153
255.204.000
000.102.204 153.204.255
235.185.052
036.083.161
227.230.232
083.086.090
021.067.132
149.154.162
255.153.000
025.057.106
14
141.3 146.9
79.6 83.9
220.9
230.8
Q4 FY17 Q4 FY18
Automotive Industrial¹
w/o FX:
+ 4.6%
w/o FX:
+ 3.3%
Q4 FY2018 revenue growth – by market / business (y-o-y)
Revenue by business (€m)
Note: Stabilus fiscal year-end is September. 1 Industrial including Capital Goods, Vibration & Velocity Control and Commercial Furniture revenue.
FX = currency effect resulting from translation of NAFTA revenue from USD to EUR. Avg. fx rate of 1.16$/€ in Q4 FY18 versus 1.18$/€ in Q4 FY17.
Numbers rounded to one decimal. Due to rounding, numbers presented may not add up precisely to the totals provided.
5.4%
4.0%
Growth
% o
f re
ve
nu
e
bre
ak
do
wn
Industrial
36%
Automotive
64%
Industrial
36%
Automotive
64%
051.102.204
150.150.150
000.204.153
255.204.000
000.102.204 153.204.255
235.185.052
036.083.161
227.230.232
083.086.090
021.067.132
149.154.162
255.153.000
025.057.106
15
583.7 610.6
326.3 352.0
910.0
962.6
FY17 FY18
Automotive Industrial¹
w/o FX:
+ 10.4%
w/o FX:
+ 7.9%
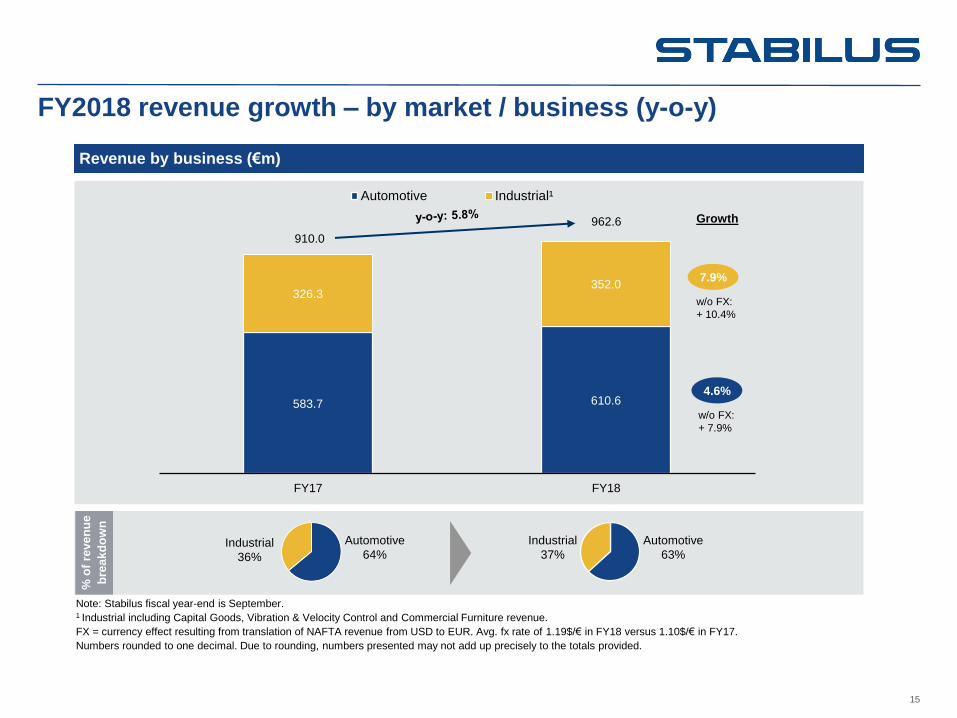
FY2018 revenue growth – by market / business (y-o-y)
Revenue by business (€m)
Note: Stabilus fiscal year-end is September. 1 Industrial including Capital Goods, Vibration & Velocity Control and Commercial Furniture revenue.
FX = currency effect resulting from translation of NAFTA revenue from USD to EUR. Avg. fx rate of 1.19$/€ in FY18 versus 1.10$/€ in FY17.
Numbers rounded to one decimal. Due to rounding, numbers presented may not add up precisely to the totals provided.
7.9%
4.6%
Growth
% o
f re
ve
nu
e
bre
ak
do
wn
Industrial
36%
Automotive
64%
Industrial
37%
Automotive
63%

051.102.204
150.150.150
000.204.153
255.204.000
000.102.204 153.204.255
235.185.052
036.083.161
227.230.232
083.086.090
021.067.132
149.154.162
255.153.000
025.057.106
16
340.5 342.3
243.2 268.3
583.7
610.6
FY17 FY18
Gas Spring Powerise
FX: (10.7)
FY2018 revenue growth – Automotive business (y-o-y)
Revenue (€m) Key highlights
Note: Stabilus fiscal year-end is September.
FX = currency effect resulting from translation of NAFTA revenue from USD to EUR. Avg. fx rate of 1.19$/€ in FY18 versus 1.10$/€ in FY17.
Numbers rounded to one decimal. Due to rounding, numbers presented may not add up precisely to the totals provided.
Global car production in FY18 at 96.0m, i.e. + 1.0%
vs. FY17
Automotive revenue + 4.6% y/y (+ 7.9% without $/€
currency translation effect)
Automotive Gas Spring revenue + 0.5% y/y (+ 3.0%
without $/€ currency translation effect)
Powerise revenue + 10.3% y/y (+14.7% y/y without
$/€ currency translation effect) – y-o-y growth
particularly in Asia/Pacific and RoW (China plant)
Continuing consumer trend towards SUV’s,
crossovers, MPVs, hatchbacks supports our overall
automotive revenue development
FX: (8.4)

051.102.204
150.150.150
000.204.153
255.204.000
000.102.204 153.204.255
235.185.052
036.083.161
227.230.232
083.086.090
021.067.132
149.154.162
255.153.000
025.057.106
17
204.4
220.0
93.9
101.6
28.0
30.4
326.3
352.0
FY17 FY18
Capital Goods Vibration & Velocity Control Commercial Furniture
FX: (4.7)
FY2018 revenue growth – Industrial business (y-o-y)
Revenue (€m) Key highlights
Industrial revenue increased by 7.9% (10.4%
excluding $/€ currency translation effect)
Excluding $/€ currency translation effect Capital
Goods grew by 9.9%, Vibration & Velocity Control by
11.5%, and Commercial Furniture by 10.0%
Continuing strong growth e.g. in the following
segments: construction machinery,
bus/truck/transportation, medical technology
From October 1, 2018 onwards, Commercial
Furniture business unit will be integrated into Capital
Goods business unit
Note: Stabilus fiscal year-end is September.
FX = currency effect resulting from translation of NAFTA revenue from USD to EUR. Avg. fx rate of 1.19$/€ in FY18 versus 1.10$/€ in FY17.
Numbers rounded to one decimal. Due to rounding, numbers presented may not add up precisely to the totals provided.
FX: (3.1)
FX: (0.4)
051.102.204
150.150.150
000.204.153
255.204.000
000.102.204 153.204.255
235.185.052
036.083.161
227.230.232
083.086.090
021.067.132
149.154.162
255.153.000
025.057.106
18
Agenda
2.
3.
4.
1.
4. 4. Outlook
5.

051.102.204
150.150.150
000.204.153
255.204.000
000.102.204 153.204.255
235.185.052
036.083.161
227.230.232
083.086.090
021.067.132
149.154.162
255.153.000
025.057.106
19
Outlook
FY2018 Actual FY2019 Guidance
€ million percent
Revenue €962.6m (@ 1.19 $/€)
~ €1,010m (@ 1.19 $/€)
~ 5% y/y (at constant $/€ rate)
% Adj. EBIT margin 15.5% ~ 15.5%
Revenue outlook for FY2019: c. 5% y/y at constant avg. $/€ rate vs. FY18 of 1.19 to approx. €1,010m;
STAR 2025 mid- and long-term guidance for average annual growth of at least 6% confirmed
Decrease of US$/€ avg. fx rate by 0.10 $/€ leads to a revenue increase by approx. €30m and vice versa.
FY2019 adj. EBIT margin estimated at c. 15.5%
Comments
Note: Stabilus fiscal year-end is September.

051.102.204
150.150.150
000.204.153
255.204.000
000.102.204 153.204.255
235.185.052
036.083.161
227.230.232
083.086.090
021.067.132
149.154.162
255.153.000
025.057.106
20
Agenda
2.
3.
4.
1.
4.
5. Appendix

051.102.204
150.150.150
000.204.153
255.204.000
000.102.204 153.204.255
235.185.052
036.083.161
227.230.232
083.086.090
021.067.132
149.154.162
255.153.000
025.057.106
21
Revenue by region and customer market (3M ended Sept 30, 2018)
External revenue (€m)
Note: 1 NAFTA Q4 FY18 revenue includes currency effect of €1.6m, resulting from translation of NAFTA revenue from USD to EUR. Avg. fx rate of 1.16$/€ in Q4 FY18
versus 1.18$/€ in Q4 FY17. Since there were no changes in the scope of consolidation in FY18, we don’t use the term ‘organic growth’ in this presentation.
Numbers rounded to one decimal. Due to rounding, numbers presented may not add up precisely to the totals provided.
Q4 FY2017 Actual
Q4 FY2018 Preliminary
Change % change
Automotive Gas Spring 37.4 35.2 (2.2) (5.9)%
Automotive Powerise 25.0 25.5 0.5 2.0%
Industrial / Capital Goods 30.3 33.4 3.1 10.2%
Vibration & Velocity Control 13.1 14.0 0.9 6.9%
Commercial Furniture 5.1 6.3 1.2 23.5%
Europe 110.9 114.3 3.4 3.1%
Automotive Gas Spring 24.2 27.2 3.0 12.4%
Automotive Powerise 32.3 33.6 1.3 4.0%
Industrial / Capital Goods 16.2 14.8 (1.4) (8.6)%
Vibration & Velocity Control 9.2 9.3 0.1 1.1%
Commercial Furniture 1.2 1.3 0.1 8.3%
NAFTA1 83.1 86.2 3.1 3.7%
Automotive Gas Spring 19.0 19.9 0.9 4.7%
Automotive Powerise 3.4 5.5 2.1 61.8%
Industrial / Capital Goods 3.3 3.6 0.3 9.1%
Vibration & Velocity Control 1.2 1.3 0.1 8.3%
Commercial Furniture - 0.1 0.1 n/a
Asia / Pacific and RoW 27.0 30.2 3.2 11.9%
Total Automotive Gas Spring 80.7 82.5 1.8 2.2%
Total Automotive Powerise 60.6 64.4 3.8 6.3%
Total Industrial / Capital Goods 49.7 51.8 2.1 4.2%
Total Vibration & Velocity Control 23.6 24.5 0.9 3.8%
Total Commercial Furniture 6.3 7.6 1.3 20.6%
Total 220.9 230.8 9.9 4.5%
FX effect: 1.1% y/y
FY17: 1.1752$/€
FY18: 1.1626$/€

051.102.204
150.150.150
000.204.153
255.204.000
000.102.204 153.204.255
235.185.052
036.083.161
227.230.232
083.086.090
021.067.132
149.154.162
255.153.000
025.057.106
22
Revenue by region and customer market (year ended Sept 30, 2018)
External revenue (€m)
Note: 1 NAFTA FY18 revenue includes currency effect of €(27.3)m, resulting from translation of NAFTA revenue from USD to EUR. Avg. fx rate of 1.19$/€ in FY18 versus
1.10$/€ in FY17.
Numbers rounded to one decimal. Due to rounding, numbers presented may not add up precisely to the totals provided.
FY2017 Actual
FY2018 Preliminary
Change % change
Automotive Gas Spring 150.2 154.9 4.7 3.1%
Automotive Powerise 100.1 109.0 8.9 8.9%
Industrial / Capital Goods 130.7 146.6 15.9 12.2%
Vibration & Velocity Control 52.2 55.3 3.1 5.9%
Commercial Furniture 23.1 25.5 2.4 10.4%
Europe 456.3 491.3 35.0 7.7%
Automotive Gas Spring 108.8 106.6 (2.2) (2.0)%
Automotive Powerise 137.4 136.9 (0.5) (0.4)%
Industrial / Capital Goods 62.7 60.6 (2.1) (3.3)%
Vibration & Velocity Control 37.0 39.1 2.1 5.7%
Commercial Furniture 4.8 4.7 (0.1) (2.1)%
NAFTA1 350.7 348.1 (2.6) (0.7)%
Automotive Gas Spring 81.4 80.7 (0.7) (0.9)%
Automotive Powerise 5.8 22.4 16.6 >100.0%
Industrial / Capital Goods 11.0 12.8 1.8 16.4%
Vibration & Velocity Control 4.7 7.2 2.5 53.2%
Commercial Furniture 0.1 0.1 - 0.0%
Asia / Pacific and RoW 103.0 123.1 20.1 19.5%
Total Automotive Gas Spring 340.5 342.3 1.8 0.5%
Total Automotive Powerise 243.2 268.3 25.1 10.3%
Total Industrial / Capital Goods 204.4 220.0 15.6 7.6%
Total Vibration & Velocity Control 93.9 101.6 7.7 8.2%
Total Commercial Furniture 28.0 30.4 2.4 8.6%
Total 910.0 962.6 52.6 5.8%
FX effect: (7.8)% y/y
FY17: 1.1041$/€
FY18: 1.1906$/€
051.102.204
150.150.150
000.204.153
255.204.000
000.102.204 153.204.255
235.185.052
036.083.161
227.230.232
083.086.090
021.067.132
149.154.162
255.153.000
025.057.106
23
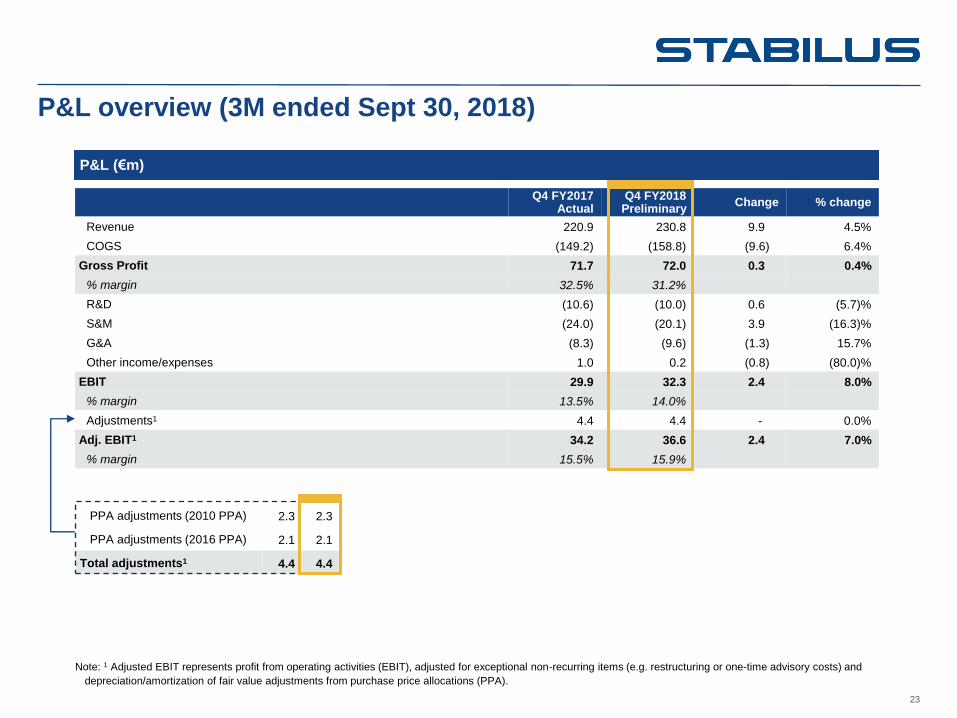
P&L (€m)
PPA adjustments (2010 PPA) 2.3 2.3
PPA adjustments (2016 PPA) 2.1 2.1
Total adjustments1 4.4 4.4
Q4 FY2017 Actual
Q4 FY2018 Preliminary
Change % change
Revenue 220.9 230.8 9.9 4.5%
COGS (149.2) (158.8) (9.6) 6.4%
Gross Profit 71.7 72.0 0.3 0.4%
% margin 32.5% 31.2%
R&D (10.6) (10.0) 0.6 (5.7)%
S&M (24.0) (20.1) 3.9 (16.3)%
G&A (8.3) (9.6) (1.3) 15.7%
Other income/expenses 1.0 0.2 (0.8) (80.0)%
EBIT 29.9 32.3 2.4 8.0%
% margin 13.5% 14.0%
Adjustments1 4.4 4.4 - 0.0%
Adj. EBIT1 34.2 36.6 2.4 7.0%
% margin 15.5% 15.9%
P&L overview (3M ended Sept 30, 2018)
Note: 1 Adjusted EBIT represents profit from operating activities (EBIT), adjusted for exceptional non-recurring items (e.g. restructuring or one-time advisory costs) and
depreciation/amortization of fair value adjustments from purchase price allocations (PPA).

051.102.204
150.150.150
000.204.153
255.204.000
000.102.204 153.204.255
235.185.052
036.083.161
227.230.232
083.086.090
021.067.132
149.154.162
255.153.000
025.057.106
24
P&L (€m)
PPA adjustments (2010 PPA) 10.8 9.3
PPA adjustments (2016 PPA) 8.4 8.2
Total adjustments1 19.2 17.5
FY2017 Actual
FY2018 Preliminary
Change % change
Revenue 910.0 962.6 52.6 5.8%
COGS (637.2) (671.4) (34.2) 5.4%
Gross Profit 272.9 291.2 18.3 6.7%
% margin 30.0% 30.3%
R&D (38.2) (42.0) (3.8) 9.9%
S&M (80.4) (81.3) (0.9) 1.1%
G&A (35.3) (38.5) (3.2) 9.1%
Other income/expenses (0.5) 2.6 3.1 <(100.0)%
EBIT 118.4 131.9 13.5 11.4%
% margin 13.0% 13.7%
Adjustments1 19.2 17.5 (1.7) (8.9)%
Adj. EBIT1 137.6 149.3 11.7 8.5%
% margin 15.1% 15.5%
P&L overview (year ended Sept 30, 2018)
Note: 1 Adjusted EBIT represents profit from operating activities (EBIT), adjusted for exceptional non-recurring items (e.g. restructuring or one-time advisory costs) and
depreciation/amortization of fair value adjustments from purchase price allocations (PPA).

051.102.204
150.150.150
000.204.153
255.204.000
000.102.204 153.204.255
235.185.052
036.083.161
227.230.232
083.086.090
021.067.132
149.154.162
255.153.000
025.057.106
25
Balance sheet (€m)
Sept 2017 Actual
Sept 2018 Preliminary
Change % change
Property, plant and equipment 169.7 179.2 9.5 5.6%
Goodwill 194.2 195.2 1.0 0.5%
Other intangible assets2 268.9 247.2 (21.7) (8.1)%
Inventories 85.3 90.8 5.5 6.4%
Trade receivables 105.1 111.3 6.2 5.9%
Other assets 38.7 43.7 5.0 12.9%
Cash 68.1 143.0 74.9 >100.0%
Total assets 930.0 1,010.4 80.4 8.6%
Equity incl. minorities 336.4 426.5 90.1 26.8%
Debt (incl. accrued interest) 322.0 320.0 (2.0) (0.6)%
Pension plans and similar obligations 53.2 52.2 (1.0) (1.9)%
Deferred tax liabilities 60.0 47.8 (12.2) (20.3)%
Trade accounts payable 79.1 83.2 4.1 5.2%
Other liabilities 79.3 80.7 1.4 1.8%
Total equity and liabilities 930.0 1,010.4 80.4 8.6%
Net leverage ratio1 1.5x 1.1x
Balance sheet overview
Note:
1 Net leverage ratio = net financial debt / adj. EBITDA LTM. Net financial debt defined as principal amount of financial debt less cash. Adj. EBITDA LTM = last-twelve-month
adjusted earnings before interest, taxes, depreciation and amortization. Refer also to our financial reports and quarterly statements at www.ir.stabilus.com for further details. 2 Change in other intangible assets mainly due to the amortization of fair value adjustments from purchase price allocations (PPA) in 2010 and 2016.
Numbers rounded to one decimal. Due to rounding, numbers presented may not add up precisely to the totals provided.

051.102.204
150.150.150
000.204.153
255.204.000
000.102.204 153.204.255
235.185.052
036.083.161
227.230.232
083.086.090
021.067.132
149.154.162
255.153.000
025.057.106
26
Q4 FY2017 Actual
Q4 FY2018 Preliminary
Change % change
Cash flow from operating activities 36.5 46.6 10.1 27.7%
Cash flow from investing activities (11.3) (18.3) (7.0) 61.9%
Free cash flow 25.2 28.3 3.1 12.3%
Cash flow overview and free cash flow (3M ended Sept 30, 2018)
Cash Flow Statement (€m)
Q4 FY2017 Actual
Q4 FY2018 Preliminary
Change % change
Cash flow from operating activities 36.5 46.6 10.1 27.7%
Cash flow from investing activities (11.3) (18.3) (7.0) 61.9%
Cash flow from financing activities (51.9) (1.5) 50.4 (97.1)%
Net increase / (decrease) in cash (26.7) 26.8 53.5 <(100.0)%
Effect of movements in exchange rates (0.5) 0.3 0.8 <(100.0)%
Cash as of beginning of the period 95.3 115.8 20.5 21.5%
Cash as of end of the period 68.1 143.0 74.9 >100.0%
Free Cash Flow (€m)
Note:
Free Cash Flow (FCF) = cash flow from operating activities + cash flow from investing activities. It is presented because we believe it is a relevant measure for the
assessment of the group’s ability to generate cash which can be used for further investments, debt service and distributions to shareholders.
Numbers rounded to one decimal. Due to rounding, numbers presented may not add up precisely to the totals provided.

051.102.204
150.150.150
000.204.153
255.204.000
000.102.204 153.204.255
235.185.052
036.083.161
227.230.232
083.086.090
021.067.132
149.154.162
255.153.000
025.057.106
27
FY2017 Actual
FY2018 Preliminary
Change % change
Cash flow from operating activities 121.9 145.5 23.6 19.4%
Cash flow from investing activities (44.1) (45.3) (1.2) 2.7%
Free cash flow 77.8 100.2 22.4 28.8%
Cash flow overview and free cash flow (year ended Sept 30, 2018)
Cash Flow Statement (€m)
FY2017 Actual
FY2018 Preliminary
Change % change
Cash flow from operating activities 121.9 145.5 23.6 19.4%
Cash flow from investing activities (44.1) (45.3) (1.2) 2.7%
Cash flow from financing activities (83.7) (25.5) 58.2 (69.5)%
Net increase / (decrease) in cash (5.9) 74.7 80.6 <(100.0)%
Effect of movements in exchange rates (1.0) 0.2 1.2 <(100.0)%
Cash as of beginning of the period 75.0 68.1 (6.9) (9.2)%
Cash as of end of the period 68.1 143.0 74.9 >100.0%
Free Cash Flow (€m)
Note:
Free Cash Flow (FCF) = cash flow from operating activities + cash flow from investing activities. It is presented because we believe it is a relevant measure for the
assessment of the group’s ability to generate cash which can be used for further investments, debt service and distributions to shareholders.
Numbers rounded to one decimal. Due to rounding, numbers presented may not add up precisely to the totals provided.

051.102.204
150.150.150
000.204.153
255.204.000
000.102.204 153.204.255
235.185.052
036.083.161
227.230.232
083.086.090
021.067.132
149.154.162
255.153.000
025.057.106
28
Notes re pensions and leasing
Notes
Pensions and similar obligations
In FY2018 new demographic tables were issued in Germany (Heubeck Mortality Table 2018G)
Changed assumptions for the calculation of pension obligations as of Sept 30, 2018: discount rate of
2.00% in FY18 (vs. 1.87% in FY17), Heubeck Mortality Table 2018G in FY18 (vs. Heubeck Mortality Table
2005G in FY17)
As a consequence, liability for pension plans and similar obligations has decreased by €1m in FY18 from
€53.2m as of Sept 30, 2017 to €52.2m as of Sept 30, 2018
Leases
IFRS 16 is applicable for fiscal years beginning on or after January 1, 2019; Stabilus is planning to apply
the new method from October 1, 2019
Recognition of all leases in the balance sheet – non-current assets and financial debt will increase
In the income statement: currently – operating expenses, in the future – depreciation and interest
expenses
Insignificant volume – no material impact on consolidated financial statements of Stabilus S.A.

051.102.204
150.150.150
000.204.153
255.204.000
000.102.204 153.204.255
235.185.052
036.083.161
227.230.232
083.086.090
021.067.132
149.154.162
255.153.000
025.057.106
www.stabilus.com www.stabilus.com