021883Orig1s000 - Food and Drug Administration · PDF filecenter for drug evaluation and...
75
CENTER FOR DRUG EVALUATION AND RESEARCH APPLICATION NUMBER: 021883Orig1s000 STATISTICAL REVIEW(S)
Transcript of 021883Orig1s000 - Food and Drug Administration · PDF filecenter for drug evaluation and...
CENTER FOR DRUG EVALUATION AND RESEARCH
APPLICATION NUMBER:
021883Orig1s000
STATISTICAL REVIEW(S)

U.S. Department of Health and Human ServicesFood and Drug Administration Center for Drug Evaluation and ResearchOffice of Translational SciencesOffice of Biostatistics
S TAT I S T I C A L R E V I E W A N D E VA L U AT I O N
CLINICAL STUDIES
NDA #: 21-883
Drug Name: DalvanceTM (Dalbavancin hydrochloride) for Injection
Indication: Acute bacterial skin and skin structure infections (ABSSSI)
Applicant: Durata Therapeutics, Inc.
Stamp Date: September 26, 2013
PDUFA Goal Date: May 26, 2014
Biometrics Division: Division of Biometrics IV
Statistical Reviewer: Christopher Kadoorie, Ph.D.
Concurring Reviewers:
Medical Division:
Thamban Valappil, Ph.D., Dionne Price, Ph.D.
Division of Anti-Infective Products (DAIP)
Clinical Reviewer: Dmitri Iarikov, M.D., Ph.D.
Clinical Team Leader: John Alexander, M.D., M.P.H.
Project Manager: Chris Davi, M.P.H.
Reference ID: 3505302
2
TABLE OF CONTENTS
1. EXECUTIVE SUMMARY.................................................................................................5
2. INTRODUCTION...............................................................................................................6
2.1 OVERVIEW .....................................................................................................................................62.2 DATA SOURCES ..............................................................................................................................8
3. STATISTICAL EVALUATION........................................................................................9
3.1 DATA AND ANALYSIS QUALITY ....................................................................................................93.2 EVALUATION OF EFFICACY ........................................................................................................10
3.2.1 Study Design and Endpoints...................................................................................... 103.2.2 Subject Disposition, Demographic and Baseline Characteristics ............................ 173.2.3 Statistical Methodologies .......................................................................................... 233.2.4 Results and Conclusions............................................................................................ 26
3.3 EVALUATION OF SAFETY ............................................................................................................34
4. SPECIAL/SUBGROUP POPULATIONS ......................................................................35
4.1 SUBGROUP ANALYSES BY AGE, GENDER, RACE AND GEOGRAPHIC REGION .........................354.2 OTHER SPECIAL/SUBGROUP POPULATIONS ..............................................................................36
5. SUMMARY AND CONCLUSIONS................................................................................44
5.1 STATISTICAL ISSUES AND FINDINGS...........................................................................................445.2 COLLECTIVE EVIDENCE..............................................................................................................475.3 CONCLUSIONS AND RECOMMENDATIONS..................................................................................475.4 LABELING RECOMMENDATIONS ................................................................................................47
6. REFERENCES ..................................................................................................................48
7. APPENDIX ........................................................................................................................50
Reference ID: 3505302
3
LIST OF TABLESTable 1: Comparison of Trials 301 & 302 ...................................................................................... 8Table 2: Study Dosing Schedule ................................................................................................... 10Table 3: Overall Study Design (Trials 301 & 302) ....................................................................... 11Table 4: Investigator Assessment- Definition of Success/Failure................................................. 17Table 5: Number (%) of Patients by Analysis Population, Trials 301 & 302............................... 19Table 6: Demographics and Baseline Characteristics (ITT) ......................................................... 20Table 7: Disease Severity at Baseline (ITT) ................................................................................. 21Table 8: Primary Infection Site: Area at Baseline, Overall and by Infection Type (ITT) ............ 22Table 9: Responder Rates at 48-72 hours: Applicant Primary Analysis (ITT) ............................. 26Table 10: Success Rates for Clinical Status at EOT, Applicant Analyses ..................................... 27Table 11: Reviewer Analyses: Responder Rates at 48-72 hours (ITT).......................................... 27Table 12: Reviewer Analyses of Clinical Status, Success Rates at EOT & SFU (ITT) ................ 29Table 13: Sensitivity Analyses of Later Endpoints in Trials 301 and 302 (ITT)........................... 31Table 14: Clinical Status at EOT/SFU: Reasons for Failure (ITT)................................................ 32Table 15: Study Drug Discontinuation (Trials 301 & 302 Combined, ITT).................................. 34Table 16: Responder Rates at 48-72 hours by Age, Gender, Race and Region (ITT) ................... 35Table 17: Clinical Response Rates at 48-72 hours by Other Variables (ITT) ............................... 37Table 18: Responder Rates at 48-72 hours by Baseline Pathogen (MicroITT) ............................. 38Table 19: Clinical Response at 48-72 Hours by Concomitant NSAID Use (ITT)......................... 38Table 20: Clinical Status at EOT by Stratification Variables at Randomization (ITT) ................. 39Table 21: Success Rates at EOT & SFU by Baseline Pathogen (MicroITT)................................. 40Table 22: Clinical Status at SFU by Creatinine Clearance (ITT)................................................... 41Table 23: Concordance Analysis - Responder/Non-Responders at 48-72 Hours with Clinical
Success/Failure at EOT (ITT).................................................................................................. 41Table 24: Reason for Failure at EOT among Responders at 48-72 hours...................................... 42Table 25: Concordance Analysis- Responder/Non-Responders at 48-72 Hours with
Complete/Incomplete Resolution of Local Signs at SFU (ITT).............................................. 43Table 26: Reasons for Incomplete Resolution at SFU among Responders at 48-72 hrs................ 43Table 27: Reasons for Clinical Non-Response at 48-72 hours ...................................................... 50Table 28: Responder Rates for ≥ 20% Reduction in Lesion Area Only at 48-72 hours by
Stratification Variables at Randomization (ITT)..................................................................... 51Table 29: Reviewer Analyses of Clinical Status, Success Rates at EOT & SFU in Clinically
Evaluable Patients.................................................................................................................... 52Table 30: Clinical Success Rates from Investigator Assessment at EOT, SFU (ITT)................... 52Table 31: Responder Rates Based on a ≥ 20% Reduction in Lesion Area at 48-72 Hours by
Baseline Pathogen (MicroITT) ................................................................................................ 53Table 32: Complete Resolution of Individual Local Signs at EOT (ITT)...................................... 53Table 33: Complete Resolution Rates of Individual Local Signs at SFU (ITT) ............................ 54Table 34: Reviewer Analyses: Responder Rates at 48-72 hours Excluding 6 Patients ................. 54Table 35: Reviewer Analyses of Clinical Status, Success Rates at EOT & SFU (ITT), Excluding 6
Patients..................................................................................................................................... 55Table 36: Reasons for Use of Non-Study Antibiotics at SFU, Trials 301 & 302 (ITT) ................ 56
Reference ID: 3505302
4
LIST OF FIGURESFigure 1: Trial 301- Subject Disposition (ITT) .............................................................................. 18Figure 2: Trial 302- Subject Disposition (ITT) .............................................................................. 18Figure 3: Distribution of Patients Meeting Various % Reductions in Lesion Area at 48-72 Hours
................................................................................................................................................. 30Figure 4: Distribution of Patients Meeting Various % Reductions in Lesion Area at EOT and SFU
................................................................................................................................................. 33
Reference ID: 3505302
5
1. EXECUTIVE SUMMARY
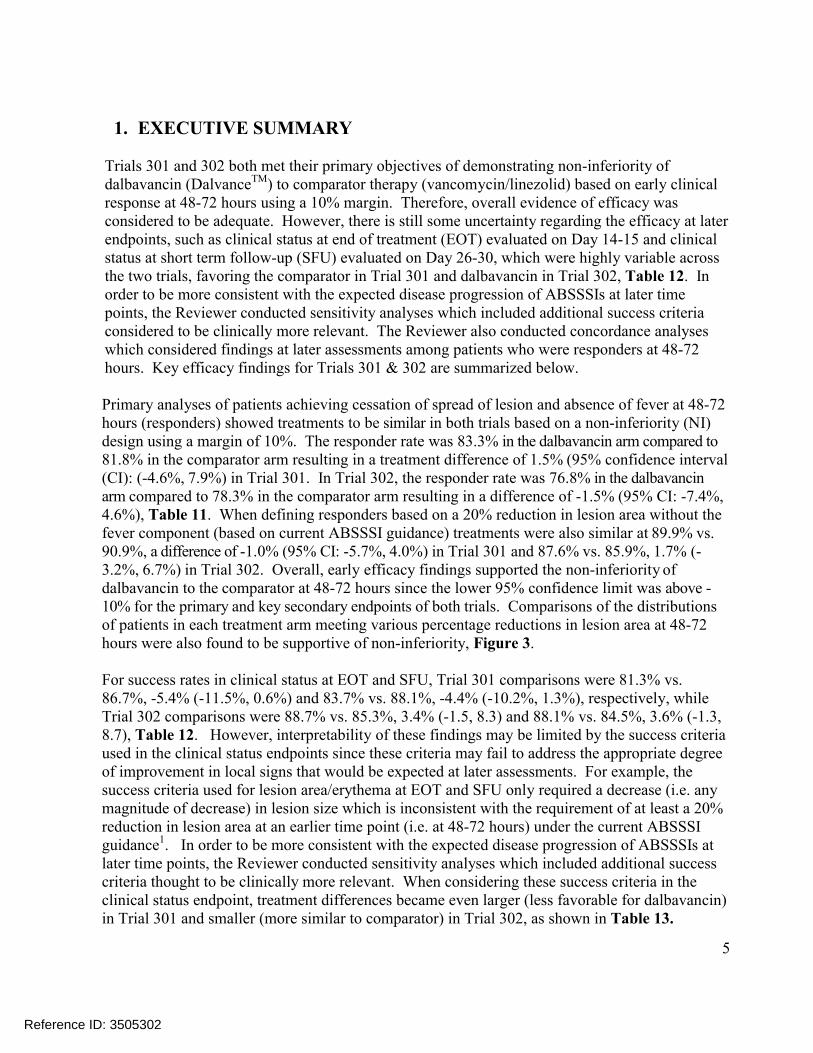
Trials 301 and 302 both met their primary objectives of demonstrating non-inferiority of dalbavancin (DalvanceTM) to comparator therapy (vancomycin/linezolid) based on early clinical response at 48-72 hours using a 10% margin. Therefore, overall evidence of efficacy was considered to be adequate. However, there is still some uncertainty regarding the efficacy at later endpoints, such as clinical status at end of treatment (EOT) evaluated on Day 14-15 and clinical status at short term follow-up (SFU) evaluated on Day 26-30, which were highly variable across the two trials, favoring the comparator in Trial 301 and dalbavancin in Trial 302, Table 12. In order to be more consistent with the expected disease progression of ABSSSIs at later time points, the Reviewer conducted sensitivity analyses which included additional success criteriaconsidered to be clinically more relevant. The Reviewer also conducted concordance analyses which considered findings at later assessments among patients who were responders at 48-72 hours. Key efficacy findings for Trials 301 & 302 are summarized below.
Primary analyses of patients achieving cessation of spread of lesion and absence of fever at 48-72 hours (responders) showed treatments to be similar in both trials based on a non-inferiority (NI) design using a margin of 10%. The responder rate was 83.3% in the dalbavancin arm compared to81.8% in the comparator arm resulting in a treatment difference of 1.5% (95% confidence interval(CI): (-4.6%, 7.9%) in Trial 301. In Trial 302, the responder rate was 76.8% in the dalbavancin arm compared to 78.3% in the comparator arm resulting in a difference of -1.5% (95% CI: -7.4%,4.6%), Table 11. When defining responders based on a 20% reduction in lesion area without thefever component (based on current ABSSSI guidance) treatments were also similar at 89.9% vs. 90.9%, a difference of -1.0% (95% CI: -5.7%, 4.0%) in Trial 301 and 87.6% vs. 85.9%, 1.7% (-3.2%, 6.7%) in Trial 302. Overall, early efficacy findings supported the non-inferiority of dalbavancin to the comparator at 48-72 hours since the lower 95% confidence limit was above -10% for the primary and key secondary endpoints of both trials. Comparisons of the distributions of patients in each treatment arm meeting various percentage reductions in lesion area at 48-72 hours were also found to be supportive of non-inferiority, Figure 3.
For success rates in clinical status at EOT and SFU, Trial 301 comparisons were 81.3% vs. 86.7%, -5.4% (-11.5%, 0.6%) and 83.7% vs. 88.1%, -4.4% (-10.2%, 1.3%), respectively, while Trial 302 comparisons were 88.7% vs. 85.3%, 3.4% (-1.5, 8.3) and 88.1% vs. 84.5%, 3.6% (-1.3, 8.7), Table 12. However, interpretability of these findings may be limited by the success criteria used in the clinical status endpoints since these criteria may fail to address the appropriate degree of improvement in local signs that would be expected at later assessments. For example, the success criteria used for lesion area/erythema at EOT and SFU only required a decrease (i.e. any magnitude of decrease) in lesion size which is inconsistent with the requirement of at least a 20% reduction in lesion area at an earlier time point (i.e. at 48-72 hours) under the current ABSSSI guidance1. In order to be more consistent with the expected disease progression of ABSSSIs at later time points, the Reviewer conducted sensitivity analyses which included additional success criteria thought to be clinically more relevant. When considering these success criteria in the clinical status endpoint, treatment differences became even larger (less favorable for dalbavancin) in Trial 301 and smaller (more similar to comparator) in Trial 302, as shown in Table 13.
Reference ID: 3505302
6
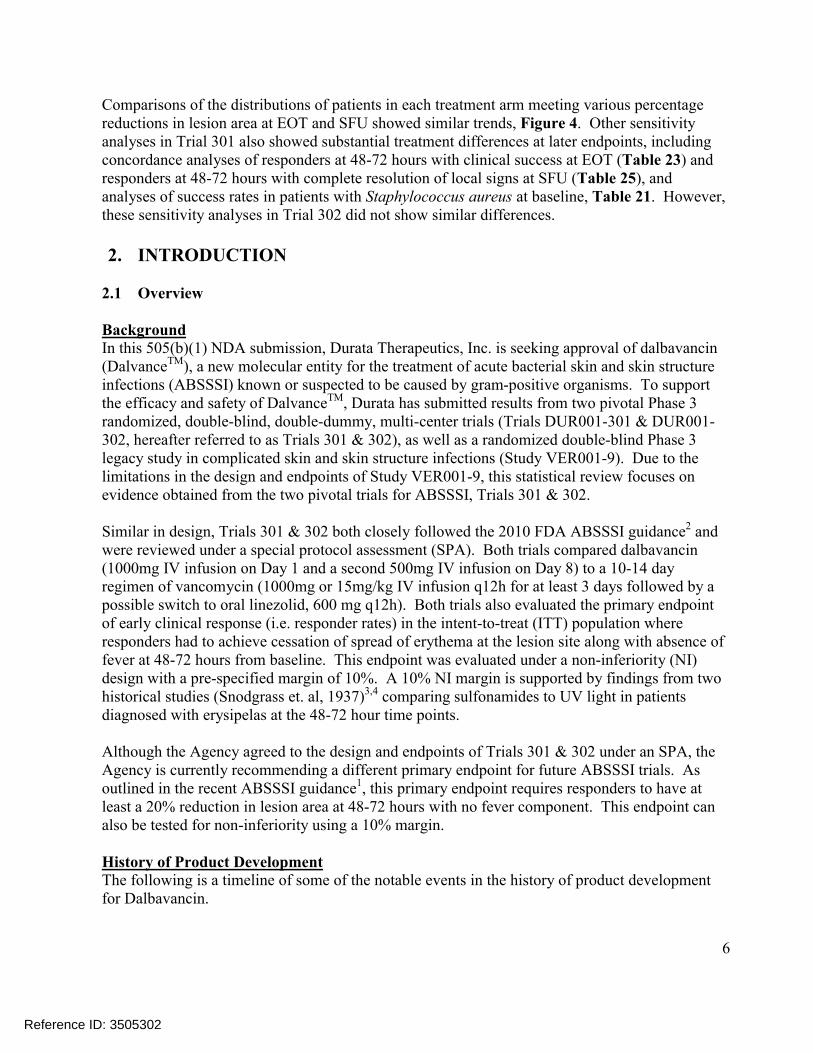
Comparisons of the distributions of patients in each treatment arm meeting various percentage reductions in lesion area at EOT and SFU showed similar trends, Figure 4. Other sensitivity analyses in Trial 301 also showed substantial treatment differences at later endpoints, includingconcordance analyses of responders at 48-72 hours with clinical success at EOT (Table 23) and responders at 48-72 hours with complete resolution of local signs at SFU (Table 25), and analyses of success rates in patients with Staphylococcus aureus at baseline, Table 21. However, these sensitivity analyses in Trial 302 did not show similar differences.
2. INTRODUCTION
2.1 Overview
BackgroundIn this 505(b)(1) NDA submission, Durata Therapeutics, Inc. is seeking approval of dalbavancin (DalvanceTM), a new molecular entity for the treatment of acute bacterial skin and skin structure infections (ABSSSI) known or suspected to be caused by gram-positive organisms. To support the efficacy and safety of DalvanceTM, Durata has submitted results from two pivotal Phase 3 randomized, double-blind, double-dummy, multi-center trials (Trials DUR001-301 & DUR001-302, hereafter referred to as Trials 301 & 302), as well as a randomized double-blind Phase 3 legacy study in complicated skin and skin structure infections (Study VER001-9). Due to the limitations in the design and endpoints of Study VER001-9, this statistical review focuses on evidence obtained from the two pivotal trials for ABSSSI, Trials 301 & 302.
Similar in design, Trials 301 & 302 both closely followed the 2010 FDA ABSSSI guidance2 and were reviewed under a special protocol assessment (SPA). Both trials compared dalbavancin (1000mg IV infusion on Day 1 and a second 500mg IV infusion on Day 8) to a 10-14 day regimen of vancomycin (1000mg or 15mg/kg IV infusion q12h for at least 3 days followed by a possible switch to oral linezolid, 600 mg q12h). Both trials also evaluated the primary endpoint of early clinical response (i.e. responder rates) in the intent-to-treat (ITT) population where responders had to achieve cessation of spread of erythema at the lesion site along with absence of fever at 48-72 hours from baseline. This endpoint was evaluated under a non-inferiority (NI) design with a pre-specified margin of 10%. A 10% NI margin is supported by findings from two historical studies (Snodgrass et. al, 1937)3,4 comparing sulfonamides to UV light in patients diagnosed with erysipelas at the 48-72 hour time points.
Although the Agency agreed to the design and endpoints of Trials 301 & 302 under an SPA, the Agency is currently recommending a different primary endpoint for future ABSSSI trials. As outlined in the recent ABSSSI guidance1, this primary endpoint requires responders to have at least a 20% reduction in lesion area at 48-72 hours with no fever component. This endpoint can also be tested for non-inferiority using a 10% margin.
History of Product DevelopmentThe following is a timeline of some of the notable events in the history of product development for Dalbavancin.
Reference ID: 3505302
7
The dalbavancin NDA 21-883 was previously submitted on December 21, 2004 by Vicuron, a subsidiary of Pfizer.
The Agency issued approvable letters on September 21, 2005, June 21, 2006, and December 20, 2007
The NDA was previously withdrawn by Pfizer on September 15, 2008 The Division was notified that Durata assumed responsibility for management of IND 60,613
and the future development of dalbavancin on January 25, 2010 An End of Phase 2 meeting was held with Durata on June 3, 2010 A SPA resubmission letter was issued on June 22, 2011 Dalbavancin was given Qualified Infectious Disease Product (QIDP) designation for the
treatment of ABSSSI on October 25, 2012. A pre-NDA meeting was held on June 26, 2013. NDA 21883 was re-submitted on September 26, 2013 An SPA Agreement letter was issued on March 21, 2013 for a clinical trial protocol, “A phase
3b, double-blind, multicenter, randomized, NI trial to compare the efficacy and safety of single dose dalbavancin to a two dose regimen of dalbavancin for the treatment of ABSSSI.”
An Anti-infective Drugs Advisory Committee (AIDAC) meeting was held to discuss NDA 21883 on March 31, 2014.
Reviewer Comments: As DalvanceTM is a new molecular entity, this NDA submission was discussed at an Anti-Infective Drugs Advisory Committee (AIDAC) meeting on March 31, 2014. The committee voted unanimously (12 votes to 0) that DalvanceTM was safe and effective in treating patients with ABSSSI. In stating their reasons for voting in favor of the efficacy of DalvanceTM, several committee members pointed to the fact that both trials (i.e. Trials 301 and 302) met their respective primary endpoints.
Overview of Trials 301 & 302A brief overview of the two identical pivotal Phase 3 clinical trials for ABSSSI, Trials 301 & 302, is provided in Table 1. The two trials share many of the same design characteristics; however, Trial 302 was substantially larger. Both trials had pre-specified interim analyses with the potential for sample size re-estimation (SSR) with SSR only being performed in Trial 302. These interim analyses are discussed further in Section 3.2.3 of this review.
Reference ID: 3505302

8
Table 1: Comparison of Trials 301 & 302
Trial 301 Trial 302
Type of Trial:Phase 3 multicenter, randomized, double-blind comparative trial to evaluate the safety and efficacy of dalbavancin vs. vancomycin + linezolid in adults with ABSSSI
Objective:Demonstrate noninferiority (NI) in early clinical response of dalbavancin treatment vs. vancomycin plus linezolid in adults with ABSSSI. The NI margin was pre-specified at 10%.
Treatment Arms:
Two arms: IV dalbavancin (1000mg on Day 1 & 500mg on Day 8)1 and IV vancomycin plus oral linezolid (1000mg or 15mg/kg vancomycin for 3 to 14 days plus linezolid 600mg q12h)
Sample Size: 573 ITT patients2 739 ITT patients2
PrimaryEndpoint:
Early clinical response at 48-72 hours in ITT subjects
Study Design:
Baseline: within 24 hours of first dose of study drug, randomizationStudy drug administration: Day 1 to EOT (for 10 to 14 days)EOT: Day 14-15SFU: Day 28Long term follow-up (LFU): Day 70
StatisticalMethods:
The observed treatment difference in response with 95% confidence interval (CI) computed stratifying for the presence or absence of fever at Baseline. If the lower limit of the 95% CI for the difference in response rates was greater than -10%, the non-inferiority of dalbavancin to vancomycin/linezolid was concluded.
1 Patients with creatinine clearance values < 30 mL/min not receiving hemodialysis or peritoneal dialysis received reduced dalbavancin doses of 750 mg on Day 1 and 375 mg on Day 8.2 A blinded SSR was performed when 60% of patients had early clinical response data available.Source: Reviewer Table
2.2 Data Sources
The reviewer primarily considered the clinical summary of efficacy, clinical study reports and selected datasets which are described below for Trial 301 along with their links. Datasets in Trials 301 and 302 were structured similarly and following the same naming conventions. The data formats used in this submission were SDTM and ADAM. (Note: Replacing ‘301’ with ‘302’ in the links below will provide the correct link for Trial 302). Clinical Summary of Efficacy : \\cdsesub1\evsprod\NDA021883\0000\m2\27-clin-summary
Clinical Study Reports: \\cdsesub1\evsprod\NDA021883\0000\m5\53-clin-stud-rep\535-rep-
effic-safety-stud\absssi\5351-stud-rep-contr\dur001-301
Datasets: \\cdsesub1\evsprod\NDA021883\0000\m5\datasets\dur001-
301\analysis\adam\datasets
Reference ID: 3505302
9
o ADSL- Demographic and Baseline Characteristicso ADCM- Concomitant Medicationso ADCMAB- Antibiotics/Antipyretics/NSAIDs/Paino ADABS- Description and Measurements of ABSSSIo ADISA- Local signs and symptomso ADEFF- Efficacy Outcome - Clinical Response
3. STATISTICAL EVALUATION
3.1 Data and Analysis Quality
Overall, the data quality was acceptable. No errors were noted in any of the submitted datasets. Datasets and variables were clearly described and well-documented. The Reviewer couldreproduce all major analyses.
However, there were some weaknesses with respect to the usability of the data at a few sites, as described below:
Data from Six patients in Trial 301: The Office of Scientific Investigations (OSI) found that 6 patients from Site 118 in Trial 301 lacked drug administration records and stated that these patients may be excluded at the Division’s discretion, although no data integrity issues were reported (Clinical Inspection Summary (Addendum) by Dr. Iacono-Connors, OSI on May 6, 2014). Therefore, sensitivity analyses excluding these 6 patients were conducted. These analyses showed similar results at 48-72 hours at 83.0% vs. 82.0%, 1.0% (-5.1%, 7.4%) for the primary endpoint and 89.8% vs. 90.8%, -1.1% (-5.9%, 4.0%) when defining responders based on a 20% reduction in lesion area, Table 34. However, Trial 301 comparisons at later endpoints became slightly less favorable at 80.9% (dalbavancin) vs. 87.0% (comparator), a difference of -6.1% (95% CI: -12.2, -0.0) at EOT and 83.4% vs. 88.4%, -5.0% (-10.8, 0.8) at SFU, Table 35. Prior to these exclusions, treatment differences were -5.4% (-11.5, 0.6) at EOT and -4.4% (-10.2%, 1.3%), Table 12.
Reviewer Comments: OSI had previously considered all data from sites 112, 118 and 122 (23 patients) of Study 301 to be unreliable based on the Clinical Inspection Summary by Dr. Iacono-Connors, OSI on April 11, 2014. However, OSI had upgraded the status of these sites from OAI (Official Action Indicated) to VAI (Voluntary Action Indicated) and considered their data reliable except for the 6 patients from Site 118 with missing drug administration records (noted above).
The Reviewer also noted the following inconsistencies with data obtained from a few other sites:
Investigator errors measuring lesion size resulting in study biases: Lesion measurements observed in Trial 302 suggested potential errors. For example, comparing proportions of patients with reductions in lesion area of exactly 0% at 48-72 hours, Trial 302 showed 15 patients with exactly a 0% reduction vs. no patients in Trial 301. In addition, Trial 302 Site 903 (Estonia) showed 10 of 15 patients with a 0% reduction from baseline at 48-72 hours.
Reference ID: 3505302
10
Measurement error can make treatments appear to be more similar when in fact they are not and this can result in study biases under a non-inferiority design.
Unusually High Responder Rates at Study Sites: In Trial 301, Site 607 (Ukraine) showed responder rates at 48-72 hours of 36/36 (100%) for dalbavancin vs. 47/48 (97.9%) for the comparator. Comparisons of overall response rates for Site 607 vs. All Other Sites were 98.8% vs. 79.8%, 19.1% (13.3, 23.2), p-value= 1.2x10⁻⁶ using Fisher’s exact test.
3.2 Evaluation of Efficacy
3.2.1 Study Design and Endpoints
Study Design
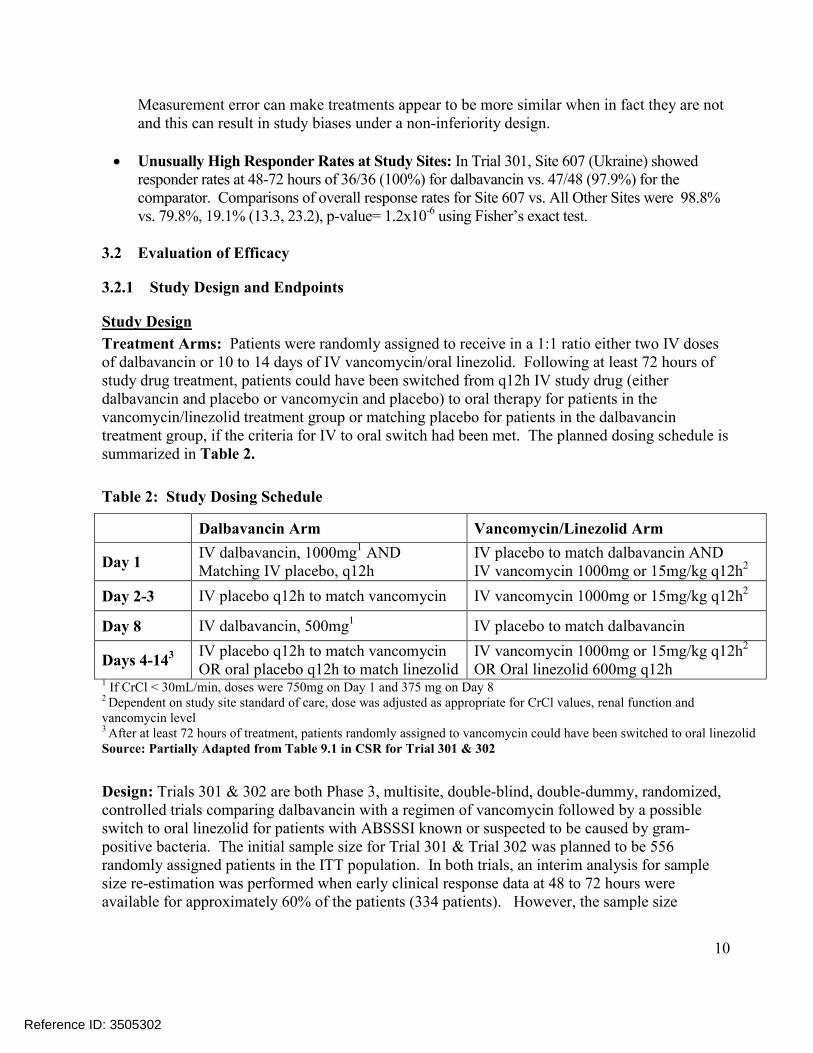
Treatment Arms: Patients were randomly assigned to receive in a 1:1 ratio either two IV doses of dalbavancin or 10 to 14 days of IV vancomycin/oral linezolid. Following at least 72 hours ofstudy drug treatment, patients could have been switched from q12h IV study drug (either dalbavancin and placebo or vancomycin and placebo) to oral therapy for patients in the vancomycin/linezolid treatment group or matching placebo for patients in the dalbavancin treatment group, if the criteria for IV to oral switch had been met. The planned dosing schedule is summarized in Table 2.
Table 2: Study Dosing Schedule
Dalbavancin Arm Vancomycin/Linezolid Arm
Day 1IV dalbavancin, 1000mg1 ANDMatching IV placebo, q12h
IV placebo to match dalbavancin ANDIV vancomycin 1000mg or 15mg/kg q12h2
Day 2-3 IV placebo q12h to match vancomycin IV vancomycin 1000mg or 15mg/kg q12h2
Day 8 IV dalbavancin, 500mg1 IV placebo to match dalbavancin
Days 4-143 IV placebo q12h to match vancomycinOR oral placebo q12h to match linezolid
IV vancomycin 1000mg or 15mg/kg q12h2
OR Oral linezolid 600mg q12h1 If CrCl < 30mL/min, doses were 750mg on Day 1 and 375 mg on Day 82 Dependent on study site standard of care, dose was adjusted as appropriate for CrCl values, renal function and vancomycin level3 After at least 72 hours of treatment, patients randomly assigned to vancomycin could have been switched to oral linezolidSource: Partially Adapted from Table 9.1 in CSR for Trial 301 & 302
Design: Trials 301 & 302 are both Phase 3, multisite, double-blind, double-dummy, randomized, controlled trials comparing dalbavancin with a regimen of vancomycin followed by a possible switch to oral linezolid for patients with ABSSSI known or suspected to be caused by gram-positive bacteria. The initial sample size for Trial 301 & Trial 302 was planned to be 556 randomly assigned patients in the ITT population. In both trials, an interim analysis for sample size re-estimation was performed when early clinical response data at 48 to 72 hours were available for approximately 60% of the patients (334 patients). However, the sample size
Reference ID: 3505302
11
increase was only recommended in Trial 302 which enrolled 739 patients in order to maintain 90% study power.
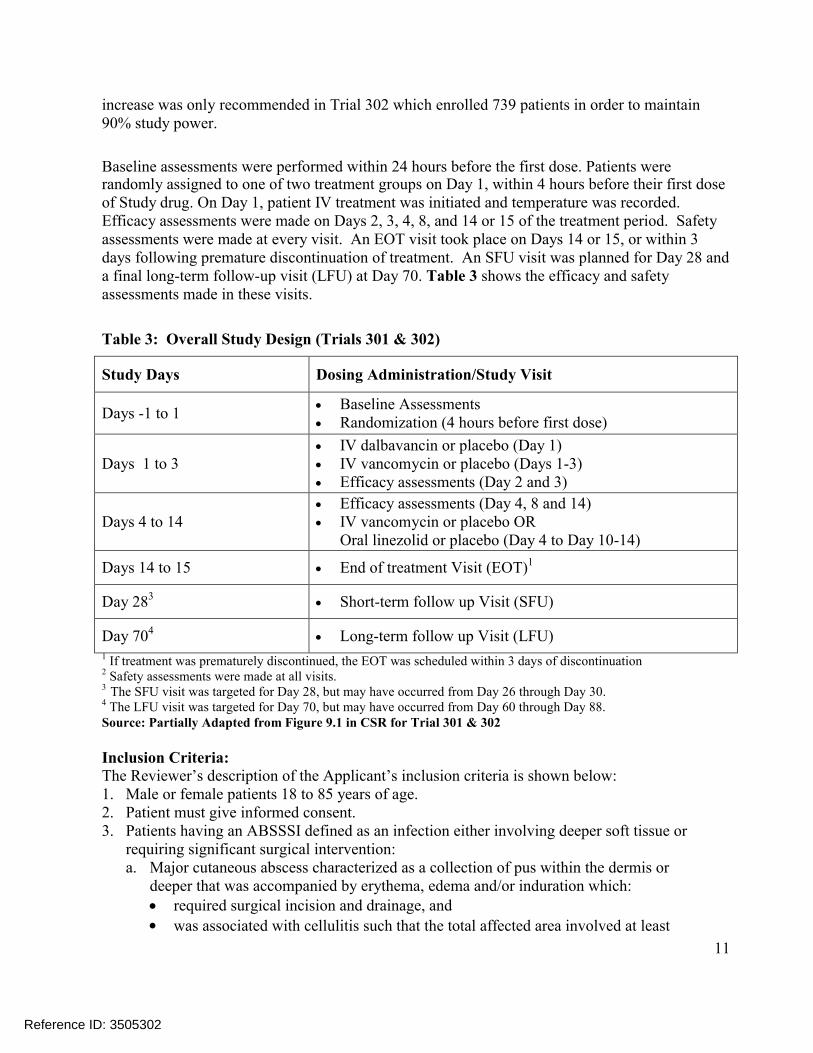
Baseline assessments were performed within 24 hours before the first dose. Patients wererandomly assigned to one of two treatment groups on Day 1, within 4 hours before their first dose of Study drug. On Day 1, patient IV treatment was initiated and temperature was recorded. Efficacy assessments were made on Days 2, 3, 4, 8, and 14 or 15 of the treatment period. Safetyassessments were made at every visit. An EOT visit took place on Days 14 or 15, or within 3 days following premature discontinuation of treatment. An SFU visit was planned for Day 28 and a final long-term follow-up visit (LFU) at Day 70. Table 3 shows the efficacy and safety assessments made in these visits.
Table 3: Overall Study Design (Trials 301 & 302)
Study Days Dosing Administration/Study Visit
Days -1 to 1 Baseline Assessments Randomization (4 hours before first dose)
Days 1 to 3 IV dalbavancin or placebo (Day 1) IV vancomycin or placebo (Days 1-3) Efficacy assessments (Day 2 and 3)
Days 4 to 14 Efficacy assessments (Day 4, 8 and 14) IV vancomycin or placebo OR
Oral linezolid or placebo (Day 4 to Day 10-14)
Days 14 to 15 End of treatment Visit (EOT)1
Day 283 Short-term follow up Visit (SFU)
Day 704 Long-term follow up Visit (LFU)
1 If treatment was prematurely discontinued, the EOT was scheduled within 3 days of discontinuation2 Safety assessments were made at all visits.3 The SFU visit was targeted for Day 28, but may have occurred from Day 26 through Day 30.4 The LFU visit was targeted for Day 70, but may have occurred from Day 60 through Day 88.Source: Partially Adapted from Figure 9.1 in CSR for Trial 301 & 302
Inclusion Criteria:The Reviewer’s description of the Applicant’s inclusion criteria is shown below:1. Male or female patients 18 to 85 years of age.2. Patient must give informed consent. 3. Patients having an ABSSSI defined as an infection either involving deeper soft tissue or
requiring significant surgical intervention:a. Major cutaneous abscess characterized as a collection of pus within the dermis or
deeper that was accompanied by erythema, edema and/or induration which: required surgical incision and drainage, and was associated with cellulitis such that the total affected area involved at least
Reference ID: 3505302
12
75 cm2 of erythema, and was defined by a margin of erythema that was ≥5 cm from the rim of induration or edema that defined the border of the abscess in all directions, or,
alternatively, involved the central face and was associated with an area of erythema of at least 50 cm2 and a margin ≥3 cm in all directions from the abscessrim.
b. Surgical site or traumatic wound infection characterized by purulent drainage withsurrounding erythema, edema, and/or induration which occurred within 30 days after the trauma or surgery and was associated with cellulitis such that: the total affected area involved at least 75 cm2 of erythema, and was defined by a margin of erythema in at least 1 direction that was ≥5 cm from
the edge of the wound, or alternatively, involved the central face and was associated with an affected area of
at least 50 cm2 and had a margin of erythema in at least 1 direction ≥3 cm from the wound edge.
c. Cellulitis, defined as a diffuse skin infection characterized by spreading areas oferythema, edema, and/or induration and was associated with erythema that involved at least 75 cm2 of surface area, or alternatively, cellulitis of the central face that was associated with an affected area of
at least 50 cm2.4. In addition to the requirement for erythema, all patients were required to have at least
2 of the following signs of ABSSSI: Purulent drainage/discharge Fluctuance Heat/localized warmth Tenderness to palpation Swelling/induration
5. Patients must have presented with ≥1 of the following systemic signs of infection:
An elevated body temperature ≥ 38°C/100.4°F within 24 hours of
Baseline
White blood cell (WBC) count >12,000 cells/mm3
A manually performed WBC differential count with ≥10% band forms,
regardless of peripheral WBC count6. Infection severity requiring a minimum of 3 days of IV therapy.
Patient was willing and able to comply with study procedures.
Exclusion Criteria:The Reviewer’s description of the Applicant’s exclusion criteria is shown below:
1. Patients with a contraindication to the administration of dalbavancin, vancomycin, or
linezolid.
2. Females of childbearing potential who were unable to take adequate contraceptive
precautions, had a positive pregnancy result within 24 hours prior to study entry, were
known to be pregnant, or were currently breastfeeding an infant.
Reference ID: 3505302

13
3. Patients with sustained shock, defined as systolic blood pressure < 90 mm Hg for more than
2 hours despite adequate fluid resuscitation, with evidence of hypotension or need for
sympathomimetic agents to maintain blood pressure.
4. Participation in another study of an investigational drug or device within 30 days before
this trial began.
5. Receipt of a systemically or topically administered antibiotic with a gram-positive spectrum
that achieved therapeutic concentrations in the serum or at the site of the ABSSSI within 14
days prior to randomization.
6. Infection due to an organism known prior to Study entry to be resistant to dalbavancin
or vancomycin (vancomycin minimum inhibitory concentration [MIC] >8 µg/mL).
7. Patients with evidence of meningitis, necrotizing fasciitis, gas gangrene, gangrene, septic
arthritis, osteomyelitis; endovascular infection.
8. Infections caused exclusively by gram-negative bacteria and infections caused by fungi,
whether alone or in combination with a bacterial pathogen.
9. Venous catheter entry site infection.
10. Infections that involved diabetic foot ulceration, a perirectal abscess or a decubitus ulcer.
11. Patient with an infected device, even if the device was removed.
12. Gram-negative bacteremia, even in the presence of gram-positive infection or
gram-positive bacteremia.
13. Patients whose ABSSSI was the result of having sustained full or partial thickness burns.
14. Patients with an infection involving a limb with evidence of critical ischemia of an
affected limb.
15. Patients with ABSSSI such as superficial/simple cellulitis/erysipelas, impetiginous
lesion, furuncle, or simple abscess that only required surgical drainage for cure.
16. Concomitant condition requiring any antibiotic therapy that would have interfered with
the assessment of study drug for the condition under study.
17. Anticipated need of antibiotic therapy for longer than 14 days.
18. Patients who were placed in a hyperbaric chamber as adjunctive therapy for the
ABSSSI.
19. More than 2 surgical interventions for the ABSSSI, or patients who were expected to
require more than 2 such interventions.
20. Medical conditions in which chronic inflammation may have precluded assessment of clinical
response to therapy even after successful treatment.
21. Absolute neutrophil count <500 cells/mm3.
22. Known or suspected human immunodeficiency virus infected patients.
23. Patients with a recent bone marrow transplant (in post-transplant hospital stay).
24. Patients who were receiving oral steroids >20 mg prednisolone per day (or equivalent)
or receiving immunosuppressant drugs after organ transplantation.
25. Patients who were receiving an antipyretic drug on a daily basis (whose regimen could not be
modified during the first 3 days of study drug therapy.
Reference ID: 3505302
14
26. Patients with a rapidly fatal illness, who were not expected to survive for 3 months.
27. Other severe acute or chronic medical or psychiatric condition or laboratory abnormality that
may have increased the risk associated with study.
28. Prior participation in Trial 301 or in Trial 302.
Randomization: A patient was eligible for randomization once it had been determined that he or
she met all of the inclusion criteria and none of the exclusion criteria. Patients were to be
randomly assigned in a 1:1 ratio to receive dalbavancin (2 doses given 1 week apart) and 10 to 14
days of placebo to vancomycin or 10 to 14 days of vancomycin/linezolid and 2 weekly doses of
placebo to dalbavancin with stratification by presence or absence of fever at Baseline (a minimum
of 40% of patients were to have fever at Baseline), geographic region, and infection type
(cellulitis, major abscess [maximum of 30% of the total study population], and traumatic wound
or surgical site infection) using block randomization (block size 4) via an Interactive Voice
Randomization System (IVRS).
Analysis Populations: The analysis populations were defined as follows: (Reviewer analyses
primarily considered the ITT population).
ITT population- All randomly assigned patients.
Safety Population- ITT patients who received at least 1 dose of dalbavancin or vancomycin
(active) study drug.
MicroITT- ITT patients who had at least 1 gram-positive bacterial pathogen isolated at Baseline.
The gram-positive bacterial pathogen must have been identified from a blood culture or from a
culture of a microbiological sample obtained from the primary ABSSSI site from an acceptable
source.
Clinically Evaluable Populations- Three CE populations were defined, the clinically evaluable at
the end-of-treatment visit (CE-EOT), clinically evaluable at the short-term follow-up visit (CE-
SFU), and clinically evaluable at the long-term follow-up visit (CE-LFU) populations. The CE
population used in the analysis depended on the time point of the outcome measure being
analyzed. The term “CE populations” was used to refer to all 3 of these CE populations. Key
criteria regarding the inclusion/exclusion from the CE populations included the following:
Patients had to adhere to protocol-defined inclusion/exclusion criteria (inclusion criteria 3,
4, 5, and 6 and exclusion criteria 5-16, 18-20, 23, and 24).
Patient had to receive the correct study drug based on the randomization assignment
Patients had to receive at least 1 dose (dalbavancin arm) or 50% of dosing (comparator
arm).
Reference ID: 3505302
15
Site personnel involved in the assessment of efficacy parameters remained had to remain
blinded to study treatment up to the time of the efficacy assessment.
Patients could not have received >1 dose of any systemic concomitant antibiotic therapy
(with the exception of systemic aztreonam, metronidazole, or oral vancomycin) which was
potentially effective against the causative pathogen from the first dose of study drug until
the EOT (CE-EOT population), the SFU (CE-SFU population), or the LFU (CE-LFU
population) for non-ABSSSI indications.
Meet clinical assessment criteria:
o For the CE-EOT population- Completed the EOT assessments such that the patient
could be defined as a clinical success or failure;
o For the CE-SFU population- Completed the SFU assessments such that the patient
could be defined as a clinical success or failure, unless the patient was considered a
clinical failure at EOT;
o For the CE-LFU population- Completed the investigator’s assessment of response (i.e.
was deemed either a continued success or a relapse/recurrence) at LFU;
ME population: All patients in both the MicroITT and CE-EOT populations.
Sample Size Determination: Sample size was determined based on the method of Farrington
and Manning6. The sample size determination assumed a 1-sided alpha of 0.025, a 10% NI
margin, 85% clinical response rate and 90% power. The 85% clinical response rate was based
on a retrospective analysis in patients with cellulitis, major abscess, surgical or traumatic
wound infection with a Baseline lesion area of ≥ 75 cm2 included in VER001-9 Study
(excluding missing data). A point estimate of 81% (293/362; 95% CI, 77% to 85%) of patients
were clinical responders. The 85% clinical response estimate is based on the upper bound of
this confidence interval.
Study Endpoints
Primary Efficacy Outcome Measure: The primary outcome measure was clinical response at
48-72 hours (± 3 hours, i.e., 45-75 hours) post study drug initiation.
Responders were defined according to the following criteria:
The patient had no increase in lesion area at 48 to 72 hours after the first dose of Study
drug therapy compared with the baseline measurement, and
The patient had a temperature ≤ 37.6°C within 48 to 72 hours after the first dose of Study
therapy followed by 2 additional temperature measurements ≤ 37.6°C separated
by at least 3 hours and no more than 9 hours apart, and no intervening temperature
>37.6°C (any method of temperature measurement).
Reference ID: 3505302
16
Lesion area was defined as length × width, and lesion size was defined as length or width. The
Baseline lesion measurement was defined as the measurement taken closest to but before the
first dose of study drug. If multiple lesions measurements were taken within
48 to 72 hours after the first dose of study drug, the latest lesion measurement was used.
A patient was defined as a clinical non-responder based on the following criteria:
The patient failed to meet the above responder criteria; or
The patient died from any cause within the first 72 hours; or
The patient initiated a new systemic antibacterial with gram-positive activity for the
ABSSSI under study within the first 72 hours; or
The patient had missing data at 48 to 72 hours for lesion size or temperature such that a
clinical outcome could not be defined.
Secondary Efficacy Outcome Measure: The Applicant also pre-specified a secondary endpoint
based on clinical status at EOT. The requirements for clinical success at EOT are shown below:
The patient’s lesion size, as defined by erythema, was decreased from Baseline;
The patient’s temperature was ≤ 37.6°C (by any measurement method);
Local signs of fluctuance and localized heat/warmth were absent;
Local signs of tenderness to palpation and swelling/induration were no worse than
mild; and
For patients with a wound infection, the severity of purulent drainage was improved
and no worse than mild relative to Baseline.
Patients meeting any of the criteria below were classified as clinical failures:
The patient failed to meet any of the above success criteria
The patient received a new non-study systemic antibacterial treatment for the ABSSSI
at any time from the first dose of study drug through the visit, or
The patient died during the study period up to the visit, or
Unless preplanned as part of nondrug therapy for the ABSSSI, the patient required
surgical intervention more than 72 hours after the start of therapy for treatment of the
ABSSSI under study, or
The patient received study therapy for the ABSSSI under study beyond the protocol
treatment period as a result of the investigator’s assessment that additional drug
therapy was needed for treatment of the underlying skin infection.
The Applicant also evaluated clinical status at SFU using the same criteria.
Other Outcome Measures: The Applicant also considered investigator assessment at EOT and SFU with success/failure criteria shown in Table 4.
Reference ID: 3505302

17
Table 4: Investigator Assessment- Definition of Success/Failure
Success Resolution or improvement of all signs and symptoms of the infection to such an extent that no further antibacterial treatment was given
Failure Any of the following: Persistence of ≥1 local or systemic signs and symptoms of ABSSSI such that
new systemic antibacterial treatment was given Unplanned surgical intervention >72 hours after start of therapy for the treatment
of ABSSSI TEAE leading to discontinuation of study drug, and patient required additional antibiotic therapy to treat the ABSSSI
Received study therapy beyond the protocol treatment period as a result of theinvestigator’s assessment that additional drug therapy is needed for treatment of the underlying skin infection
Death during the study periodSource: Applicant Table 9.6 in Trial 301 CSR
3.2.2 Subject Disposition, Demographic and Baseline Characteristics
Subject Disposition
Subject disposition in Trials 301 and 302 is shown in the figures below. In Trial 301, there were
573 patients randomly assigned to treatment (288 patients and 285 patients in the dalbavancin and
comparator groups), and 518 patients completed the study (261 patients and 257 patients in the
dalbavancin and comparator groups). In Trial 302, 739 patients were randomly assigned to
treatment (371 and 368 patients in the dalbavancin and comparator groups), and 665 patients
completed the study (332 and 333 patients in the dalbavancin and comparator groups).
Reference ID: 3505302

18
Figure 1: Trial 301- Subject Disposition (ITT)
Source: Partially Adapted from Applicant Figure 10.1 in Trial 301 CSR
Figure 2: Trial 302- Subject Disposition (ITT)
Source: Partially Adapted from Applicant Figure 10.1 in Trial 302 CSR
Reference ID: 3505302
19
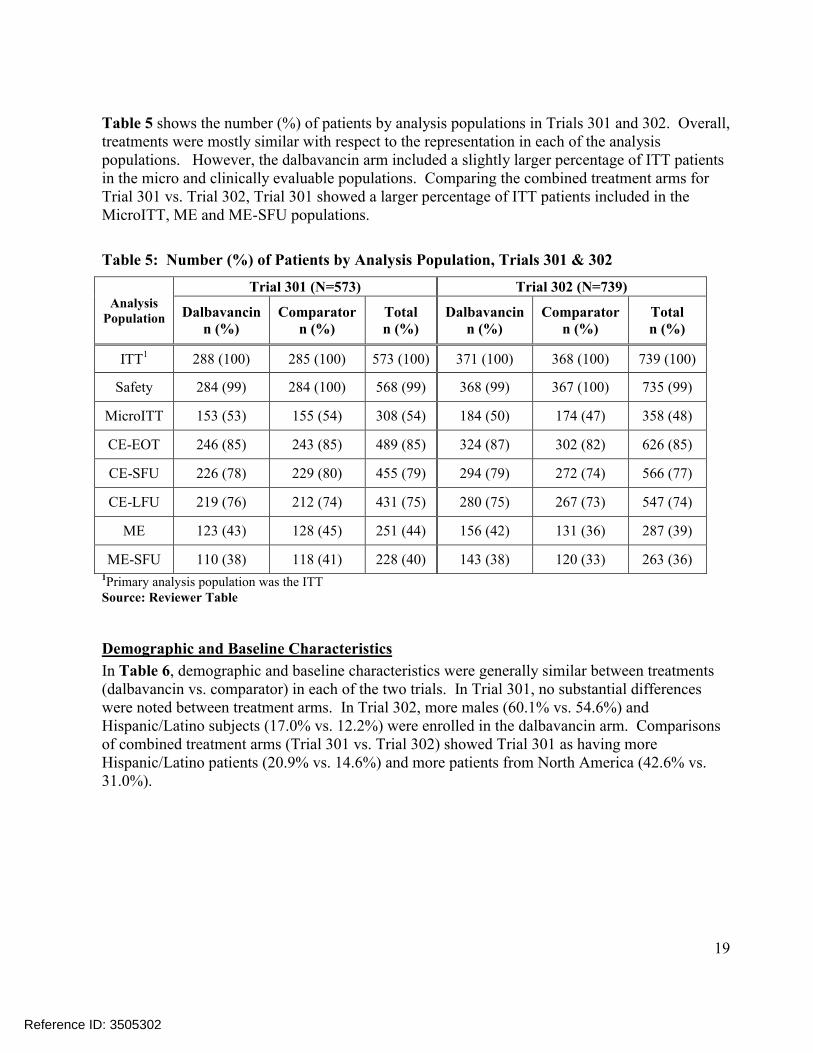
Table 5 shows the number (%) of patients by analysis populations in Trials 301 and 302. Overall, treatments were mostly similar with respect to the representation in each of the analysis populations. However, the dalbavancin arm included a slightly larger percentage of ITT patients in the micro and clinically evaluable populations. Comparing the combined treatment arms for Trial 301 vs. Trial 302, Trial 301 showed a larger percentage of ITT patients included in the MicroITT, ME and ME-SFU populations.
Table 5: Number (%) of Patients by Analysis Population, Trials 301 & 302
Analysis Population
Trial 301 (N=573) Trial 302 (N=739)
Dalbavancinn (%)
Comparatorn (%)
Totaln (%)
Dalbavancinn (%)
Comparatorn (%)
Totaln (%)
ITT1 288 (100) 285 (100) 573 (100) 371 (100) 368 (100) 739 (100)
Safety 284 (99) 284 (100) 568 (99) 368 (99) 367 (100) 735 (99)
MicroITT 153 (53) 155 (54) 308 (54) 184 (50) 174 (47) 358 (48)
CE-EOT 246 (85) 243 (85) 489 (85) 324 (87) 302 (82) 626 (85)
CE-SFU 226 (78) 229 (80) 455 (79) 294 (79) 272 (74) 566 (77)
CE-LFU 219 (76) 212 (74) 431 (75) 280 (75) 267 (73) 547 (74)
ME 123 (43) 128 (45) 251 (44) 156 (42) 131 (36) 287 (39)
ME-SFU 110 (38) 118 (41) 228 (40) 143 (38) 120 (33) 263 (36)1Primary analysis population was the ITTSource: Reviewer Table
Demographic and Baseline Characteristics
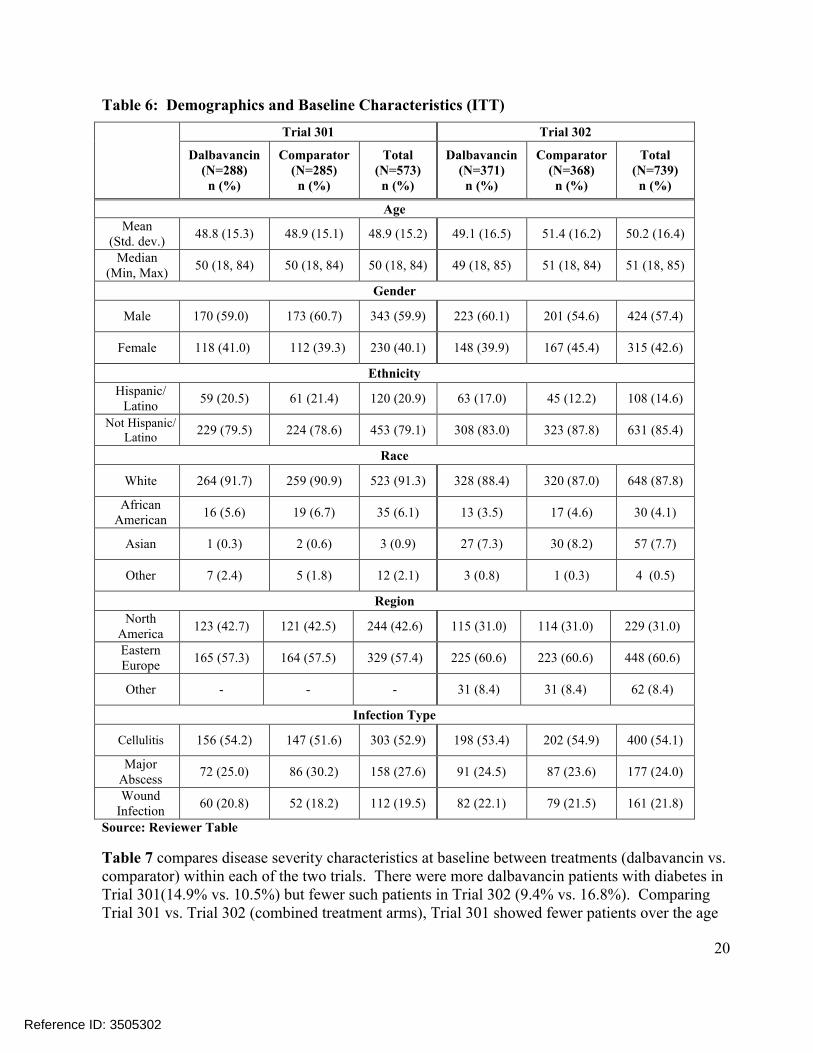
In Table 6, demographic and baseline characteristics were generally similar between treatments (dalbavancin vs. comparator) in each of the two trials. In Trial 301, no substantial differences were noted between treatment arms. In Trial 302, more males (60.1% vs. 54.6%) andHispanic/Latino subjects (17.0% vs. 12.2%) were enrolled in the dalbavancin arm. Comparisons of combined treatment arms (Trial 301 vs. Trial 302) showed Trial 301 as having moreHispanic/Latino patients (20.9% vs. 14.6%) and more patients from North America (42.6% vs. 31.0%).
Reference ID: 3505302
20
Table 6: Demographics and Baseline Characteristics (ITT)
Trial 301 Trial 302
Dalbavancin(N=288)n (%)
Comparator(N=285)n (%)
Total(N=573)n (%)
Dalbavancin(N=371)n (%)
Comparator(N=368)n (%)
Total(N=739)n (%)
Age
Mean (Std. dev.)
48.8 (15.3) 48.9 (15.1) 48.9 (15.2) 49.1 (16.5) 51.4 (16.2) 50.2 (16.4)
Median(Min, Max)
50 (18, 84) 50 (18, 84) 50 (18, 84) 49 (18, 85) 51 (18, 84) 51 (18, 85)
Gender
Male 170 (59.0) 173 (60.7) 343 (59.9) 223 (60.1) 201 (54.6) 424 (57.4)
Female 118 (41.0) 112 (39.3) 230 (40.1) 148 (39.9) 167 (45.4) 315 (42.6)
Ethnicity
Hispanic/Latino
59 (20.5) 61 (21.4) 120 (20.9) 63 (17.0) 45 (12.2) 108 (14.6)
Not Hispanic/Latino
229 (79.5) 224 (78.6) 453 (79.1) 308 (83.0) 323 (87.8) 631 (85.4)
Race
White 264 (91.7) 259 (90.9) 523 (91.3) 328 (88.4) 320 (87.0) 648 (87.8)
African American
16 (5.6) 19 (6.7) 35 (6.1) 13 (3.5) 17 (4.6) 30 (4.1)
Asian 1 (0.3) 2 (0.6) 3 (0.9) 27 (7.3) 30 (8.2) 57 (7.7)
Other 7 (2.4) 5 (1.8) 12 (2.1) 3 (0.8) 1 (0.3) 4 (0.5)
Region
North America
123 (42.7) 121 (42.5) 244 (42.6) 115 (31.0) 114 (31.0) 229 (31.0)
Eastern Europe
165 (57.3) 164 (57.5) 329 (57.4) 225 (60.6) 223 (60.6) 448 (60.6)
Other - - - 31 (8.4) 31 (8.4) 62 (8.4)
Infection Type
Cellulitis 156 (54.2) 147 (51.6) 303 (52.9) 198 (53.4) 202 (54.9) 400 (54.1)
Major Abscess
72 (25.0) 86 (30.2) 158 (27.6) 91 (24.5) 87 (23.6) 177 (24.0)
Wound Infection
60 (20.8) 52 (18.2) 112 (19.5) 82 (22.1) 79 (21.5) 161 (21.8)
Source: Reviewer Table
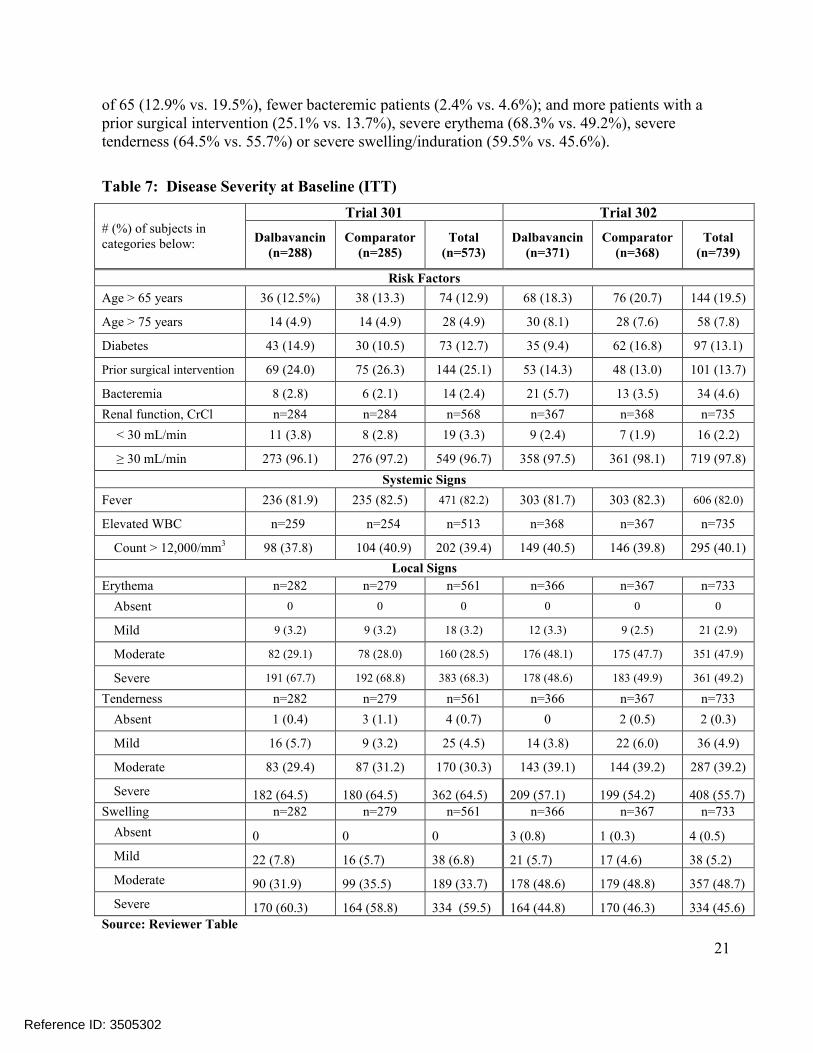
Table 7 compares disease severity characteristics at baseline between treatments (dalbavancin vs. comparator) within each of the two trials. There were more dalbavancin patients with diabetes in Trial 301(14.9% vs. 10.5%) but fewer such patients in Trial 302 (9.4% vs. 16.8%). ComparingTrial 301 vs. Trial 302 (combined treatment arms), Trial 301 showed fewer patients over the age
Reference ID: 3505302
21
of 65 (12.9% vs. 19.5%), fewer bacteremic patients (2.4% vs. 4.6%); and more patients with aprior surgical intervention (25.1% vs. 13.7%), severe erythema (68.3% vs. 49.2%), severe tenderness (64.5% vs. 55.7%) or severe swelling/induration (59.5% vs. 45.6%).
Table 7: Disease Severity at Baseline (ITT)
# (%) of subjects in categories below:
Trial 301 Trial 302
Dalbavancin(n=288)
Comparator(n=285)
Total(n=573)
Dalbavancin(n=371)
Comparator(n=368)
Total(n=739)
Risk Factors
Age > 65 years 36 (12.5%) 38 (13.3) 74 (12.9) 68 (18.3) 76 (20.7) 144 (19.5)
Age > 75 years 14 (4.9) 14 (4.9) 28 (4.9) 30 (8.1) 28 (7.6) 58 (7.8)
Diabetes 43 (14.9) 30 (10.5) 73 (12.7) 35 (9.4) 62 (16.8) 97 (13.1)
Prior surgical intervention 69 (24.0) 75 (26.3) 144 (25.1) 53 (14.3) 48 (13.0) 101 (13.7)
Bacteremia 8 (2.8) 6 (2.1) 14 (2.4) 21 (5.7) 13 (3.5) 34 (4.6)
Renal function, CrCl n=284 n=284 n=568 n=367 n=368 n=735
< 30 mL/min 11 (3.8) 8 (2.8) 19 (3.3) 9 (2.4) 7 (1.9) 16 (2.2)
≥ 30 mL/min 273 (96.1) 276 (97.2) 549 (96.7) 358 (97.5) 361 (98.1) 719 (97.8)
Systemic Signs
Fever 236 (81.9) 235 (82.5) 471 (82.2) 303 (81.7) 303 (82.3) 606 (82.0)
Elevated WBC n=259 n=254 n=513 n=368 n=367 n=735
Count > 12,000/mm3 98 (37.8) 104 (40.9) 202 (39.4) 149 (40.5) 146 (39.8) 295 (40.1)
Local Signs
Erythema n=282 n=279 n=561 n=366 n=367 n=733
Absent 0 0 0 0 0 0
Mild 9 (3.2) 9 (3.2) 18 (3.2) 12 (3.3) 9 (2.5) 21 (2.9)
Moderate 82 (29.1) 78 (28.0) 160 (28.5) 176 (48.1) 175 (47.7) 351 (47.9)
Severe 191 (67.7) 192 (68.8) 383 (68.3) 178 (48.6) 183 (49.9) 361 (49.2)
Tenderness n=282 n=279 n=561 n=366 n=367 n=733
Absent 1 (0.4) 3 (1.1) 4 (0.7) 0 2 (0.5) 2 (0.3)
Mild 16 (5.7) 9 (3.2) 25 (4.5) 14 (3.8) 22 (6.0) 36 (4.9)
Moderate 83 (29.4) 87 (31.2) 170 (30.3) 143 (39.1) 144 (39.2) 287 (39.2)
Severe 182 (64.5) 180 (64.5) 362 (64.5) 209 (57.1) 199 (54.2) 408 (55.7)Swelling n=282 n=279 n=561 n=366 n=367 n=733
Absent 0 0 0 3 (0.8) 1 (0.3) 4 (0.5)
Mild 22 (7.8) 16 (5.7) 38 (6.8) 21 (5.7) 17 (4.6) 38 (5.2)
Moderate 90 (31.9) 99 (35.5) 189 (33.7) 178 (48.6) 179 (48.8) 357 (48.7)
Severe 170 (60.3) 164 (58.8) 334 (59.5) 164 (44.8) 170 (46.3) 334 (45.6)Source: Reviewer Table
Reference ID: 3505302
22
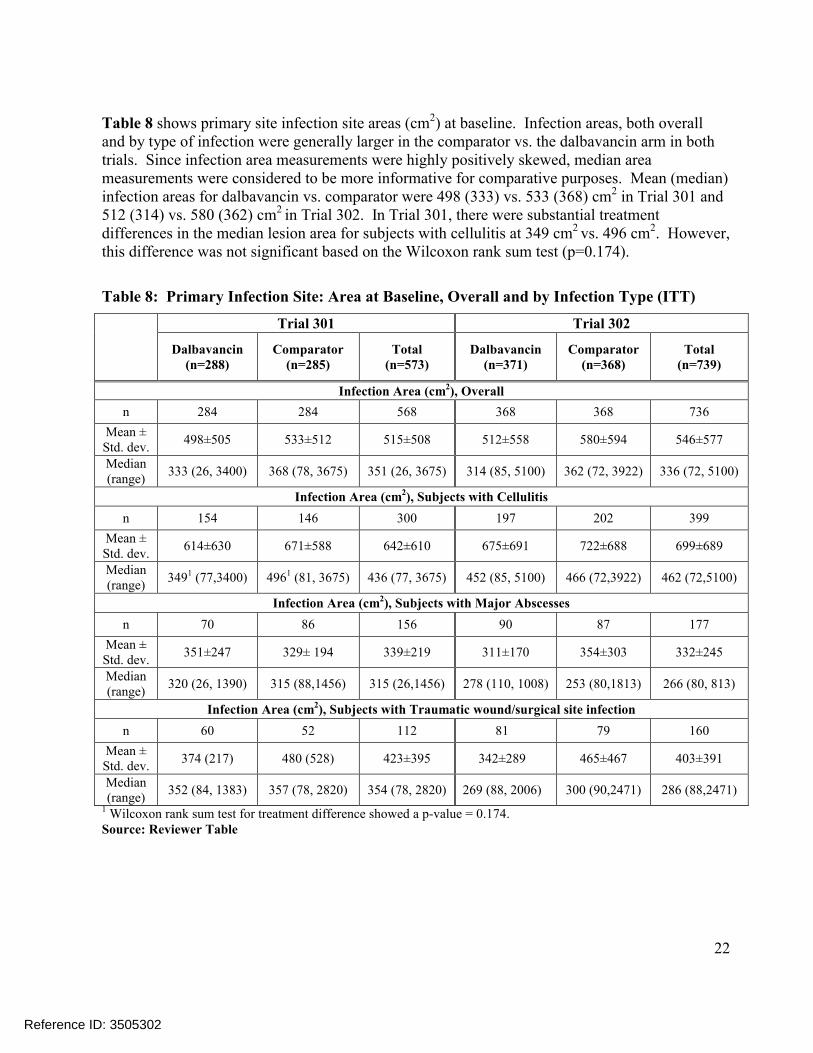
Table 8 shows primary site infection site areas (cm2) at baseline. Infection areas, both overall and by type of infection were generally larger in the comparator vs. the dalbavancin arm in both trials. Since infection area measurements were highly positively skewed, median area measurements were considered to be more informative for comparative purposes. Mean (median) infection areas for dalbavancin vs. comparator were 498 (333) vs. 533 (368) cm2 in Trial 301 and 512 (314) vs. 580 (362) cm2 in Trial 302. In Trial 301, there were substantial treatment differences in the median lesion area for subjects with cellulitis at 349 cm2 vs. 496 cm2. However, this difference was not significant based on the Wilcoxon rank sum test (p=0.174).
Table 8: Primary Infection Site: Area at Baseline, Overall and by Infection Type (ITT)
Trial 301 Trial 302
Dalbavancin(n=288)
Comparator(n=285)
Total(n=573)
Dalbavancin(n=371)
Comparator(n=368)
Total(n=739)
Infection Area (cm2), Overall
n 284 284 568 368 368 736
Mean ± Std. dev.
498±505 533±512 515±508 512±558 580±594 546±577
Median (range)
333 (26, 3400) 368 (78, 3675) 351 (26, 3675) 314 (85, 5100) 362 (72, 3922) 336 (72, 5100)
Infection Area (cm2), Subjects with Cellulitis
n 154 146 300 197 202 399
Mean ± Std. dev.
614±630 671±588 642±610 675±691 722±688 699±689
Median (range)
3491 (77,3400) 4961 (81, 3675) 436 (77, 3675) 452 (85, 5100) 466 (72,3922) 462 (72,5100)
Infection Area (cm2), Subjects with Major Abscesses
n 70 86 156 90 87 177
Mean ± Std. dev.
351±247 329± 194 339±219 311±170 354±303 332±245
Median (range)
320 (26, 1390) 315 (88,1456) 315 (26,1456) 278 (110, 1008) 253 (80,1813) 266 (80, 813)
Infection Area (cm2), Subjects with Traumatic wound/surgical site infection
n 60 52 112 81 79 160
Mean ± Std. dev.
374 (217) 480 (528) 423±395 342±289 465±467 403±391
Median (range)
352 (84, 1383) 357 (78, 2820) 354 (78, 2820) 269 (88, 2006) 300 (90,2471) 286 (88,2471)
1 Wilcoxon rank sum test for treatment difference showed a p-value = 0.174.Source: Reviewer Table
Reference ID: 3505302
23
3.2.3 Statistical Methodologies
Statistical Methodologies (Applicant)
The primary efficacy analysis was performed on the ITT population. The NI test was a 1-sided hypothesis test performed at the 2.5% level of significance and was based on the lower limit ofthe 2-sided 95% confidence interval (CI). The primary efficacy outcome measure was clinical response at 48 to 72 hours. The primary efficacy analysis was adjusted for the randomizationstratification factor of presence or absence of fever at Baseline.
The number and percentage of patients in each treatment group defined as a clinical responderand non-responder were tabulated. The null and alternative hypotheses were as follows:
H 0 : p1 − p2 ≤ −∆
H1 : p1 − p2 > −∆
where p1 was the rate of the primary efficacy outcome measure in the dalbavancin treatment group, p2 was the rate of the primary efficacy outcome measure in vancomycin/linezolid treatment group, and Δ was the NI margin of 10%.
To test the null hypothesis, a 2-sided 95% CI for the observed difference in primary outcome rates (dalbavancin treatment group minus vancomycin/linezolid treatment group) was calculated.If the lower limit of the 95% CI for the treatment difference in the ITT population exceeded –10%, then the null hypothesis was rejected and the non-inferiority of dalbavancin to vancomycin/linezolid was concluded.
The 2-sided 95% CI for non-inferiority testing based on the difference of clinical response rates at 48-72 hours was computed using the method proposed with stratification by Miettinen and Nurminen5 as described at the end of the Appendix.
NI Margin (Delta) Selection: A 10% non-inferiority margin was used to determine treatment efficacy in the primary analysis of Trials 301 and 302. A 10% NI margin is supported by findings from two historical studies (Snodgrass et. al, 1937)3,4 comparing sulfonamides to UV light in patients diagnosed with erysipelas at the 48-72 hour time points.
Interim Analyses: In order to ensure that the point estimate of early clinical response used in the estimation of sample size was valid for this Study, an interim analysis for sample size re-estimation (SSR) was performed when early clinical response data at 48 to 72 hours were available for approximately 60% of the patients (334 patients). The interim analysis involved a SSR to either confirm the initial sample size estimate was adequate or increase the sample size to ensure the Study had adequate power for determining whether dalbavancin was non-inferior to vancomycin/linezolid for the primary outcome measure. The sample size re-estimation was based on the blinded overall (not by treatment group) clinical response rate and was conducted by anindependent, blinded statistician. A Data Monitoring Committee (DMC) was provided with theresults of the interim analysis by the independent, blinded statistician and made a recommendation regarding changes to the sample size.
Reference ID: 3505302

24
Reviewer Comments: The sample size was increased only in Trial 302 from an initially planned number of 556 subjects to approximately 740 subjects. This increase was based on the overall response rate observed at the interim analysis (i.e. 78.7%) which fell below the assumed rate of 85%. In order to maintain study power at 90%, the DMC recommended that the sample size be increased to 740 subjects. The actual number of ITT subjects in Trial 302 was 739.
Missing Data: The Applicant notes the following regarding the handling of missing data in primary and secondary analyses.
For the primary outcome measure (clinical response at 48 to 72 hours), the patient was considered to have missing data if there was no lesion measurement at Baseline and/or in the 48 to 72 hour (after first dose of study drug) time period. In addition, the patient was considered to have missing data if there were not 3 temperature measurements in the 48 to 72 hour time period taken 6 hours (±3 hours) apart. Patients with missing data were defined as a non-responder for the primary analysis (ITT analysis).
For the secondary outcome measure (clinical status at EOT), patients were defined as an indeterminate if any data needed to determine whether a patient was a success or failure were missing. For example, if the assessment of the local signs was not completed at EOT, for any reason, the patient was considered an indeterminate response. By definition, patients with an indeterminate response were included in the denominator for analyses in the ITT and MicroITT populations, and were considered failures.
For the investigator’s assessment of clinical response at EOT and SFU, patients were considered an indeterminate response if data were not available for the evaluation of efficacy at EOT and SFU for any reason.
For the investigator’s assessment of clinical status at LFU, analysis of clinical status at LFU was only conducted in the CE-LFU population and in those patients who were a clinical success at EOT and SFU. Patients with missing data were excluded from the CE-LFU population and thus, were not included in the analysis.
For microbiologic response, if no acceptable EOT source specimen was obtained and the patient had a clinical response assessment, the per-pathogen microbiological response was based on the clinical response assessment. A per-pathogen microbiological response at EOT was considered missing or indeterminate only if the clinical status at EOT was also missing or indeterminate.
A sensitivity analysis was completed for clinical status at EOT in the ITT population.Multiple imputation methods using a Markov chain Monte Carlo full data imputation was used to define missing data (i.e. patients with an indeterminate outcome). Two models were run, the first utilized type of infection as a predictive variable and the second utilized clinical response at 48 to 72 hours as a predictive variable.
Multiple Comparisons Adjustment: In the Applicant’s primary hypotheses, only one statistical hypothesis was tested. All secondary and additional efficacy analyses were considered descriptive and supportive of the primary efficacy analysis. Therefore, no adjustments were madeto control for inflation of the type I error rate.
Reference ID: 3505302
25
Covariates: No adjustments for covariates were made to the primary analyses in the main analyses.
Statistical Methodologies (Reviewer)
The Reviewer also conducted the Applicant’s primary analyses. Similar to the Applicant’s primary analysis, responder rates in Reviewer analyses were evaluated using the lower 95% confidence limit of the treatment difference (dalbavancin minus comparator). Estimation of 95% confidence limits for the treatment difference in clinical response rates at 48-72 hours was also performed using the method proposed by Miettinen and Nurminen5, adjusting for baseline fever status. Patients with missing data at the specified visit were generally considered as non-responders or failures.
To address both the Applicant’s pre-specified primary endpoint and the primary endpoint recommended in the current ABSSI guidance1, the Reviewer considered the former as the primary endpoint and the latter as a “key” secondary endpoint thought to play a pivotal role in determining overall efficacy. To further assess the robustness of findings during earlier time points, the Reviewer’s analyses also compared the distributions of patients in each treatment arm meeting various other % reductions in lesion area at 48-72 hours.
After an evaluation of findings from earlier time points, the Reviewer then explored the question of whether the efficacy observed at 48-72 hours is consistent with that of later time points, such asat EOT on Day 14-15 and SFU on Day 26-30. To do this, the Reviewer’s analyses primarily considered the clinical status at EOT (pre-specified secondary endpoint) and clinical status at SFUendpoints. However, these endpoints may not offer a clear interpretation since they did not allow for inferential testing due to uncertainty in the NI margin for later endpoints nor have any pre-specified ‘win/lose’ criteria. The clinical status endpoints also had other limitations in making efficacy comparisons. For example, these endpoints lacked appropriate success criteria relating to the required % reductions in lesion area and resolution of local signs (e.g. erythema).
Due to these limitations, the Reviewer conducted additional sensitivity analyses (referred to as S1-S4) which placed further requirements on success. In S1 & S2, clinical success at EOT required at least an 80% and 90% reduction in lesion size, respectively, along with an investigator rating for erythema of no worse than mild. In S3, clinical success at SFU required completeresolution (absence) of all local signs except for mild erythema if the lesion area is ≤ 10% of the baseline lesion area. In S4, clinical successes at SFU required complete resolution of all local signs. Local signs included purulent drainage/discharge, erythema, fluctuance, heat/warmth, tenderness to palpation, and swelling/induration. In addition to these sensitivity analyses, the Reviewer also performed concordance analyses to further explore the relationship between clinical response at 48-72 hours and clinical success (or complete resolution) at later visits.
These and other sensitivity analyses of interest are summarized below: Clinical Status at EOT Visit (ITT population) with stricter requirements for reductions in
lesion area, such as 80% and 90% reduction in the ITT population (S1 & S2).
Complete resolution of local signs at SFU with and without allowance of 10% residual
erythema in the ITT population (S3 & S4).
Reference ID: 3505302
26
Success/resolution rates at EOT/SFU by responder status at 48-72 hours (concordance).
Distributions of % reductions in erythema at 48-72 hours, EOT and SFU.
Reasons for failure at 48-72 hours, EOT and SFU.
Changes in individual local signs at EOT and SFU.
Other analyses (e.g. clinical success rates at SFU by creatinine clearance at baseline,
responder rates by NSAID use, etc.).
Reviewer Comments: The analysis population considered was the ITT, unless otherwise stated.
Confidence intervals displayed in the Reviewer tables for analyses of endpoints after 48-72 hours
(e.g. EOT and SFU) generally used the Miettinen and Nurminen approach without adjustments.
3.2.4 Results and Conclusions
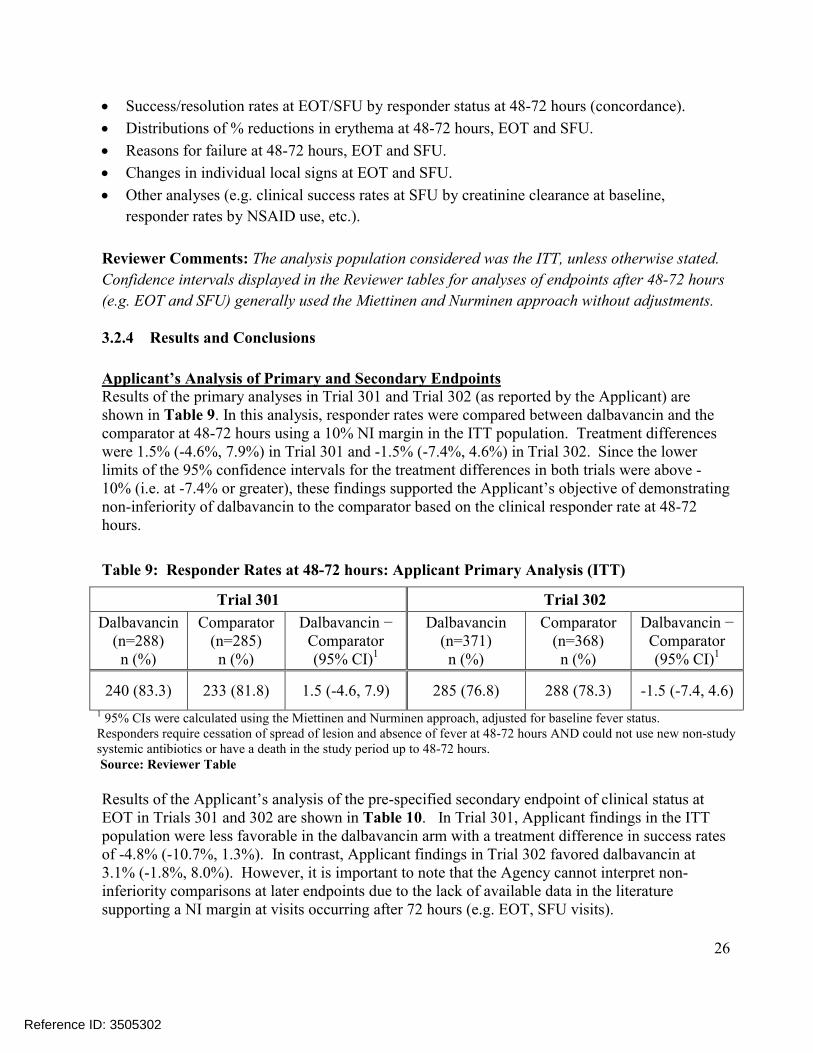
Applicant’s Analysis of Primary and Secondary EndpointsResults of the primary analyses in Trial 301 and Trial 302 (as reported by the Applicant) are shown in Table 9. In this analysis, responder rates were compared between dalbavancin and the comparator at 48-72 hours using a 10% NI margin in the ITT population. Treatment differences were 1.5% (-4.6%, 7.9%) in Trial 301 and -1.5% (-7.4%, 4.6%) in Trial 302. Since the lower limits of the 95% confidence intervals for the treatment differences in both trials were above -10% (i.e. at -7.4% or greater), these findings supported the Applicant’s objective of demonstrating non-inferiority of dalbavancin to the comparator based on the clinical responder rate at 48-72 hours.
Table 9: Responder Rates at 48-72 hours: Applicant Primary Analysis (ITT)
Trial 301 Trial 302
Dalbavancin (n=288)n (%)
Comparator(n=285)n (%)
Dalbavancin − Comparator(95% CI)1
Dalbavancin (n=371)n (%)
Comparator(n=368)n (%)
Dalbavancin − Comparator(95% CI)1
240 (83.3) 233 (81.8) 1.5 (-4.6, 7.9) 285 (76.8) 288 (78.3) -1.5 (-7.4, 4.6)
1 95% CIs were calculated using the Miettinen and Nurminen approach, adjusted for baseline fever status.Responders require cessation of spread of lesion and absence of fever at 48-72 hours AND could not use new non-studysystemic antibiotics or have a death in the study period up to 48-72 hours.Source: Reviewer Table
Results of the Applicant’s analysis of the pre-specified secondary endpoint of clinical status at EOT in Trials 301 and 302 are shown in Table 10. In Trial 301, Applicant findings in the ITT population were less favorable in the dalbavancin arm with a treatment difference in success rates of -4.8% (-10.7%, 1.3%). In contrast, Applicant findings in Trial 302 favored dalbavancin at 3.1% (-1.8%, 8.0%). However, it is important to note that the Agency cannot interpret non-inferiority comparisons at later endpoints due to the lack of available data in the literature supporting a NI margin at visits occurring after 72 hours (e.g. EOT, SFU visits).
Reference ID: 3505302

27
Reviewer Comments: The Agency also considers NI comparisons in the ITT population to be more interpretable as this population is protected by randomization.
Table 10: Success Rates for Clinical Status at EOT, Applicant Analyses
Trial 301 Trial 302
Dalbavancin n/N (%)
Comparatorn/N (%)
Difference (95% CI)
Dalbavancin n/N (%)
Comparator n/N (%)
Difference (95% CI)
ITT Population
236/288 (81.9) 247/285 (86.7) -4.8 (-10.7, 1.3) 329/371 (88.7) 315/368 (85.6) 3.1 (-1.8, 8.0)
CE-EOT Population
214/246 (87.0) 222/243 (91.4) -4.4 (-10.0, 1.2) 303/324 (93.5) 280/302 (92.7) 0.8 (-3.3, 5.0)
1 95% CIs were calculated using the Miettinen and Nurminen approach, adjusted for fever status at baseline. Source: Reviewer Table
Reviewer Comments: The Applicant also evaluated success rates based on investigator assessment at EOT & SFU. Findings from these analyses are shown in the Appendix, Table Table 30.
Reviewer Analyses of Primary and Key Secondary Endpoints
In Table 11, responder rates for cessation of spread of lesion and absence of fever were the same as those of the Applicant at 83.3% vs. 81.8%, 1.5% (-4.6%, 7.9%) in Trial 301 and 76.8% vs. 78.3%, -1.5% (-7.4%, 4.6%) in Trial 302. Responder rates based on at least a 20% reduction in lesion size at 48-72 hours (with no fever component) were 89.9% vs. 90.9%, -1.0% (-5.7%, 4.0%) in Trial 301 and 87.6% vs. 85.9%, 1.7% (-3.2%, 6.7%) in Trial 302. These results further supported the non-inferiority of dalbavancin to the comparator at 48-72 hours from baseline since the lower limit of the 95% CI for the treatment difference was at or above -7.4% (i.e. greater than -10%) in all analyses below.
Table 11: Reviewer Analyses: Responder Rates at 48-72 hours (ITT)
Trial 301 Trial 302
ResponderRates:
Dalbavancin (N=288)
n (%)
Comparator (N=285)
n (%)
Difference (95% CI)1
Comparator (N=371)
n (%)
Dalbavancin (N=368)
n (%)
Difference (95% CI)1
Primary Cessation of spread & afebrileat 48-72 hrs
240 (83.3) 233 (81.8) 1.5 (-4.6, 7.9) 285 (76.8) 288 (78.3) -1.5 (-7.4, 4.6)
Key Secondary ≥ 20% reduction in lesion area at 48-72 hrs
259 (89.9) 259 (90.9) -1.0 (-5.7, 4.0) 325 (87.6) 316 (85.9) 1.7 (-3.2, 6.7)
Reference ID: 3505302
28
Trial 301 Trial 302
ResponderRates:
Dalbavancin (N=288)
n (%)
Comparator (N=285)
n (%)
Difference (95% CI)1
Comparator (N=371)
n (%)
Dalbavancin (N=368)
n (%)
Difference (95% CI)1
Primary Cessation of spread & afebrileat 48-72 hrs
240 (83.3) 233 (81.8) 1.5 (-4.6, 7.9) 285 (76.8) 288 (78.3) -1.5 (-7.4, 4.6)
1 95% CIs were calculated using the Miettinen and Nurminen approach, adjusted for baseline fever status.Responders also could not use new non-study systemic antibiotics or have a death in the study period up to 48-72 hours.Source: Reviewer Table
Reviewer Comment: In the table above, there were 7 patients who did not receive any treatment and were counted as nonresponders (3 dalbavancin patients in Trial 301; 3 dalbavancin patients and 1 comparator patient in Trial 302). Error! Reference source not found.
Reviewer Analyses of Later Endpoints (EOT & SFU)
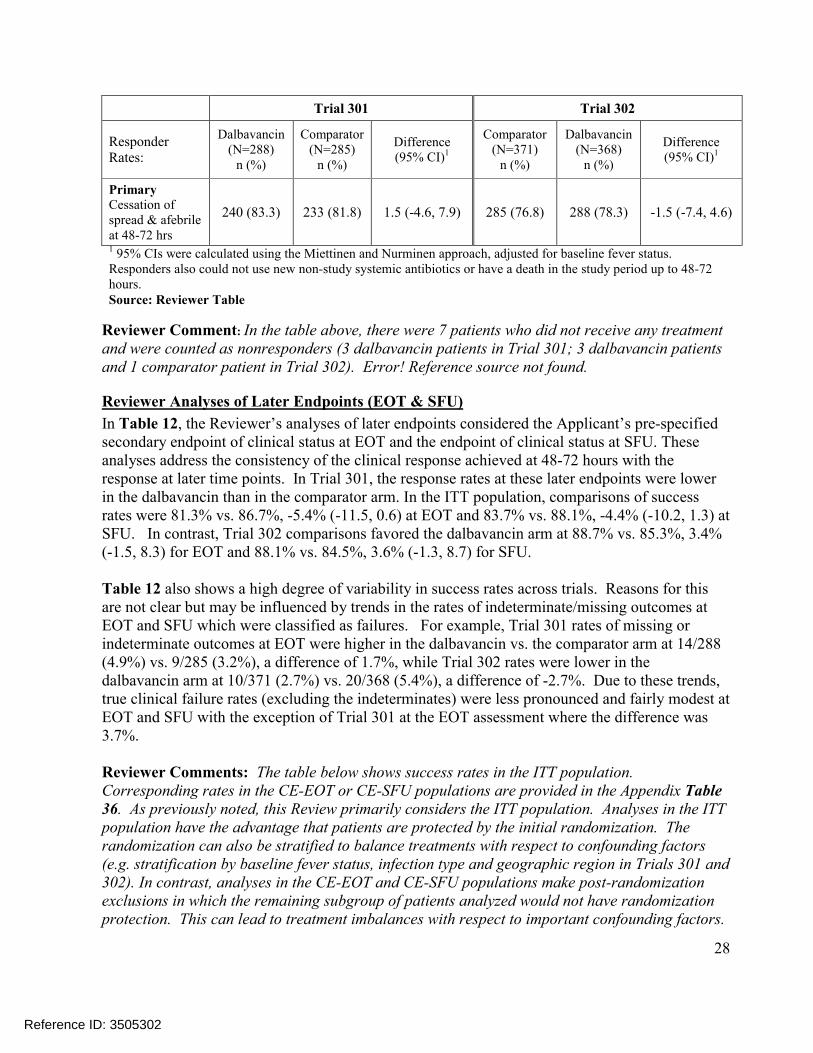
In Table 12, the Reviewer’s analyses of later endpoints considered the Applicant’s pre-specified secondary endpoint of clinical status at EOT and the endpoint of clinical status at SFU. These analyses address the consistency of the clinical response achieved at 48-72 hours with the response at later time points. In Trial 301, the response rates at these later endpoints were lower in the dalbavancin than in the comparator arm. In the ITT population, comparisons of success rates were 81.3% vs. 86.7%, -5.4% (-11.5, 0.6) at EOT and 83.7% vs. 88.1%, -4.4% (-10.2, 1.3) at SFU. In contrast, Trial 302 comparisons favored the dalbavancin arm at 88.7% vs. 85.3%, 3.4%(-1.5, 8.3) for EOT and 88.1% vs. 84.5%, 3.6% (-1.3, 8.7) for SFU.
Table 12 also shows a high degree of variability in success rates across trials. Reasons for this are not clear but may be influenced by trends in the rates of indeterminate/missing outcomes at EOT and SFU which were classified as failures. For example, Trial 301 rates of missing or indeterminate outcomes at EOT were higher in the dalbavancin vs. the comparator arm at 14/288 (4.9%) vs. 9/285 (3.2%), a difference of 1.7%, while Trial 302 rates were lower in the dalbavancin arm at 10/371 (2.7%) vs. 20/368 (5.4%), a difference of -2.7%. Due to these trends, true clinical failure rates (excluding the indeterminates) were less pronounced and fairly modest at EOT and SFU with the exception of Trial 301 at the EOT assessment where the difference was 3.7%.
Reviewer Comments: The table below shows success rates in the ITT population. Corresponding rates in the CE-EOT or CE-SFU populations are provided in the Appendix Table 36. As previously noted, this Review primarily considers the ITT population. Analyses in the ITT population have the advantage that patients are protected by the initial randomization. The randomization can also be stratified to balance treatments with respect to confounding factors(e.g. stratification by baseline fever status, infection type and geographic region in Trials 301 and 302). In contrast, analyses in the CE-EOT and CE-SFU populations make post-randomization exclusions in which the remaining subgroup of patients analyzed would not have randomization protection. This can lead to treatment imbalances with respect to important confounding factors.
Reference ID: 3505302

29
Table 12: Reviewer Analyses of Clinical Status, Success Rates at EOT & SFU (ITT)
Clinical Status at EOT2 and SFU Outcome
Dalbavancinn/N (%)
Comparatorn/N (%)
Difference(95% CI)1
Trial 301 N=288 N=285
Success, EOT 234 (81.3%) 247 (86.7%) -5.4% (-11.5, 0.6)
Failure 40 (13.9) 29 (10.2) 3.7
Indeterminate 14 (4.9) 9 (3.2) 1.7
Success, SFU 241 (83.7%) 251 (88.1%) -4.4% (-10.2, 1.3)
Failure 18 (6.3) 13 (4.6) 1.7
Indeterminate 29 (10.1) 21 (7.4) 2.7
Trial 302 N=371 N=368
Success, EOT 329 (88.7%) 314 (85.3%) 3.4% (-1.5, 8.3)
Failure 32 (8.6) 34 (9.2) -0.6
Indeterminate 10 (2.7) 20 (5.4) -2.7
Success, SFU 327 (88.1%) 311 (84.5%) 3.6% (-1.3, 8.7)
Failure 18 (4.9) 23 (6.3) -1.4
Indeterminate 26 (7.0) 34 (9.2) -2.21 95% CIs were calculated using the Miettinen and Nurminen approach, unadjusted.2 Clinical status at EOT was a pre-specified secondary endpoint. Source: Reviewer Table
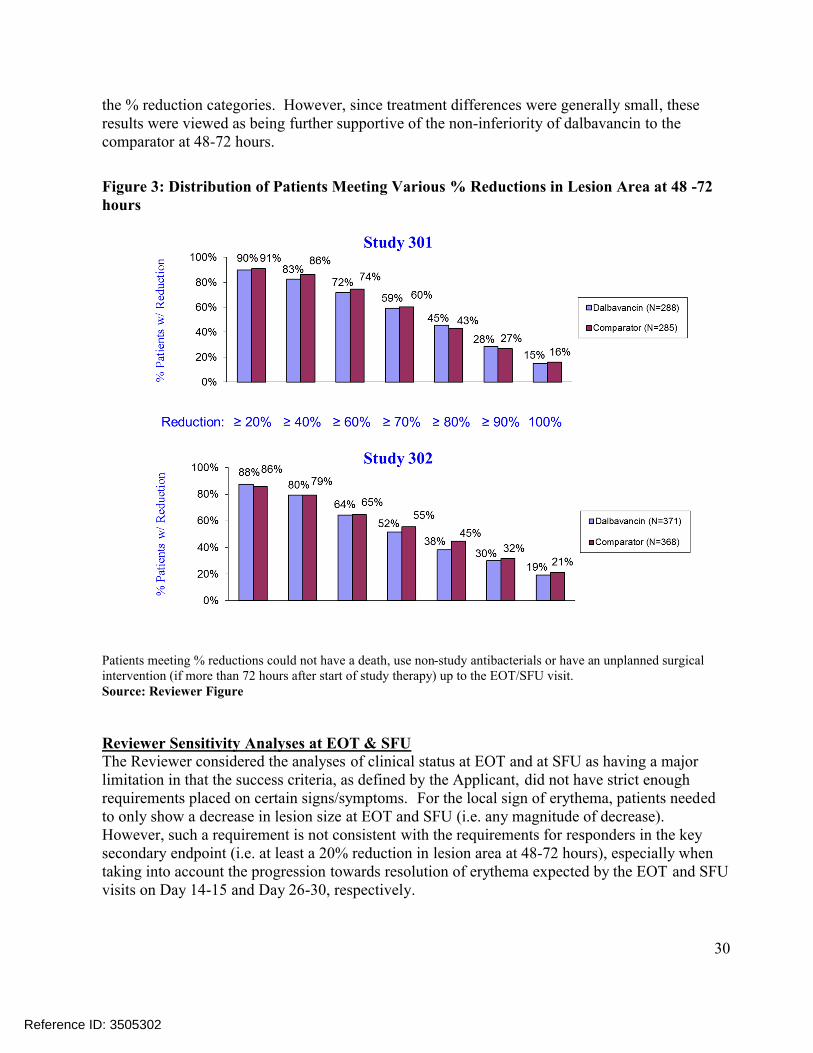
Reviewer Comments: Rates of clinical success at EOT in the ITT population in the Reviewer analysis differ slightly from those reported by the Applicant in Table 10. The Applicant’s analyses only require that successes have a decrease in lesion area at EOT, while the Reviewer analyses require that successes have a decrease in ‘lesion size’ where ‘lesion size’ is defined in the protocol (as well as the efficacy datasets) as a decrease in both length and width dimensions. In contrast to Applicant analyses, Reviewer analyses classified two dalbavancin patients in Trial 301 and one comparator patient in Trial 302 as failures. These patients had a decrease in lesion ‘area’ but not lesion ‘size’ (i.e. length and width). Reviewer Sensitivity Analyses at 48-72 hoursTo further assess the robustness of findings obtained from the endpoints assessing efficacy at 48-72 hours, the Reviewer conducted a sensitivity analysis which considered the distribution of patients in each treatment arm meeting various % reductions in lesion area at 48-72 hours (Figure 3). In addition to considering responders based on meeting a 20% reduction in lesion area, these analyses also considered responders based on meeting 40%, 60%, 70%, 80%, 90% and 100%reductions. Findings from this analysis show the comparator being more favorable for most of
Reference ID: 3505302
30
the % reduction categories. However, since treatment differences were generally small, these results were viewed as being further supportive of the non-inferiority of dalbavancin to the comparator at 48-72 hours.
Figure 3: Distribution of Patients Meeting Various % Reductions in Lesion Area at 48 -72 hours
Patients meeting % reductions could not have a death, use non-study antibacterials or have an unplanned surgical intervention (if more than 72 hours after start of study therapy) up to the EOT/SFU visit.Source: Reviewer Figure
Reviewer Sensitivity Analyses at EOT & SFUThe Reviewer considered the analyses of clinical status at EOT and at SFU as having a major limitation in that the success criteria, as defined by the Applicant, did not have strict enough requirements placed on certain signs/symptoms. For the local sign of erythema, patients needed to only show a decrease in lesion size at EOT and SFU (i.e. any magnitude of decrease). However, such a requirement is not consistent with the requirements for responders in the key secondary endpoint (i.e. at least a 20% reduction in lesion area at 48-72 hours), especially whentaking into account the progression towards resolution of erythema expected by the EOT and SFU visits on Day 14-15 and Day 26-30, respectively.
Reference ID: 3505302
31
Consequently, sensitivity analyses for these endpoints were conducted using stricter requirements for the lesion area/erythema at EOT. Sensitivity analyses S1 & S2 have the additional requirement that the % reduction in lesion area is 80% & 90% respectively and the erythema rating is no worse than mild. Additional sensitivity analyses (S3 & S4) considered the SFU visit in which success was defined as complete resolution (absence) of all local signs except for mild residual erythema if the lesion area was no greater than 10% of the area at baseline (S3) and complete resolution of all local signs (S4). The local signs included purulent drainage/discharge, erythema, fluctuance, heat/warmth, swelling/induration and tenderness to palpation. The systemic component of fever was not included in these outcomes due to a substantial number of patients who were missing fever measurements at EOT and SFU.
Reviewer Comments: Reviewer sensitivity analyses such as S1-S4 are post-hoc analyses and were conducted for the purpose of exploration.
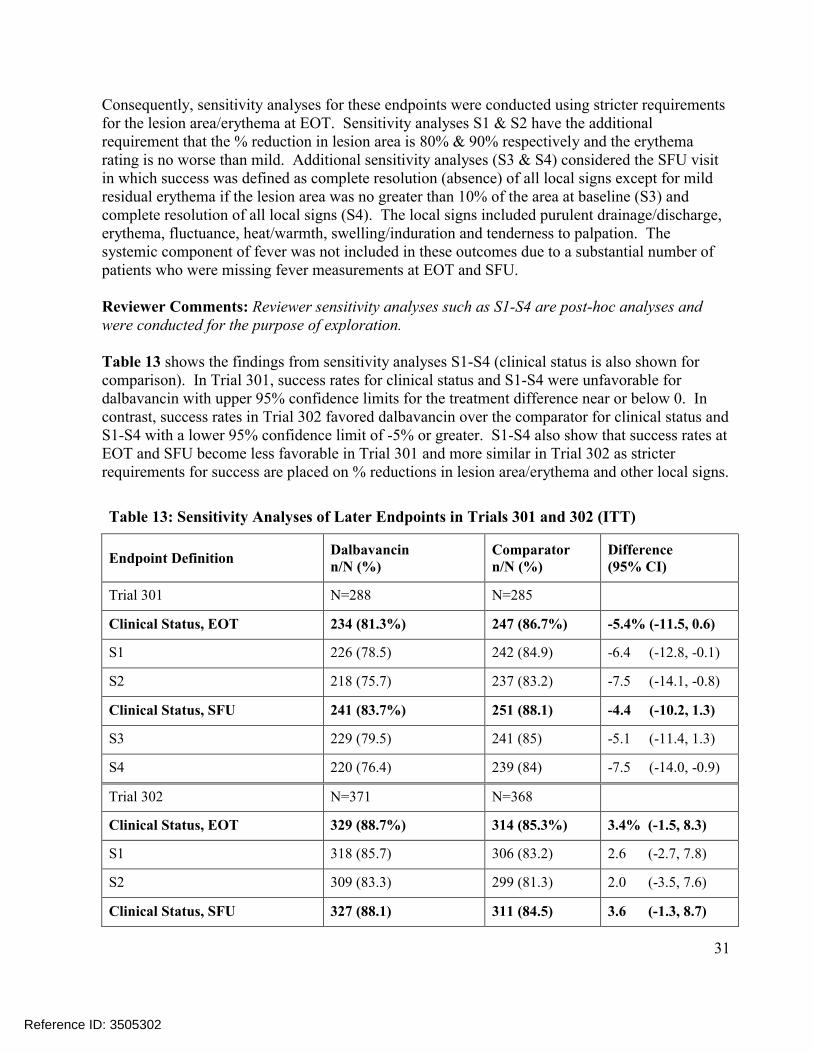
Table 13 shows the findings from sensitivity analyses S1-S4 (clinical status is also shown forcomparison). In Trial 301, success rates for clinical status and S1-S4 were unfavorable for dalbavancin with upper 95% confidence limits for the treatment difference near or below 0. In contrast, success rates in Trial 302 favored dalbavancin over the comparator for clinical status and S1-S4 with a lower 95% confidence limit of -5% or greater. S1-S4 also show that success rates at EOT and SFU become less favorable in Trial 301 and more similar in Trial 302 as stricter requirements for success are placed on % reductions in lesion area/erythema and other local signs.
Table 13: Sensitivity Analyses of Later Endpoints in Trials 301 and 302 (ITT)
Endpoint DefinitionDalbavancinn/N (%)
Comparatorn/N (%)
Difference(95% CI)
Trial 301 N=288 N=285
Clinical Status, EOT 234 (81.3%) 247 (86.7%) -5.4% (-11.5, 0.6)
S1 226 (78.5) 242 (84.9) -6.4 (-12.8, -0.1)
S2 218 (75.7) 237 (83.2) -7.5 (-14.1, -0.8)
Clinical Status, SFU 241 (83.7%) 251 (88.1) -4.4 (-10.2, 1.3)
S3 229 (79.5) 241 (85) -5.1 (-11.4, 1.3)
S4 220 (76.4) 239 (84) -7.5 (-14.0, -0.9)
Trial 302 N=371 N=368
Clinical Status, EOT 329 (88.7%) 314 (85.3%) 3.4% (-1.5, 8.3)
S1 318 (85.7) 306 (83.2) 2.6 (-2.7, 7.8)
S2 309 (83.3) 299 (81.3) 2.0 (-3.5, 7.6)
Clinical Status, SFU 327 (88.1) 311 (84.5) 3.6 (-1.3, 8.7)
Reference ID: 3505302
32
Table 13: Sensitivity Analyses of Later Endpoints in Trials 301 and 302 (ITT)
Endpoint DefinitionDalbavancinn/N (%)
Comparatorn/N (%)
Difference(95% CI)
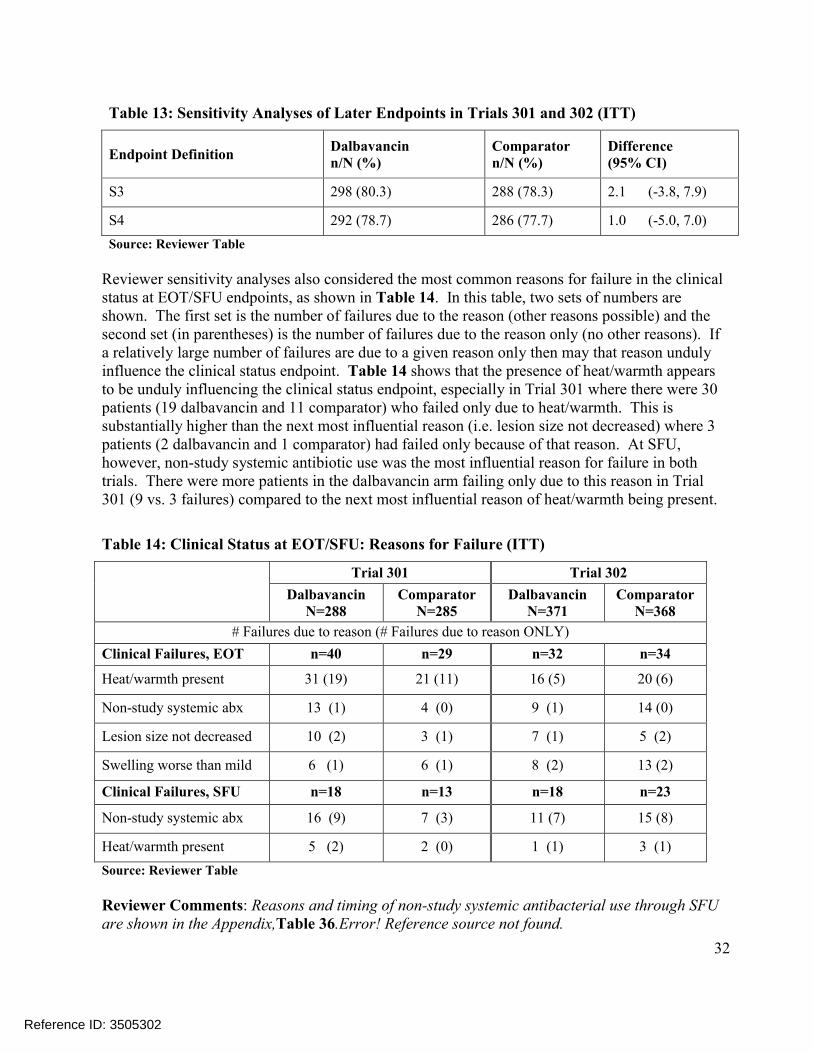
S3 298 (80.3) 288 (78.3) 2.1 (-3.8, 7.9)
S4 292 (78.7) 286 (77.7) 1.0 (-5.0, 7.0)
Source: Reviewer Table
Reviewer sensitivity analyses also considered the most common reasons for failure in the clinical status at EOT/SFU endpoints, as shown in Table 14. In this table, two sets of numbers are shown. The first set is the number of failures due to the reason (other reasons possible) and the second set (in parentheses) is the number of failures due to the reason only (no other reasons). If a relatively large number of failures are due to a given reason only then may that reason unduly influence the clinical status endpoint. Table 14 shows that the presence of heat/warmth appears to be unduly influencing the clinical status endpoint, especially in Trial 301 where there were 30 patients (19 dalbavancin and 11 comparator) who failed only due to heat/warmth. This is substantially higher than the next most influential reason (i.e. lesion size not decreased) where 3 patients (2 dalbavancin and 1 comparator) had failed only because of that reason. At SFU, however, non-study systemic antibiotic use was the most influential reason for failure in both trials. There were more patients in the dalbavancin arm failing only due to this reason in Trial 301 (9 vs. 3 failures) compared to the next most influential reason of heat/warmth being present.
Table 14: Clinical Status at EOT/SFU: Reasons for Failure (ITT)
Trial 301 Trial 302
DalbavancinN=288
Comparator N=285
Dalbavancin N=371
Comparator N=368
# Failures due to reason (# Failures due to reason ONLY)
Clinical Failures, EOT n=40 n=29 n=32 n=34
Heat/warmth present 31 (19) 21 (11) 16 (5) 20 (6)
Non-study systemic abx 13 (1) 4 (0) 9 (1) 14 (0)
Lesion size not decreased 10 (2) 3 (1) 7 (1) 5 (2)
Swelling worse than mild 6 (1) 6 (1) 8 (2) 13 (2)
Clinical Failures, SFU n=18 n=13 n=18 n=23
Non-study systemic abx 16 (9) 7 (3) 11 (7) 15 (8)
Heat/warmth present 5 (2) 2 (0) 1 (1) 3 (1)
Source: Reviewer Table
Reviewer Comments: Reasons and timing of non-study systemic antibacterial use through SFU are shown in the Appendix,Table 36.Error! Reference source not found.
Reference ID: 3505302
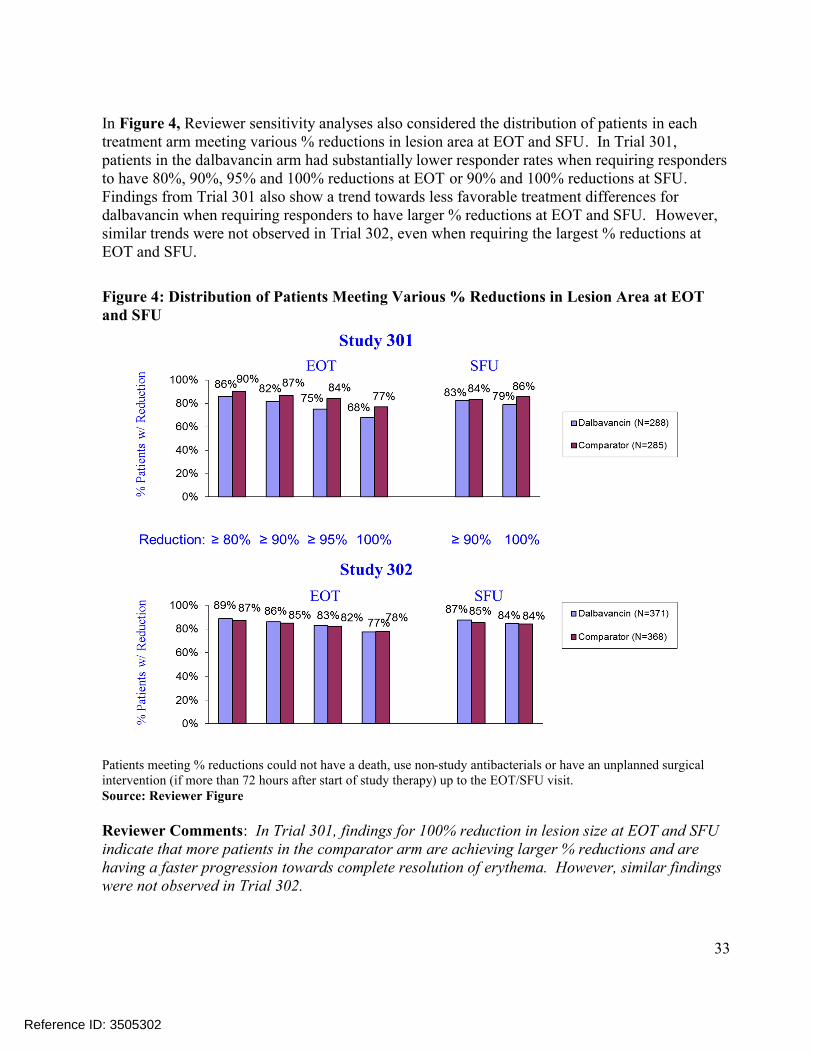
33
In Figure 4, Reviewer sensitivity analyses also considered the distribution of patients in each treatment arm meeting various % reductions in lesion area at EOT and SFU. In Trial 301, patients in the dalbavancin arm had substantially lower responder rates when requiring responders to have 80%, 90%, 95% and 100% reductions at EOT or 90% and 100% reductions at SFU. Findings from Trial 301 also show a trend towards less favorable treatment differences for dalbavancin when requiring responders to have larger % reductions at EOT and SFU. However, similar trends were not observed in Trial 302, even when requiring the largest % reductions at EOT and SFU.
Figure 4: Distribution of Patients Meeting Various % Reductions in Lesion Area at EOT and SFU
Patients meeting % reductions could not have a death, use non-study antibacterials or have an unplanned surgical intervention (if more than 72 hours after start of study therapy) up to the EOT/SFU visit.Source: Reviewer Figure
Reviewer Comments: In Trial 301, findings for 100% reduction in lesion size at EOT and SFU indicate that more patients in the comparator arm are achieving larger % reductions and are having a faster progression towards complete resolution of erythema. However, similar findings were not observed in Trial 302.
Reference ID: 3505302
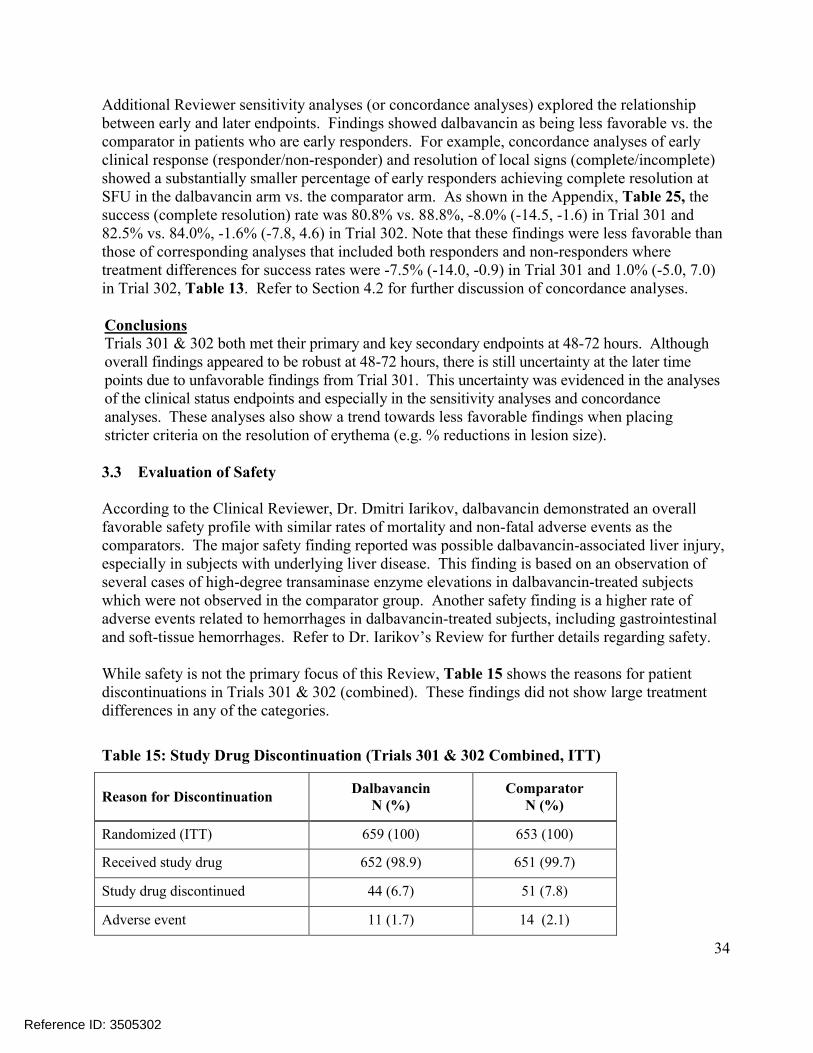
34
Additional Reviewer sensitivity analyses (or concordance analyses) explored the relationship between early and later endpoints. Findings showed dalbavancin as being less favorable vs. the comparator in patients who are early responders. For example, concordance analyses of early clinical response (responder/non-responder) and resolution of local signs (complete/incomplete) showed a substantially smaller percentage of early responders achieving complete resolution at SFU in the dalbavancin arm vs. the comparator arm. As shown in the Appendix, Table 25, the success (complete resolution) rate was 80.8% vs. 88.8%, -8.0% (-14.5, -1.6) in Trial 301 and 82.5% vs. 84.0%, -1.6% (-7.8, 4.6) in Trial 302. Note that these findings were less favorable than those of corresponding analyses that included both responders and non-responders where treatment differences for success rates were -7.5% (-14.0, -0.9) in Trial 301 and 1.0% (-5.0, 7.0)in Trial 302, Table 13. Refer to Section 4.2 for further discussion of concordance analyses.
ConclusionsTrials 301 & 302 both met their primary and key secondary endpoints at 48-72 hours. Although overall findings appeared to be robust at 48-72 hours, there is still uncertainty at the later time points due to unfavorable findings from Trial 301. This uncertainty was evidenced in the analyses of the clinical status endpoints and especially in the sensitivity analyses and concordance analyses. These analyses also show a trend towards less favorable findings when placing stricter criteria on the resolution of erythema (e.g. % reductions in lesion size).
3.3 Evaluation of Safety
According to the Clinical Reviewer, Dr. Dmitri Iarikov, dalbavancin demonstrated an overall favorable safety profile with similar rates of mortality and non-fatal adverse events as the comparators. The major safety finding reported was possible dalbavancin-associated liver injury, especially in subjects with underlying liver disease. This finding is based on an observation of several cases of high-degree transaminase enzyme elevations in dalbavancin-treated subjects which were not observed in the comparator group. Another safety finding is a higher rate of adverse events related to hemorrhages in dalbavancin-treated subjects, including gastrointestinal and soft-tissue hemorrhages. Refer to Dr. Iarikov’s Review for further details regarding safety.
While safety is not the primary focus of this Review, Table 15 shows the reasons for patient discontinuations in Trials 301 & 302 (combined). These findings did not show large treatment differences in any of the categories.
Table 15: Study Drug Discontinuation (Trials 301 & 302 Combined, ITT)
Reason for DiscontinuationDalbavancin
N (%)Comparator
N (%)
Randomized (ITT) 659 (100) 653 (100)
Received study drug 652 (98.9) 651 (99.7)
Study drug discontinued 44 (6.7) 51 (7.8)
Adverse event 11 (1.7) 14 (2.1)
Reference ID: 3505302
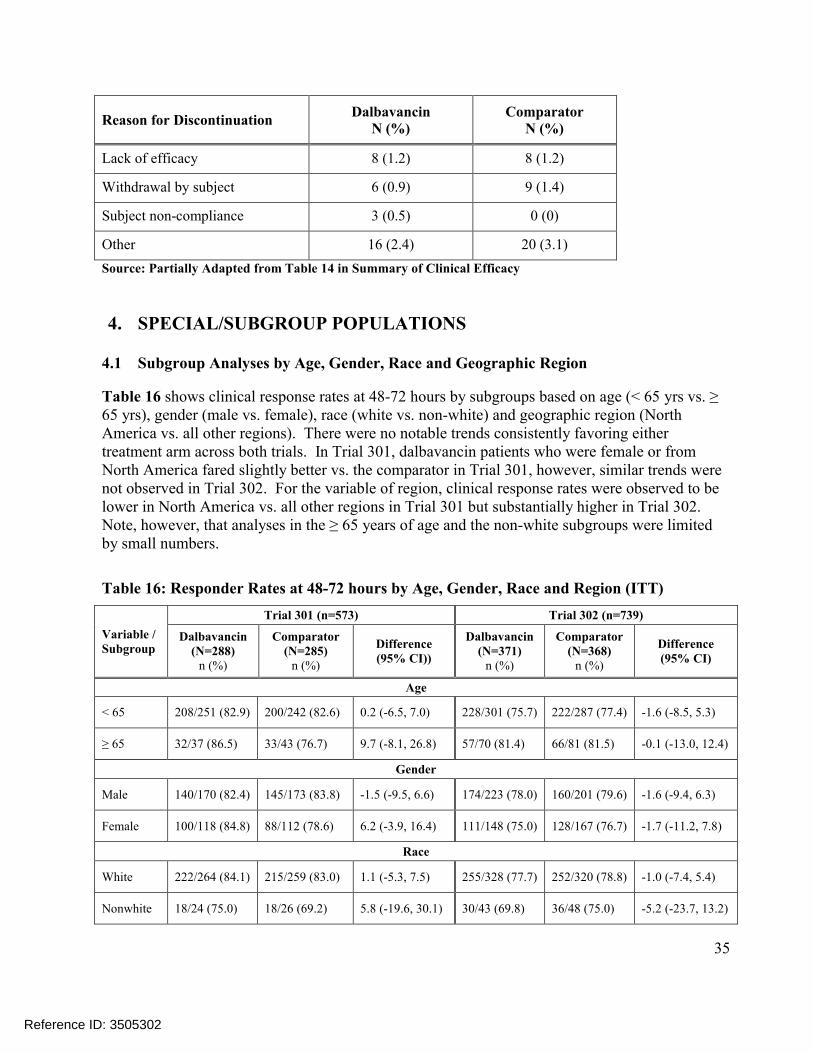
35
Reason for DiscontinuationDalbavancin
N (%)Comparator
N (%)
Lack of efficacy 8 (1.2) 8 (1.2)
Withdrawal by subject 6 (0.9) 9 (1.4)
Subject non-compliance 3 (0.5) 0 (0)
Other 16 (2.4) 20 (3.1)
Source: Partially Adapted from Table 14 in Summary of Clinical Efficacy
4. SPECIAL/SUBGROUP POPULATIONS
4.1 Subgroup Analyses by Age, Gender, Race and Geographic Region
Table 16 shows clinical response rates at 48-72 hours by subgroups based on age (< 65 yrs vs. ≥ 65 yrs), gender (male vs. female), race (white vs. non-white) and geographic region (North America vs. all other regions). There were no notable trends consistently favoring either treatment arm across both trials. In Trial 301, dalbavancin patients who were female or from North America fared slightly better vs. the comparator in Trial 301, however, similar trends were not observed in Trial 302. For the variable of region, clinical response rates were observed to belower in North America vs. all other regions in Trial 301 but substantially higher in Trial 302. Note, however, that analyses in the ≥ 65 years of age and the non-white subgroups were limited by small numbers.
Table 16: Responder Rates at 48-72 hours by Age, Gender, Race and Region (ITT)
Variable /Subgroup
Trial 301 (n=573) Trial 302 (n=739)
Dalbavancin (N=288)
n (%)
Comparator (N=285)
n (%)
Difference (95% CI))
Dalbavancin (N=371)
n (%)
Comparator (N=368)
n (%)
Difference (95% CI)
Age
< 65 208/251 (82.9) 200/242 (82.6) 0.2 (-6.5, 7.0) 228/301 (75.7) 222/287 (77.4) -1.6 (-8.5, 5.3)
≥ 65 32/37 (86.5) 33/43 (76.7) 9.7 (-8.1, 26.8) 57/70 (81.4) 66/81 (81.5) -0.1 (-13.0, 12.4)
Gender
Male 140/170 (82.4) 145/173 (83.8) -1.5 (-9.5, 6.6) 174/223 (78.0) 160/201 (79.6) -1.6 (-9.4, 6.3)
Female 100/118 (84.8) 88/112 (78.6) 6.2 (-3.9, 16.4) 111/148 (75.0) 128/167 (76.7) -1.7 (-11.2, 7.8)
Race
White 222/264 (84.1) 215/259 (83.0) 1.1 (-5.3, 7.5) 255/328 (77.7) 252/320 (78.8) -1.0 (-7.4, 5.4)
Nonwhite 18/24 (75.0) 18/26 (69.2) 5.8 (-19.6, 30.1) 30/43 (69.8) 36/48 (75.0) -5.2 (-23.7, 13.2)
Reference ID: 3505302
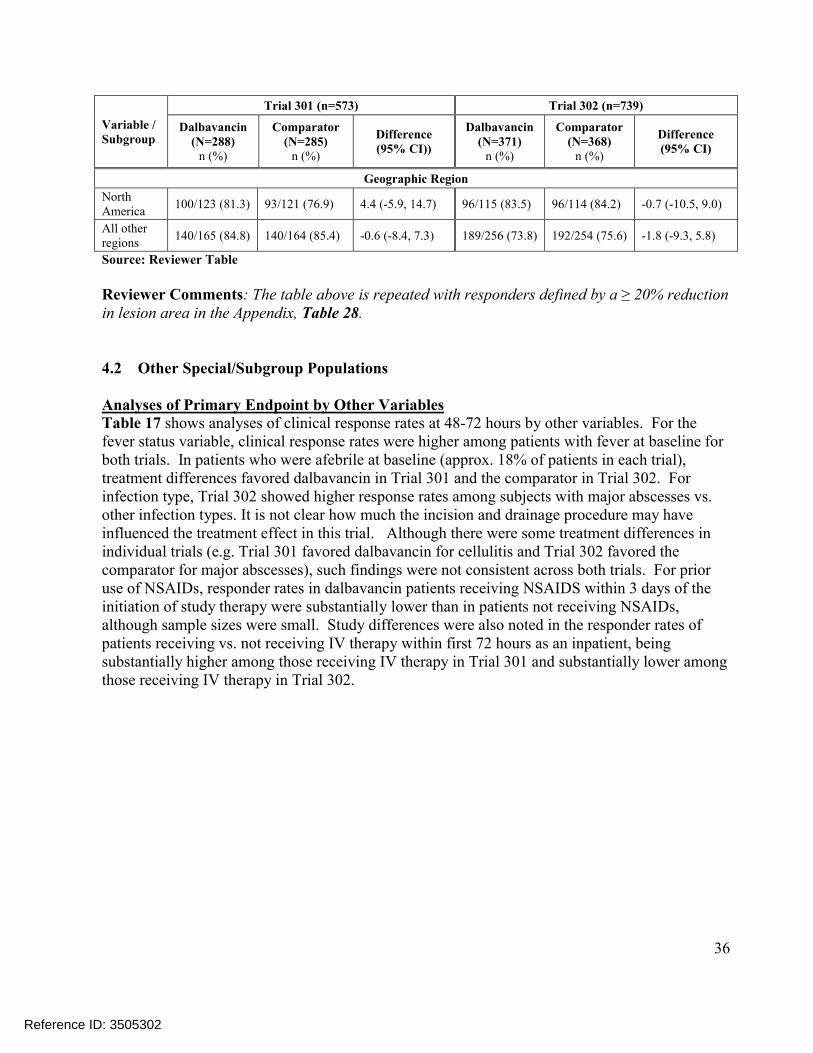
36
Variable /Subgroup
Trial 301 (n=573) Trial 302 (n=739)
Dalbavancin (N=288)
n (%)
Comparator (N=285)
n (%)
Difference (95% CI))
Dalbavancin (N=371)
n (%)
Comparator (N=368)
n (%)
Difference (95% CI)
Geographic Region
North America
100/123 (81.3) 93/121 (76.9) 4.4 (-5.9, 14.7) 96/115 (83.5) 96/114 (84.2) -0.7 (-10.5, 9.0)
All other regions
140/165 (84.8) 140/164 (85.4) -0.6 (-8.4, 7.3) 189/256 (73.8) 192/254 (75.6) -1.8 (-9.3, 5.8)
Source: Reviewer Table
Reviewer Comments: The table above is repeated with responders defined by a ≥ 20% reduction in lesion area in the Appendix, Table 28.
4.2 Other Special/Subgroup Populations
Analyses of Primary Endpoint by Other Variables Table 17 shows analyses of clinical response rates at 48-72 hours by other variables. For the fever status variable, clinical response rates were higher among patients with fever at baseline forboth trials. In patients who were afebrile at baseline (approx. 18% of patients in each trial), treatment differences favored dalbavancin in Trial 301 and the comparator in Trial 302. For infection type, Trial 302 showed higher response rates among subjects with major abscesses vs. other infection types. It is not clear how much the incision and drainage procedure may have influenced the treatment effect in this trial. Although there were some treatment differences in individual trials (e.g. Trial 301 favored dalbavancin for cellulitis and Trial 302 favored the comparator for major abscesses), such findings were not consistent across both trials. For prior use of NSAIDs, responder rates in dalbavancin patients receiving NSAIDS within 3 days of the initiation of study therapy were substantially lower than in patients not receiving NSAIDs, although sample sizes were small. Study differences were also noted in the responder rates ofpatients receiving vs. not receiving IV therapy within first 72 hours as an inpatient, being substantially higher among those receiving IV therapy in Trial 301 and substantially lower among those receiving IV therapy in Trial 302.
Reference ID: 3505302
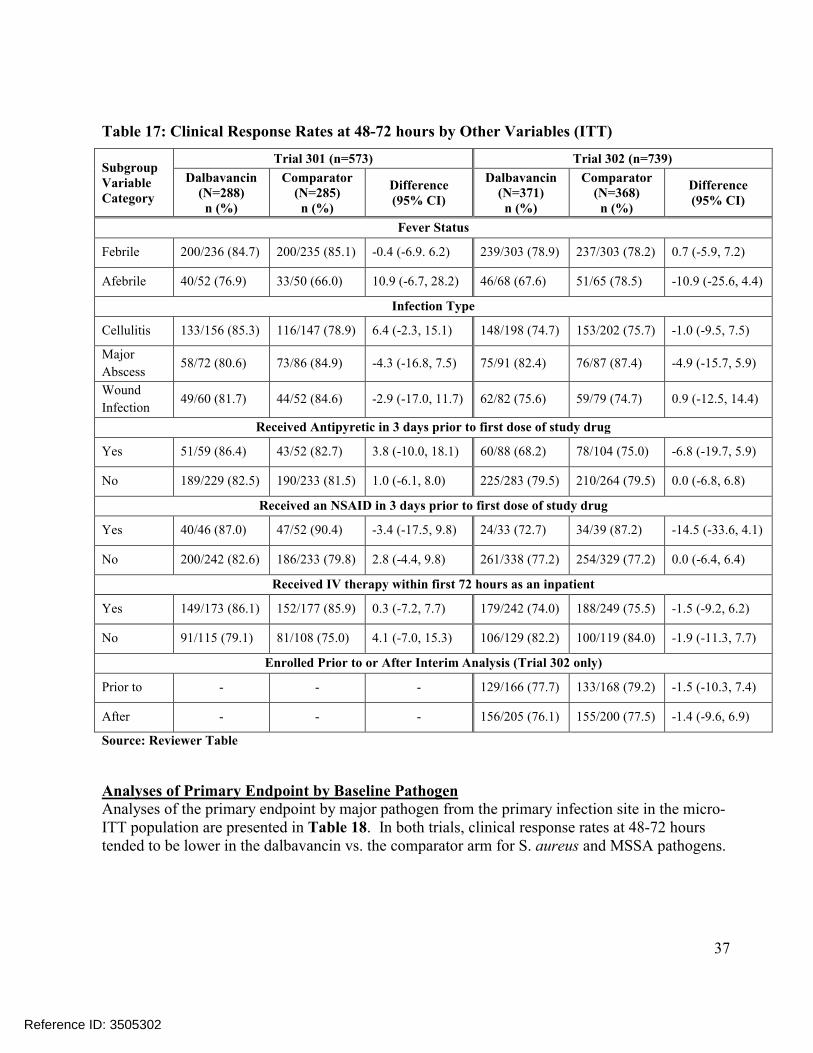
37
Table 17: Clinical Response Rates at 48-72 hours by Other Variables (ITT)
Subgroup Variable Category
Trial 301 (n=573) Trial 302 (n=739)
Dalbavancin (N=288)n (%)
Comparator (N=285)n (%)
Difference (95% CI)
Dalbavancin (N=371)n (%)
Comparator (N=368)n (%)
Difference (95% CI)
Fever Status
Febrile 200/236 (84.7) 200/235 (85.1) -0.4 (-6.9. 6.2) 239/303 (78.9) 237/303 (78.2) 0.7 (-5.9, 7.2)
Afebrile 40/52 (76.9) 33/50 (66.0) 10.9 (-6.7, 28.2) 46/68 (67.6) 51/65 (78.5) -10.9 (-25.6, 4.4)
Infection Type
Cellulitis 133/156 (85.3) 116/147 (78.9) 6.4 (-2.3, 15.1) 148/198 (74.7) 153/202 (75.7) -1.0 (-9.5, 7.5)
Major
Abscess58/72 (80.6) 73/86 (84.9) -4.3 (-16.8, 7.5) 75/91 (82.4) 76/87 (87.4) -4.9 (-15.7, 5.9)
Wound
Infection49/60 (81.7) 44/52 (84.6) -2.9 (-17.0, 11.7) 62/82 (75.6) 59/79 (74.7) 0.9 (-12.5, 14.4)
Received Antipyretic in 3 days prior to first dose of study drug
Yes 51/59 (86.4) 43/52 (82.7) 3.8 (-10.0, 18.1) 60/88 (68.2) 78/104 (75.0) -6.8 (-19.7, 5.9)
No 189/229 (82.5) 190/233 (81.5) 1.0 (-6.1, 8.0) 225/283 (79.5) 210/264 (79.5) 0.0 (-6.8, 6.8)
Received an NSAID in 3 days prior to first dose of study drug
Yes 40/46 (87.0) 47/52 (90.4) -3.4 (-17.5, 9.8) 24/33 (72.7) 34/39 (87.2) -14.5 (-33.6, 4.1)
No 200/242 (82.6) 186/233 (79.8) 2.8 (-4.4, 9.8) 261/338 (77.2) 254/329 (77.2) 0.0 (-6.4, 6.4)
Received IV therapy within first 72 hours as an inpatient
Yes 149/173 (86.1) 152/177 (85.9) 0.3 (-7.2, 7.7) 179/242 (74.0) 188/249 (75.5) -1.5 (-9.2, 6.2)
No 91/115 (79.1) 81/108 (75.0) 4.1 (-7.0, 15.3) 106/129 (82.2) 100/119 (84.0) -1.9 (-11.3, 7.7)
Enrolled Prior to or After Interim Analysis (Trial 302 only)
Prior to - - - 129/166 (77.7) 133/168 (79.2) -1.5 (-10.3, 7.4)
After - - - 156/205 (76.1) 155/200 (77.5) -1.4 (-9.6, 6.9)
Source: Reviewer Table
Analyses of Primary Endpoint by Baseline Pathogen Analyses of the primary endpoint by major pathogen from the primary infection site in the micro-ITT population are presented in Table 18. In both trials, clinical response rates at 48-72 hours tended to be lower in the dalbavancin vs. the comparator arm for S. aureus and MSSA pathogens.
Reference ID: 3505302
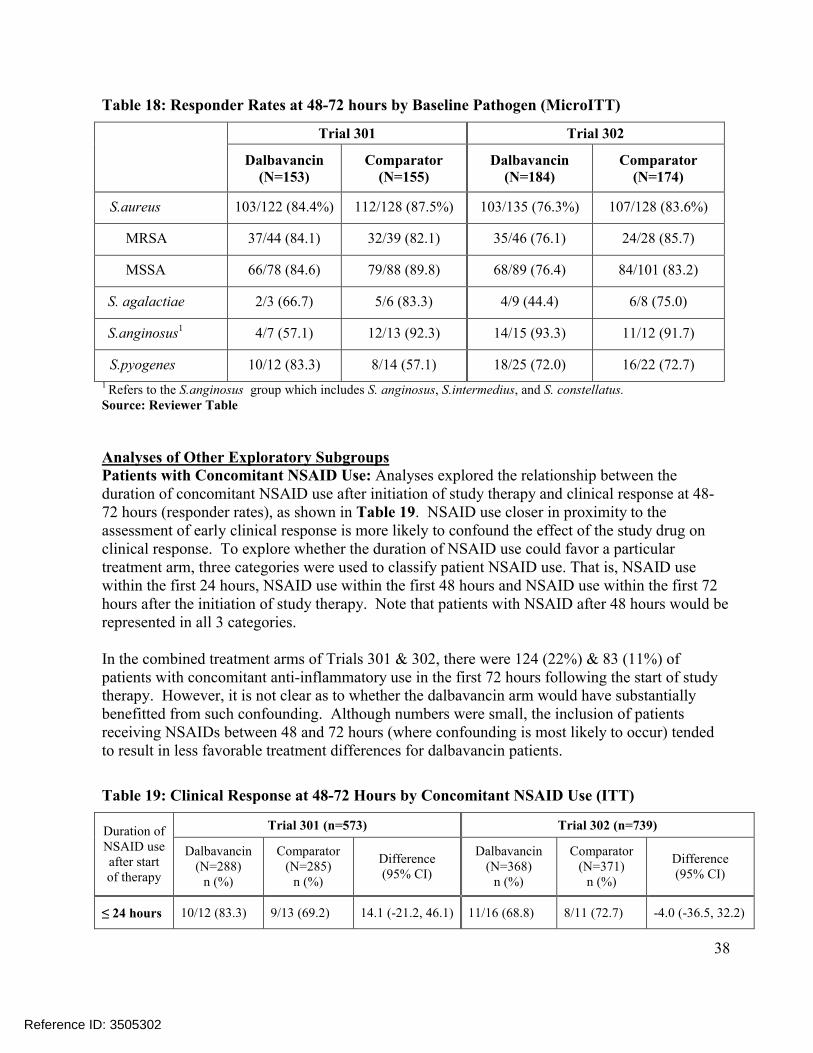
38
Table 18: Responder Rates at 48-72 hours by Baseline Pathogen (MicroITT)
Trial 301 Trial 302
Dalbavancin(N=153)
Comparator (N=155)
Dalbavancin(N=184)
Comparator(N=174)
S.aureus 103/122 (84.4%) 112/128 (87.5%) 103/135 (76.3%) 107/128 (83.6%)
MRSA 37/44 (84.1) 32/39 (82.1) 35/46 (76.1) 24/28 (85.7)
MSSA 66/78 (84.6) 79/88 (89.8) 68/89 (76.4) 84/101 (83.2)
S. agalactiae 2/3 (66.7) 5/6 (83.3) 4/9 (44.4) 6/8 (75.0)
S.anginosus1 4/7 (57.1) 12/13 (92.3) 14/15 (93.3) 11/12 (91.7)
S.pyogenes 10/12 (83.3) 8/14 (57.1) 18/25 (72.0) 16/22 (72.7)
1 Refers to the S.anginosus group which includes S. anginosus, S.intermedius, and S. constellatus.Source: Reviewer Table
Analyses of Other Exploratory SubgroupsPatients with Concomitant NSAID Use: Analyses explored the relationship between the duration of concomitant NSAID use after initiation of study therapy and clinical response at 48-72 hours (responder rates), as shown in Table 19. NSAID use closer in proximity to the assessment of early clinical response is more likely to confound the effect of the study drug on clinical response. To explore whether the duration of NSAID use could favor a particular treatment arm, three categories were used to classify patient NSAID use. That is, NSAID usewithin the first 24 hours, NSAID use within the first 48 hours and NSAID use within the first 72 hours after the initiation of study therapy. Note that patients with NSAID after 48 hours would be represented in all 3 categories.
In the combined treatment arms of Trials 301 & 302, there were 124 (22%) & 83 (11%) of patients with concomitant anti-inflammatory use in the first 72 hours following the start of studytherapy. However, it is not clear as to whether the dalbavancin arm would have substantially benefitted from such confounding. Although numbers were small, the inclusion of patients receiving NSAIDs between 48 and 72 hours (where confounding is most likely to occur) tended to result in less favorable treatment differences for dalbavancin patients.
Table 19: Clinical Response at 48-72 Hours by Concomitant NSAID Use (ITT)
Duration of NSAID use after start of therapy
Trial 301 (n=573) Trial 302 (n=739)
Dalbavancin (N=288)
n (%)
Comparator (N=285)
n (%)
Difference (95% CI)
Dalbavancin (N=368)
n (%)
Comparator (N=371)
n (%)
Difference (95% CI)
≤ 24 hours 10/12 (83.3) 9/13 (69.2) 14.1 (-21.2, 46.1) 11/16 (68.8) 8/11 (72.7) -4.0 (-36.5, 32.2)
Reference ID: 3505302
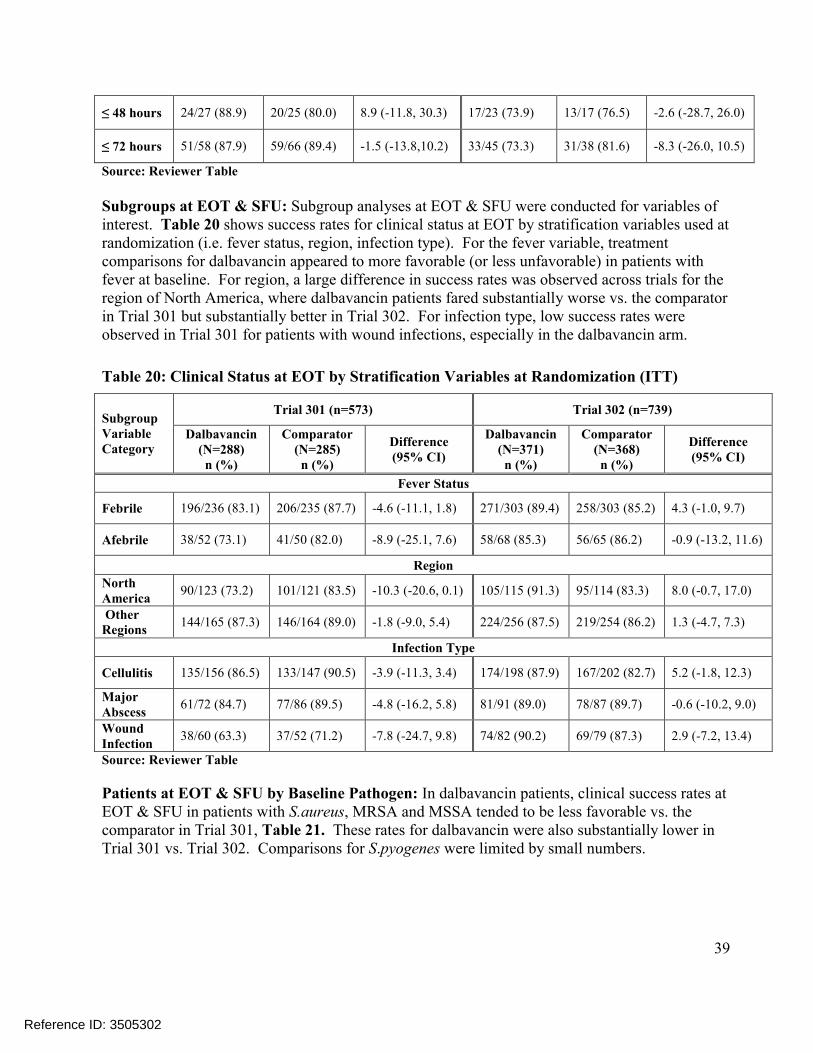
39
≤ 48 hours 24/27 (88.9) 20/25 (80.0) 8.9 (-11.8, 30.3) 17/23 (73.9) 13/17 (76.5) -2.6 (-28.7, 26.0)
≤ 72 hours 51/58 (87.9) 59/66 (89.4) -1.5 (-13.8,10.2) 33/45 (73.3) 31/38 (81.6) -8.3 (-26.0, 10.5)
Source: Reviewer Table
Subgroups at EOT & SFU: Subgroup analyses at EOT & SFU were conducted for variables of interest. Table 20 shows success rates for clinical status at EOT by stratification variables used at randomization (i.e. fever status, region, infection type). For the fever variable, treatment comparisons for dalbavancin appeared to more favorable (or less unfavorable) in patients with fever at baseline. For region, a large difference in success rates was observed across trials for the region of North America, where dalbavancin patients fared substantially worse vs. the comparator in Trial 301 but substantially better in Trial 302. For infection type, low success rates were observed in Trial 301 for patients with wound infections, especially in the dalbavancin arm.
Table 20: Clinical Status at EOT by Stratification Variables at Randomization (ITT)
Subgroup Variable Category
Trial 301 (n=573) Trial 302 (n=739)
Dalbavancin (N=288)n (%)
Comparator (N=285)n (%)
Difference (95% CI)
Dalbavancin(N=371)n (%)
Comparator (N=368)n (%)
Difference (95% CI)
Fever Status
Febrile 196/236 (83.1) 206/235 (87.7) -4.6 (-11.1, 1.8) 271/303 (89.4) 258/303 (85.2) 4.3 (-1.0, 9.7)
Afebrile 38/52 (73.1) 41/50 (82.0) -8.9 (-25.1, 7.6) 58/68 (85.3) 56/65 (86.2) -0.9 (-13.2, 11.6)
Region
North America
90/123 (73.2) 101/121 (83.5) -10.3 (-20.6, 0.1) 105/115 (91.3) 95/114 (83.3) 8.0 (-0.7, 17.0)
Other Regions
144/165 (87.3) 146/164 (89.0) -1.8 (-9.0, 5.4) 224/256 (87.5) 219/254 (86.2) 1.3 (-4.7, 7.3)
Infection Type
Cellulitis 135/156 (86.5) 133/147 (90.5) -3.9 (-11.3, 3.4) 174/198 (87.9) 167/202 (82.7) 5.2 (-1.8, 12.3)
Major Abscess
61/72 (84.7) 77/86 (89.5) -4.8 (-16.2, 5.8) 81/91 (89.0) 78/87 (89.7) -0.6 (-10.2, 9.0)
Wound Infection
38/60 (63.3) 37/52 (71.2) -7.8 (-24.7, 9.8) 74/82 (90.2) 69/79 (87.3) 2.9 (-7.2, 13.4)
Source: Reviewer Table
Patients at EOT & SFU by Baseline Pathogen: In dalbavancin patients, clinical success rates at EOT & SFU in patients with S.aureus, MRSA and MSSA tended to be less favorable vs. the comparator in Trial 301, Table 21. These rates for dalbavancin were also substantially lower in Trial 301 vs. Trial 302. Comparisons for S.pyogenes were limited by small numbers.
Reference ID: 3505302
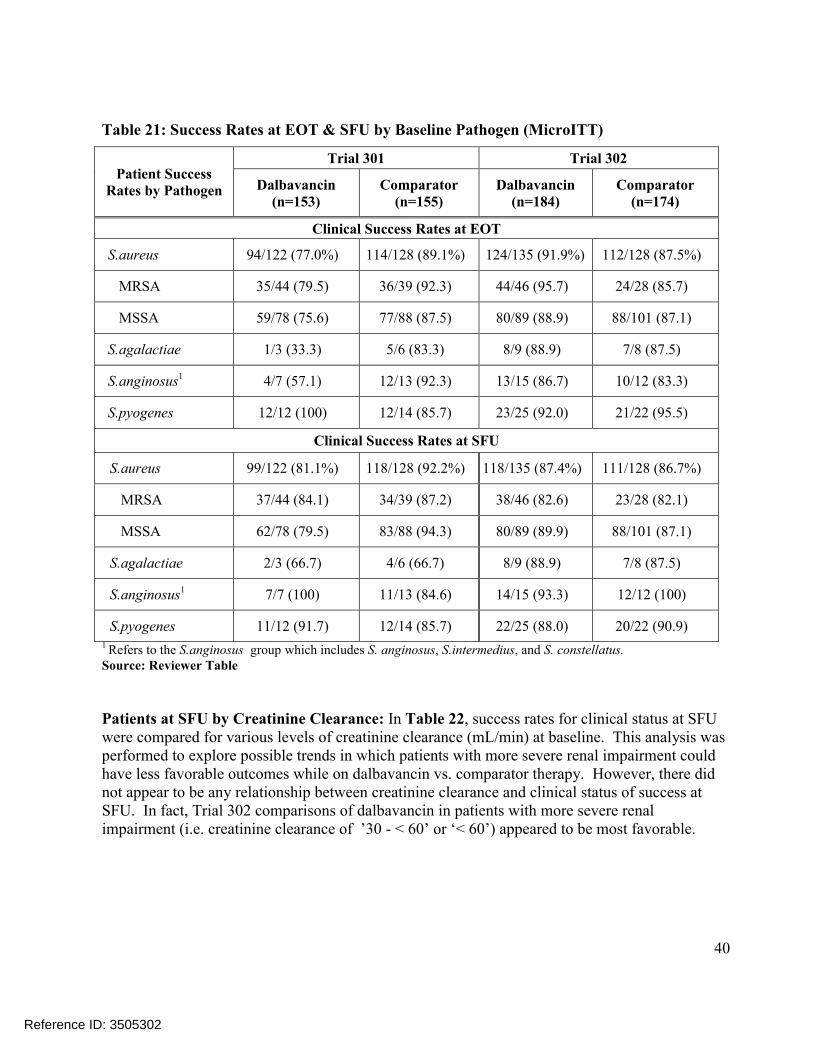
40
Table 21: Success Rates at EOT & SFU by Baseline Pathogen (MicroITT)
Patient Success Rates by Pathogen
Trial 301 Trial 302
Dalbavancin (n=153)
Comparator (n=155)
Dalbavancin (n=184)
Comparator(n=174)
Clinical Success Rates at EOT
S.aureus 94/122 (77.0%) 114/128 (89.1%) 124/135 (91.9%) 112/128 (87.5%)
MRSA 35/44 (79.5) 36/39 (92.3) 44/46 (95.7) 24/28 (85.7)
MSSA 59/78 (75.6) 77/88 (87.5) 80/89 (88.9) 88/101 (87.1)
S.agalactiae 1/3 (33.3) 5/6 (83.3) 8/9 (88.9) 7/8 (87.5)
S.anginosus1 4/7 (57.1) 12/13 (92.3) 13/15 (86.7) 10/12 (83.3)
S.pyogenes 12/12 (100) 12/14 (85.7) 23/25 (92.0) 21/22 (95.5)
Clinical Success Rates at SFU
S.aureus 99/122 (81.1%) 118/128 (92.2%) 118/135 (87.4%) 111/128 (86.7%)
MRSA 37/44 (84.1) 34/39 (87.2) 38/46 (82.6) 23/28 (82.1)
MSSA 62/78 (79.5) 83/88 (94.3) 80/89 (89.9) 88/101 (87.1)
S.agalactiae 2/3 (66.7) 4/6 (66.7) 8/9 (88.9) 7/8 (87.5)
S.anginosus1 7/7 (100) 11/13 (84.6) 14/15 (93.3) 12/12 (100)
S.pyogenes 11/12 (91.7) 12/14 (85.7) 22/25 (88.0) 20/22 (90.9)1 Refers to the S.anginosus group which includes S. anginosus, S.intermedius, and S. constellatus.Source: Reviewer Table
Patients at SFU by Creatinine Clearance: In Table 22, success rates for clinical status at SFU were compared for various levels of creatinine clearance (mL/min) at baseline. This analysis was performed to explore possible trends in which patients with more severe renal impairment could have less favorable outcomes while on dalbavancin vs. comparator therapy. However, there did not appear to be any relationship between creatinine clearance and clinical status of success at SFU. In fact, Trial 302 comparisons of dalbavancin in patients with more severe renal impairment (i.e. creatinine clearance of ’30 - < 60’ or ‘< 60’) appeared to be most favorable.
Reference ID: 3505302
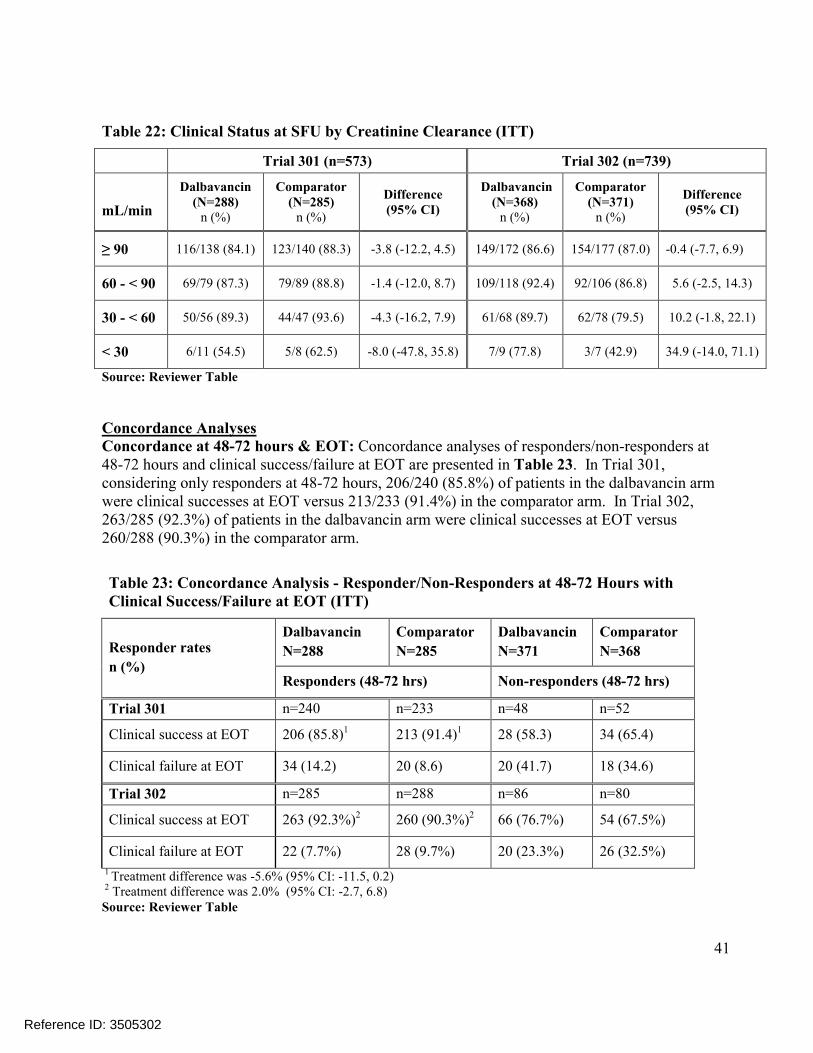
41
Table 22: Clinical Status at SFU by Creatinine Clearance (ITT)
Trial 301 (n=573) Trial 302 (n=739)
mL/min
Dalbavancin (N=288)
n (%)
Comparator (N=285)
n (%)
Difference(95% CI)
Dalbavancin(N=368)
n (%)
Comparator (N=371)
n (%)
Difference(95% CI)
≥ 90 116/138 (84.1) 123/140 (88.3) -3.8 (-12.2, 4.5) 149/172 (86.6) 154/177 (87.0) -0.4 (-7.7, 6.9)
60 - < 90 69/79 (87.3) 79/89 (88.8) -1.4 (-12.0, 8.7) 109/118 (92.4) 92/106 (86.8) 5.6 (-2.5, 14.3)
30 - < 60 50/56 (89.3) 44/47 (93.6) -4.3 (-16.2, 7.9) 61/68 (89.7) 62/78 (79.5) 10.2 (-1.8, 22.1)
< 30 6/11 (54.5) 5/8 (62.5) -8.0 (-47.8, 35.8) 7/9 (77.8) 3/7 (42.9) 34.9 (-14.0, 71.1)
Source: Reviewer Table
Concordance AnalysesConcordance at 48-72 hours & EOT: Concordance analyses of responders/non-responders at 48-72 hours and clinical success/failure at EOT are presented in Table 23. In Trial 301, considering only responders at 48-72 hours, 206/240 (85.8%) of patients in the dalbavancin arm were clinical successes at EOT versus 213/233 (91.4%) in the comparator arm. In Trial 302, 263/285 (92.3%) of patients in the dalbavancin arm were clinical successes at EOT versus 260/288 (90.3%) in the comparator arm.
Table 23: Concordance Analysis - Responder/Non-Responders at 48-72 Hours withClinical Success/Failure at EOT (ITT)
Responder rates
n (%)
Dalbavancin
N=288
Comparator
N=285
Dalbavancin
N=371
Comparator
N=368
Responders (48-72 hrs) Non-responders (48-72 hrs)
Trial 301 n=240 n=233 n=48 n=52
Clinical success at EOT 206 (85.8)1 213 (91.4)1 28 (58.3) 34 (65.4)
Clinical failure at EOT 34 (14.2) 20 (8.6) 20 (41.7) 18 (34.6)
Trial 302 n=285 n=288 n=86 n=80
Clinical success at EOT 263 (92.3%)2 260 (90.3%)2 66 (76.7%) 54 (67.5%)
Clinical failure at EOT 22 (7.7%) 28 (9.7%) 20 (23.3%) 26 (32.5%)
1 Treatment difference was -5.6% (95% CI: -11.5, 0.2)2 Treatment difference was 2.0% (95% CI: -2.7, 6.8) Source: Reviewer Table
Reference ID: 3505302
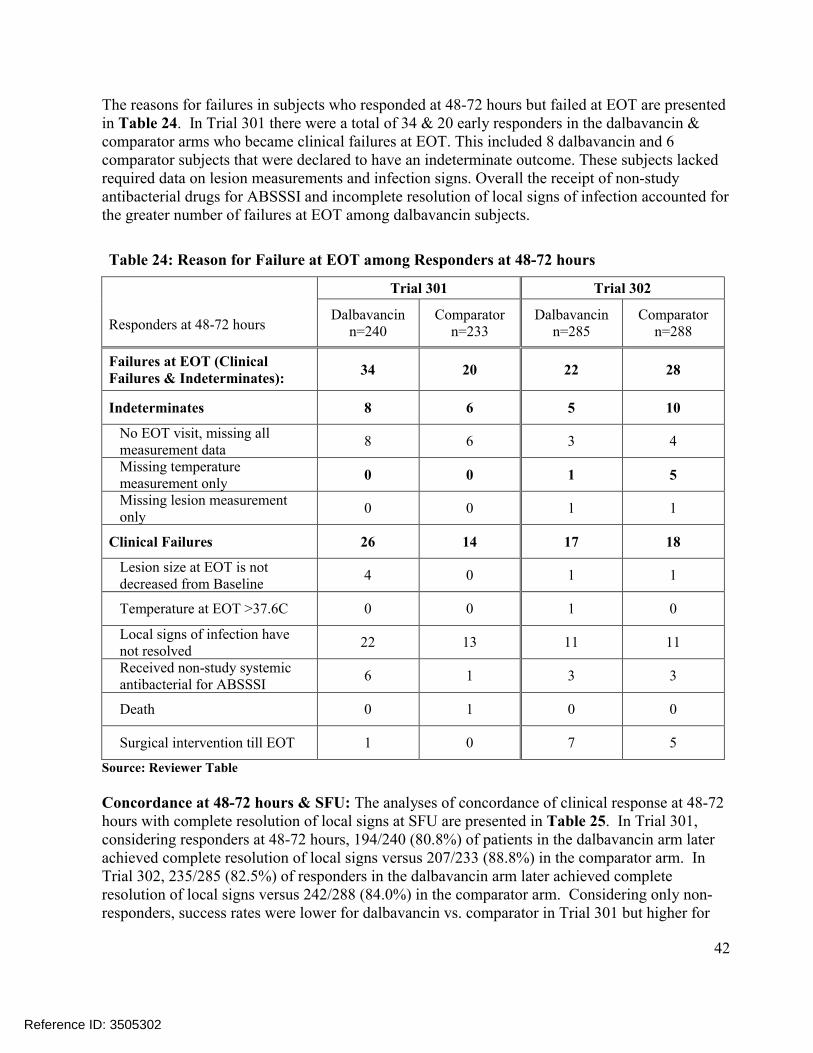
42
The reasons for failures in subjects who responded at 48-72 hours but failed at EOT are presented in Table 24. In Trial 301 there were a total of 34 & 20 early responders in the dalbavancin & comparator arms who became clinical failures at EOT. This included 8 dalbavancin and 6 comparator subjects that were declared to have an indeterminate outcome. These subjects lacked required data on lesion measurements and infection signs. Overall the receipt of non-studyantibacterial drugs for ABSSSI and incomplete resolution of local signs of infection accounted for the greater number of failures at EOT among dalbavancin subjects.
Table 24: Reason for Failure at EOT among Responders at 48-72 hours
Trial 301 Trial 302
Responders at 48-72 hoursDalbavancin
n=240Comparator
n=233Dalbavancin
n=285Comparator
n=288
Failures at EOT (Clinical Failures & Indeterminates):
34 20 22 28
Indeterminates 8 6 5 10
No EOT visit, missing all measurement data
8 6 3 4
Missing temperature measurement only
0 0 1 5
Missing lesion measurement only
0 0 1 1
Clinical Failures 26 14 17 18
Lesion size at EOT is not decreased from Baseline
4 0 1 1
Temperature at EOT >37.6C 0 0 1 0
Local signs of infection have not resolved
22 13 11 11
Received non-study systemic antibacterial for ABSSSI
6 1 3 3
Death 0 1 0 0
Surgical intervention till EOT 1 0 7 5
Source: Reviewer Table
Concordance at 48-72 hours & SFU: The analyses of concordance of clinical response at 48-72 hours with complete resolution of local signs at SFU are presented in Table 25. In Trial 301,considering responders at 48-72 hours, 194/240 (80.8%) of patients in the dalbavancin arm later achieved complete resolution of local signs versus 207/233 (88.8%) in the comparator arm. In Trial 302, 235/285 (82.5%) of responders in the dalbavancin arm later achieved complete resolution of local signs versus 242/288 (84.0%) in the comparator arm. Considering only non-responders, success rates were lower for dalbavancin vs. comparator in Trial 301 but higher for
Reference ID: 3505302
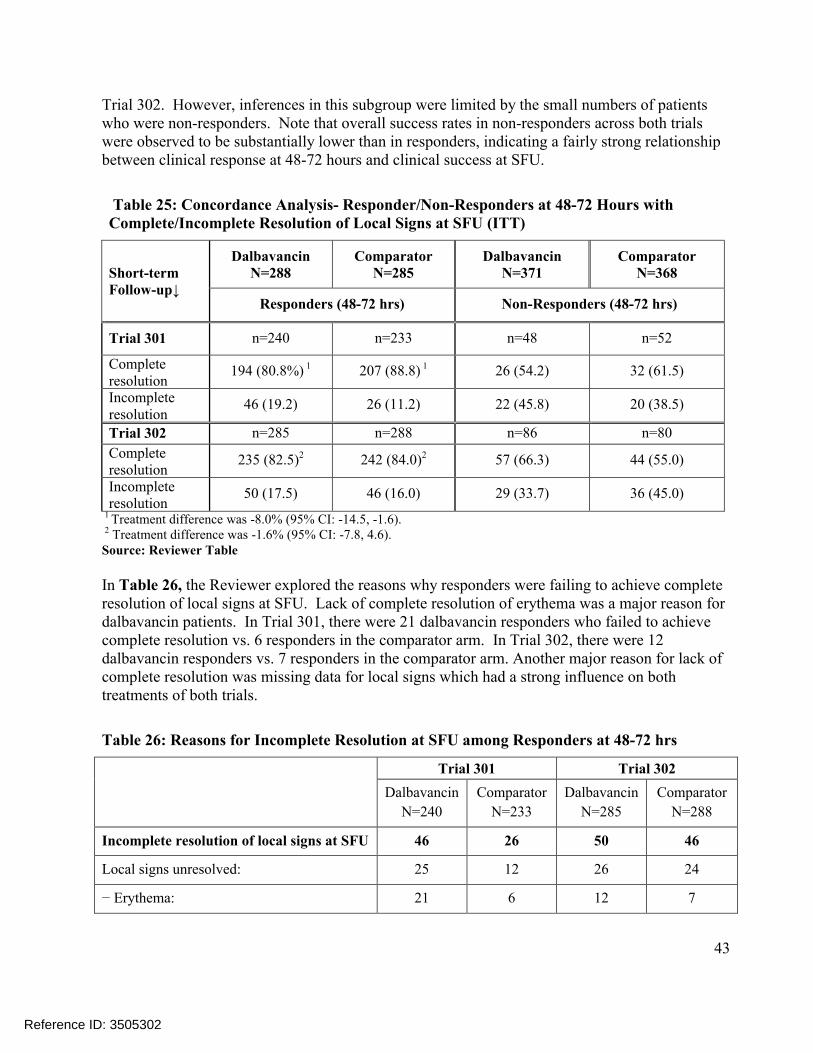
43
Trial 302. However, inferences in this subgroup were limited by the small numbers of patientswho were non-responders. Note that overall success rates in non-responders across both trialswere observed to be substantially lower than in responders, indicating a fairly strong relationship between clinical response at 48-72 hours and clinical success at SFU.
Table 25: Concordance Analysis- Responder/Non-Responders at 48-72 Hours with Complete/Incomplete Resolution of Local Signs at SFU (ITT)
Short-term Follow-up↓
DalbavancinN=288
Comparator N=285
Dalbavancin N=371
Comparator N=368
Responders (48-72 hrs) Non-Responders (48-72 hrs)
Trial 301 n=240 n=233 n=48 n=52
Complete resolution
194 (80.8%) 1 207 (88.8) 1 26 (54.2) 32 (61.5)
Incomplete resolution
46 (19.2) 26 (11.2) 22 (45.8) 20 (38.5)
Trial 302 n=285 n=288 n=86 n=80
Complete resolution
235 (82.5)2 242 (84.0)2 57 (66.3) 44 (55.0)
Incomplete resolution
50 (17.5) 46 (16.0) 29 (33.7) 36 (45.0)
1 Treatment difference was -8.0% (95% CI: -14.5, -1.6).2 Treatment difference was -1.6% (95% CI: -7.8, 4.6). Source: Reviewer Table
In Table 26, the Reviewer explored the reasons why responders were failing to achieve complete resolution of local signs at SFU. Lack of complete resolution of erythema was a major reason for dalbavancin patients. In Trial 301, there were 21 dalbavancin responders who failed to achieve complete resolution vs. 6 responders in the comparator arm. In Trial 302, there were 12 dalbavancin responders vs. 7 responders in the comparator arm. Another major reason for lack of complete resolution was missing data for local signs which had a strong influence on both treatments of both trials.
Table 26: Reasons for Incomplete Resolution at SFU among Responders at 48-72 hrs
Trial 301 Trial 302
Dalbavancin
N=240
Comparator
N=233
Dalbavancin
N=285
Comparator
N=288
Incomplete resolution of local signs at SFU 46 26 50 46
Local signs unresolved: 25 12 26 24
− Erythema: 21 6 12 7
Reference ID: 3505302
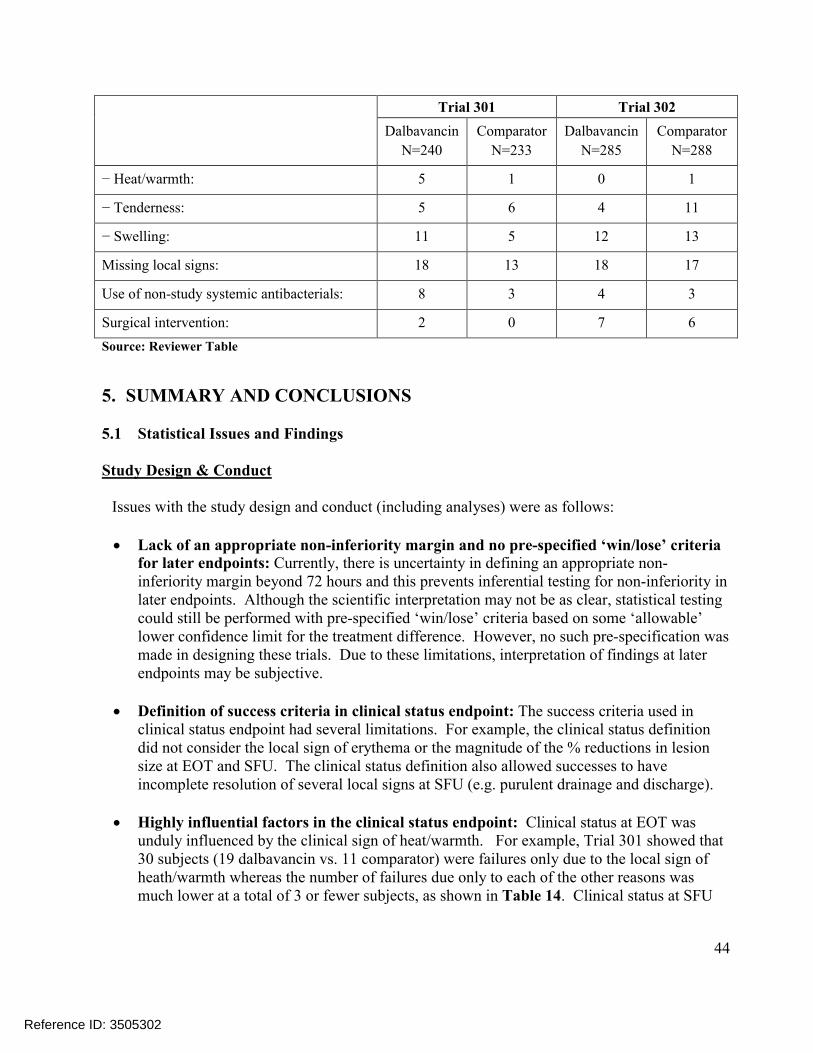
44
Trial 301 Trial 302
Dalbavancin
N=240
Comparator
N=233
Dalbavancin
N=285
Comparator
N=288
− Heat/warmth: 5 1 0 1
− Tenderness: 5 6 4 11
− Swelling: 11 5 12 13
Missing local signs: 18 13 18 17
Use of non-study systemic antibacterials: 8 3 4 3
Surgical intervention: 2 0 7 6
Source: Reviewer Table
5. SUMMARY AND CONCLUSIONS
5.1 Statistical Issues and Findings
Study Design & Conduct
Issues with the study design and conduct (including analyses) were as follows:
Lack of an appropriate non-inferiority margin and no pre-specified ‘win/lose’ criteria for later endpoints: Currently, there is uncertainty in defining an appropriate non-inferiority margin beyond 72 hours and this prevents inferential testing for non-inferiority in later endpoints. Although the scientific interpretation may not be as clear, statistical testing could still be performed with pre-specified ‘win/lose’ criteria based on some ‘allowable’ lower confidence limit for the treatment difference. However, no such pre-specification was made in designing these trials. Due to these limitations, interpretation of findings at later endpoints may be subjective.
Definition of success criteria in clinical status endpoint: The success criteria used in clinical status endpoint had several limitations. For example, the clinical status definition did not consider the local sign of erythema or the magnitude of the % reductions in lesion size at EOT and SFU. The clinical status definition also allowed successes to have incomplete resolution of several local signs at SFU (e.g. purulent drainage and discharge).
Highly influential factors in the clinical status endpoint: Clinical status at EOT was unduly influenced by the clinical sign of heat/warmth. For example, Trial 301 showed that 30 subjects (19 dalbavancin vs. 11 comparator) were failures only due to the local sign of heath/warmth whereas the number of failures due only to each of the other reasons was much lower at a total of 3 or fewer subjects, as shown in Table 14. Clinical status at SFU
Reference ID: 3505302

45
was also highly influenced by a single factor (i.e. the use of non-study systemic antibacterials).
Discordance of responder rates with clinical assessment at EOT: Although early responder rates have a clear relationship with clinical success at later endpoints, there are still a large number of early responders who go on to fail at later endpoints. This can make interpretation of findings at early endpoints more problematic especially if there are substantial treatment differences in responders who fail at later assessments. Trial 301showed a substantially higher failure rate in the dalbavancin arm among responders at EOT and SFU, Table 23 & Table 25.
Potential influence of concomitant anti-inflammatory use: Anti-inflammatory use can potentially confound the effect of the treatment on the primary outcome. In the combined treatment arms of Trials 301 & 302, there were 124 (22%) & 83 (11%) of patients with concomitant anti-inflammatory use in the first 72 hours following the start of study therapy. However, it is not clear whether the dalbavancin arm would have substantially benefitted from such confounding. For example, the inclusion of patients receiving nonsteroidal anti-inflammatory drugs (NSAIDs) between 48 and 72 hours (where confounding is most likely to occur) tended to result in less favorable treatment differences for dalbavancin patients, Table 19.
Missing/indeterminate data (especially at SFU): There were a large number of missing/indeterminate outcomes at EOT and especially at SFU. As shown in Table 12, much of the treatment difference in success rates was due to imbalances in the number of indeterminates. Treatment differences in failure rates (excluding indeterminates) were substantially smaller than differences in success rates.
Data from 6 Patients in Trial 301 (Site 118): OSI found that 6 patients from Trial 301 (Site 118) had no drug administration records and findings from these patients may be excluded at the Division’s discretion.
Note: The Reviewer noted some inconsistencies among other study sites as described in the next two bullets.
Investigator errors in measuring lesion size resulting in study biases: Lesion measurements observed in Trial 302 suggested potential errors. For example, comparing proportions of patients with reductions in lesion area of exactly 0% at 48-72 hours, Trial 302showed 15 patients with a exactly a 0% reduction vs. 0 (zero) patients in Trial 301. In addition, Trial 302 Site 903 (Estonia) showed 10 of 15 patients with a 0% reduction from baseline at 48-72 hours. Note that measurement error can make treatments appear to be more similar when in fact they are not and this can result in study biases under a non-inferiority design.
Unusually High Responder Rates at Study Sites: In Trial 301, Site 607 (Ukraine) showed responder rates at 48-72 hrs of 36/36 (100%) for dalbavancin vs. 47/48 (97.9%) for the
Reference ID: 3505302
46
comparator. Comparisons of overall response rates for Site 607 vs. All Other Sites were 98.8% vs. 79.8%, 19.1% (13.3, 23.2), p-value= 1.2x10⁻⁶ using Fisher’s exact test.
Study Results
Issues with the study results were primarily related to Trial 301 for the following analyses which showed less favorable comparisons at later endpoints:
Clinical status at EOT/SFU: In Trial 301, comparisons for these endpoints were substantially lower in the dalbavancin arm: 81.3% vs. 86.7%, -5.4% (-11.5%, 0.6%) at EOT and 83.7% vs. 88.1%, -4.4% (-10.2%, 1.3%) at SFU.
Reviewer sensitivity analyses (S1-S4): Compared to the above analyses of clinical status, Reviewer sensitivity analyses (S1-S4) for Trial 301 showed even less favorable comparisons when placing additional requirements on erythema/lesion size and other local signs. At EOT, differences (95% CIs) for S1 & S2 were less favorable at -6.4% (-12.8, -0.1) & -7.5% (-14.1%, -0.8%). At SFU, differences (95% CIs) for S3 & S4 were less favorable at -5.1% (-11.4, 1.3) & -7.5% (-14.0, -0.9), Table 13.
Concordance analyses: Concordance analyses in Trial 301 showed that treatment comparisons were also unfavorable when considering only the subgroup of responders at 48-72 hours. When considering the concordance of early clinical response at 48-72 hours and clinical status at EOT (Table 23), success rates were 85.8% vs. 91.4%, -5.6% (-11.5, 0.2), and when considering the concordance of early clinical response at 48-72 hours and complete resolution of local signs at SFU (Table 25), success rates were 80.8% vs. 88.8%, -8.0% (-14.5, -1.6). These treatment differences were slightly larger in magnitude compared to treatment differences shown in Table 13 in the ITT population (i.e. including both responders and non-responders) at -5.6% vs. -5.4% for clinical status at EOT and -8.0% vs. -7.5% for complete resolution of local signs at SFU.
Distributions in % reductions in lesion size: When comparing treatments in Trial 301 based on the distribution of patients meeting various % reductions in lesion area at EOT and SFU, dalbavancin appeared to be less favorable across all categories of required % reductions. There also appeared to be a trend towards larger treatment differences as the required % reduction was increased, Figure 4.
Complete resolution of erythema in responders: Treatment comparisons appeared to be especially unfavorable among responders in Trial 301, where 21/240 (8.8%) of dalbavancin responders vs. 6/233 (2.6%) of comparator responders failed to have complete resolution of erythema. In Trial 302, the corresponding comparisons were 12/285 (4.2%) vs. 7/288 (2.4%), Table 26.
Reviewer analyses excluding 6 Patients: Reviewer analyses of key study endpoints excluding 6 patients due to lack of drug administration records appeared to be slightly less
Reference ID: 3505302
47
favorable at later endpoints after excluding these 6 patients, Table 35. For example, the upper confidence limit of the 95% CI for the treatment difference in success rates at EOT crossed below 0 after the exclusion.
5.2 Collective Evidence
Trials 301 & 302 both demonstrated the non-inferiority of dalbavancin to comparator therapy based on early clinical response at 48-72 hours using a 10% margin. Therefore, overall evidence of efficacy and safety was considered to be adequate. However, there is still some uncertainty regarding efficacy at later endpoints, such as clinical status at EOT and SFU which were highly variable across trials, substantially favoring the comparator in Trial 301 and dalbavancin in Trial 302. There is also uncertainty related to the success criteria used in the clinical status endpoints of both trials since these criteria may fail to address improvements in local signs that would be expected at later assessments.
5.3 Conclusions and Recommendations
Trials 301 and 302 provided adequate evidence to support the use of dalbavancin in treating adults with ABSSSI based on non-inferiority comparisons of early clinical response rates at 48-72 hours as well as other supportive evidence. As dalbavancin was only studied in adults in Trials 301 and 302, we recommend that an adequate and well controlled study is conducted in pediatric patients under the age of 18 as a post marketing requirement/commitment.
5.4 Labeling Recommendations
Labeling negotiations are still ongoing. However, some of the major changes based on statistical recommendations made to the Applicant’s initially proposed labels included the following:
The recommendation to have a table of clinical success rates (by pathogen) evaluated at both 48-72 hours and SFU where clinical success rates were defined consistently with earlier efficacy analyses in the label
Reference ID: 3505302
(b) (4)
(b) (4)
(b) (4)
48
6. REFERENCES
1. Food and Drug Administration. Guidance for industry: acute bacterial skin and skin structure infections: developing drugs for treatment. October 2013.
2. Food and Drug Administration. Draft guidance for industry: acute bacterial skin and skin structure infections: developing drugs for treatment. August 2010.
3. Snodgrass, W.R. and Anderson T. Prontosil in the Treatment of Erysipelas, A Controlled Series of 312 Cases. British Medical Journal. July 17, 1937:101-104.
4. Snodgrass, W.R. and Anderson T. Sulphanilamide in the Treatment of Erysipelas, A Controlled Series of 270 Cases. British Medical Journal. December 11, 1937:1156-1159.
5. Miettinen O, Nurminen M. Comparative analysis of two rates. Statistics in Medicine.1985;4(2):213-26.
6. Farrington CP, Manning G. Test statistics and sample size formulae for comparativebinomial trials with null hypothesis or non-zero risk difference or non-unity relative risk. Statistic in Medicine 1990;9:1447-1454.
Reference ID: 3505302
49
SIGNATURES/DISTRIBUTION LIST
Primary Statistical Reviewer: Christopher Kadoorie, Ph.D.
Date: 5/12/2014
Concurring Reviewer: Thamban Valappil, Ph.D., Statistical Team LeaderDionne Price, Ph.D., Biometrics Division Director
cc:HFD-520/Project Manager/ Chris Davi, M.S.HFD-520/Medical Team Leader/John Alexander, M.D., M.P.H.HFD-520/Medical Reviewer/Dmitri Iarikov, M.D., M.P.HHFD-520/Deputy Division Dir/ Katherine Laessig, M.D.HFD-520/ Division Dir/ Sumathi Nambiar, M.D. HFD-725/Primary Statistical Reviewer/ Christopher Kadoorie, Ph.D.HFD-725/Statistical Team Leader/ Thamban Valappil, Ph.D.HFD-725/Biometrics Deputy Division Director/ Daphne Lin, Ph.D.HFD-725/Biometrics Division Director/ Dionne Price, Ph.D.HFD-700/Mathematical Statistician/Lillian Patrician M.S., M.B.A.
Reference ID: 3505302
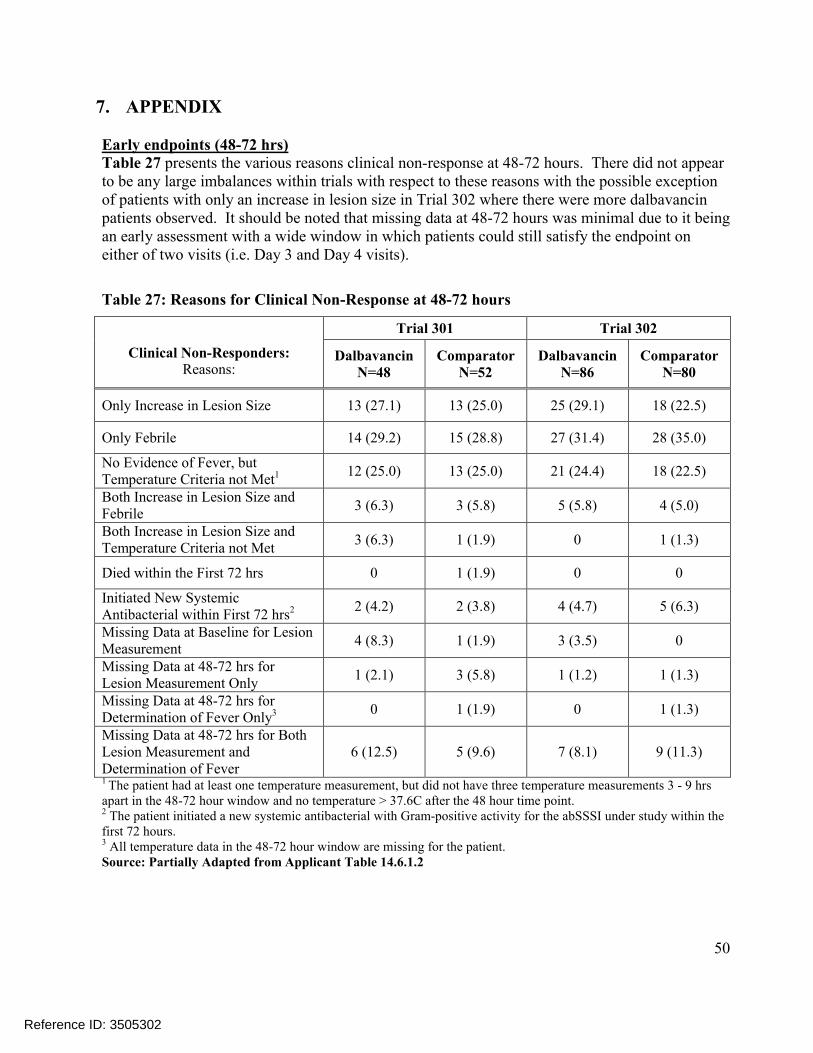
50
7. APPENDIX
Early endpoints (48-72 hrs)Table 27 presents the various reasons clinical non-response at 48-72 hours. There did not appear to be any large imbalances within trials with respect to these reasons with the possible exception of patients with only an increase in lesion size in Trial 302 where there were more dalbavancin patients observed. It should be noted that missing data at 48-72 hours was minimal due to it being an early assessment with a wide window in which patients could still satisfy the endpoint on either of two visits (i.e. Day 3 and Day 4 visits).
Table 27: Reasons for Clinical Non-Response at 48-72 hours
Clinical Non-Responders:Reasons:
Trial 301 Trial 302
DalbavancinN=48
ComparatorN=52
DalbavancinN=86
ComparatorN=80
Only Increase in Lesion Size 13 (27.1) 13 (25.0) 25 (29.1) 18 (22.5)
Only Febrile 14 (29.2) 15 (28.8) 27 (31.4) 28 (35.0)
No Evidence of Fever, but Temperature Criteria not Met1 12 (25.0) 13 (25.0) 21 (24.4) 18 (22.5)
Both Increase in Lesion Size and Febrile
3 (6.3) 3 (5.8) 5 (5.8) 4 (5.0)
Both Increase in Lesion Size and Temperature Criteria not Met
3 (6.3) 1 (1.9) 0 1 (1.3)
Died within the First 72 hrs 0 1 (1.9) 0 0
Initiated New Systemic Antibacterial within First 72 hrs2 2 (4.2) 2 (3.8) 4 (4.7) 5 (6.3)
Missing Data at Baseline for Lesion Measurement
4 (8.3) 1 (1.9) 3 (3.5) 0
Missing Data at 48-72 hrs for Lesion Measurement Only
1 (2.1) 3 (5.8) 1 (1.2) 1 (1.3)
Missing Data at 48-72 hrs for Determination of Fever Only3 0 1 (1.9) 0 1 (1.3)
Missing Data at 48-72 hrs for Both Lesion Measurement andDetermination of Fever
6 (12.5) 5 (9.6) 7 (8.1) 9 (11.3)
1 The patient had at least one temperature measurement, but did not have three temperature measurements 3 - 9 hrs apart in the 48-72 hour window and no temperature > 37.6C after the 48 hour time point.2 The patient initiated a new systemic antibacterial with Gram-positive activity for the abSSSI under study within the first 72 hours.3 All temperature data in the 48-72 hour window are missing for the patient.Source: Partially Adapted from Applicant Table 14.6.1.2
Reference ID: 3505302
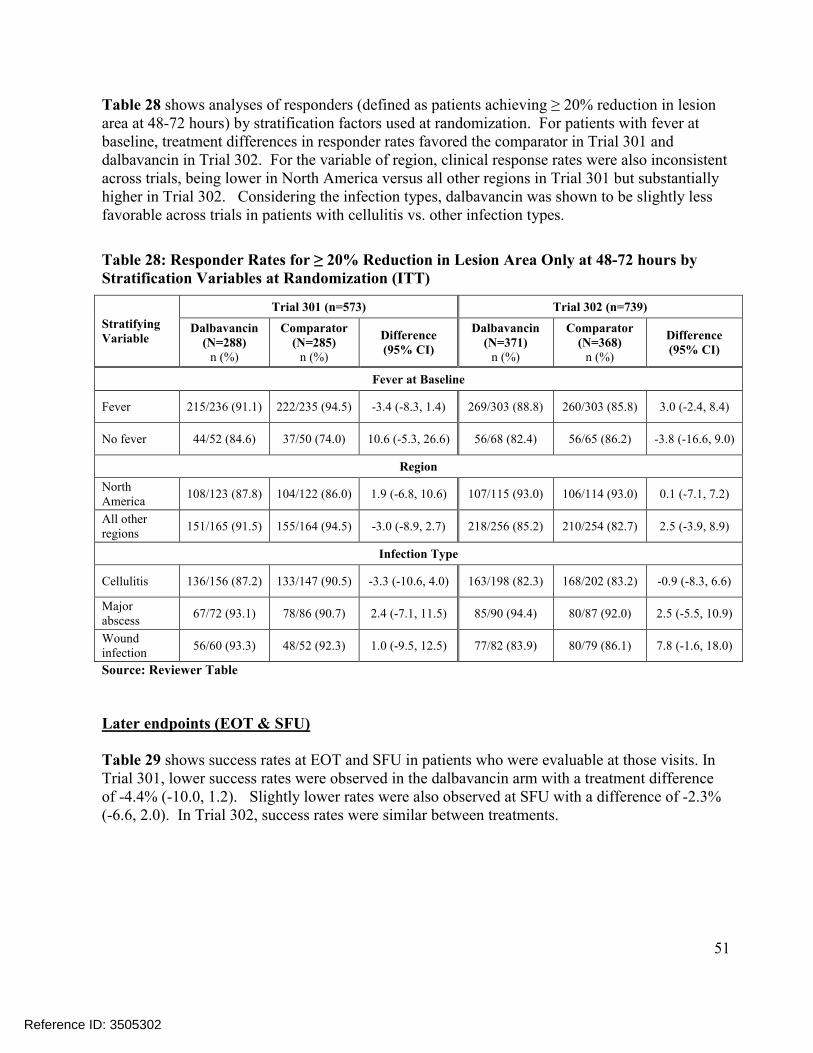
51
Table 28 shows analyses of responders (defined as patients achieving ≥ 20% reduction in lesion area at 48-72 hours) by stratification factors used at randomization. For patients with fever at baseline, treatment differences in responder rates favored the comparator in Trial 301 and dalbavancin in Trial 302. For the variable of region, clinical response rates were also inconsistent across trials, being lower in North America versus all other regions in Trial 301 but substantially higher in Trial 302. Considering the infection types, dalbavancin was shown to be slightly less favorable across trials in patients with cellulitis vs. other infection types.
Table 28: Responder Rates for ≥ 20% Reduction in Lesion Area Only at 48-72 hours by Stratification Variables at Randomization (ITT)
Stratifying Variable
Trial 301 (n=573) Trial 302 (n=739)
Dalbavancin(N=288)
n (%)
Comparator (N=285)
n (%)
Difference (95% CI)
Dalbavancin (N=371)
n (%)
Comparator (N=368)
n (%)
Difference (95% CI)
Fever at Baseline
Fever 215/236 (91.1) 222/235 (94.5) -3.4 (-8.3, 1.4) 269/303 (88.8) 260/303 (85.8) 3.0 (-2.4, 8.4)
No fever 44/52 (84.6) 37/50 (74.0) 10.6 (-5.3, 26.6) 56/68 (82.4) 56/65 (86.2) -3.8 (-16.6, 9.0)
Region
North America
108/123 (87.8) 104/122 (86.0) 1.9 (-6.8, 10.6) 107/115 (93.0) 106/114 (93.0) 0.1 (-7.1, 7.2)
All other regions
151/165 (91.5) 155/164 (94.5) -3.0 (-8.9, 2.7) 218/256 (85.2) 210/254 (82.7) 2.5 (-3.9, 8.9)
Infection Type
Cellulitis 136/156 (87.2) 133/147 (90.5) -3.3 (-10.6, 4.0) 163/198 (82.3) 168/202 (83.2) -0.9 (-8.3, 6.6)
Major abscess
67/72 (93.1) 78/86 (90.7) 2.4 (-7.1, 11.5) 85/90 (94.4) 80/87 (92.0) 2.5 (-5.5, 10.9)
Woundinfection
56/60 (93.3) 48/52 (92.3) 1.0 (-9.5, 12.5) 77/82 (83.9) 80/79 (86.1) 7.8 (-1.6, 18.0)
Source: Reviewer Table
Later endpoints (EOT & SFU)
Table 29 shows success rates at EOT and SFU in patients who were evaluable at those visits. In Trial 301, lower success rates were observed in the dalbavancin arm with a treatment difference of -4.4% (-10.0, 1.2). Slightly lower rates were also observed at SFU with a difference of -2.3% (-6.6, 2.0). In Trial 302, success rates were similar between treatments.
Reference ID: 3505302

52
Table 29: Reviewer Analyses of Clinical Status, Success Rates at EOT & SFU in Clinically Evaluable Patients
Clinical Status Dalbavancinn/N (%)
Comparatorn/N (%)
Difference(95% CI)1
Trial 301 N=288 N=285
Success, CE-EOT 214/246 (87.0%) 222/243 (91.4%) -4.4% (-10.0, 1.2)
Success, CE-SFU 212/226 (93.8%) 220/229 (96.1%) -2.3% (-6.6, 2.0)
Trial 302 N=371 N=368
Success, CE-EOT 303/324 (93.5%) 280/302 (92.7%) 0.8% (-3.3, 5.0)
Success, CE-SFU 283/294 (96.3%) 257/272 (94.5%) 1.8% (-1.8, 5.6)1 95% CIs were calculated using the Miettinen and Nurminen approach, adjusted for baseline fever status.2 Clinical status at EOT was a pre-specified secondary endpoint. Source: Reviewer Table
In Table 30, treatment differences in the investigator assessment at EOT and SFU favored the comparator in Trial 301 and dalbavancin in Trial 302. In both trials, treatment differences for investigator assessment at EOT and SFU were smaller than treatment differences for clinical status at EOT and SFU.
Table 30: Clinical Success Rates from Investigator Assessment at EOT, SFU (ITT)
Trial 301 Trial 302
EndpointDalbavancin
(N=288) n (%)
Comparator (N=285)
n (%)
Difference (95% CI)
Dalbavancin (N=371)
n (%)
Comparator (n=368) n (%)
Difference (95% CI)
InvestigatorAssessment at EOT
260 (90.3) 262 (91.9) -1.7 (-6.5, 3.1) 342 (92.2) 332 (90.2) 2.0 (-2.2, 6.2)
InvestigatorAssessment at SFU
248 (86.1) 255 (89.5) -3.4 (-8.8, 2.0) 326 (87.9) 317 (86.1) 1.7 (-3.2, 6.6)
Source: Reviewer Table
In Table 31, responder rates by pathogen (responders defined as those with a ≥ 20% reduction in lesion area at 48-72 hours) were generally similar across trials in both treatment arms, tending to be slightly higher in the dalbavancin arm for patients with S.aureus at baseline. When considering responder rates based on a 20% reduction in lesion area rather than on cessation of spread of lesion and absence of fever (primary endpoint) as in Table 18, Trial 301 comparisons of responder rates favored dalbavancin for S.aureus and the comparator for S.pyogenes.
Reference ID: 3505302
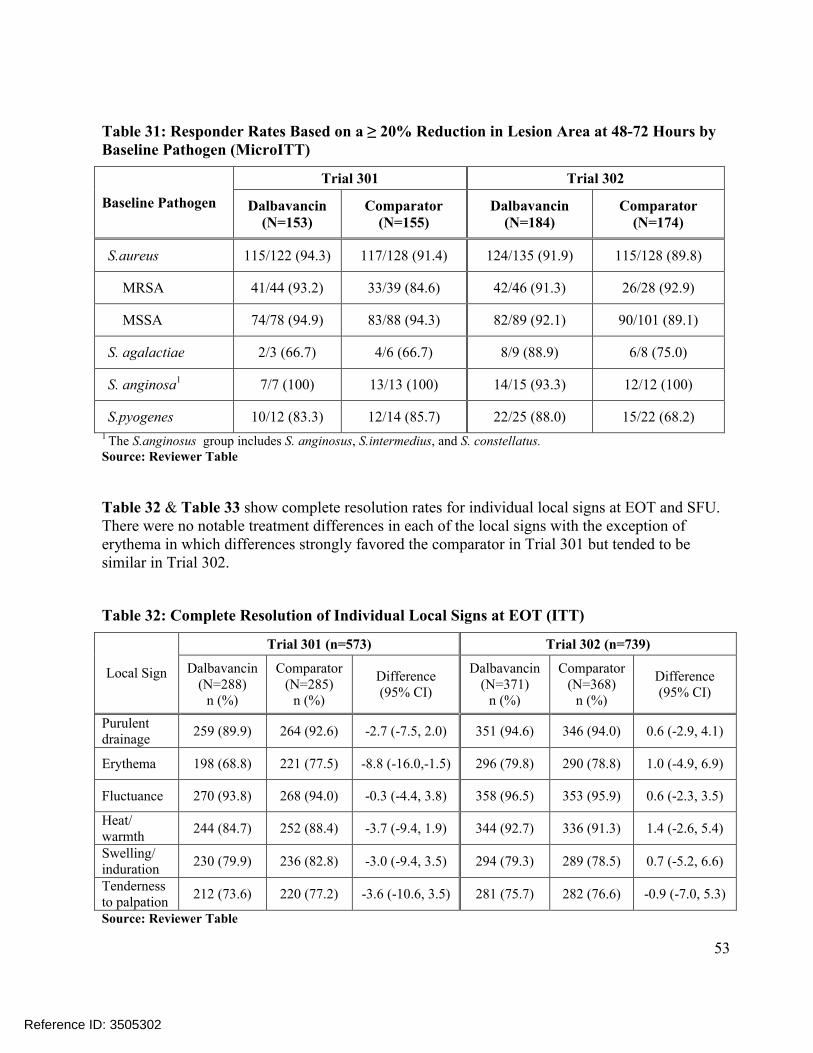
53
Table 31: Responder Rates Based on a ≥ 20% Reduction in Lesion Area at 48-72 Hours by Baseline Pathogen (MicroITT)
Baseline Pathogen
Trial 301 Trial 302
Dalbavancin(N=153)
Comparator (N=155)
Dalbavancin(N=184)
Comparator(N=174)
S.aureus 115/122 (94.3) 117/128 (91.4) 124/135 (91.9) 115/128 (89.8)
MRSA 41/44 (93.2) 33/39 (84.6) 42/46 (91.3) 26/28 (92.9)
MSSA 74/78 (94.9) 83/88 (94.3) 82/89 (92.1) 90/101 (89.1)
S. agalactiae 2/3 (66.7) 4/6 (66.7) 8/9 (88.9) 6/8 (75.0)
S. anginosa1 7/7 (100) 13/13 (100) 14/15 (93.3) 12/12 (100)
S.pyogenes 10/12 (83.3) 12/14 (85.7) 22/25 (88.0) 15/22 (68.2)1 The S.anginosus group includes S. anginosus, S.intermedius, and S. constellatus.Source: Reviewer Table
Table 32 & Table 33 show complete resolution rates for individual local signs at EOT and SFU. There were no notable treatment differences in each of the local signs with the exception of erythema in which differences strongly favored the comparator in Trial 301 but tended to be similar in Trial 302.
Table 32: Complete Resolution of Individual Local Signs at EOT (ITT)
Local Sign
Trial 301 (n=573) Trial 302 (n=739)
Dalbavancin (N=288)
n (%)
Comparator (N=285)
n (%)
Difference(95% CI)
Dalbavancin (N=371)
n (%)
Comparator (N=368)
n (%)
Difference (95% CI)
Purulent drainage
259 (89.9) 264 (92.6) -2.7 (-7.5, 2.0) 351 (94.6) 346 (94.0) 0.6 (-2.9, 4.1)
Erythema 198 (68.8) 221 (77.5) -8.8 (-16.0,-1.5) 296 (79.8) 290 (78.8) 1.0 (-4.9, 6.9)
Fluctuance 270 (93.8) 268 (94.0) -0.3 (-4.4, 3.8) 358 (96.5) 353 (95.9) 0.6 (-2.3, 3.5)
Heat/warmth
244 (84.7) 252 (88.4) -3.7 (-9.4, 1.9) 344 (92.7) 336 (91.3) 1.4 (-2.6, 5.4)
Swelling/induration
230 (79.9) 236 (82.8) -3.0 (-9.4, 3.5) 294 (79.3) 289 (78.5) 0.7 (-5.2, 6.6)
Tenderness to palpation
212 (73.6) 220 (77.2) -3.6 (-10.6, 3.5) 281 (75.7) 282 (76.6) -0.9 (-7.0, 5.3)
Source: Reviewer Table
Reference ID: 3505302
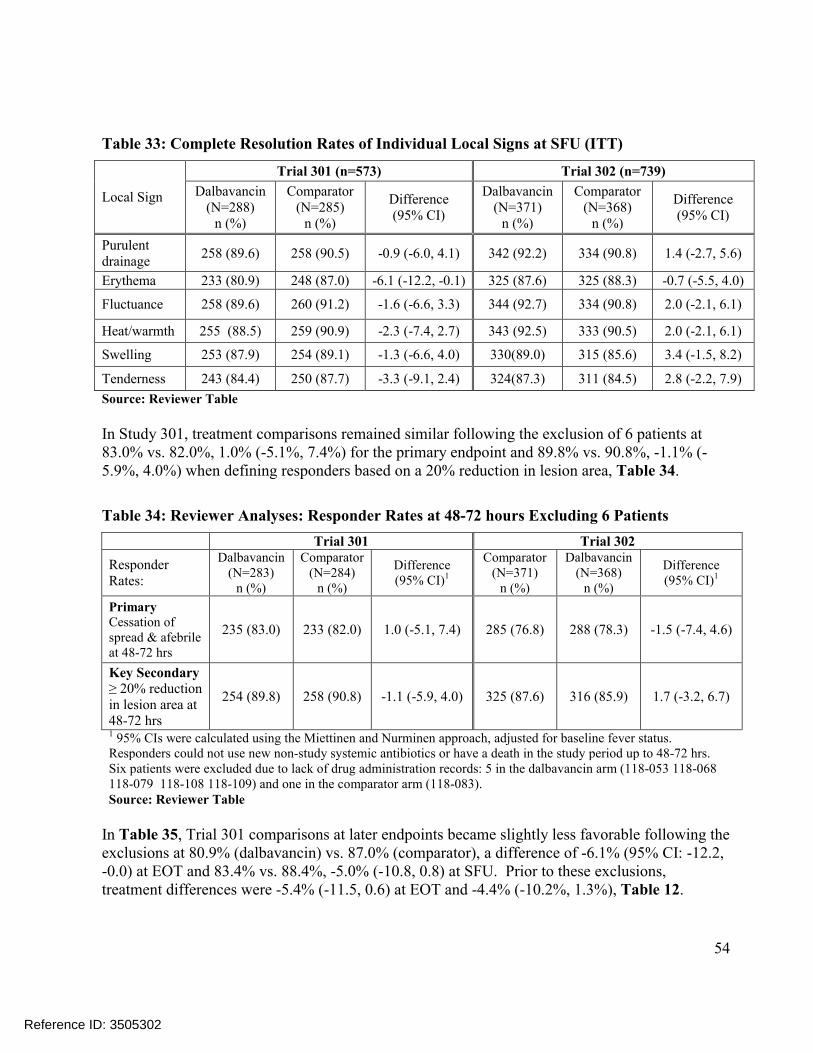
54
Table 33: Complete Resolution Rates of Individual Local Signs at SFU (ITT)
Local Sign
Trial 301 (n=573) Trial 302 (n=739)
Dalbavancin (N=288)
n (%)
Comparator (N=285)
n (%)
Difference (95% CI)
Dalbavancin (N=371)
n (%)
Comparator (N=368)
n (%)
Difference (95% CI)
Purulent drainage
258 (89.6) 258 (90.5) -0.9 (-6.0, 4.1) 342 (92.2) 334 (90.8) 1.4 (-2.7, 5.6)
Erythema 233 (80.9) 248 (87.0) -6.1 (-12.2, -0.1) 325 (87.6) 325 (88.3) -0.7 (-5.5, 4.0)
Fluctuance 258 (89.6) 260 (91.2) -1.6 (-6.6, 3.3) 344 (92.7) 334 (90.8) 2.0 (-2.1, 6.1)
Heat/warmth 255 (88.5) 259 (90.9) -2.3 (-7.4, 2.7) 343 (92.5) 333 (90.5) 2.0 (-2.1, 6.1)
Swelling 253 (87.9) 254 (89.1) -1.3 (-6.6, 4.0) 330(89.0) 315 (85.6) 3.4 (-1.5, 8.2)
Tenderness 243 (84.4) 250 (87.7) -3.3 (-9.1, 2.4) 324(87.3) 311 (84.5) 2.8 (-2.2, 7.9)
Source: Reviewer Table
In Study 301, treatment comparisons remained similar following the exclusion of 6 patients at 83.0% vs. 82.0%, 1.0% (-5.1%, 7.4%) for the primary endpoint and 89.8% vs. 90.8%, -1.1% (-5.9%, 4.0%) when defining responders based on a 20% reduction in lesion area, Table 34.
Table 34: Reviewer Analyses: Responder Rates at 48-72 hours Excluding 6 Patients
Trial 301 Trial 302
Responder Rates:
Dalbavancin (N=283)
n (%)
Comparator (N=284)
n (%)
Difference (95% CI)1
Comparator (N=371)
n (%)
Dalbavancin (N=368)
n (%)
Difference (95% CI)1
Primary Cessation of spread & afebrileat 48-72 hrs
235 (83.0) 233 (82.0) 1.0 (-5.1, 7.4) 285 (76.8) 288 (78.3) -1.5 (-7.4, 4.6)
Key Secondary ≥ 20% reduction in lesion area at 48-72 hrs
254 (89.8) 258 (90.8) -1.1 (-5.9, 4.0) 325 (87.6) 316 (85.9) 1.7 (-3.2, 6.7)
1 95% CIs were calculated using the Miettinen and Nurminen approach, adjusted for baseline fever status.Responders could not use new non-study systemic antibiotics or have a death in the study period up to 48-72 hrs.Six patients were excluded due to lack of drug administration records: 5 in the dalbavancin arm (118-053 118-068118-079 118-108 118-109) and one in the comparator arm (118-083).Source: Reviewer Table
In Table 35, Trial 301 comparisons at later endpoints became slightly less favorable following the exclusions at 80.9% (dalbavancin) vs. 87.0% (comparator), a difference of -6.1% (95% CI: -12.2, -0.0) at EOT and 83.4% vs. 88.4%, -5.0% (-10.8, 0.8) at SFU. Prior to these exclusions, treatment differences were -5.4% (-11.5, 0.6) at EOT and -4.4% (-10.2%, 1.3%), Table 12.
Reference ID: 3505302

55
Table 35: Reviewer Analyses of Clinical Status, Success Rates at EOT & SFU (ITT), Excluding 6 Patients
Clinical Status at EOT2 and SFU Outcome
Dalbavancinn/N (%)
Comparatorn/N (%)
Difference(95% CI)1
Trial 301 N=283 N=284
Success, EOT 229 (80.9%) 247 (87.0%) -6.1% (-12.2, -0.0)
Failure 40 (14.1) 29 (10.2) 3.9
Indeterminate 14 (4.9) 8 (2.8) 2.1
Success, SFU 236 (83.4%) 251 (88.4%) -5.0% (-10.8, 0.8)
Failure 18 (6.4) 13 (4.6) 1.8
Indeterminate 29 (10.2) 20 (7.0) 3.2
Trial 302 N=371 N=368
Success, EOT 329 (88.7%) 314 (85.3%) 3.4% (-1.5, 8.3)
Failure 32 (8.6) 34 (9.2) -0.6
Indeterminate 10 (2.7) 20 (5.4) -2.7
Trial 302 N=371 N=368
Success, SFU 327 (88.1%) 311 (84.5%) 3.6% (-1.3, 8.7)
Failure 18 (4.9) 23 (6.3) -1.4
Indeterminate 26 (7.0) 34 (9.2) -2.21 95% CIs were calculated using the Miettinen and Nurminen approach, unadjusted.2 Clinical status at EOT was a pre-specified secondary endpoint. Six patients were excluded due to lack of drug administration records: 5 in the dalbavancin arm (118-053 118-068118-079 118-108 118-109) and one in the comparator arm (118-083).Source: Reviewer Table
Reference ID: 3505302

56
Other Analyses
Table 36 provides some of the reasons for use of non-study antibiotics at SFU and the days in which they were initiated. The most common reasons for non-study systemic antibacterial use related to either an ‘insufficient therapeutic effect’ or ‘primary ABSSSI site, after study therapy’. There were no consistent trends across trials favoring either treatment with respect to reasons for non-study systemic antibacterial use.
Table 36: Reasons for Use of Non-Study Antibiotics at SFU, Trials 301 & 302 (ITT)
Reasons for use of non-studysystemic antibacterials (more than one may apply):
Trial 301 Trial 302
Dalbavancin (N=16)
Comparator(N=7)
Dalbavancin (N=11)
Comparator(N=15)
Insufficient therapeutic effect:Start of Antibacterial Use:
n=8Days: 3, 4, 6, 8, 14, 15, 16, 17
n=5Days: 3, 3, 7, 15, 24
n=3Days: 2, 4, 12
n=5Days: 3, 4, 6, 11, 15
Adjunctive therapy, gramnegative pathogen:Start of Antibacterial Use:
n=3Days: 1,1,1
n=1Day: 2
n=3Days: 1,1, 9
n=4Days: 1, 1, 3, 10
Primary ABSSSI site, after study therapy:Start of Antibacterial Use:
n=8Days: 5, 6, 6, 14, 14, 15, 17, 28
n=3Days: 2, 15, 25
n=8Days: 2, 3, 8, 10, 13, 13,18, 23
n=12Days: 2, 3, 3, 9, 14, 15, 15, 15, 15, 15, 18, 21
Other:Start of Antibacterial Use:
n=4Days: 1, 2, 2, 27
n=0 n=3Days: 2, 4, 28
n=3Days: 2, 14, 25
Source: Reviewer Table
Reference ID: 3505302

57
Statistical Details
Estimation of Confidence Limits Using the Miettinin and Nurminen Approach:
The two-sided 95% CI for non-inferiority testing based on the difference of clinical responserates at 48-72 hours will be computed using the method proposed for stratified designs by Miettinen and Nurminen. For notation purposes, assume 1 represents the dalbavancin group(Group 1), 2 represents the vancomycin/linezolid group (Group 2), and i represents the ithstratum. Cochran-Mantel-Haenszel weights will be used for the stratum weights in thecalculation for the CI as follows: Wi = (n1i * n2i)/ (n1i + n2i).
he two-sided 95% CI is given by the roots for RD= p1- p2 of
where x2 is the cut point of size α from the chi-square distribution (x2α =3.84 for two-sided
95% CI); RD is the difference between the two population rates (RD = p1- p
2); p̂
1= the
observed weighted average (across the i strata) proportion in Group 1; weighted average (acrossthe i strata) proportion in Group 2; and p̂
2= the observed weighted average (across the i strata)
proportion in Group 2; and
where n1i
= number of patients in Group 1 in the ith stratum; n2i
= number of patients in Group 2
in the ith stratum; ~p1 = ~p2 + RD ; and ~p2 is the maximum likelihood estimate for p2
as a function
of RD and under the constraint p1
= p2
+ RD .
As stated above, the two-sided 95% CI for the difference in rates is given by the roots for
RD = p1- p
2from the equation above. But this equation does not allow for explicit solution
for RD. Therefore, a numerical algorithm will be used to obtain the two roots (CI) for RD. ThisCI approach corresponds to the non-inferiority test (a p-value approach) proposed by Farringtonand Manning6.
Reference ID: 3505302
---------------------------------------------------------------------------------------------------------This is a representation of an electronic record that was signedelectronically and this page is the manifestation of the electronicsignature.---------------------------------------------------------------------------------------------------------/s/----------------------------------------------------
CHRISTOPHER E KADOORIE05/12/2014
THAMBAN I VALAPPIL05/12/2014
DIONNE L PRICE05/13/2014Concur with overall conclusion
Reference ID: 3505302
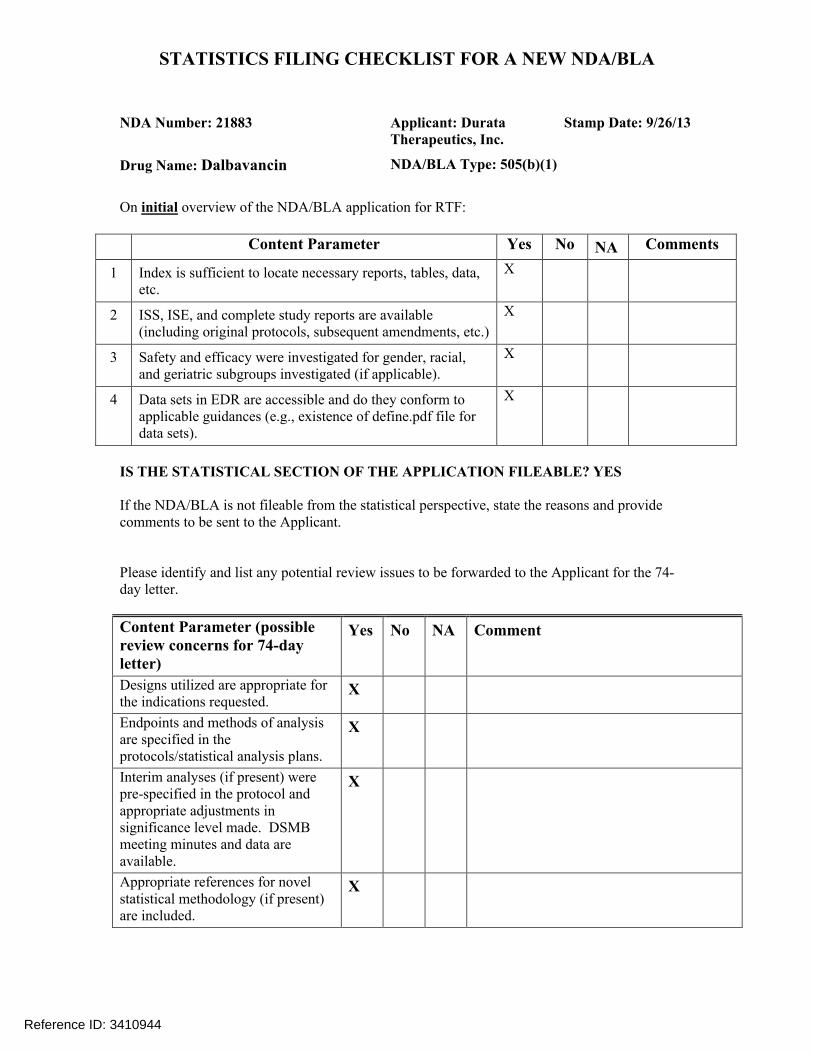
STATISTICS FILING CHECKLIST FOR A NEW NDA/BLA
NDA Number: 21883 Applicant: Durata Therapeutics, Inc.
Stamp Date: 9/26/13
Drug Name: Dalbavancin NDA/BLA Type: 505(b)(1)
On initial overview of the NDA/BLA application for RTF:
Content Parameter Yes No NA Comments
1 Index is sufficient to locate necessary reports, tables, data, etc.
X
2 ISS, ISE, and complete study reports are available (including original protocols, subsequent amendments, etc.)
X
3 Safety and efficacy were investigated for gender, racial, and geriatric subgroups investigated (if applicable).
X
4 Data sets in EDR are accessible and do they conform to applicable guidances (e.g., existence of define.pdf file for data sets).
X
IS THE STATISTICAL SECTION OF THE APPLICATION FILEABLE? YES
If the NDA/BLA is not fileable from the statistical perspective, state the reasons and provide comments to be sent to the Applicant.
Please identify and list any potential review issues to be forwarded to the Applicant for the 74-day letter.
Content Parameter (possible review concerns for 74-day letter)
Yes No NA Comment
Designs utilized are appropriate for the indications requested.
X
Endpoints and methods of analysis are specified in the protocols/statistical analysis plans.
X
Interim analyses (if present) were pre-specified in the protocol and appropriate adjustments in significance level made. DSMB meeting minutes and data are available.
X
Appropriate references for novel statistical methodology (if present) are included.
X
Reference ID: 3410944
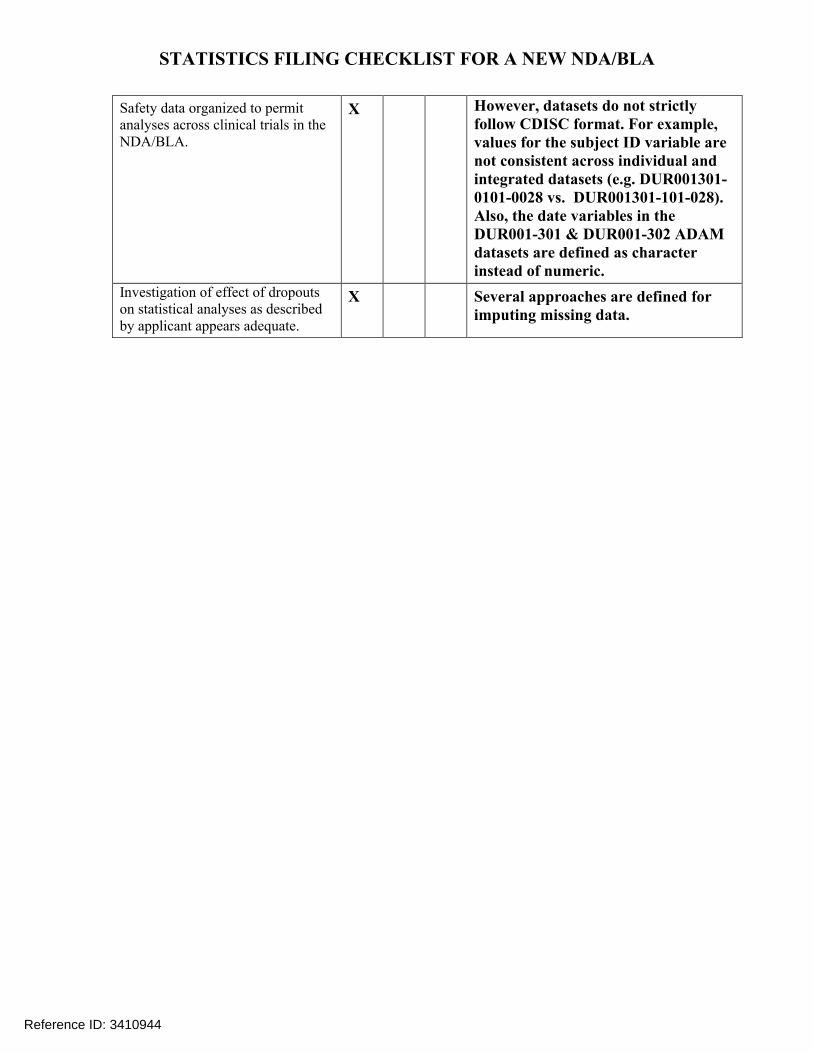
STATISTICS FILING CHECKLIST FOR A NEW NDA/BLA
Safety data organized to permit analyses across clinical trials in the NDA/BLA.
X However, datasets do not strictly follow CDISC format. For example, values for the subject ID variable are not consistent across individual and integrated datasets (e.g. DUR001301-0101-0028 vs. DUR001301-101-028).Also, the date variables in the DUR001-301 & DUR001-302 ADAM datasets are defined as character instead of numeric.
Investigation of effect of dropouts on statistical analyses as described by applicant appears adequate.
X Several approaches are defined for imputing missing data.
Reference ID: 3410944
---------------------------------------------------------------------------------------------------------This is a representation of an electronic record that was signedelectronically and this page is the manifestation of the electronicsignature.---------------------------------------------------------------------------------------------------------/s/----------------------------------------------------
CHRISTOPHER E KADOORIE11/21/2013
THAMBAN I VALAPPIL11/25/2013
Reference ID: 3410944

1
Non-Inferiority Margin Justification for Complicated Skin and Skin Structure Infections using Vancomycin as the Active Comparator
(b) (4)
5 Page(s) has been Withheld in Full as B4 (CCI/TS) immediately following this page

---------------------------------------------------------------------------------------------------------------------This is a representation of an electronic record that was signed electronically andthis page is the manifestation of the electronic signature.--------------------------------------------------------------------------------------------------------------------- /s/---------------------Scott Komo12/14/2007 11:24:42 PMBIOMETRICS
Thamban Valappil12/18/2007 04:46:30 PMBIOMETRICS
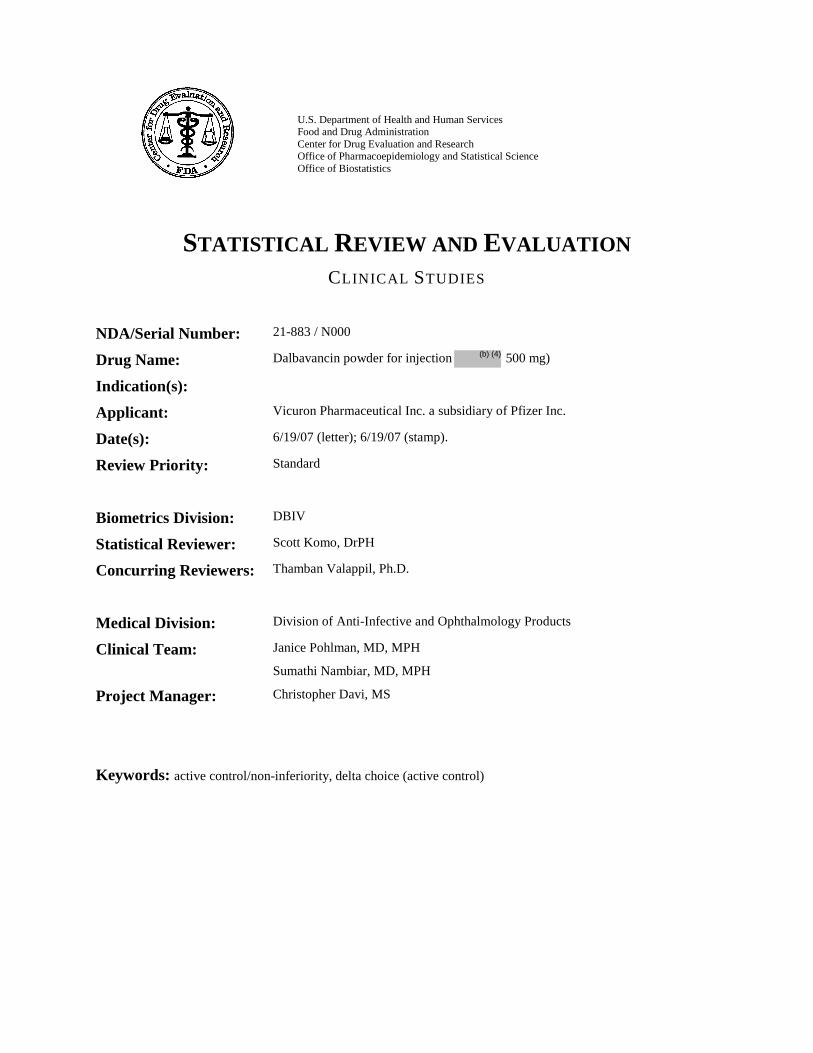
U.S. Department of Health and Human Services Food and Drug Administration Center for Drug Evaluation and Research Office of Pharmacoepidemiology and Statistical Science Office of Biostatistics
STATISTICAL REVIEW AND EVALUATION
CLINICAL STUDIES
NDA/Serial Number: 21-883 / N000
Drug Name: Dalbavancin powder for injection 500 mg)
Indication(s):
Applicant: Vicuron Pharmaceutical Inc. a subsidiary of Pfizer Inc.
Date(s): 6/19/07 (letter); 6/19/07 (stamp).
Review Priority: Standard
Biometrics Division: DBIV
Statistical Reviewer: Scott Komo, DrPH
Concurring Reviewers: Thamban Valappil, Ph.D.
Medical Division: Division of Anti-Infective and Ophthalmology Products
Clinical Team: Janice Pohlman, MD, MPH
Sumathi Nambiar, MD, MPH
Project Manager: Christopher Davi, MS
Keywords: active control/non-inferiority, delta choice (active control)
(b) (4)

NDA 21-883 / N000
2 2
Table of Contents 1. EXECUTIVE SUMMARY .................................................................................................................................3
1.1 CONCLUSIONS AND RECOMMENDATIONS .......................................................................................................3 1.2 BRIEF OVERVIEW OF CLINICAL STUDIES ........................................................................................................4 1.3 STATISTICAL ISSUES AND FINDINGS ...............................................................................................................4
REFERENCES ............................................................................................................................................................6
SIGNATURES/DISTRIBUTION LIST.....................................................................................................................7
---------------------------------------------------------------------------------------------------------------------This is a representation of an electronic record that was signed electronically andthis page is the manifestation of the electronic signature.--------------------------------------------------------------------------------------------------------------------- /s/---------------------Scott Komo12/12/2007 11:20:42 AMBIOMETRICS
Thamban Valappil12/12/2007 11:37:19 AMBIOMETRICS

2
Table of Contents LIST OF TABLES.......................................................................................................................................................3
1 EXECUTIVE SUMMARY .................................................................................................................................4 1.1 CONCLUSIONS AND RECOMMENDATIONS .......................................................................................................4 1.2 BRIEF OVERVIEW OF CLINICAL STUDIES ........................................................................................................4
1.2.1 Study VER001-9 Complicated Skin and Skin Structure Infections (cSSSI) .........................................4 1.2.2 Study VER001-8 Uncomplicated Skin and Skin Structure Infections (uSSSI) .....................................5
1.3 STATISTICAL ISSUES AND FINDINGS ...............................................................................................................5 1.4 SAFETY ISSUES ...............................................................................................................................................5
2 INTRODUCTION ...............................................................................................................................................5 2.1 OVERVIEW......................................................................................................................................................5 2.2 DATA SOURCES ..............................................................................................................................................6
3 STATISTICAL EVALUATION ........................................................................................................................6 3.1 EVALUATION OF EFFICACY ............................................................................................................................6
3.1.1 Study VER001-9 Complicated Skin and Skin Structure Infections (cSSSI) .........................................6 3.1.2 Study VER001-8 Uncomplicated Skin and Skin Structure Infections (uSSSI) ...................................14
3.2 EVALUATION OF SAFETY..............................................................................................................................21 4 FINDINGS IN SPECIAL/SUBGROUP POPULATIONS .............................................................................23
4.1 GENDER, RACE AND AGE .............................................................................................................................23 4.1.1 Study VER001-9 Complicated Skin and Skin Structure Infections.....................................................23 4.1.2 Study VER001-8 Uncomplicated Skin and Skin Structure Infections.................................................26
4.2 OTHER SPECIAL/SUBGROUP POPULATIONS ..................................................................................................29 4.2.1 Study VER001-9 Complicated Skin and Skin Structure Infections.....................................................29 4.2.2 Study VER001-8 Uncomplicated Skin and Skin Structure Infections.................................................30
5 SUMMARY AND CONCLUSIONS ................................................................................................................31 5.1 STATISTICAL ISSUES AND COLLECTIVE EVIDENCE .......................................................................................31 5.2 CONCLUSIONS AND RECOMMENDATIONS .....................................................................................................31

3
LIST OF TABLES
Table 1: Study VER001-9 Number of patients in each population category.................................................................9 Table 2 Study VER001-9 Reconciliation of denominators used by Sponsor and changes made to arrive at
denominators used by Division for each analysis population. ...............................................................................9 Table 3: Study VER001-9 Demographic and Background Characteristics (ITT Population) ....................................10 Table 4: Study VER001-9 Patient Successful Clinical Response at Test of Cure as assessed by Sponsor and as
assessed by Division in Complicated Skin and Skin Structure Infections. ..........................................................12 Table 5: Study VER001-9 Patient Successful Clinical Response at Test of Cure by Type of Infection in the Intent to
Treat population as assessed by Sponsor and as assessed by Division in Complicated Skin and Skin Structure Infections. ............................................................................................................................................................12
Table 6: Study VER001-9 By Pathogen Patient Successful Microbiological Response at Test of Cure as assessed by Sponsor and as assessed by Division in Complicated Skin and Skin Structure Infections. .................................13
Table 7: Study VER001-8 Number of patients in each population category...............................................................16 Table 8: Study VER001-8 Reconciliation of denominators used by Sponsor and changes made to arrive at
denominators used by Division for each analysis population. .............................................................................16 Table 9 : Study VER001-8 Demographic and Background Characteristics (Safety ITT Population) ........................17 Table 10: Study VER001-8 Patient Successful Clinical Response at Test of Cure as assessed by Sponsor and as
assessed by Division in Uncomplicated Skin and Skin Structure Infections (uSSSI). ........................................19 Table 11: Study VER001-8 Patient Successful Clinical Response at Test of Cure by Type of Infection in the Intent
to Treat populations as assessed by Sponsor and as assessed by Division in Uncomplicated Skin and Skin Structure Infections (uSSSI). ...............................................................................................................................20
Table 12: Study VER001-8 By Pathogen Patient Successful Microbiological Response at Test of Cure as assessed by Sponsor and as assessed by Division in Uncomplicated Skin and Skin Structure Infections. ........................21
Table 13: Number (%) of Patients who died in the Phase 2/3 studies ........................................................................22 Table 14: Study VER001-9 Patient Successful Clinical Response at Test of Cure by Gender as assessed by Sponsor
and as assessed by Division in Complicated Skin and Skin Structure Infections. ...............................................23 Table 15: Study VER001-9 Patient Successful Clinical Response at Test of Cure by Ethnicity as assessed by
Sponsor and as assessed by Division in Complicated Skin and Skin Structure Infections. .................................24 Table 16: Study VER001-9 Patient Successful Clinical Response at Test of Cure by Age Group (<65 or ≥65) as
assessed by Sponsor and as assessed by Division in Complicated Skin and Skin Structure Infections...............25 Table 17: Study VER001-8 Patient Successful Clinical Response at Test of Cure by Gender as assessed by Sponsor
and as assessed by Division in Uncomplicated Skin and Skin Structure Infections. ...........................................26 Table 18: Study VER001-8 Patient Successful Clinical Response at Test of Cure by Ethnicity as assessed by
Sponsor and as assessed by Division in Complicated Skin and Skin Structure Infections. .................................27 Table 19: Study VER001-8 Patient Successful Clinical Response at Test of Cure by Age Group (<65 or ≥65) as
assessed by Sponsor and as assessed by Division in Uncomplicated Skin and Skin Structure Infections...........28 Table 20: Study VER001-9 Patient Successful Clinical Response at Test of Cure by Region (North America versus
Europe) as assessed by Sponsor and as assessed by Division in Complicated Skin and Skin Structure Infections..............................................................................................................................................................................29
Table 21: Study VER001-8 Patient Successful Clinical Response at Test of Cure by Region (North America versus Europe) as assessed by Sponsor and as assessed by Division in Uncomplicated Skin and Skin Structure Infections. ............................................................................................................................................................30
6
This new drug application contains three Phase 3 studies. Sponsor reports results for one confirmatory study VER001-9 conducted in complicated skin and skin structure infections(cSSSI) and one supportive study VER001-8 conducted in uncomplicated skin and skin structure infections (uSSSI) that required IV therapy. The comparator in VER001-9 was IV linezolid 600 mg q12h with possible switch to oral linezolid 600 mg q12h. The comparator in VER001-8 was 500 mg q8h with possible switch to oral cefazolin 500 mg q6h. In addition, Sponsor includes an open-label Phase 3 study VER001-16 in skin and skin structure infections that required IV therapy. In addition to Phase 2 pilot study VER001-5, Sponsor conducted VER001-4 as a Phase 2, randomized, open-label, multi-center study to evaluate the safety and efficacy of dalbavancin versus vancomycin in the treatment of catheter-related bloodstream infections with suspected or confirmed Gram-positive bacterial pathogens. Seventy-five patients were randomized and 64 patients completed the study. Sponsor reported that patients in the microbiological ITT population at TOC who received dalbavancin (87.0%, 95% CI: 73.2, 100.0) had a higher success rate than patients who received vancomycin (50.0%, 95% CI: 31.5, 68.5).
2.2 Data Sources
The datasets analyzed are in the CDER Electronic Document Room (EDR) in the following folders: \\Cdsesub1\n21883\N 000\2005-02-24\CD B\crt\datasets\VER001-9\ \\Cdsesub1\n21883\N 000\2005-02-24\CD A\crt\datasets\VER001-8\ \\Cdsesub1\n21883\N 000\2005-02-24\CD A\crt\datasets\VER001-16\ \\Cdsesub1\n21883\N 000\2005-02-24\CD A\crt\datasets\ISS\ Statistical Reviewer’s Comment: On the request of the FDA, the Sponsor submitted revised datasets. Datasets originally submitted by the sponsor are located in the EDR in the folder \\cdsesub1\N21883\N 000\2004-12-21\crt\datasets. The statistical reviewer’s 45-day fileability review documents the changes requested and made by the Sponsor. During the course of the review, the ISS data was converted to CDISC Study Data Tabulation Model format to support use of visualization and data mining tools. Additional inconsistencies in the data were addressed during the conversion such as use of multiple versions of MedDRA for coding adverse events and laboratory values that used different units in the U.S. than were used at the Canadian and European sites.
3 STATISTICAL EVALUATION
3.1 Evaluation of Efficacy
The medical officer, Dr. Pohlman’s review provides detailed clinical information and discussion.
3.1.1 Study VER001-9 Complicated Skin and Skin Structure Infections (cSSSI)
26 Page(s) has been Withheld in Full as B4 (CCI/TS) immediately following this page

---------------------------------------------------------------------------------------------------------------------This is a representation of an electronic record that was signed electronically andthis page is the manifestation of the electronic signature.--------------------------------------------------------------------------------------------------------------------- /s/---------------------Sue Bell9/20/2005 12:31:58 PMBIOMETRICSRevised to removed footer and add Bell to cc list
Daphne Lin9/20/2005 01:57:34 PMBIOMETRICS