02-FINAL PC-I JULY,2014.pdf
141
PEDO PAKHTUNKHWA ENERGY DEVELOPMENT ORGANIZATION GOVERNMENT OF KHYBER PAKHTUNKHWA PROVINCE PC – I PROFORMA CONSTRUCTION OF GAHRAIT-SWIR LASHT HYDROPOWER PROJECT (377 MW) DISTRICT CHITRAL ADP No. ____ E s timated C os t R s . 181,115.83 Mill ion JULY, 2014 A Joint Venture of: Associated Consulting Engineers – ACE (Pvt.) Ltd. 1 – C/2, M. M. Alam Road, Gulberg- III, Lahore Engineering General Consultants EGC (Pvt.) Ltd. 49/D-1, Gulberg-III, Lahore Technical Engineering and Management Consultants Suit No.9, 4 th Floor, Amaan Business Centre, Block H-3, Johar Town, Lahore
-
Upload
farooq-bhutta -
Category
Documents
-
view
223 -
download
0
Transcript of 02-FINAL PC-I JULY,2014.pdf
7/24/2019 02-FINAL PC-I JULY,2014.pdf
http://slidepdf.com/reader/full/02-final-pc-i-july2014pdf 1/141
PEDOPAKHTUNKHWA ENERGY DEVELOPMENT ORGANIZATIONGOVERNMENT OF KHYBER PAKHTUNKHWA PROVINCE
PC – I PROFORMA
CONSTRUCTION
OF
GAHRAIT-SWIR LASHT HYDROPOWER PROJECT (377 MW)
DISTRICT CHITRAL
ADP No. ____
Estimated Cos t Rs. 181,115.83 Mill io n
JULY, 2014
i f
7/24/2019 02-FINAL PC-I JULY,2014.pdf
http://slidepdf.com/reader/full/02-final-pc-i-july2014pdf 2/141
PC-I Performa
CONSTRUCTION OF
GAHRAIT-SWIR LASHT HYDROPOWER PROJECT (377 MW)
DISTRICT CHITRAL
TABLE OF CONTENTS
Sr. No. Description Page No.
1. Name of the Project 1
2. Location 1
3. Authorities Responsible 1
4. Plan Provision 1
5. Relationship of the Project with Objectives of the Sector 1
6. Description, Justification, Technical Parameters and Technology
Transfer Aspects 2
7. Capital Cost of Project 39
8. Annual Operating and Maintenance Cost after Completion of the Project 40
9. Demand and Supply 40
10. Financial Plan and Mode of Financing 41
11. Project Benefits and Analysis 41
12. Implementation Schedule (Including Starting and Completion Dates) 52
13. Management Structure and Manpower Requirements Including Specialized
Skills during Construction and Operational Phases 53
7/24/2019 02-FINAL PC-I JULY,2014.pdf
http://slidepdf.com/reader/full/02-final-pc-i-july2014pdf 3/141
GOVERNMENT OF PAKISTAN
PLANNING COMMISSION
PC-I FORM
(INFRASTRUCTURE SECTORS)
Sr.
No.
Title Description
1. NAME OF THE
PROJECT
Feasibility study of 377 MW of Gahrait Swir Lasht
Hydropower Project, District Chitral, Khyber Pakhtunkhwa
Province, Pakistan.
2. LOCATIONThe proposed Gahrait Swir Lasht Hydro Power Project is
located on Chitral River. Chitral River is the main river
downstream of Chitral city that passes through Chitral
Valley. It flows from north to south and enters Afghanistan
near Arandu Town. The dam site is proposed about 35 km
downstream of Chitral Town. The project layout is proposed
on the right bank of Chitral River. Powerhouse site is located
about 8 km downstream of Drosh Town near Swir Lasht
Village. The national grid at Chakdara is at a distance of
about 170 km from the powerhouse site.
Location Map has been placed at Figure-2.1.
3. AUTHORITIES
RESPONSIBLE
i) Sponsoring Government of Khyber Pakhtunkhwa, Province, through
Energy and Power Department, Government of Khyber
Pakhtunkhwa.
ii) Execution Pakhtunkhwa Energy Development Organization (PEDO),
Energy and Power Department, Government of Khyber
Pakhtunkhwa.
iii) Operation & Maintenance Pakhtunkhwa Energy Development Organization (PEDO),
Energy and Power Department Government of Khyber

7/24/2019 02-FINAL PC-I JULY,2014.pdf
http://slidepdf.com/reader/full/02-final-pc-i-july2014pdf 4/141
country.
ii)The prime objective of the implementation of this project is
to develop the power potential available in Khyber
Pakhtunkhwa, on sustainable basis and thus provide
cheaper, renewable, environment friendly and most needed
power, keeping in mind the present and future requirements
of Pakistan, especially rural and remote areas of Khyber
Pakhtunkhwa,.
iii)In order to meet the challenges of the project construction,
operation and maintenance in professional manner, the
hydel projects can be developed by the;
a) Public Sector
b) Public Private Partnership
c) Private Sector
The energy generated by this project shall be sold to CentralPower Purchasing Agency (CPPA)
Installed capacity of the plant has been assumed as 377 MW.
6. DESCRIPTION,
JUSTIFICATION,
TECHNICAL
PARAMETERS AND
TECHNOLOGY
TRANSFER ASPECTS
i) Justification The role of the proposed project is to increase the installed
capacity of PEDO by adding 377 MW with cheaper and
renewable annual energy generation of about 1579 GWh,
which shall be sold to Central Power Purchasing Agencythrough Chitral valley Grid station The proposed project
would have the following overall positive impacts;
The project will be helpful to fill some of the gap between
present energy supply and demand.
7/24/2019 02-FINAL PC-I JULY,2014.pdf
http://slidepdf.com/reader/full/02-final-pc-i-july2014pdf 5/141
gases.
Saving of firewood, hence increase in tree and reduction in
soil erosion.
By implementing the Project, the Govt. of Khyber
Pakhtunkhwa can develop industrial set-up at a faster rate.
Project is expected to create new full-time employment
opportunities during construction as well as during
operational phase.
The Project would create additional economic benefits forthe country and local community from recreational activities
likefishing, water sports, boating, camping, riding, hiking,
hunting and winter sports.
ii) Description and
Technical Parameters
A. General
The proposed Gahrait Swir Lasht Hydropower Project has its
dam site located on Chitral river about 35 km downstream ofChitral city and about 150 m downstream of Kesu nullah
which is a left tributary of Chitral river. It joins with Chitral
River about 6 km upstream of Drosh Town. The powerhouse
site is proposed on the right bank of Chitral River about 4.5
km downstream of Drosh Town. Headrace tunnel 10,268 m
long will cross 2620 m high ridge in the middle and shall lead
to the surge shaft and then to the powerhouse. In the middleof its length, the tunnel will cross a high ridge with an
overburden of about 1300 m. A few deep non-perennial
nullahs cross the head race tunnel alignment.
Chitral district lies in the northwestern part of the northern
Pakistan on the southern edge of the Eurasian Plate. It is
connected to Peshawar, the capital of Khyber Pakhtunkhwa
(KP) province by road and plane service. The plane service is
frequently suspended due to bad weather and the road from
Peshawar to Chitral town remains closed for several months
in winter due to snowfall on the 3,200 meter high Lowari Pass
over the top of which the road passes. To cross the high

7/24/2019 02-FINAL PC-I JULY,2014.pdf
http://slidepdf.com/reader/full/02-final-pc-i-july2014pdf 6/141
excavation are based on the current status of field
investigations and laboratory works. To confirm and
supplement this data, further investigations are needed to be
carried out at detailed design stage of the project.
Dam site is accessible from Chitral to Drosh by a 38 Km long
metalled road. An unpaved jeepable track, about 1 Km long
leads to the left abutment of dam site. Powerhouse site is
approachable from the right bank Katcha track from Gahrait
to Swir Lasht through Drosh.
Relief of Chitral area is extreme and rough, forming up to
several thousand meters high ridges at places. Steep gorges
are found where major rivers and their tributaries incise the
lithologies. Overall, slopes are steep and show rock fall-
scree, mass movements and slumped structures at many
places. Quaternary deposits are found in the form of alluvialsand, gravel and boulders in the stream beds; scree, talus,
and landslides debris on the slopes. Alluvial fans and
terraces are the common points of the human settlement and
cultivation.
The drainage system of the area is well developed and
structurally controlled. The streams are widest in the areaswhere they cut soft lithologies such as shales, phylites and
slates but become narrower when pass though limestone,
marble and igneous formations.
Valley slopes are steep and show rock falls, scree and
slumped structures at many places. Quaternary deposits are
found in the form of alluvial sand, gravel and boulders in the
river bed, scree and land slide debris on the slopes. River
terraces are developed along the river with flat and gently
sloping surfaces and are being used for agriculture /
cultivation.

7/24/2019 02-FINAL PC-I JULY,2014.pdf
http://slidepdf.com/reader/full/02-final-pc-i-july2014pdf 7/141
distance from MKT
The powerhouse location and tunnel route apparently lookedfavourable whereas examination of dam site indicated some
anomalies in geology, which required relocation of the dam
site.
With this consideration, a few more spots along the river in
the upstream and downstream were visited and a dam site
about 3 km downstream of GTZ site, 150 m downstream ofKesu nullah was selected for feasibility studies. The dam site
is now called Kesu Dam site Gahrait Swir Lasht Hydropower
Project.
The Project site was investigated through various means,
upto the level of Feasibility Stage. The main investigations
included surface geological mapping. exploratory drilling,
Seismic Refraction Surveys, excavation of shafts inoverburden at the dam site and tailrace channel and
collection of discontinuity data at various engineering
structures, headrace and diversion tunnels and powerhouse
area. Test pits were excavated in the reservoir and
powerhouse tailrace areas and Chitral river to collect sandy
gravel samples for testing as concrete aggregates..
Discontinuity Survey was carried out at the dam site, intake
structure area, along the headrace and diversion tunnels and
powerhouse areas wherever access was possible and joints
were exposed. In most of the gently sloping areas, both
abutments are covered by scree, talus, debris of alluvium and
colluvial material and vegetation. In such areas and in zones
of weathered and fine material, the discontinuity planes aremissing. Similarly under the cliffs, where approach was
difficult and dangerous no discontinuity survey was carried
out. The following types of discontinuities were observed in
the field.
7/24/2019 02-FINAL PC-I JULY,2014.pdf
http://slidepdf.com/reader/full/02-final-pc-i-july2014pdf 8/141
1994.
The geological mapping was carried out at a scale of 1:500using recently produced topographic maps produced for the
feasibility study. Most of the reservoir area is covered with
alluvium and river banks with scree / talus material. These
deposits will be submerged and gradually silt up minimizing
the seepages through the river bed and abutment rocks. In
the reservoir area river passes through different rocks of
meta-sediments i.e. Kesu-Kaghozi granites, Reshun marbles,Kaghozi green schists, Chitral slates and Gahrait lime stones.
These rocks are exposed on the right bank above reservoir
level except for about 200 m upstream of diversion tunnels
where these rocks are exposed at lower level within the
reservoir boundary. The outcrops of these formations have
been dissected by the tributaries of various nullahs.
Regionally, the outcrops of the hard resistant rocks
(granodiorites, slates, limestone) make ridges while black
schists, phyllites have been eroded to leave depressions or
hollows.
There are several instruments and monitoring devices which
are installed during tunneling or in post tunneling period,
wherefrom a lot of information about the stresses and their
build up or converging of roof, floor or walls is obtained.Knowing deformation in the rock mass, it is possible to adopt
the type and dimensions as well as the timings of proper rock
support required to the actual ground conditions encountered
during the excavation process. Some of the instruments
which are generally used for tunnel monitoring.
Seven (7) test pits in the Chitral river (Reservoir area) and 2test pits in the tailrace area of powerhouse and 2 in the river
bed were excavated and samples (one composite sample
from each pit) was collected for onward delivery to CMTL
Laboratory, Lahore for testing. Samples were tested to
assess suitibility of the materials as construction material

7/24/2019 02-FINAL PC-I JULY,2014.pdf
http://slidepdf.com/reader/full/02-final-pc-i-july2014pdf 9/141
main dam consist of granodiorite / quartz diorite. These rocks
are massive and moderately jointed and dip at 75° to 80°
towards right abutment with strikes slightly oblique to the riverin the upstream dirction and form steep slopes of the river
valley. The rock mass is subjected to open joints, parallel and
perpendicular to the valley slope. These open joints are
source of high permeability (Lugeon values range from 20 to
45). The upper 5 m to 7 m zone is generally weathered. The
higher Lugeon values are not specific to any particular zone
but are generally scattered at different depths.
Bedrock was not encountered in the borehole in river valley
drilled upto 30 m depth. However geophysical surveys
indicated rock at 40 m depth. The material is heterogeneous
throughout and contains sandy gravel with boulders. A layer
of fine and loose sand exists from about 8 to 12 m depth and
another layer at 21 m depth. The permeability K-values are
1.1 x 10⁻² cm/sec to 3.5 x 10⁻² cm/sec. The sand layer at
shallow depth of 8 to 12 m is prone to liquefaction in
earthquake condition.
The abutments as well as river valley foundation material
requires treatment to minimize under seepage and improve
the foundation.
Under Seepage Control through River Bed Alluvium
To cut down under-seepage through the river alluvium,
plastic concrete diaphragm wallwill be provided. Plastic
concrete diaphragm wall will also be provided in the buried
valley area to cutoff seepage of reservoir water through the
buried valley.
Curtain Grouting in Rock
Grout curtains will be provided on both abutments. The
curtains on both abutments will be 25 to 30 m deep. The
7/24/2019 02-FINAL PC-I JULY,2014.pdf
http://slidepdf.com/reader/full/02-final-pc-i-july2014pdf 10/141
Low pressure grouting from 1 to 5 bars and 3 m to 5 m deep
stages are recommended. For grouting, upstage or
downstage method can be used, even though down stagemethod is preferable.
Grout curtain would be vertical or slightly inclined towards
downstream to cross as many beds as possible. For curtain
grouting on the abutments, initial hole spacing can also be 3
m all along the curtain alignment. The spacing can be
reduced by placing secondary and tertiary holes if required.
Treatment of Structures Foundations
The concrete structures that will be founded on excavated
rock foundations include intake structure of power system
and inlet and outlet of tunnel spillway / diversion tunnels. The
treatment of foundations of these structures will include
dental concrete and consolidation grouting as described inthe following.
Dental Concrete
Careful blasting is required so as not to disturb the foundation
rock beyond 0.5 m or so. After removing loose and
weathered zone, crevices, joints, pockets between the bedsand open cracks will be cleaned with the help of crow bars
and broomed. All cracks and joints shall be properly filled
preferably with slush grout and mortar. The surface
undulations shall be covered and filled with a layer of blinding
concrete using pea gravels as coarse aggregate.
Consolidation Grouting
Consolidation grouting will help in reducing leakage through
fractured zones and to provide a firm foundation for the
structure. Consolidation grouting will be required on both
abutments. The grouting will extend to about 5 m depth below
th f d ti l l

7/24/2019 02-FINAL PC-I JULY,2014.pdf
http://slidepdf.com/reader/full/02-final-pc-i-july2014pdf 11/141
Support Systems for Underground Works
Rock supports have been designed to improve the stability of
underground openings according to the ground conditions
likely to be encountered. This requires flexible support
methods which can be quickly adjusted to meet the
continuously changing quality of rock masses.
The Consultants have adopted RMR system for rock
classification of tunnels and GSI system for large chambers
and cut slopes.
Support System for Tunnels (RMR System)
a) Percentage of different Rock Classes
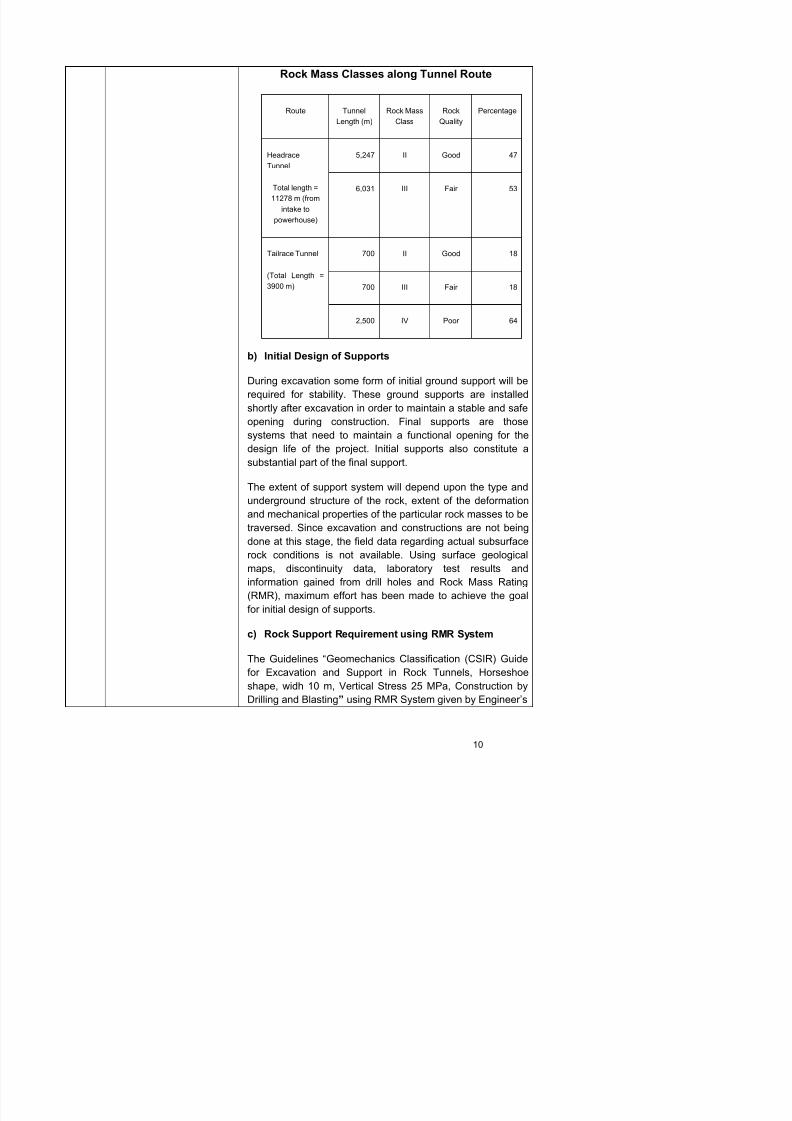
Summary of rock mass classes and rock quality of different
rocks likely to be encountered along the tunnels and
powerhouse is given in following Table.
Support System for Underground Works
Underground Works
The following main underground works are required for construction of the Project:
1. Intake Connecting Tunnels (D-shaped) 4 Nos. 12x9 m, length varies 288 to 318 m
2. Diversion & Spillway Tunnels (D-shaped) 4 Nos. 7.6x7.6 m, length varies 189 to 316 m
3. Sand Trap (V-arched shape) 4 Nos. 14.3x20.3 m Av. Length 525 m
4. Headrace Connecting Tunnel (circular) 4 Nos. 6.75 m, Av. Length 188 m
5. Headrace Tunnel (circular) 2 Nos. 9.5 m, Av. Length 10214 m
6. Surge Shaft (Circular, Vertical) 2 Nos. 10 m Ø &71 m high
7. Pressure Shaft (Circular, Horizontal) 2 Nos. 6.5 m Ø, Av. Length 92.2 m long
8. Tailrace Tunnel (D-Shaped) 4 Nos. 7x6.5 m, Av. Length 3980 m long
9. Powerhouse Chamber 113 m x 24 m x 35 m (L x W x H)
7/24/2019 02-FINAL PC-I JULY,2014.pdf
http://slidepdf.com/reader/full/02-final-pc-i-july2014pdf 12/141
Rock Mass Classes along Tunnel Route
Route Tunnel
Length (m)
Rock Mass
Class
Rock
Quality
Percentage
Headrace
Tunnel
Total length =
11278 m (fromintake to
powerhouse)
5,247 II Good 47
6,031 III Fair 53
Tailrace Tunnel
(Total Length =
3900 m)
700 II Good 18
700 III Fair 18
2,500 IV Poor 64
b) Initial Design of Supports
During excavation some form of initial ground support will be
required for stability. These ground supports are installedshortly after excavation in order to maintain a stable and safe
opening during construction. Final supports are those
systems that need to maintain a functional opening for the
design life of the project. Initial supports also constitute a
substantial part of the final support.
The extent of support system will depend upon the type andunderground structure of the rock, extent of the deformation
and mechanical properties of the particular rock masses to be
traversed. Since excavation and constructions are not being
done at this stage, the field data regarding actual subsurface
rock conditions is not available Using surface geological
7/24/2019 02-FINAL PC-I JULY,2014.pdf
http://slidepdf.com/reader/full/02-final-pc-i-july2014pdf 13/141
Manual EM 1110-2-2901, 30 May 1997, US Department of
the Army Corps of Engineersare used for the project tunnels.
During actual excavations some modifications in the design
of supports will be required depending upon the exposed rock
conditions, especially in unexpected cases of heavy bursting
or popping, tensioned systematic bolts with enlarged bearing
plates may be used and spot bolting may also be needed.
During Detail Design Studies, design of rock bolts, anchors,
steel ribs and shotcrete analysis will be revised and anychanges in the design based on further field and laboratory
information, will be incorporated.
Support System for Powerhouse
To provide a feasibility level design of the powerhouse
complex caverns following studies were carried out.
Estimation of Geology and Structural features in the
areas of the underground structures.
Established rock mass properties for the rock masses
using Hoek‟s GSI classifications.
Assessed prevailing in-situ stresses in the areas of the
major underground excavations using 2D finite
element analysis.
Determined optimum orientations of the powerhouse
complex caverns with regards to structural geology.
Established feasibility design rock support measures
by carrying out 2-dimensional finite element analysesof the powerhouse complex for estimating
deformations.
The analysis is based on:

7/24/2019 02-FINAL PC-I JULY,2014.pdf
http://slidepdf.com/reader/full/02-final-pc-i-july2014pdf 14/141
complement the empirical approaches in assessing support
requirements for the powerhouse cavern. This interpretation
must be confirmed by further exploration work during thedetailed design phase of the project.
Estimation of Rock Mass Strength Parameters
The rock mass shear strength was estimated using the Hoek
and Brown failure criterion (Hoek et al., 1995, revised 2002).
Use of the Hoek-Brown criterion requires the estimation of
three parameters that describe the rock mass and its strength
characteristics: GSI (Geological Strength Index), σc
(compressive strength of intact rock material) and mi (a
constant based on the rock type). RocScienceRocLab 1.0
software was used to establish shear strength and
deformability parameters of the rock mass.
Parameters of Hoek and Brown Failure Criterion wereestimated for each GSI rock class with RocScienceRocLab
software. The following parameters were used for the quartz
diorite for evaluating the “mb”, “s” and “a” parameters.
Unconfined compressive strength (σc): 70 MPa
mi: 29
Intact rock modulus of elasticity: 29,750 MPa
Using the RockLab 1.0 the other parameters “mb”, “s” and “a”
were determined for use in the finite element model.
A 2 meter thick zone of disturbed rock mass was wrapped
around the caverns periphery. It is assumed that this zonewould be the result of blasting damage during cavern
excavation. A disturbance factor D is taken as 0.5 and
accordingly the revised Hoek and Brown strength parameters
were evaluated for this zone. Other intact rock properties
were same as given above

7/24/2019 02-FINAL PC-I JULY,2014.pdf
http://slidepdf.com/reader/full/02-final-pc-i-july2014pdf 15/141
the unit weight of the rock mass and the depth below surface
and measured in situ stresses are usually in reasonable
agreement with this assumption (Hoek, 2003). For finiteelement analyses, it was assumed that the maximum
horizontal principal stress is equal to the vertical stress.
It is generally believed that the earthquakes have minimal
impact on the underground structures. Therefore the seismic
loading in the present studies have not be taken into account.
Geotechnical Design Aspects of Power Station Complex
Horizontal as well as vertical locations of various powerhouse
complex caverns have been primarily fixed on the functional
requirements including minimization of penstock and draft
tube lengths, and avoiding crossing of major faults.
Geological conditions as revealed through investigations in
the area have been established and also taken into account.
Cavern Excavation Geometry
In view of the low strength of the rock mass, special concerns
are raised regarding excavation profile. Depending on the
existing in situ stresses, it is possible that significant
concentrations of stresses could develop close to the
perimeter of the caverns.
It is recommended to avoid any recesses, niches, or unusual
excavation profiles to accommodate electro-mechanical
equipment and cavern infrastructure (such as intake valve
recesses, stairwells, elevator shafts, etc.). In addition to
improving ease of construction, this will mitigate problems
associated with stress concentrations and the need forextraordinary support measures. For economy, it is
suggested to leave rock pillars between the draft tubes below
the runners (turbine pits).
R k S t R i t
7/24/2019 02-FINAL PC-I JULY,2014.pdf
http://slidepdf.com/reader/full/02-final-pc-i-july2014pdf 16/141
range of possible conditions and to provide a basis for
determining the overall behaviour of the rock mass, although
deficiencies can be recognized in such empirical methods.Rock mass classification methods are useful during the
earlier phases of a design and provide a way of obtaining a
first approximation of the level of support necessary for a
large cavern. They also provide means to compare
quantitatively different cavern layouts or tunnel alignments
when only limited rock mass data were available. They also
supply means for communication and for developingconstruction cost parameters, either for comparative
purposes or for preparation of a construction cost budget.
Numerical methods were used to analyze stress distributions
around the excavations. The results were used to
complement the empirical approaches in assessing support
requirements.
Empirical Selection of Rock Anchor Lengths
USACE and Barton guidelines for the selection of rock
anchor lengths for large caverns were used.
USACE and Barton (1989) relationships compute similar rock
anchor lengths. These show that anchor lengths should be5.9 m to 6.5 m in the crown of a 26 m wide cavern. Wall
anchors should be 5.5 m to 5.8 m long in 25 m high caverns
and 11 to 12 m long in 60 m high caverns. The bolts or
cables should extend 2 or 3 m beyond the limit of the zone of
overstressed material and may need to be longer than shown
above in overstressed zones.
Experience shows that blast damage may extend 1.5 to 3 m
into the rock adjacent to the roof depending upon how much
care has been taken to control the blasting. Assuming that 3
m of rock have been damaged by either stress induced or
blast induced fracturing; a dead weight of broken rock of up
7/24/2019 02-FINAL PC-I JULY,2014.pdf
http://slidepdf.com/reader/full/02-final-pc-i-july2014pdf 17/141
walls.
Preliminary Rock Support Design for PowerhouseCaverns
Preliminary rock support designs for the powerhouse caverns
are based on the following:
Anchor lengths should be equal to or greater than the
empirical values presented in table above. It should
be noted that the presence of crown wedges may
necessitate the used of crown anchors that are longer
than the computed 6.0 m. Additionally all, anchors
should penetrate through stress or blast damaged rock
in the walls and crowns of the caverns. Longer
anchors may be needed locally or in large areas to
properly support sliding or falling structural wedges.
Fully grouted, tensioned rock anchors should be used.
Generally 32 to 40 mm diameter steel bars should be
used in the large caverns. Smaller bars should be
used only in the smaller tunnels, away from the
stressed ground of the powerhouse complex.
A 50 cm layer of fibre or mesh reinforced shotcreteshould be applied to the walls and crown of the
powerhouse caverns. This element of the support
system is essential to ensure the integrity of the rock
mass near the excavation surface and prevent sliding
and fall-out of rock blocks and fragments between the
rock anchors. It is, however, normal practice to neglect
this support when computing overall support pressures
in tall caverns with a relatively flat crown arch because:
o There is little or no arching effect in the large
radius crown area and none in the flat walls.

7/24/2019 02-FINAL PC-I JULY,2014.pdf
http://slidepdf.com/reader/full/02-final-pc-i-july2014pdf 18/141
crown.
Numerical Analysis Procedure
The hybrid finite element program, PHASE2 (RocScience
Inc.) was used to perform preliminary analyses of stresses
around a typical section of powerhouse complex for the
GahraitSwirLasht Hydropower Project, which would involve
powerhouse and transformer cavern, and a downstream
collection / surge chamber. This is a finite element program
for calculating stresses and estimating support around
underground excavations. Input values for the physical and
mechanical properties of the rock mass were as presented
earlier.
Several cases were examined, along with constructionstaging. Each stage consisted of: excavate, install support,
and equilibrate. The stability analysis was done on the
material to perform isotropic elastic behaviour. The
discontinuities are not considered as the modal deal with the
Recommended Rock Support for the Powerhouse Caverns
SupportPowerhouse
CavernTransformer
CavernSurge Chamber
Cavern
40 mmanchors incrown
6m long
@ 1.0 m x 1.0 mcc spacing
6m long
@ 1.0 m x 1.0 mcc spacing
6m long
@ 1.0 m x 1.0m cc spacing
32 mmanchors inwalls
15 m long
@ 1.0 m x 1.0 mcc spacing
10 m long
@1.0 m x 1.0 mcc spacing
15 m long
@ 1.0 m x 1.0m cc spacing
Reinforcedshotcrete incrown andwalls
30 cm 30 cm 30 cm

7/24/2019 02-FINAL PC-I JULY,2014.pdf
http://slidepdf.com/reader/full/02-final-pc-i-july2014pdf 19/141
following excavations:
Powerhouse cavern 50 m high, 24-m span Transformer cavern: 29 m high, 25 m span
Downstream surge/collection chamber: 20 m high, 6.5 m span
Separation (clear distance) between caverns: 40 m
The complex is situated in a quartz diorite rock mass of
varying properties. Ubiquitous joints, shear, or faults were
not included in the model during this phase. The caverncrown is at about 500 m beneath the ground surface.
Material Properties used in Model
The material properties used in this analysis are as listed
earlier in this chapter. Only the Hoek-Brown rock failure
criterion was used in the FEM analysis. Intact rock modulus
value of 29,750 MPa was used in the PHASE2 analysis.
The following in-situ stresses were used for the cavern
analyses.
Vertical stress is the gravitational resulting from the
overlying rock cover.
In plane horizontal stresses (Kh): The base case
results presented herein are based on a k factor of 1.0
times the vertical stress.
Out of plane horizontal stresses (Kh): The out of plane
horizontal stresses were assumed to be equal to the
vertical stress for the base case analyses presented
herein. .
Results of the stress analyses are examined using PHASE2
in terms of major and minor stresses, stress trajectories,
strength factors (ratio of rock strength vs. computed stresses)
7/24/2019 02-FINAL PC-I JULY,2014.pdf
http://slidepdf.com/reader/full/02-final-pc-i-july2014pdf 20/141
Rock mass yielding occurs around the perimeter of the
caverns, within the blast damaged zone. There also
yielding in distressed zones at depths of 4 to 10 m intothe sidewalls of the caverns. Yielding occurs in the
floor and crown of the caverns also. The design rock
anchors penetrate the full depths of all areas showing
rock mass yielding.
The addition of rock support reduces the numbers of
yielded points and also improves the strength factor inthe rock mass adjacent to the caverns.
Maximum displacement for the main cavern is 2.5 cm
at crown considering excavation in different phases
and reach upto 13 cm for side walls. Rock support at
side walls are therefore considered of greater lengths
i.e. full length rock bolts of 10-15m long.
Design of Cut Slopes
Open cut excavated slopes are required for various
components of the Project. The important cut slopes include
those for power intake and outlet portals. Feasibility level
design of the above cut slopes, has been carried out and
presented in the following. Geological and geotechnical datacollected during the feasibility studies as discussed in the
preceding sections has been used for evaluation and
analyses of the required cut slopes. The data included:
Topographic maps
Surface geological maps
Discontinuity data
Drill hole data

7/24/2019 02-FINAL PC-I JULY,2014.pdf
http://slidepdf.com/reader/full/02-final-pc-i-july2014pdf 21/141
Recommended Rock Mass Parameters for Intake and Outlet Portals
Rock Type Quartz Diorite
Hoek-Brown
Classification
Intact uniaxial comp.
strength (MPa)
70
GSI 45
mi 29
Disturbance factor (D) 0.5
Intact modulus, Ei (MPa) 29,750
Hoek- Brown
Criteria
m b 2.113
S 0.0007
A 0.508
Mohr
Coulomb
Parameters
Cohesion (MPa) 1.986
Friction angle, (deg.) 40
Rock Mass
Parameters
Tensile strength (MPa) 0
Uniaxial comp. strength
(MPa)
1.686
Global strength (MPa) 13.225
Deformation modulus,Em (MPa)
3,150
Stability Analysis of Cut Slopes at Power Intake Portals
Failures of single berm faces are the most important cause of
instability in large excavations. The usual berm height is 20 m
and berm faces are inclined at 76 degrees.In this case failure
may partly occur through intact rock. For example a failure
surface can run along a deep seated single or composite
discontinuity behind the slope and break through the rock
mass at the toe of the slope. Therefore cohesion of 300 KPa
is also taken into account along with phi equal to 40 degrees
7/24/2019 02-FINAL PC-I JULY,2014.pdf
http://slidepdf.com/reader/full/02-final-pc-i-july2014pdf 22/141
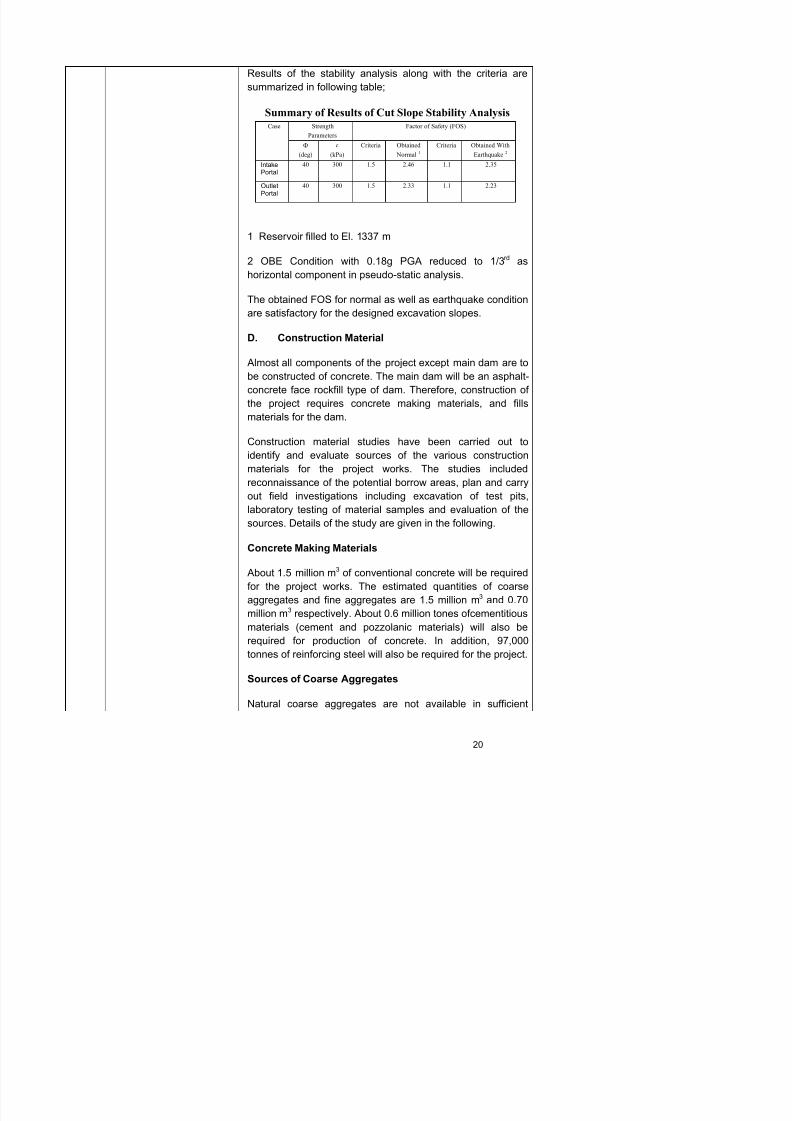
Results of the stability analysis along with the criteria are
summarized in following table;
Summary of Results of Cut Slope Stability AnalysisCase Strength
Parameters
Factor of Safety (FOS)
Ф
(deg)
c
(kPa)
Criteria Obtained
Normal 1
Criteria Obtained With
Earthquake 2
IntakePortal
40 300 1.5 2.46 1.1 2.35
OutletPortal
40 300 1.5 2.33 1.1 2.23
1 Reservoir filled to El. 1337 m
2 OBE Condition with 0.18g PGA reduced to 1/3rd as
horizontal component in pseudo-static analysis.
The obtained FOS for normal as well as earthquake conditionare satisfactory for the designed excavation slopes.
D. Construction Material
Almost all components of the project except main dam are to
be constructed of concrete. The main dam will be an asphalt-
concrete face rockfill type of dam. Therefore, construction ofthe project requires concrete making materials, and fills
materials for the dam.
Construction material studies have been carried out to
identify and evaluate sources of the various construction
materials for the project works. The studies included
reconnaissance of the potential borrow areas, plan and carry
out field investigations including excavation of test pits,laboratory testing of material samples and evaluation of the
sources. Details of the study are given in the following.
Concrete Making Materials

7/24/2019 02-FINAL PC-I JULY,2014.pdf
http://slidepdf.com/reader/full/02-final-pc-i-july2014pdf 23/141
quantities around the proposed dam site. Coarse aggregates
would therefore have to be manufactured for which following
sources have been identified and evaluated for theirsuitability in concrete construction:
1. River alluvium (Reservoir area and powerhouse
tailrace area)
2. Material available from required excavations
River Alluvium
Boulders and gravels of hard limestone quartzite, slates,
dolomite, granite, granodiorite form the major part of
sediments of Chitral river and are available in abundance. For
evaluation of the alluvial deposits, test pits were excavated in
the potential borrow areas in the proposed reservoir area and
the tailrace area.
Excavation of test pits has shown that the Chitral river
alluvium is composed of gravels and pebbles with some
boulders and small proportion of sand. The natural gravels
will have to be crushed to produce coarse concrete
aggregate.The gravels are generally hard, sound, durable
and resistant to abrasive forces.
Petrographic Analysis shows thatmaterial from river has
some contents of deleterious material and can be used as
concrete aggregate with some addition of slag.
Material Available from Required Excavations
The major rock formation at the dam site is massive quartzdiorite / granodiorite which are considered to be suitable for
use as concrete aggregate. Excavation for diversion and
power intake and tunnels will produce a large quantity of rock
material. Selected material from the required excavations can
be crushed to produce coarse concrete aggregate
7/24/2019 02-FINAL PC-I JULY,2014.pdf
http://slidepdf.com/reader/full/02-final-pc-i-july2014pdf 24/141
Natural Sand
Reconnaissance of the project site and the area around hasbeen carried out to explore suitable sources of fine
aggregates in close vicinity of the project area. It has been
found that sand from Chitral river is being used for
construction of Lowari Tunnel and the borrow area is located
close to the Gahrait-SwirLasht hydropower project site. Sand
from the same area is proposed to be borrowed for the
project. Slag cement will have to be used.
Manufactured Sand
The rocks at the site are moderately strong and generally
suitable for manufacturing of crushed sand. However it will be
difficult to crush the hard rock in locally available crushers
and heavy duty imported crushers would be required.
Cement
The cement factories nearest to the project are located close
to Haripur and around Islamabad and the factories have
sufficient capacity to fulfil the project needs.
Pozzolanic Materials
The origin of the gravel boulder material is sedimentary,
igneous and metamorphic. Petrographic analysis has shown
presence of deleterious material with potential of ASR.
Therefore either replacement of part of the Ordinary Portland
Cement will be done with a pozzolanic material or low alkali
cement will be used.
Water
Water from Chitralriver will be used for the project works,
which is available throughout the year. The water is potable.
However it contains sediments including some collidle
7/24/2019 02-FINAL PC-I JULY,2014.pdf
http://slidepdf.com/reader/full/02-final-pc-i-july2014pdf 25/141
Steel sheets of various thicknesses are produced by the
Steel Mills at Karachi, which can be used to fabricate steel
formwork. These can also be used for fabricating steel linersand other miscellaneous items. Steel items can also be
imported, most likely from neighbouring countries.
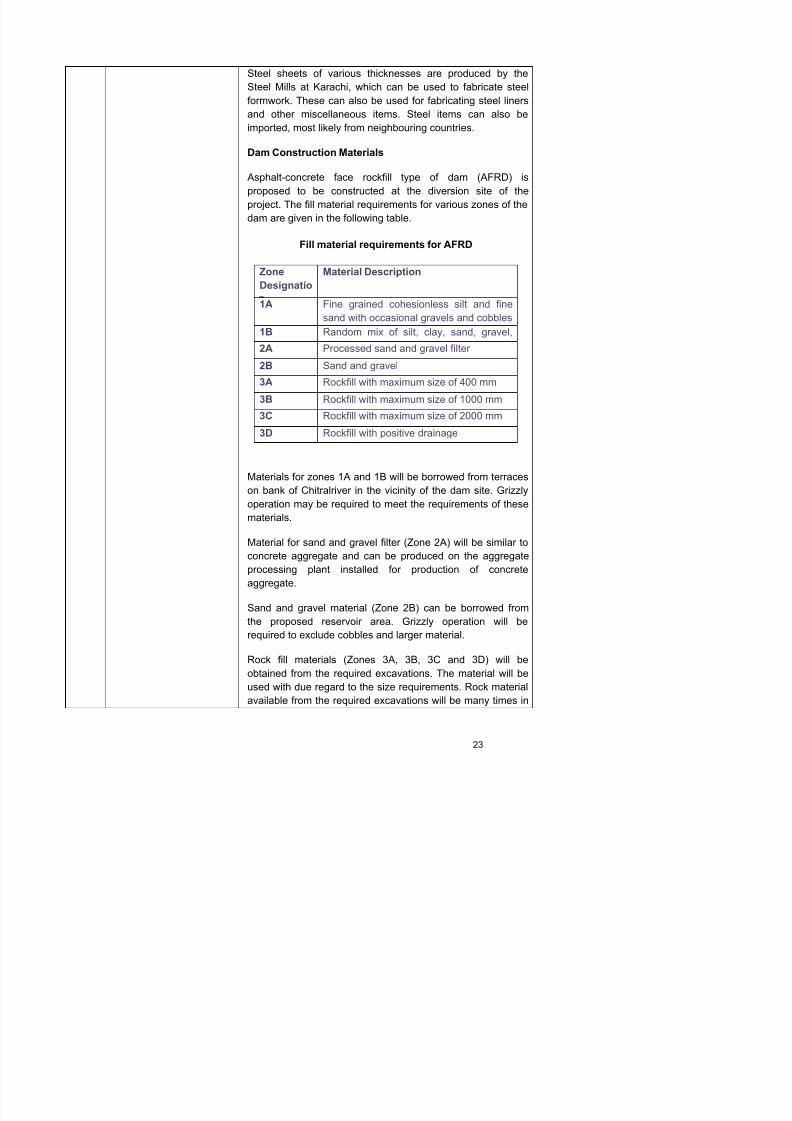
Dam Construction Materials
Asphalt-concrete face rockfill type of dam (AFRD) is
proposed to be constructed at the diversion site of the
project. The fill material requirements for various zones of the
dam are given in the following table.
Fill material requirements for AFRD
Zone
Designatio
Material Description
1A Fine grained cohesionless silt and fine
sand with occasional gravels and cobbles
1B Random mix of silt, clay, sand, gravel,
2A Processed sand and gravel filter
2B Sand and gravel
3A Rockfill with maximum size of 400 mm
3B Rockfill with maximum size of 1000 mm
3C Rockfill with maximum size of 2000 mm
3D Rockfill with positive drainage
Materials for zones 1A and 1B will be borrowed from terraces
on bank of Chitralriver in the vicinity of the dam site. Grizzlyoperation may be required to meet the requirements of these
materials.
Material for sand and gravel filter (Zone 2A) will be similar to
concrete aggregate and can be produced on the aggregate

7/24/2019 02-FINAL PC-I JULY,2014.pdf
http://slidepdf.com/reader/full/02-final-pc-i-july2014pdf 26/141
E. Hydrology & Sedimentation
The proposed Gahrait Swir Lasht Hydropower Project has its
dam site located on Chitral River about 35 km downstream of
Chitral District Headquarters near Gahrait village. The
powerhouse site is about 8 km downstream of Drosh Town
near Swir-Lasht Village.
Chitral River rises in the far north of Chitral District in
Pakistan. Chitral River, before flowing south into the upper
Kunar Valley in Afghanistan, where it is referred to as the
Kunar River.
The available Hydro-meteorological data such as daily and
rainfall, relative humidity, precipitation, temperatures,
sunshine, discharge and sediment data etc. has been
collected and used for determining power potential, maximum
floods and flow duration curve.
To study the climatology of the proposed Gahrait Swir Lasht
Hydropower Project, analysis have been carried out for
several climatological stations in the Chitral valley. Efforts
have been made to assess the most representative values for
the climatological parameters of the project area.
The drainage area of the dam site on the Chitral River is
approximately 13,419 km2. The mean elevation of the
catchment area is 4,282 m.a.s.l. Most of the watershedremains covered with snow and glaciers in winter season.
The flow in the river is mainly due to glacier and snow
melting.
2
excess of that required for the dam construction. Therefore,
only selected material comprising hard rock will be placed in
the dam fill.

7/24/2019 02-FINAL PC-I JULY,2014.pdf
http://slidepdf.com/reader/full/02-final-pc-i-july2014pdf 27/141
site, average 10-day; average monthly and annual flows at
the dam site and flow duration curves.
For generation of the flow data, main emphasis has been
placed on the flow data of Chitral gauging station which is
available from 1964 to 2010 (47 years). It has been
considered that this length of the data record can be
confidently applied to any flow analysis based on probabilistic
theories for the dam site.
Chitral stream gauging station is situated about 62 kmupstream of the powerhouse site. The watershed areas of
Chitral stream gauging station and Swir-Lasht Powerhouse
site are 11,396 and 14,331 km2, respectively 25.75 %. The
linear relationships can be used for the extrapolation of the
flow data from Chitral gauging station to the powerhouse site.
The daily flows were transformed from Chitral gauging station
to the powerhouse site by adopting appropriate multiplicationfactor as 1.26 (14331/11396).
Flood Studies
For the design of spillway structure and temporary diversion
facilities during construction of Gahrait Swir Lasht
Hydropower Project, estimation of various flood discharges isrequired. For this study, the maximum instantaneous peak
discharge data of Chitral stream gauging station was used.
Using GTZ Regional Analysis Approach, regional flood
equations were used to estimate the flood magnitudes
corresponding to 5, 10, 100, 1000 and 10000 return periods
as a function of their respective watershed areas.
Flood Frequency Analysis by Statistical Approach was
carried out using the instantaneous flood peak data of Chitral
gauging station, which was available for 47 years (1964-
2010) except 1968 where peak discharge value was not

7/24/2019 02-FINAL PC-I JULY,2014.pdf
http://slidepdf.com/reader/full/02-final-pc-i-july2014pdf 28/141
The estimated floods were also compared with the floods
computed by GTZ regional approach at the proposed dam
and powerhouse sites. Log Pearson Type-III distribution hasbeen selected for calculating flood discharges at the dam and
powerhouse sites.
F. Sediment Studies
Sediment discharge data of seven sediment gauging stationswere collected from the SWHP, WAPDA and Pakhtunkhwa
Energy Development Organization (PEDO) which was used
for the estimation of sediment yield for the watershed using
regional analysis approach.
To carryout detailed sediment analysis of the watershed area,
data of Chitral sediment gauging stations was collected and
used. Sediment loads for the dam site are calculated by
transforming the data from Chitral gauging station to the dam
site and are verified with the observed sediment data for the
dam site at Khairabad Bridge by the present Consultants.
The Gahrait Swir Lasht reservoir area was modeled using
geometric and sediment data. SHARC model was developed
for one year to determine the data deposites in the reservoir.
G. Seismic Hazard
Gahrait Swir Lasht hydropower project site is located south of
Chitral city, in Chitral district of Khyber Pakhtunkhwa province
of Pakistan. It is located close to the collisional zone between
the Indian and the Eurasian tectonic plates. The region in
which the project is located has been subjected to
earthquakes in the past, therefore, a study of tectonic and
earthquake history of the region has been conducted to
th i i h d t hi h th d j t
7/24/2019 02-FINAL PC-I JULY,2014.pdf
http://slidepdf.com/reader/full/02-final-pc-i-july2014pdf 29/141
ICOLD guidelines (1989, Revised 2010) for selecting the
seismic design parameters.
The project site is located close to the contact between
Kohistan island arc and the Eurasian mass represented by
Shyok suture zone (MKT). The major faults of the Chitral area
include, from south to north, the Shishi Fault, Main
Karakoram Thrust, Reshun Fault and Tirich Mir Fault.
The available seismicity record for the region in which the
project is located can be classified into the following twotypes:
Historical Seismicity
Instrumental Seismicity
For seismic hazard evaluation the guidelines provided by
International Commission on Large Dam (ICOLD) forselecting seismic parameters for large dams (1989) have
been followed. A brief description of the methodology of the
approaches to be used for the seismic hazard analysis in
accordance with ICOLD guidelines.
Empirical correlations have been developed between
maximum potential of a fault and key fault parameters likerupture length, fault area, fault displacement and slip rate.
Out of these fault parameters, only fault lengths are known
with sufficient accuracy. For the faults near the site, the full
length rupture of the nearest segment of the fault have been
taken and for others half rupture length have been taken and
the maximum earthquake magnitudes (in moment magnitude
MW scale) of these segments were calculated using Wells &
Coppersmith (1994), Nowroozi (1987) and Slemmons et al.
(1982) relationships between fault rupture length and
magnitude potential which are given in Table 5.1 below. For
the deep Hindukush Seismic Zone the maximum magnitude
7/24/2019 02-FINAL PC-I JULY,2014.pdf
http://slidepdf.com/reader/full/02-final-pc-i-july2014pdf 30/141
(PGA) obtained at site associated with Maximum Credible
Earthquake (MCE) along Reshun Fault at the closest
distance from site is about 0.69g (which is equivalent to morethan 10,000 year return period ground motion in Probabilistic
Analysis). However designer can chose a lower Safety
Evaluation Earthquake (SEE) acceleration considering the
economical hazard involved as per ICOLD Guidelines
(Revised 2010) which recommends to adopt 3,000 year
return period ground motion for Moderate Risk Dam and
1,000 year return period ground motion for Low Risk Dam. As
the dam may be categorized as Moderate Risk Dam as per
risk class of the dam given in ICOLD Guidelines (1989),
therefore the recommended ground motion for SEE is 0.42g
(corresponding to a return period of 3,000 year).
As per ICOLD guidelines, the ground motion for the OBE for
the dam will usually have a return period of 145 year. The
recommended PGA for OBE is therefore 0.18g which has a
return period of 145 year. The purpose of the OBE design is
to protect against economic losses from damage or loss of
service for all project structures. The performance
requirement is that the project functions with little or no
damage or interruption under OBE conditions.
For the design of all other appurtenant structures of the
project including tunnel and power house structure, ICOLD
recommends to use ground motion having 475 year return
period which is termed DBE accelerations (Weiland, 2011).
The recommended ground motion for DBE is therefore 0.26g.
H. Project Layout
GTZ (2001) Previous layout & Design Studies
Gahrait Swir Lasht Hydro Power Project was first identified
7/24/2019 02-FINAL PC-I JULY,2014.pdf
http://slidepdf.com/reader/full/02-final-pc-i-july2014pdf 31/141
Selected Project Layout Studies
This Section identifies the most promising layout amongvarious alternatives for Gahrait-Swir Lasht Hydropower
Project. It contains review of previous studies, dam site
alternatives and preliminary design for comparing various
economic indicators of the alternatives. Five alternatives were
proposed for the layout studies.Three alternatives were
screened out based on initial assessment and two were
carried forward for detailed evaluation of economic,environmental and construction aspects and most suitable
alternative for the project was selected. The selected layout
was then studies for the optimization.
Scope of the Project Layout Studies
The scope of the project layout studies is summarised asfollows:
Review of previous layout alternative studies.
Evaluation of the alternatives proposed in the Inception
Report. Comparison of power potential for different
layouts, geological and socio-environmental conditionsand selection of promising alternatives for detailed
analysis and optimization.
Preliminary design of different components.
Preparation of cost estimates.
Selection of most promising site for dam, powerhouse and
their appurtenant structures based on environmental and
technical merit and economic indicators. Salient features/
project data of project layaout are enclosed.

7/24/2019 02-FINAL PC-I JULY,2014.pdf
http://slidepdf.com/reader/full/02-final-pc-i-july2014pdf 32/141
have further revealed existence of a sand layer at 6.0 to 12.5
m depth in the center of the river valley.
This geologic information along with availability of
construction materials, time of construction, cost etc have
been given due consideration in selection of type of dam on
Chitral river at Gahrait and the following dam types have
been considered.
Concrete Gravity Dam
Hardfill Dam
Earth Core Rockfill Dam (ECRD)
Asphalt-Concrete Core Rockfill Dam (ACRD)
Concrete Face Rockfill Dam (CFRD)
Asphalt-Concrete Face Rockfill Dam (AFRD)
Feasibility level design of the Asphalt Concrete Faced Rockfill
Dam (AFRD) has been carried out. Most design details are
developed based on precedent and on an understanding of
the foundation conditions and the construction materials to beused in the dam.
The dam has been proposed with both upstream and
downstream slopes of 1.8H:1V, which can be optimized at
the detailed design stage. The rockfill materials will be
obtained mostly from excavations in rock for the power and
diversion intakes and tunnels. A plastic concrete partial cutoff
has been proposed to control seepage through alluvial
foundations.
J Hydraulic Design Studies
7/24/2019 02-FINAL PC-I JULY,2014.pdf
http://slidepdf.com/reader/full/02-final-pc-i-july2014pdf 33/141
m upstream of the dam axis on right bank of Chitral river that
can pass design flood of 3538 m3/s at maximum flood level of
1341.00 m asl.These tunnels will also serve three additionalpurposes: as River Diversion tunnels (to pass flows through it
during the construction of main dam), as flushing tunnels (for
flushing of reservoir near the dam area) and for release of
environmental flows (15 m3/s) downstream of the dam..
Fish pass which consists of a channel leading from the
headwater to the tailwater by installing cross-walls to form a
succession of stepped pools.
Lateral power Intake structure on right bank of Chitral River
that comprises four intake structures to draw the design and
flushing discharge of 516 m3/s to desanders.
Two rectangular connecting tunnels of 7.00 m x 3.00 m size
to convey discharge from each intake to desanders.
Transitions of 20 m length, starting from the end of
connecting tunnels and ending at the start of desander
chamber.
Four underground desanders comprising pressurized
chambers starting from the end of each transition. Each
pressurized Sand trap Chamber is 525 m in length, 20.30 mhigh, arched shaped and concrete lined.
Eight flushing connecting tunnels (two for each desander)
starting from the end of desander chamber to main flushing
tunnel. The length of flushing connecting tunnel varies from
124 m to 183 m, invert level at upstream is 1308.90 m
asl.These tunnels are steel lined for erosion resistance.
Two main flushing tunnels starting from the end of connecting
tunnels to the outfall Structure. Each main flushing tunnel is
D-shaped (8.20 m x 6.15 m) with invert El.1308.90 m asl at
t

7/24/2019 02-FINAL PC-I JULY,2014.pdf
http://slidepdf.com/reader/full/02-final-pc-i-july2014pdf 34/141
length 10.308 km and 10.285 km (average.10,214 km),
upstream Invert level 1317.10 m asl, terminating at the Surge
Shaft at the downstream end before the powerhouse andpressure shaft.
Surge shaft, two numbers, one for each headrace tunnel,
height 79 m and diameter 10 m.
Two concrete lined pressure shafts of 6.50 m diameter
having average length of 92.20 m
Two steel lined penstocks with 6.50 m diameter and average
length of 78.00 m.
Underground power house with four Francis turbines.
Four D-shaped 9.00 m x 7.80 m (W x H) tailrace tunnels
having average length of 4,130 m carrying discharge from the
draft tubes to tailrace tunnels.
The main dam on Chitral River is an Asphalt-Concrete Face
Rockfill Dam (AFRD) with its crest level at elevation 1343.00
m asl i.e. 34 m above the riverbed level. The dam is founded
on river alluvium comprising gravels, cobbles with some
boulders and a sand layer. Due to the reason that spillway
cannot be accommodated on the rockfill dam and appropriate
space for spillway was not available on either abutment,
tunnel spillway comprising four tunnels has been provided at
the right bank of Chitral River. Construction sequence is
planned in a way that dam construction will be started after
construction of the spillway tunnels. These tunnels will also
be utilized to pass the diversion flood and the environmentalflows. The spillway tunnels have been designed to safely
pass 1000-year return period flood. In order to maintain and
keep power intake free of sediment build up, the spillway
tunnels are located on lower level close to the main dam and

7/24/2019 02-FINAL PC-I JULY,2014.pdf
http://slidepdf.com/reader/full/02-final-pc-i-july2014pdf 35/141
operation of the project, construction of a boulder trap at the
upstream end of the reservoir has been proposed. The
boulder trap will prevent enrtry of moving boulders andcoarse bed material in the reservior. Another bouder trap
each has also been proposed on Kesu Gol above normal
operating reservoir level (1337m asl) for the same purpose
and Gahrait Gol.
Diversion of Chitral River during construction of the dam will
be accomplished by construction of upstream anddownstream coffer dams. Construction of the diversion/
spillway tunnels and their intakes and also the power intakes
will be carried out using conventional ring type coffer dams
constructed to isolate the works from the river and also to
provide sufficient working space including access.
The headrace commences at the power intakes on the rightbank with four short connecting tunnels connecting the
intakes to four desander chambers and thereafter to two low
pressure headrace tunnels. The desander chambers are
provided with flushing tunnels and gates for evacuation of
sediment. Gates have also been provided at the downstream
end for closing each chamber as required for maintenance
while allowing rest of the chambers to operate and enable
continuous reduced power generation.
At the downstream end of each headrace tunnel, a surge
shaft is provided to limit pressure rise in the waterway system
and to allow flexibility and safety against sudden shutdown of
turbines. A vertical pressure shaft, a horizontal pressuretunnel and short penstocks lead to four vertical shaft francis
turbines through four manifolds arranged for underground
powerhouse. Transformers are arranged in an underground
cavern separated from the powerhouse. The switchyard is

7/24/2019 02-FINAL PC-I JULY,2014.pdf
http://slidepdf.com/reader/full/02-final-pc-i-july2014pdf 36/141
better explanation of the structural design approach, the
design requirements, which include design considerations,
functional requirements and sizing of the structuralcomponents; is discussed generally separately for each
component, under separate subheading?
Use of Concrete Classes AA to E having 35 Mpa to 10 Mpa
Strength has been proposed.
Except the limited superstructure portion of the powerhouse –
housed in a cavern (not requiring conventional roofingsystem), Control Room at the Power Intake, other small gate
control / operation and/or security related structures, and
residential or office buildings, the project structures falls in the
category of hydraulic structures. General design, criteria
requirements and method of design, of hydraulic structures is
detailed below. Provided discussion is limited to the design
requirements and considerations of general applicability for
hydraulic structures, and particular requirement or
considerations for any specific structure is generally not
discussed in the structures design criteria.
Minimum concrete strength and / or cement content and
hydraulic factor (BM = 1.30, direct tension = 1.65 and shear1.30) have been adopted as specified in ACI 350R-01.
Loads considered in the design include dead loads and
permanent fixtures, imposed (live) loads, operation impact,
earth pressure, hydrostatic pressure, water hammer, uplift
(over entire base area), buoyancy (corresponding to loss of
weight of submerged portion of the structure), gust (inaccordance with ANSI Code), seismic inertial force applied at
CG and hydrodynamic forces (based on Westergaard
equation). Structure proportions are generally governed by
hydraulics, structural stability (in OBE, MCE, High Flood
7/24/2019 02-FINAL PC-I JULY,2014.pdf
http://slidepdf.com/reader/full/02-final-pc-i-july2014pdf 37/141
the ICOLD guidelines for selecting seismic parameters for
large dams (1989, Revised 2010).
The PGA of 0.18g having a return period of 145 year is
recommended for dam for ground shaking associated with
Operating Basis Earthquake (OBE). All the water retaining
components of the project should remain fully functional
under the OBE associated ground motions.
All the appurtenant structures of the dam, tunnel and power
house are recommended to be designed for PGA of 0.26gwhich is associated with ground motion of Design Basis
Earthquake (DBE).
Reinforcement Design
Reinforcement design shall be based on grade 425 (grade
60) deformed reinforcement bars conforming to ASTM A 615or an equivalent standard (BS 4446), with yield strength =
425MPa, for use as main or distribution reinforcement in
general structures, except Y10 (#3), and Y12 (#4) bars used
as column ties, beam stirrups, or dowels (between the First
Stage and Second stage Concrete), which may be deformed
or plain round grade 250 (mild steel) bars, with fy = 250MPa
(36ksi). Use of „Deformed Cold Worked Bars‟ conforming to
BS 4449 or an equivalent Austrian (Originator Country)
Standard shall not be allowed.
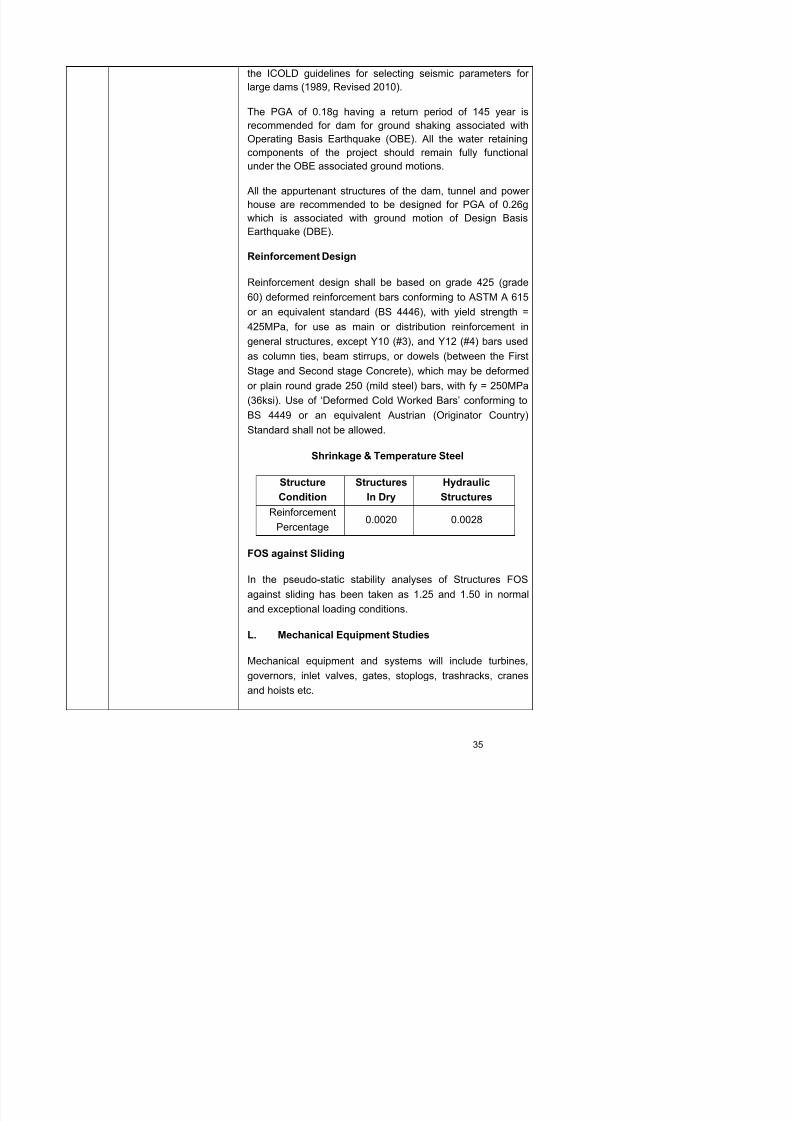
Shrinkage & Temperature Steel
Structure
Condition
Structures
In Dry
Hydraulic
StructuresReinforcement
Percentage0.0020 0.0028
FOS against Sliding
7/24/2019 02-FINAL PC-I JULY,2014.pdf
http://slidepdf.com/reader/full/02-final-pc-i-july2014pdf 38/141
As stated above, the net head at rated discharge of
430m3/sec is 95.89m. Four (04) Francis turbines have been
selected, each with a rated flow of 107.5m3
/s. This selectionensures that at least one (01) unit will keep running at 50%
flow without cavitation all time of the year as recommended
by international best practices.
For determining appropriate unit capacity, both technical and
economic aspects have been investigated. The factors which
have been considered in the comparison comprise equipmentdimensions, transport limitations, power and energy benefits,
manufacturing experience, power system regulation, and cost
estimates.
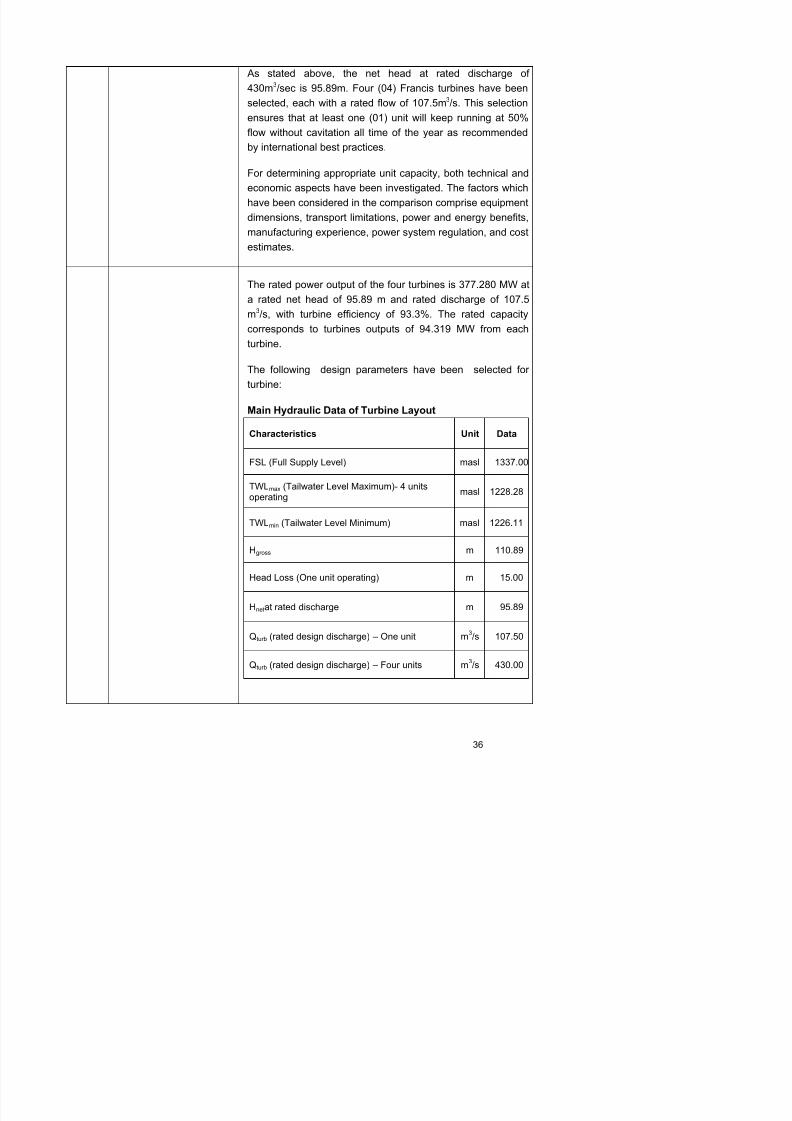
The rated power output of the four turbines is 377.280 MW at
a rated net head of 95.89 m and rated discharge of 107.5m3/s, with turbine efficiency of 93.3%. The rated capacity
corresponds to turbines outputs of 94.319 MW from each
turbine.
The following design parameters have been selected for
turbine:
Main Hydraulic Data of Turbine Layout
Characteristics Unit Data
FSL (Full Supply Level) masl 1337.00
TWLmax (Tailwater Level Maximum)- 4 units
operating masl 1228.28
TWLmin (Tailwater Level Minimum) masl 1226.11
Hgross m 110.89
7/24/2019 02-FINAL PC-I JULY,2014.pdf
http://slidepdf.com/reader/full/02-final-pc-i-july2014pdf 39/141
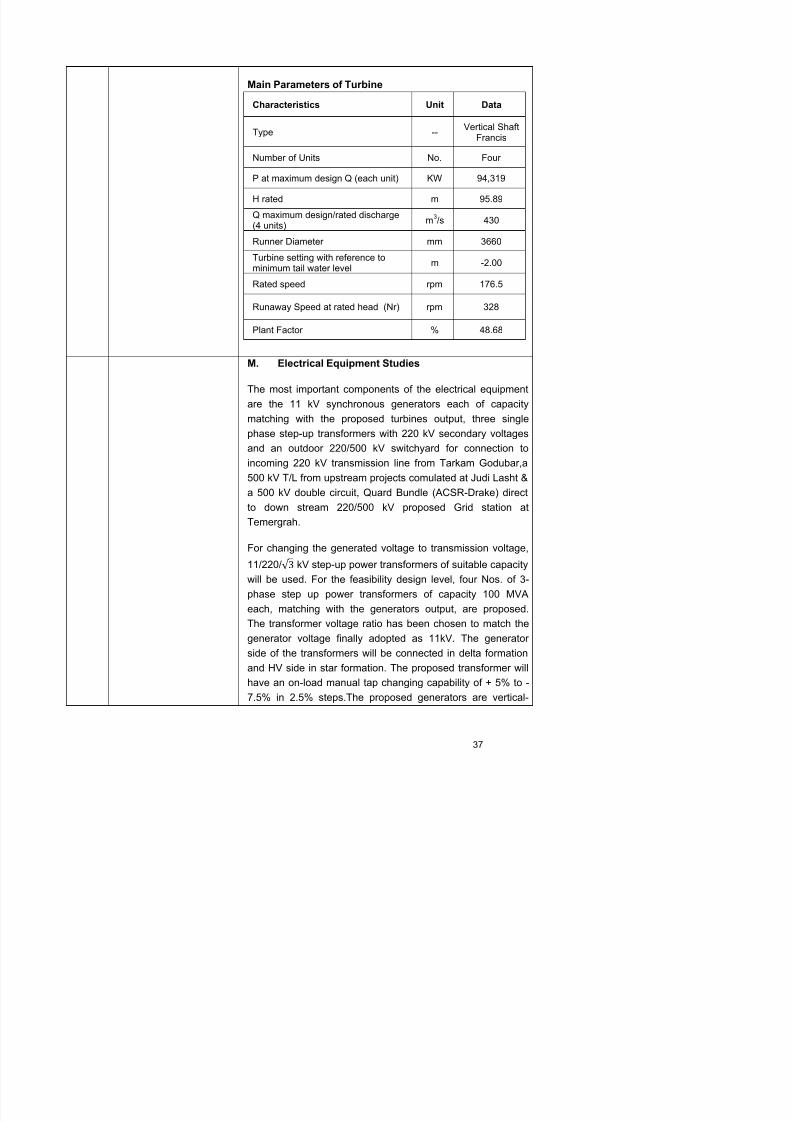
Main Parameters of Turbine
Characteristics Unit Data
Type --Vertical Shaft
Francis
Number of Units No. Four
P at maximum design Q (each unit) KW 94,319
H rated m 95.89
Q maximum design/rated discharge(4 units)
m3/s 430
Runner Diameter mm 3660
Turbine setting with reference tominimum tail water level
m -2.00
Rated speed rpm 176.5
Runaway Speed at rated head (Nr) rpm 328
Plant Factor % 48.68
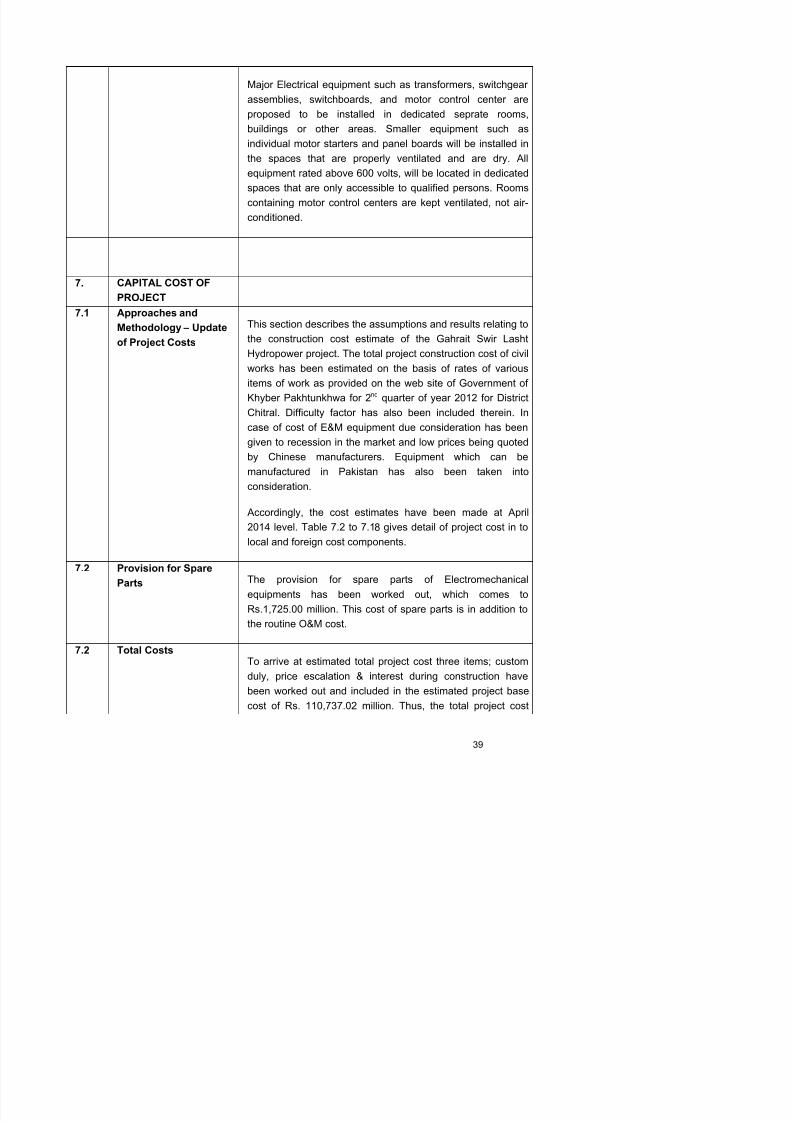
M. Electrical Equipment Studies
The most important components of the electrical equipment
are the 11 kV synchronous generators each of capacity
matching with the proposed turbines output, three single
phase step-up transformers with 220 kV secondary voltages
and an outdoor 220/500 kV switchyard for connection to
incoming 220 kV transmission line from Tarkam Godubar,a
500 kV T/L from upstream projects comulated at Judi Lasht &
a 500 kV double circuit, Quard Bundle (ACSR-Drake) directto down stream 220/500 kV proposed Grid station at
Temergrah.
For changing the generated voltage to transmission voltage,

7/24/2019 02-FINAL PC-I JULY,2014.pdf
http://slidepdf.com/reader/full/02-final-pc-i-july2014pdf 40/141
shaft, hydraulic driven, alternating current, synchronous type,
and will conform to the applicable standards regarding rating,
characteristic, tests, etc. The selection of generators is inaccordance with the turbines. The rating of all four generators
is as follows:
The rating of all four generators is as follows:
Operating duty Continuous
Rated Capacity 110.96 MVA Efficiency 98 %
Power factor 0.85
Frequency 50 Hz
Number of Phases 3
Rated voltage 11 kV
Rated Current 5830 Amp
Rated Speed 328 rpm
Number of Poles 18
Armature Winding Star-Connected
IEC Insulation F - Class
Main Data for Transformers
Four no. of three-phase, step up transformers and four no. of
auxiliary transformers of the following ratings are proposed:
Transformer Data
Item Unit Main Auxiliary Excitation
Function Step-
Powerhouse Powerhouse
Rated output MVA 100 0.350 1.2
Quantity No 4 4 4
7/24/2019 02-FINAL PC-I JULY,2014.pdf
http://slidepdf.com/reader/full/02-final-pc-i-july2014pdf 41/141
Major Electrical equipment such as transformers, switchgear
assemblies, switchboards, and motor control center are
proposed to be installed in dedicated seprate rooms,
buildings or other areas. Smaller equipment such as
individual motor starters and panel boards will be installed in
the spaces that are properly ventilated and are dry. All
equipment rated above 600 volts, will be located in dedicated
spaces that are only accessible to qualified persons. Rooms
containing motor control centers are kept ventilated, not air-conditioned.
7. CAPITAL COST OF
PROJECT7.1 Approaches and
Methodology – Update
of Project Costs
This section describes the assumptions and results relating to
the construction cost estimate of the Gahrait Swir Lasht
Hydropower project. The total project construction cost of civil
works has been estimated on the basis of rates of various
items of work as provided on the web site of Government of
Khyber Pakhtunkhwa for 2nd
quarter of year 2012 for DistrictChitral. Difficulty factor has also been included therein. In
case of cost of E&M equipment due consideration has been
given to recession in the market and low prices being quoted
by Chinese manufacturers. Equipment which can be
manufactured in Pakistan has also been taken into
consideration.
Accordingly, the cost estimates have been made at April
2014 level. Table 7.2 to 7.18 gives detail of project cost in to
local and foreign cost components.
7/24/2019 02-FINAL PC-I JULY,2014.pdf
http://slidepdf.com/reader/full/02-final-pc-i-july2014pdf 42/141
becomes Pak Rs. 181,115.83 million.
Foreign component of the cost has been converted to local
currency using exchange rate as one US$ equivalent to Rs
98.56/- as on (30th April 2014 level)
Table 7.1 gives break up of project cost in to local and foreign
cost components.
8. ANNUAL OPERATING
AND MAINTENANCE
COST AFTER
COMPLETION OF THE
PROJECT
The annual operation and maintenance cost has beenestimated keeping in view the recent years expenditures and
salaries of the staff. The O&M cost @1.00% of the total cost
has been taken which comes to Rs 1,054.79 million which will
be met through selling of energy of power plant.
9. DEMAND AND SUPPLY 9.1 Annual Consumption
Table 9.1 gives the profile of sales, generation, peak demand
and annual load factor during the last thirteen years from
fiscal years 1999-2000 to 2011-12. Over that period, energy
sales increased by nearly 74.45%, energy generated (sent-
out energy) increased by 60.58% and peak demand
increased by approximately 56.74%. Due to the faster growthof energy demand compared to peak power, the system‟s
load factor grew from 65.8% to 68.0%.
The difference between energy sales, (i.e. end user
consumption) and energy generation represents losses.
These losses comprise power station consumption, line
losses and theft.
The peak load in WAPDA‟s service area was recorded at
more than 15,000 MW in 2012. At present, nearly half of the
7/24/2019 02-FINAL PC-I JULY,2014.pdf
http://slidepdf.com/reader/full/02-final-pc-i-july2014pdf 43/141
demands of major customer sectors (including the
residential, commercial and industrial sectors) to arrive at a
nation-wide forecast. The approach relies on projections offuture development of the national economy (GDP), changes
in demography (population structure) and political
preferences and objectives (e.g. electrification programs,
demand side management measures).
Table 9.2 presents the latest forecast in tabular form. The
tabular compilation includes both, peak power and annualenergy demand (at sent-out level). Electricity demand is
expected to grow by some 7.80% annually over the years
from 2011 until 2015. Beyond 2015, annual growth forecast
for next five years is increased to 8.9%, by the period
between 2020 and 2025 it will be 8.5%, between 2025 and
2030 it will be 7.10% and for next 5 years it is expected to be
6.5% . The load factor is foreseen to change only very slightly
from some 0.69 at present to 0.67 in 2035.
10. FINANCIAL PLAN AND
MODE OF FINANCING
The Government of Khyber Pakhtunkhwa will finance the
project with following financing parameters;
10% through provincial ADP
90% through Hydel Development Fund/ForeignInvestment.
11. PROJECT BENEFITS
AND ANALYSIS
i) Financial/Economic &
Social Benefits with
Indicators
Financial Benefits:
i) The hydropower project is highly beneficial due to less
unit cost and will help in saving foreign exchange on
import of thermal fuels.
ii) The financial benefits of the project life, over 50 years

7/24/2019 02-FINAL PC-I JULY,2014.pdf
http://slidepdf.com/reader/full/02-final-pc-i-july2014pdf 44/141
project.
v) The revenue of Government would increase due to direct
and indirect taxation, duties, and levies on the production
of goods and services that will arise from the power
generation within the project area as well as from the
electricity duty collected by the Government of Khyber
Pakhtunkhwa or any other Govt. Agency i.e. PESCO.
Economic Benefits
The economic analysis of the project has been carried out
with/ without CDM benefits to the overall economy as a
consequence of least cost optimal development of the
hydropower potential in the country. For this purpose the
benefits from the proposed thermal plants have been
evaluated in term of costs foregone for providing an
equivalent thermal generation.
The results of the analysis show that the project is technically
sound and economically viable. The EIRR calculated ranges
from 14% to 24%.
Social Benefits
The project will supply 377 MW of power and generate
1,579GWh of energy annually which will assist in meeting
power demand of the country. The project has long service
life as there is no reservoir sedimentation problem. The
project will implement several programs that are designed to
improve living standard of the area. These programs will
provide improved health, education and infrastructure
facilities while other programs will provide alternative source
7/24/2019 02-FINAL PC-I JULY,2014.pdf
http://slidepdf.com/reader/full/02-final-pc-i-july2014pdf 45/141
required to import thermal fuel.
ii) Employment
Generation (Direct &
Indirect)
The existing conditions in the project area regarding
employment are very low. Almost more than 90% population
is engaged in different economical sectors like agricultural,
fruit and vegetables production etc. Current estimates for the
number of personnel to be employed during the construction
period are about 1500persons at peak times. The majority of
employees will be in the unskilled and semi-skilled sectors
and the need for imported expatriate management staff isrelatively low. A large proportion of the workforce will be
drawn from the immediate local area, with preference given
to displaced landholders and laborers from affected
communities. Training of staff during construction will
substantially increase the expertise of the labor force within
the area.
iii) Main Environmental
Impacts
The area to be inundated by reservoir is given in the following
table, which shows that 3,098 kanal of land will be
permanently submerged at full reservoir level (FRL) which is
1337 masl. While the land acquisition for reservoir area will be
limit to 1342 masl, which is High Flood Level (HFL) computed
on 1,000 years return period.
Construction of Gahrait Swir Lasht Hydro Power Project willbring following impacts in the area;
Adverse Impacts:
It is estimated that the project will involve acquisition of
about 488 kanal of land which includes, 371 kanal of
cultivated land, 13 kanal of residential, 17 kanal of cultivable
waste land and 87 kanal of waste land. State land is 7,781
kanal including 801 kanal of river bed.Breakdown of land
required for the project is given in Table 11.1.
D t i d t f i 12 id ti l it ill b
7/24/2019 02-FINAL PC-I JULY,2014.pdf
http://slidepdf.com/reader/full/02-final-pc-i-july2014pdf 46/141
and other facilities.
The impact on vegetation is not high. About 370 trees
(about 155 shade & 215 fruit trees) will have to be cut.
Table 11.3: describes percentage of affected trees in the
project area.
A watercourse locating in the proposed reservoir area will be
affected. Peoples from settlements of Gahrait Usst and
Gahrait Gang Qila use this watercourse for domestic as well
as irrigation purposes. Moreover that watercourse will betapped to meet colony and campsite (construction
requirements), thereby competing with use of water by the
local communities.
The construction activities will affect air quality and cause
noise-related hazards, which will be of concern, especially
at the powerhouse where some settlements are close bythe project area.
When the water is diverted through power tunnel,
depletion of river flows will affect population of the villages
falling in the river stretch between the dam and the
powerhouse.
Soil erosion may occur due to back water effect of reservoirwater. This will impact the agricultural terraces of local
community.
The possible contamination of soil by oils and chemicals at
campsites, workshop areas, and equipment washing-yards
may limit the future use of land.
Construction of the project may affect the groundwater
regime thus may change spring water pattern of the area.
Thus local water supplies through the springs may be
affected both in quantity and quality.
7/24/2019 02-FINAL PC-I JULY,2014.pdf
http://slidepdf.com/reader/full/02-final-pc-i-july2014pdf 47/141
drinking water, etc. Their privacy may suffer due to the
project activities. Moreover, it will cause hindrance to the
mobility of local women for working in the field, herding
livestock, bringing drinking water from springs, picking fuel
wood, etc.
During field surveys of the project, no indigenous or
vulnerable householdgroup of people was identified. So no
impact on these people is envisaged due to
theimplementation of the project.
Contractor‟s staff while working at steep hilly slopes may
slip and get injuries. Accidents are also expected during
tunnelling activities.
No historical or archeological site has been observed or
reported along the Project area. Anyhow, About 125
graves will be disrupted due to construction of Dam axis.
iv) Environmental
Mitigation Mitigations:
For Gahrait Swir Lasht Hydro Power Project, during
stakeholder meeting with land revenue department, land
rates were discussed. Land rates as per office of the
District Officer Revenue & Estate Collector, Drosh for year2012 – 13 and projected to 2013 – 14 with 25% annual
increment.
Value of affected shade tree in the project area is
determined after consultation with the forest representative
as Rs.1,000 and for fruit tree as Rs.1,500.
It is estimated that against cutting of about 370 trees PEDO
will make a provision of compensatory plantation at the
ratio of 1:5. As such, the total compensatory plantation
comes to about 1,850 trees or more to minimize the
7/24/2019 02-FINAL PC-I JULY,2014.pdf
http://slidepdf.com/reader/full/02-final-pc-i-july2014pdf 48/141
overspills which indicates that it has enough water for the
community requirements. Moreover a collection tank and
washing points plus allied structures will be constructed for
proper water management. A small filtration plant will also
be proposed for the drinking water requirements of the
nearby communities.
According to Himachal Pradesh State Environment
Protection and Pollution Control Board (HPSEP&PCB)
guidelines environmental flow for Gahrait Swir Lasht Hydro
Power Project is 12.1m3/sec. The designers have reportedthat 15 m3/s flows will result in 1m depth of flow
downstream of the dam with width of 15 Km (between Dam
to Powerhouse site). Therefore, 15m3/sec is recommended
environmental flow. Numerous natural springs and nullahas
(Gols) along the 15 km length will enhance this flow. Flow
data of springs is not available.
In the light of discussion and data given by fisheries
department, fish ladder being proposed for the conservation
of aquatic fauna. Fish ladder layout has been proposed
through the left bank. Inlets at inverts varying from El. 1331
to 1337 have been provided to make fish ladder functional
during variation of reservoir levels.
Air quality should be monitored on regular basis near the
plant by the contractor. The plant should be located at least
500m away from any living area. Regular spraying of water
should be undertaken to minimize dust pollution. All
vehicles, machinery, equipment and generators used
during construction activities will be kept in good working
condition to minimize exhaust emissions.
For higher slopes, protection against erosion and landslides
will be carried out by providing benches and, if needed,
furnishing with protective measures depending upon the
nature of the constituent material of the hills
7/24/2019 02-FINAL PC-I JULY,2014.pdf
http://slidepdf.com/reader/full/02-final-pc-i-july2014pdf 49/141
as well as construction purposes.
Camps will be located at least 500 m away from the nearest
local settlement to prevent the contamination of community-owned water resources like springs, hill torrents, etc.
Blasting and other noise generating activities will not be
carried out during the night.
Special measures will be adopted to minimize impacts on
the wild birds, such as avoiding noise generating activitiesduring the critical periods of breeding and migration.
The Contractor will have to select the specific timings for
the construction activities particularly near the settlements,
so as to cause least disturbance to the local population
particularly women considering their peak movement hours.
Contractor will warn the staff strictly not to involve in any
un-ethical activities and to obey the local norms and cultural
restrictions particularly with reference to women.
As referred earlier, no indigenous or vulnerable household
group of people was identified in or along the project area,
so the WB/ADB Policy will not be triggered.
Complying with the safety precautions for constructionworkers as per International Labour Organization (ILO)
Convention No. 62, as far as applicable to the project
contract.
Graves affected by the project will have to be shifted. The
proponent will obtain Fatwa from local Mufti before shifting
the graves. During such operation the proponent will informlocal administration and seek their assistance for security.
The request will also be extended to Health Department for
deputation of medical and paramedical staff during the
operation. As referred earlier, no relocation of historical or

7/24/2019 02-FINAL PC-I JULY,2014.pdf
http://slidepdf.com/reader/full/02-final-pc-i-july2014pdf 50/141
exploitation status in the country and Alternative
Hydropower Generation Resources
• Project Design Alternative.
vi) Mitigation Cost Environmental Related Cost
Table 11.5 provides an estimate of environmental cost of the
Project.
The total environmental and resettlement cost comes toabout Rs. 514.7 million when land acquisition is limited to the
reservoir retention level of El 1342 m.

7/24/2019 02-FINAL PC-I JULY,2014.pdf
http://slidepdf.com/reader/full/02-final-pc-i-july2014pdf 51/141
vii) Economic Analysis The economic analysis of the project has been carried out on
the basis of benefits to the overall economy as a
consequence of the least cost optimal development of the
hydropower potential in the country. For this purpose the
benefits from the proposed combined cycle gas combustion
and furnace oil turbine plant have been evaluated in terms of
costs foregone for providing an equivalent generation. Other
alternatives i.e. Simple Open Cycle Gas Turbine and slow /
medium speed diesel plant have been omitted in PC-I.
Economic Analysis is based on shadow prices and transfer
payments such as custom duties, price contingency and
interest during construction have been excluded in economic
analysis. Other assumptions for undertaking the economic
analysis have been described in Table 11.6.
Results of economic analysis i.e. EIRR calculated as 23.71%and benefit cost ratio (BCR) as 2.05:1 prove the viability of
the project. The summary of the results of economic analysis
is presented is as under:-
For detailed analysis refer Table 11.7 & 11.8.
Net Present Value, BC Ratio and EIRR.
Present Worth of Benefits @ 12% Rs.119,596.90
Present Worth of cost @ 12% Rs. 58,306.45
Net Present Worth Rs. 61,290.45
Benefit Cost Ratio 2.05:1
Economic Internal Rate of Return (EIRR) 23.71%
iii) S iti it A l i T t t th b t f th i i l f th

7/24/2019 02-FINAL PC-I JULY,2014.pdf
http://slidepdf.com/reader/full/02-final-pc-i-july2014pdf 52/141
viii) Sensitivity Analysis To test the robustness of the economic appraisal of the
project, a sensitivity analysis has been carried out. This test
has been performed only for the combined cycle thermal
plant using furnace oil equivalent as this is the alternative
showing least benefits in favor of the proposed project. The
robustness of this analysis would thus qualify other
alternatives. The summary of the results of sensitivity
analysis is presented as under:
For detailed analysis refer Table 11.9.
Scenario EIRR %BC
Ratio
Base Case 23.71% 2.05
Cost increase by 10% 21.75% 1.86
Benefit Decrease by 10% 21.55% 1.85
Combination of above 19.75% 1.68
Key; EIRR = Economic Internal Rate of Return; BC Ratio =
Benefit Cost Ratio
ix) Financial Analysis Financial Analysis has been carried out from sponsors
prospective. This analysis is based on the following
assumptions;
a) Interest rate of 10.65% as notified by the Govt. of
Pakistan, Finance Division has been used.
b) Escalation rate of 6.5% &1.3% for local and foreign cost
components, respectively, have been applied.
c) Custom duties @ 5% have been used on import of
electro-mechanical equipments as per hydel policy, 2002.
d) Operation and maintenance cost has been taken as
Quantifiable output of the project
7/24/2019 02-FINAL PC-I JULY,2014.pdf
http://slidepdf.com/reader/full/02-final-pc-i-july2014pdf 53/141
Quantifiable output of the project
The project will supply 377 MW of power and generate
1,579GWh of energy annually which will assist in meeting
power demand of the country and will help in reduction of
load-shedding. The project will generate revenue of Rs.
27,148.91 million annually at full operation. The Financial
Internal Rate of Return (FIRR) works out to be 13.58% as
shown in Table 11.10.
x) Unit Cost The cost per kWh of energy generated has been estimated
by dividing average annual recurring cost with annual
generation over the economic life of the project. The unit cost
is calculated with Transmission line and without Transmission
line.
The average annual recurring cost is arrived at by amortizing
the total financial cost of Rs. 181,115.83 million (Local Rs.
145,015.09 million and FEC Rs. 36,100.74) including Custom
Duties @5% of foreign cost of E&M equipments, Price
Escalation @ of 6.5% and 1.3% for local and foreign cost
components respectively and Interest during construction at
the interest rate of 10.65% for both local and foreign cost
respectively for 20 years and levelized over the useful life ofthe project. To this has also been added annual O&M cost of
Rs. 1,093.49 million (1.00% of the total cost of project) which
gives annual recurring cost of Rs. 9,984.90 million. The
project generation cost per kWh and cost per MW of installed
capacity are shown in Table 11.11. As can be seen, the
project shows generation cost of Rs.6.32/kWh (6.42 US
Cents) over the useful life of the project whereas installed
capacity per MW comes to Rs. 480.41 million (4.87 M US$).
xi) Profit/ Loss Account Expected income, profit & loss shown in Table 11.13, have
Results of Profit / Loss Statement:
7/24/2019 02-FINAL PC-I JULY,2014.pdf
http://slidepdf.com/reader/full/02-final-pc-i-july2014pdf 54/141
Results of Profit / Loss Statement:
Project Investment Cost Rs. 181,115.83 Million
Less: Salvage Value @ 10% Rs. (18,111.58) Million
Net Investment Rs. 163,004.25 Million
Depreciation per annum Rs.8,150.21 Million
Total Expected Income for Rs. 275,019.47 Million
First 10 years
Total Expected Income/ Net Investment 1.69:1
Investment Ratio = 275,019.47/163,004.25
xii) Break Even Point (BEP) Breakeven point is a volume of production which determinesthe number of units of energy required to recover the
recurring expenditures (Operating costs + Debt + Interest
Obligation). The break even production volume of the project
is 549.07GWh of energy which is considerably less than the
annual production of 1,579 GWh.
xiii) Payback Period The payback period of the project is 6.67 years.
xiv) Return on Equity Not applicable at this stage.
12. IMPLEMENTATION
SCHEDULE
(INCLUDING STARTING
AND COMPLETIONDATES)
The completion/ implementation of the project are stretched
over forty eight months. Therefore, it is assumed that project
implementation would start from January 2016 and
completed by December 2023. The Ninety Six months‟investment is exclusive of twelve months of pre-construction
activities and Eighty Four months of construction activities is
apportioned as follows:
Year Percentage
13 MANAGEMENT

7/24/2019 02-FINAL PC-I JULY,2014.pdf
http://slidepdf.com/reader/full/02-final-pc-i-july2014pdf 55/141
13. MANAGEMENT
STRUCTURE AND
MANPOWER
REQUIREMENTS
INCLUDING
SPECIALIZED SKILLS
DURING
CONSTRUCTION AND
OPERATIONAL
PHASES
Refer to Para 11 (ii) above
14. ADDITIONAL
PROJECTS /
DECISIONS REQUIRED
TO MAXIMIZE SOCIO-
ECONOMIC BENEFITS
FROM PROPOSED
PROJECT
Not Required
15. CERTIFIED THAT THE PROJECT PROPOSAL HAS BEEN PREPARED ON THE BASIS
OF GUIDELINES PROVIDED BY THE PLANNING COMMISSION FOR PREPARATION OF PC-

7/24/2019 02-FINAL PC-I JULY,2014.pdf
http://slidepdf.com/reader/full/02-final-pc-i-july2014pdf 56/141
OF GUIDELINES PROVIDED BY THE PLANNING COMMISSION FOR PREPARATION OF PC
I FOR INFRASTRUCTURE SECTORS
Prepared by Abdur Rashid Mirza
Economic and Financial Analyst
Gahrait Swir Lasht Hydropower Project
ACE (Pvt) Ltd
Iqtidar-ul-Hassan Alvi
Team Leader
Gahrait Swir Lasht Hydropower Project
ACE (Pvt.) Limited
Checked by Narindar Kumar
Project Manager
Gahrait Swir Lasht Hydropower Project
PEDO
Farhat Mahmood
Director Feasibilities Studies
PEDO
Recommended by Bahadur Shah
Managing Director/ Project Director
PEDO

7/24/2019 02-FINAL PC-I JULY,2014.pdf
http://slidepdf.com/reader/full/02-final-pc-i-july2014pdf 57/141
SALIENT FEATURES
377 MW GAHRAIT-SWIR LASHT HYDROPOWER PROJECT
SALIENT FEATURES
1 L ti 10 k t f D h T (Di t i t

7/24/2019 02-FINAL PC-I JULY,2014.pdf
http://slidepdf.com/reader/full/02-final-pc-i-july2014pdf 58/141
1. Location 10 km upstream of Drosh Town. (District
Chitral), Khyber Pakhtunkhwa, Pakistan.
2. Organization Pakhtunkhwa Energy DevelopmentOrganization (PEDO).
3. Hydrology
Catchment area (dam site) 13418.5 km2
Mean Monthly Discharge (m3/sec) 80.8 to 978.50
Design Flood (Q1000) 3538 m3/sec
4. River DiversionDesign Flood (Q10 year) 1790 m
3/sec
No of Diversion Tunnels 4 No‟s.
Shape D-shaped
Size (W x H) 7.6 m x 7.6 m
5. Dam & Appurtenant StructuresDam type Asphaltic face Rockfill Dam (AFRD)
Dam Crest level 1342.00 masl
Maximum Reservoir Level 1337.00 masl
Minimum Reservoir Level 1331.00 masl
Dead Storage Level 1324.00 masl
Dam Height (from Bed) 34 m.
Dam bed elevation 1309.00 m.asl
6. Spillway & Energy dissipation arrangement
Spillway type Tunnel Spillway
No of Diversion Tunnels 4 No‟s. Shape D-shaped
Size (W x H) 7.6 m x 7.6 m
Type of energy dissipation arrangement Flip Bucket
7. Power Intake/ Connecting TunnelsNo of Intakes 4 No‟s.
Size of each Twin intake opening 7.00 m x 3.00 m
Intakes invert Level 1324.00 m.asl.
No of Intake Connecting tunnels 4 No‟s
Connecting Tunnels (Upstream of Sand trap) 12 m x 9 m (D-Shaped)
8. Sand Trap / Flushing TunnelsType Pressurized-D shape
Diameter 9.50 m
10. Surge Shaft

7/24/2019 02-FINAL PC-I JULY,2014.pdf
http://slidepdf.com/reader/full/02-final-pc-i-july2014pdf 59/141
10. Surge Shaft
Height 71 m.
No of Surge Tanks 02 No‟s
Diameter 10 m.
11. Concrete Lined Pressure Shaft
Length 92.20 m.
No of Pressure Shafts 02 No‟s
Diameter 6.50.m.
12. Steel Lined Penstock Length 78 m.
Diameter 6.5 m.
13. Head Gross head 109.28 m.
Head loss (single waterway) 9.12 m
Net Head 100.16 m
14. DischargeDesign Discharge 430 m
3/sec
15. Powerhouse Type Underground
Size (Lx WxH) 113 m x24 m x35 m
16. Tailrace Tunnel Type D-Shaped
Total length 3980 m
Size (W x H) 7 m x 6.5m
17. Hydro-Mechanical Equipment Type of turbine Francis
No of Units 4 No‟s
Discharge/ Unit 107.50 m3/sec
18. Electrical Equipment Generators 4 No‟s
Speed 176.5 rpm
19. Installed Capacity Plant Capacity 377 MW
Capacity/ unit 94.25 MW
20. Energy Annual Energy 1579 Gwh

7/24/2019 02-FINAL PC-I JULY,2014.pdf
http://slidepdf.com/reader/full/02-final-pc-i-july2014pdf 60/141
PROJECT DATA
PROJECT DATAGAHRAIT SWIR LASHT HYDROPOWER PROJECT

7/24/2019 02-FINAL PC-I JULY,2014.pdf
http://slidepdf.com/reader/full/02-final-pc-i-july2014pdf 61/141
1. General
Project Gahrait-Swir Lasht HPP
Location 10 km Upstream of Drosh Town, near Kesu
Village, (District, Chitral) Khyber
Pakhtunkhwa, Pakistan.
SOP Coordinates Dam Left abutment(E 3086764.48, N 1268234.70)
Dam Right abutment(E3086672.60, N 1268249.42)
Powerhouse Site (E 3083403.11, N1258175.85)
River Chitral
Type Run-of-River
Purpose of Project To add badly needed affordable electricity to
the National Grid
2. Reservoir
Full Reservoir Level (FRL) 1337.00 m asl
Reservoir Volume at El.1337.00 m asl 13.798 Mm3
Capacity required (4Hrs peaking) 7.430 Mm3
Minimum Operating Water Level (M.O.L) 1331.00 m aslReservoir Volume at El.1331.00 m asl 5.747 Mm3
Dead Storage Elevation 132400 m asl
Reservoir Volume at El.1324.00 m asl 0.805 Mm3
River Bed Elevation (Dam site) 1309 m asl
Reservoir Area (E.L. 1337.00 m asl) 1.54Km2
Reservoir Length (E.L. 1337.00 m asl) 4.470 Km
Average slope of River 0.007784 (1 in128)
Design Discharge (Q26) 430m3/s for power yield
Flushing Discharge (20 % of Qd) 86 m3/s.
3 H d l
Flood Discharge (Q10,000 years) 4890m3/s
3.2. Recommended floods (Powerhouse Site)
7/24/2019 02-FINAL PC-I JULY,2014.pdf
http://slidepdf.com/reader/full/02-final-pc-i-july2014pdf 62/141
River Chitral River
Catchment Area (Power house) 14330.6km2
Flood Discharge (Q2 year) 1423 m3/s
Flood Discharge (Q10 year) 1912 m3/s
Flood Discharge (Q25 year) 2209 m3/s
Flood Discharge (Q50 year) 2453m3/s
Flood Discharge (Q100 year) 2718 m3/s
Flood Discharge (Q500 year) 3427 m3/s
Flood Discharge (Q1000 years) 3782m3
/sFlood Discharge (Q10,000 years) 5226m3/s
4. River Diversion (Diversion Tunnels) & Spillway (Tunnel Spillway)
Proposed Location Right Bank of Chitral River
Number of Tunnels 4 No’s.
Type D-Shaped (Steel Lined)
Length of Tunnel – 1 189 mLength of Tunnel – 2 246 m.
Length of Tunnel – 3 295 m
Length of Tunnel – 4 316 m
Slope of Diversion Tunnel / Spillway Tunnels-I 1 in 29
Slope of Diversion Tunnel / Spillway Tunnels-II 1 in 39
Slope of Diversion Tunnel / Spillway Tunnels-III 1 in 47
Slope of Diversion Tunnel / Spillway Tunnels-IV 1 in 51
4.1. Diversion Tunnel / Spillway Tunnels Inlet Details
Shape of Tunnel D-Shaped (Steel Lined)
Size of Tunnel 7.6 m x 7.6 m
River Bed Elevation (at Inlet) 1313.00 m asl
Tunnel invert (at Inlet) 1313.00 m asl
Tunnel Top (at Inlet) 1321.79 m aslPlatform Crane EL. (at Inlet) 1338.00 m asl
Size of Groves for Stoplogs 0.40 m x 0.20 m
RCC Lining (Tunnel) 500 mm
Shotcrete Thickness (Tunnel) 120 mm
RCC Lining 300 mm
Shotcrete Thickness 35 mm
S l li i 10

7/24/2019 02-FINAL PC-I JULY,2014.pdf
http://slidepdf.com/reader/full/02-final-pc-i-july2014pdf 63/141
Steel lining 10 mm
4.3. Upstream Coffer Dam (River Diversion)
Q10 (10 year flood) 1789 m3/sec
Type River Material
Height of Coffer Dam 10.0 m
River Bed Level 1311.00 m asl
Coffer Dam Crest Level 1321.00 m asl
Free Board 0.30 m
Designed U/S Water Level 1320.70 m aslTop width of Coffer Dam 6.0 m (for two-way traffic)
Coffer dam Side slopes 1V:2 H
4.4. Downstream Coffer Dam (River Diversion)
Type River Material
Height of Coffer Dam 7.00 m
Dam Crest Level 1315.00 m asl
River Bed Level 1308.00 m asl
Designed U/S Water Level 1314.70 m asl
Free Board 0.30 m
Top width of coffer Dam 6.0 m
Side slopes 1V:2 H
4.5. Downstream Coffer Dam (Ring Type-For Construction of Diversion Tunnel)
Type River MaterialHeight of Coffer Dam 3.00 m
River Bed Level 1307.00 m asl
Dam Crest Level 1310.00 m asl
Top width of Coffer Dam 6.0 m
Side Slopes 1V:2 H
4.6. Diversion Tunnel /Spillway Tunnel (Energy Dissipation Arrangement)
4.6.1. Flip BucketTail Water Elevation (Q25 =2053 m3/sec) 1314.19 m asl
Tail Water Elevation (Q100=2543 m3/sec) 1314.98 m asl
Tail Water Elevation (Q1000=3538 m3/sec) 1315.89 m asl
5. Dam & Appurtenant Structures
Type Asphaltic Concrete Faced Rock fill Dam
(AFRD Type)
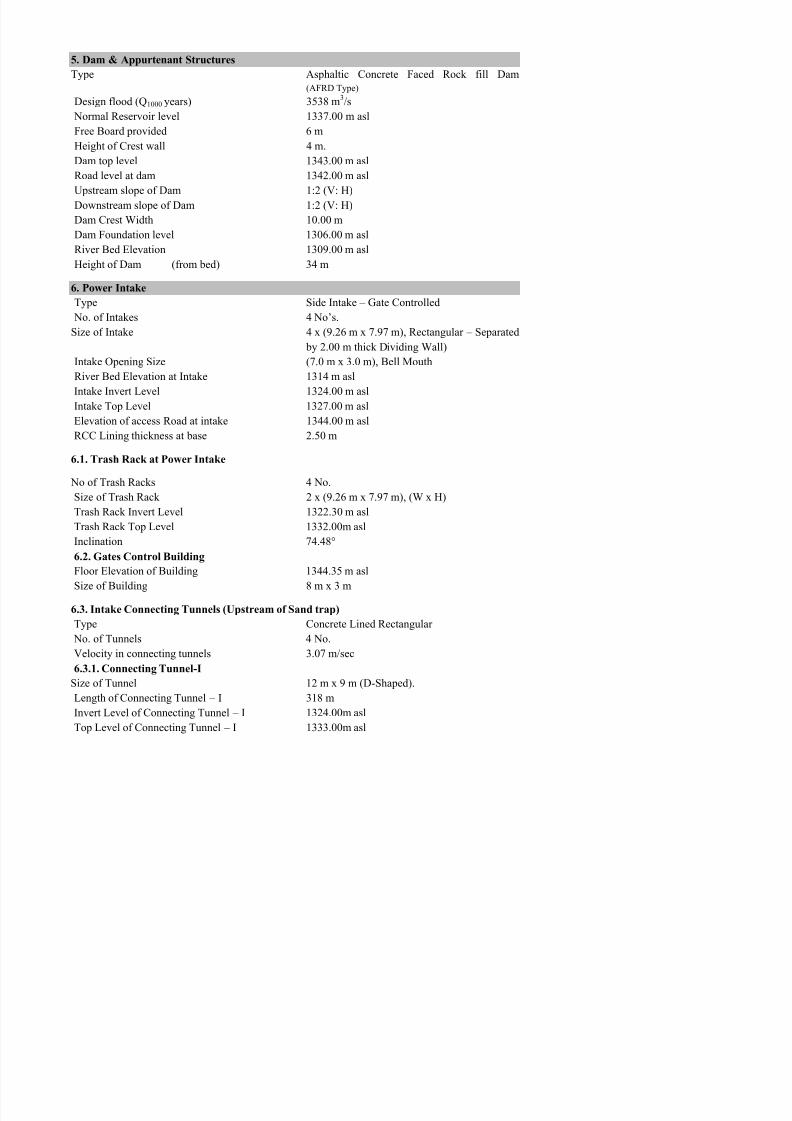
7/24/2019 02-FINAL PC-I JULY,2014.pdf
http://slidepdf.com/reader/full/02-final-pc-i-july2014pdf 64/141
(AFRD Type)
Design flood (Q1000 years) 3538 m3/s
Normal Reservoir level 1337.00 m asl
Free Board provided 6 m
Height of Crest wall 4 m.
Dam top level 1343.00 m asl
Road level at dam 1342.00 m asl
Upstream slope of Dam 1:2 (V: H)
Downstream slope of Dam 1:2 (V: H)Dam Crest Width 10.00 m
Dam Foundation level 1306.00 m asl
River Bed Elevation 1309.00 m asl
Height of Dam (from bed) 34 m
6. Power Intake
Type Side Intake – Gate Controlled No. of Intakes 4 No’s.
Size of Intake 4 x (9.26 m x 7.97 m), Rectangular – Separated
by 2.00 m thick Dividing Wall)
Intake Opening Size (7.0 m x 3.0 m), Bell Mouth
River Bed Elevation at Intake 1314 m asl
Intake Invert Level 1324.00 m asl
Intake Top Level 1327.00 m aslElevation of access Road at intake 1344.00 m asl
RCC Lining thickness at base 2.50 m
6.1. Trash Rack at Power Intake
No of Trash Racks 4 No.
Size of Trash Rack 2 x (9.26 m x 7.97 m), (W x H)
Trash Rack Invert Level 1322.30 m asl
Trash Rack Top Level 1332.00m asl
Inclination 74.48°
6 2 Gates Control Building
Thickness of Concrete Lining 300 mm
6.3.2. Connecting Tunnel-II
Size of Tunnel 12 m x 9 m (D Shaped)
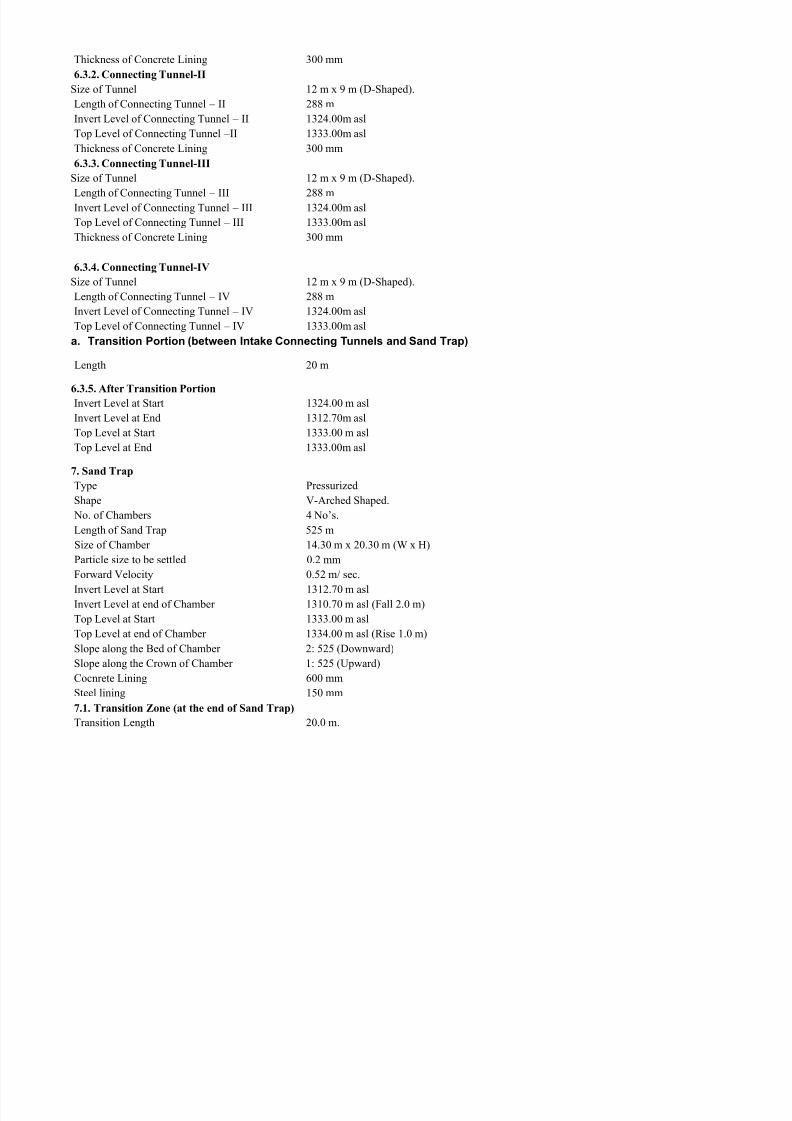
7/24/2019 02-FINAL PC-I JULY,2014.pdf
http://slidepdf.com/reader/full/02-final-pc-i-july2014pdf 65/141
Size of Tunnel 12 m x 9 m (D-Shaped).
Length of Connecting Tunnel – II 288 m
Invert Level of Connecting Tunnel – II 1324.00m asl
Top Level of Connecting Tunnel – II 1333.00m asl
Thickness of Concrete Lining 300 mm
6.3.3. Connecting Tunnel-III
Size of Tunnel 12 m x 9 m (D-Shaped).
Length of Connecting Tunnel – III 288 m
Invert Level of Connecting Tunnel – III 1324.00m aslTop Level of Connecting Tunnel – III 1333.00m asl
Thickness of Concrete Lining 300 mm
6.3.4. Connecting Tunnel-IV
Size of Tunnel 12 m x 9 m (D-Shaped).
Length of Connecting Tunnel – IV 288 m
Invert Level of Connecting Tunnel – IV 1324.00m asl
Top Level of Connecting Tunnel – IV 1333.00m asl
a. Transition Portion (between Intake Connecting Tunnels and Sand Trap)
Length 20 m
6.3.5. After Transition Portion
Invert Level at Start 1324.00 m aslInvert Level at End 1312.70m asl
Top Level at Start 1333.00 m asl
Top Level at End 1333.00m asl
7. Sand Trap
Type Pressurized
Shape V-Arched Shaped. No. of Chambers 4 No’s.
Length of Sand Trap 525 m
Size of Chamber 14.30 m x 20.30 m (W x H)
i l i b l d
Invert Level at Start 1310.70 m asl
Invert Level at End 1319.85 m asl
Top Level at Start 1334 00 m asl
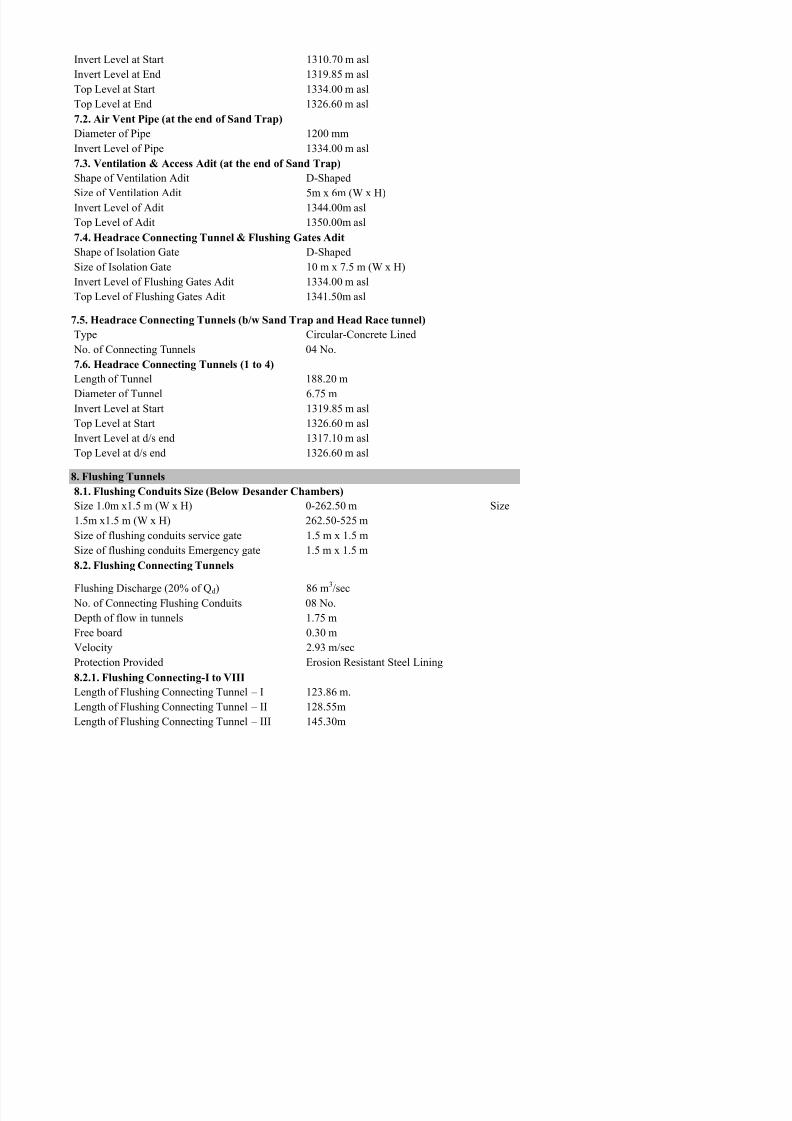
7/24/2019 02-FINAL PC-I JULY,2014.pdf
http://slidepdf.com/reader/full/02-final-pc-i-july2014pdf 66/141
Top Level at Start 1334.00 m asl
Top Level at End 1326.60 m asl
7.2. Air Vent Pipe (at the end of Sand Trap)
Diameter of Pipe 1200 mm
Invert Level of Pipe 1334.00 m asl
7.3. Ventilation & Access Adit (at the end of Sand Trap)
Shape of Ventilation Adit D-Shaped
Size of Ventilation Adit 5m x 6m (W x H)
Invert Level of Adit 1344.00m aslTop Level of Adit 1350.00m asl
7.4. Headrace Connecting Tunnel & Flushing Gates Adit
Shape of Isolation Gate D-Shaped
Size of Isolation Gate 10 m x 7.5 m (W x H)
Invert Level of Flushing Gates Adit 1334.00 m asl
Top Level of Flushing Gates Adit 1341.50m asl
7.5. Headrace Connecting Tunnels (b/w Sand Trap and Head Race tunnel)
Type Circular-Concrete Lined
No. of Connecting Tunnels 04 No.
7.6. Headrace Connecting Tunnels (1 to 4)
Length of Tunnel 188.20 m
Diameter of Tunnel 6.75 m
Invert Level at Start 1319.85 m asl
Top Level at Start 1326.60 m asl
Invert Level at d/s end 1317.10 m asl
Top Level at d/s end 1326.60 m asl
8. Flushing Tunnels
8.1. Flushing Conduits Size (Below Desander Chambers)
Size 1.0m x1.5 m (W x H) 0-262.50 m Size
1.5m x1.5 m (W x H) 262.50-525 m
Size of flushing conduits service gate 1.5 m x 1.5 m
Size of flushing conduits Emergency gate 1.5 m x 1.5 m
Length of Flushing Connecting Tunnel – IV 153.58 m
Length of Flushing Connecting Tunnel – V 174.84 m
Length of Flushing Connecting Tunnel – VI 182 57 m
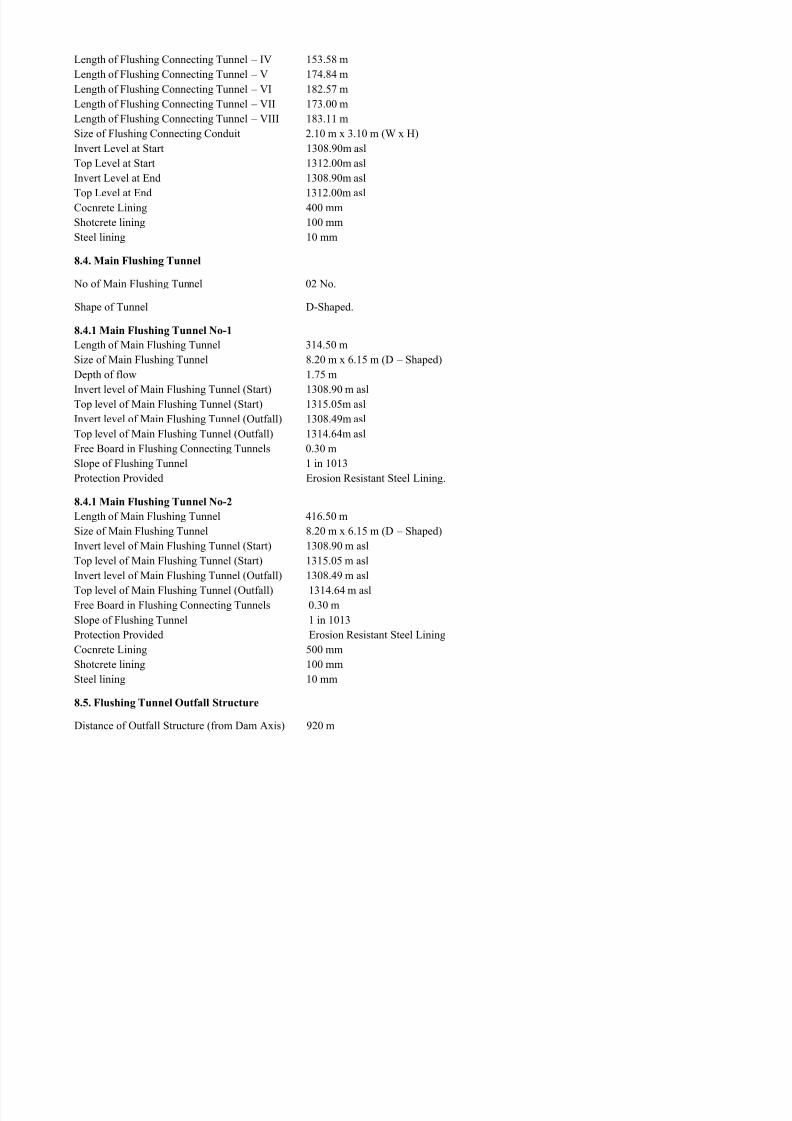
7/24/2019 02-FINAL PC-I JULY,2014.pdf
http://slidepdf.com/reader/full/02-final-pc-i-july2014pdf 67/141
Length of Flushing Connecting Tunnel VI 182.57 m
Length of Flushing Connecting Tunnel – VII 173.00 m
Length of Flushing Connecting Tunnel – VIII 183.11 m
Size of Flushing Connecting Conduit 2.10 m x 3.10 m (W x H)
Invert Level at Start 1308.90m asl
Top Level at Start 1312.00m asl
Invert Level at End 1308.90m asl
Top Level at End 1312.00m asl
Cocnrete Lining 400 mmShotcrete lining 100 mm
Steel lining 10 mm
8.4. Main Flushing Tunnel
No of Main Flushing Tunnel 02 No.
Shape of Tunnel D-Shaped.
8.4.1 Main Flushing Tunnel No-1
Length of Main Flushing Tunnel 314.50 m
Size of Main Flushing Tunnel 8.20 m x 6.15 m (D – Shaped)
Depth of flow 1.75 m
Invert level of Main Flushing Tunnel (Start) 1308.90 m asl
Top level of Main Flushing Tunnel (Start) 1315.05m aslInvert level of Main Flushing Tunnel (Outfall) 1308.49m asl
Top level of Main Flushing Tunnel (Outfall) 1314.64m asl
Free Board in Flushing Connecting Tunnels 0.30 m
Slope of Flushing Tunnel 1 in 1013
Protection Provided Erosion Resistant Steel Lining.
8.4.1 Main Flushing Tunnel No-2Length of Main Flushing Tunnel 416.50 m
Size of Main Flushing Tunnel 8.20 m x 6.15 m (D – Shaped)
Invert level of Main Flushing Tunnel (Start) 1308.90 m asl
River Bed level at Outfall 1300.00m asl
Invert Level of Outfall at Start 1308.49m asl
Invert Level of Outfall at End 1296.26m asl

7/24/2019 02-FINAL PC-I JULY,2014.pdf
http://slidepdf.com/reader/full/02-final-pc-i-july2014pdf 68/141
Invert Level of Outfall at End 1296.26m asl
Thickness of Concrete Floor at Start 0.50 m
Slope of Chute 1V:2H
Thickness of Chute floor 0.60 m.
Height of Baffle Blocks 1.27 m
Top Width of Baffle Blocks 0.25 m
Cut-off Wall Depth (Downstream) 3 m
Length of Concrete Block Apron 4.5 m
Length of Riprap Apron 10 m
9. Headrace Tunnel
Type Horseshoe, Reinforced Concrete Lined.
No of Headrace Tunnels 02 No.
Average length of tunnel 10,214 m
Diameter 9.50 m (Area = 70.85 m2)
Tunnel Slope 1:1000
Tunnel Invert Level (at the Start) 1317.10 m asl
Tunnel Invert Level (at the End) 1306.92 m asl
Tunnel Top Level (at the Start) 1326.60 m asl
Tunnel Top Level (at the End) 1316.40 m asl
Velocity in Tunnel 3.03 m/secRCC lining 500 mm
Shotcrete Thickness 120 mm
10. Surge Shaft
Type Reinforced Concrete Lined.
No of Surge Tanks 2 No’s.
Height 79 m
Invert Elevation 1316.42 m asl
Top Elevation 1381.24 m asl
RCC Lining 600 mm
Steel Lining 20 mm
Shotcrete Thickness 100 mm

7/24/2019 02-FINAL PC-I JULY,2014.pdf
http://slidepdf.com/reader/full/02-final-pc-i-july2014pdf 69/141
12. PenstockType Mild Steel (Circular)
Length 78.00 m
Invert Level of Penstock (Start) 1224.24 m asl
Invert Level of Penstock (End) 1222.47 m asl
Slope of Penstock 3 %
Diameter 6.50 m (Area =33.17 m2
)Velocity 6.48 m/sec
RCC Lining 600 mm
Steel Lining 18 mm
13. Manifold
Type Circular Steel
Length of Manifold 28 m No. 4 No.
Diameter 4.00 m
Velocity in Main Manifold 8.56 m/sec.
14. Draft Tube (Downstream of Turbine)
Length of Chamber 49.60 m
Size of Gate chamber 6.00 x 7.00 m (WxH)Invert Level of Stop log chamber 1237.50 m asl.
Invert of Draft tube at end 1217.10 m asl.
Length of Transition at the end of Draft tube 13.40 m.
15. Tailrace Tunnel and Channel
15.1. Tailrace Tunnel
Type D-Shaped No. of Tailrace Tunnels 04 No’s.
Average length of tunnel 3980 m
Width of Tunnel 7.0 m.
i h f l
15.2. Tailrace Channel (Earthern Lined)
Type Concrete Lined.
Length of Channel ` 282 m.

7/24/2019 02-FINAL PC-I JULY,2014.pdf
http://slidepdf.com/reader/full/02-final-pc-i-july2014pdf 70/141
Bed Width of Channel 74 m.
Depth of Flow 5 m.
Free Board varies as per site.
Side Slope of Channel 2 H: 1V
Slope of Channel 1 in 969
Invert Level (at Start) 1226.38 m asl
Top Level (at Start) 1232.88m asl
17. Power House
Powerhouse Type Under Ground
Dimensions 113 m x24 m x 35 m (L x W x H)
Type of Turbine Francis (Vertical Shaft)
No of Units 4 No’s.
Design Discharge 430 m3/sec
Design Discharge (each Unit) 107.50 m
3
/secPower Output (each Unit) 94.25 MW
River Bed Level (Chitral River) 1225.51 m asl
Turbine Axis Elevation 1225.72 m asl
Maximum Flood Water Elevation 1238.00 m asl
Minimum Tail Water Elevation (Half discharge) 1229.22 m asl
Minimum Tail Water Elevation (4 Units) 1231.00 m asl
Minimum Tail Water Elevation (50 % of 1turbine) 1227.72 m aslGross Head 109.28 m
Head Loss 9.12 m
Net Head 100.16 m
Installed Capacity 377 MW.

7/24/2019 02-FINAL PC-I JULY,2014.pdf
http://slidepdf.com/reader/full/02-final-pc-i-july2014pdf 71/141
TABLES
TABLE-7.1
Breakdown of Project Base Cost and Total Cost Estimates
Gahrait Swir Lasht Hydropower Project
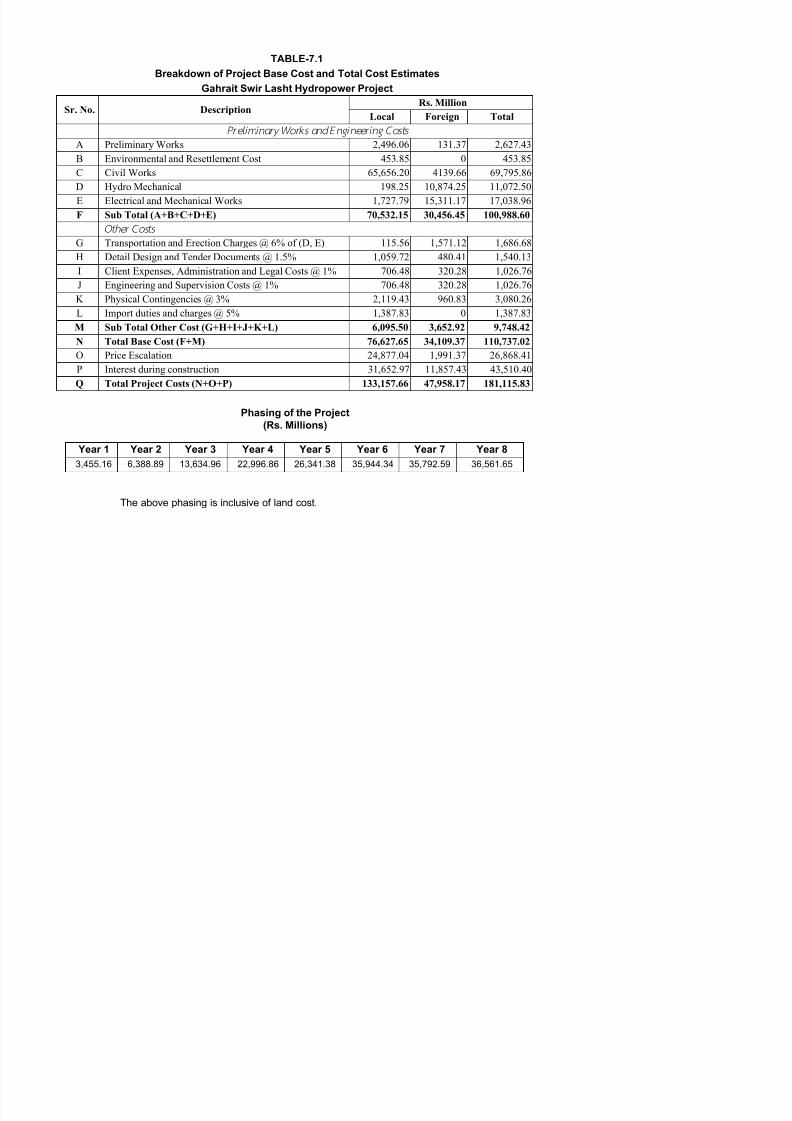
7/24/2019 02-FINAL PC-I JULY,2014.pdf
http://slidepdf.com/reader/full/02-final-pc-i-july2014pdf 72/141
Sr. No. Description
Rs. Million
Local Foreign Total
Preliminary Works and Engineer ing Costs
A Preliminary Works 2,496.06 131.37 2,627.43
B Environmental and Resettlement Cost 453.85 0 453.85
C Civil Works 65,656.20 4139.66 69,795.86
D Hydro Mechanical 198.25 10,874.25 11,072.50
E Electrical and Mechanical Works 1,727.79 15,311.17 17,038.96
F Sub Total (A+B+C+D+E) 70,532.15 30,456.45 100,988.60
Other Costs
G Transportation and Erection Charges @ 6% of (D, E) 115.56 1,571.12 1,686.68
H Detail Design and Tender Documents @ 1.5% 1,059.72 480.41 1,540.13
I Client Expenses, Administration and Legal Costs @ 1% 706.48 320.28 1,026.76
J Engineering and Supervision Costs @ 1% 706.48 320.28 1,026.76
K Physical Contingencies @ 3% 2,119.43 960.83 3,080.26
L Import duties and charges @ 5% 1,387.83 0 1,387.83
M Sub Total Other Cost (G+H+I+J+K+L) 6,095.50 3,652.92 9,748.42
N Total Base Cost (F+M) 76,627.65 34,109.37 110,737.02
O Price Escalation 24,877.04 1,991.37 26,868.41
P Interest during construction 31,652.97 11,857.43 43,510.40
Q Total Project Costs (N+O+P) 133,157.66 47,958.17 181,115.83
Phasing of the Project
(Rs. Millions)
Year 1 Year 2 Year 3 Year 4 Year 5 Year 6 Year 7 Year 8
3,455.16 6,388.89 13,634.96 22,996.86 26,341.38 35,944.34 35,792.59 36,561.65
The above phasing is inclusive of land cost.
Sheet 1 of 1
(Price Index April 30th 2014)
1 US$ = Rs. 98.56
LOCAL FOREIGN
Pak Rs. Pak Rs. Pak Rs. US$
I Preliminary Works
GAHRAIT-SWIR LASHT HYDROPOWER PROJECT (377MW)
SUMMARY OF PRELIMINARY COST ESTIMATE
Sr.
No.DESCRIPTION
TOTAL
TABLE - 7.2

7/24/2019 02-FINAL PC-I JULY,2014.pdf
http://slidepdf.com/reader/full/02-final-pc-i-july2014pdf 73/141
I Preliminary Works
I -1 Access Roads with ancil lar ies to the Main Works Sites 1 ,900,000,000 100,000,000 2,000,000,000 20,292,208
I-2 Camps and Housing/ Employer Facilities (Refer: Table-16.16) 596,056,125 31,371,375 627,427,500 6,365,945
I-3Environmental Mitigation Cost
(Refer: Table-14.29, Chapter:14 of Main Report) 431,878,850 - 431,878,850 4,381,888
I-4Land Acquisition and Compensation Cost
(Refer: Table-14.29, Chapter:14 of Main Report) 21,970,000 - 21,970,000 222,910
I-5 Fish Ladder (Refer: Table-16.14) 57,162,123 3,755,561 60,917,684 618,077
Sub Total I 2,949,904,975 131,371,375 3,081,276,350 31,262,951
II Civil Works
II-1Coffer Dams, Boulder Trap and Diversion / Spillway Tunnels
(Refer: Table-16.02)
2,953,592,137 154,838,842 3,108,430,979 31,538,464
II-2 Asphaltic Concrete Face Rockfil l Dam (Refer: Table-16.03) 722,835,661 10,955,992 733,791,653 7,445,126
II-3 Power Intake (Refer: Table-16.04) 824,729,703 45,261,076 869,990,779 8,827,017
II-4Connecting tunnel from Power intake to Desanders
(Refer: Table-16.05) 1,810,970,431 108,036,978 1,919,007,409 19,470,449
II-5 Desander Chambers (Refer: Table-16.06) 9,294,898,822 564,546,632 9,859,445,454 100,034,958
II-6 Flushing Arrangement (Refer: Table-16.07) 2,811,622,491 68,558,231 2,880,180,722 29,222,613
II-7 Connecting Tunnel to Headrace (Refer: Table-16.08) 501,841,997 31,376,801 533,218,798 5,410,093
II-8 Headrace/ Power Tunnel (Refer: Table-16.09) 31,612,124,040 2,212,845,021 33,824,969,061 343,191,650
II-9 Surge Shaft (Refer: Table-16.10) 367,645,035 18,139,877 385,784,912 3,914,214
II-10 Pressure Shaft (Refer: Table-16.11) 325,983,027 27,448,365 353,431,392 3,585,952
II-11 Penstock and Manifold (Refer: Table-16.12) 408,026,637 34,598,506 442,625,143 4,490,921II-12 Powerhouse and Transformer Cavern (Refer: Table-16.13) 3,701,412,096 222,707,070 3,924,119,166 39,814,521
II-13 Tailrace Tunnels + Collecting Chamber (Refer: Table-16.15) 10,320,493,772 640,344,737 10,960,838,509 111,209,806
Sub Total II 65,656,175,849 4,139,658,128 69,795,833,977 708,155,784
Total for Civil Works (I+II) 68,606,080,824 4,271,029,503 72,877,110,327 739,418,735
IIIElectrical and Mechanical Works
(Refer: Table-16.17)
III-1 Hydraulic Steel Works 62,500,000 1,187,500,000 1,250,000,000 12,682,630
III-2 Hydro-Mechanical Equipment - 7,107,500,000 7,107,500,000 72,113,433
III-3 Power House Mechanical Works 135,750,000 2,579,250,000 2,715,000,000 27,546,672
III-4 Power House Electrical Works 320,000,000 9,680,000,000 10,000,000,000 101,461,039
III-5 Sub-station / Switchyard (500 KV), (Including Civil Works) 1,407,791,616 5,631,166,464 7,038,958,080 71,418,000
III-6 Transmission Line Works (Not included in project cost) - - - -
III-7 Interconnection Works (Not included in project cost) - - - -
III-8 Transportation and Erection Charges 115,562,497 1,571,124,988 1,686,687,485 17,113,306
Sub Total (E & M) III (III-1 to III-8) 2,041,604,113 27,756,541,452 29,798,145,565 302,335,080
Sub Total I, II & III 70,647,684,937 32,027,570,955 102,675,255,892 1,041,753,815
IV Detailed Design and Tender Documents @ 1.5% 1,059,715,274.06 480,413,564.33 1,540,128,838 15,626,307
V Cl ient Expenses, Administra tion and Legal Costs @ 1% 706,476,849.37 320,275,709.55 1,026,752,559 10,417,538
VI Engineering and Supervision Costs @ 1% 706,476,849.37 320,275,709.55 1,026,752,559 10,417,538
VII Contingencies @ 3% 2,119,430,548.11 960,827,128.65 3,080,257,677 31,252,614
VIII Duties & Taxes Costs of E&M Cost @ 5% 1,387,827,072.60 - 1,387,827,073 14,081,038
IX TOTAL BASE COST 76,627,611,531 34,109,363,067 110,736,974,598 1,123,548,850
Rate Local Foreign Total Amount
(PKR) (PKR) (PKR) (PKR)
GAHRAIT-SWIR LASHT HYDROPOWER PROJECT (377MW)
COST ESTIMATE - CIVIL WORKS - AFRD OPTION
Sr. No Description of Activities Unit Quantity
TABLE - 7.3
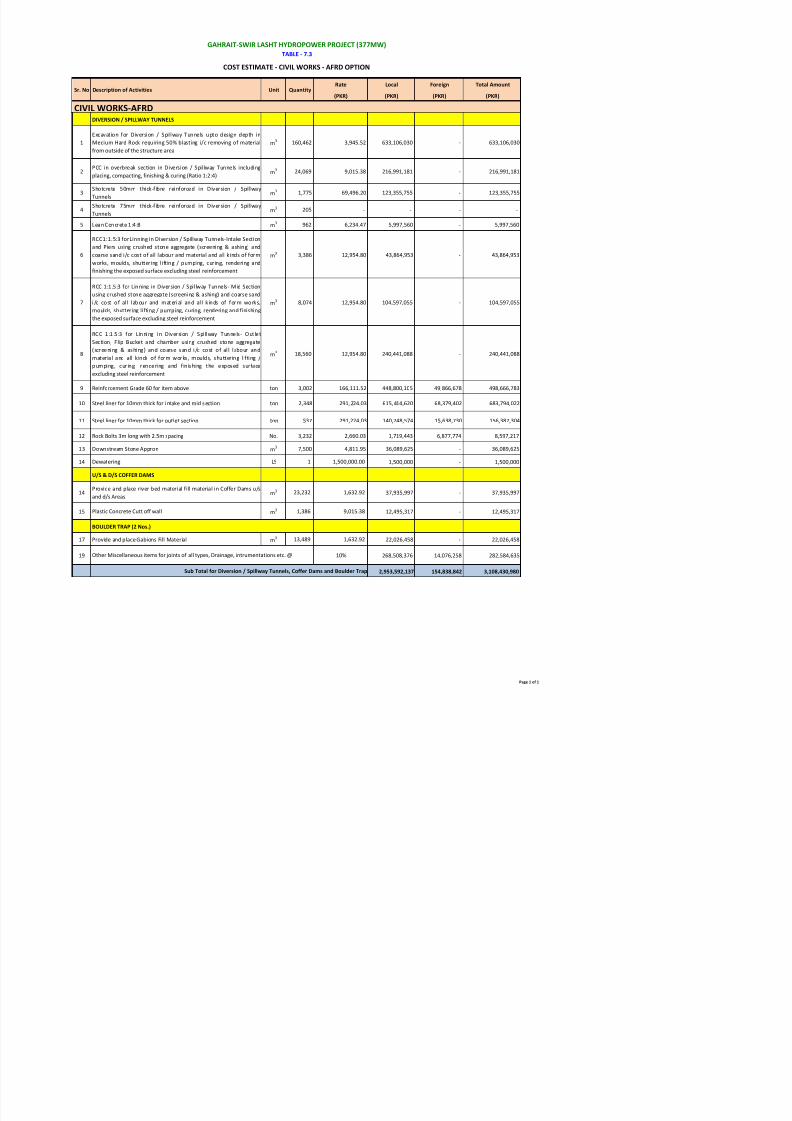
7/24/2019 02-FINAL PC-I JULY,2014.pdf
http://slidepdf.com/reader/full/02-final-pc-i-july2014pdf 74/141
DIVERSION / SPILLWAY TUNNELS
1
Excavation for Diversion / Spillway Tunnels upto design depth in
Medium Hard Rock requiring 50% blasting i/c removing of material
from outside of the structure area
m3 160,462 3,945.52 633,106,030 - 633,106,030
2PCC in overbreak section in Diversion / Spillway Tunnels including
placing, compacting, finishing & curing (Ratio 1:2:4)m
3 24,069 9,015.38 216,991,181 - 216,991,181
3Shotcrete 50mm thick-fibre reinforced in Diversion / Spillway
Tunnelsm
3 1,775 69,496.20 123,355,755 - 123,355,755
4Shotcrete 75mm thick-fibre reinforced in Diversion / Spillway
Tunnels m
3 205 - - - -
5 Lean Concrete 1:4:8 m3 962 6,234.47 5,997,560 - 5,997,560
6
RCC1:1.5:3 forLinning in Diversion / Spillway Tunnels-Intake Section
and Piers using crushed stone aggregate (screening & ashing) and
coarse sand i/c cost of all labour and material and all kinds of form
works, moulds, shuttering lifting / pumping, curing, rendering and
finishing the exposed surface excluding steel reinforcement
m3 3,386 12,954.80 43,864,953 - 43,864,953
7
RCC 1:1.5:3 for Linning in Diversion / Spillway Tunnels- Mid Section
using crushed stone aggregate (screening & ashing) and coarse sand
i/c cost of al l labour and material and al l k inds of form works,
moulds, shuttering lifting / pumping, curing, rendering and finishingthe exposed surface excluding steel reinforcement
m3 8,074 12,954.80 104,597,055 - 104,597,055
8
RCC 1:1.5:3 for L inning in Diversion / Spi llway Tunnels- Outlet
Section, Flip Bucket and chamber using crushed stone aggregate
(screening & ashing) and coarse sand i/c cost of al l labour and
material and all kinds of form works, moulds, shuttering lifting /
pumping, curing, rendering and finishing the exposed surface
excluding steel reinforcement
m3 18,560 12,954.80 240,441,088 - 240,441,088
9 Reinforcement Grade 60 for item above ton 3,002 166,111.52 448,800,105 49,866,678 498,666,783
10 Steel liner for 10mm thick for i ntake and mid s ection ton 2,348 291, 224.03 615, 414,620 68,379,402 683,794,022
11 Steel liner for 10mm thick for outlet section ton 537 291,224.03 140,748,574 15,638,730 156,387,304
12 Rock Bolts 3m long with 2.5m spacing No. 3,232 2,660.03 1,719,443 6,877,774 8,597,217
13 Downstream Stone Appron m3 7,500 4,811.95 36,089,625 - 36,089,625
14 Dewatering LS 1 1,500,000.00 1,500,000 - 1,500,000
U/S & D/S COFFER DAMS
14Provide and place river bed material fill material in Coffer Dams u/s
and d/s Areasm
3 23,232 1,632.92 37,935,997 - 37,935,997
15 Plastic Concrete Cutt off wall m3 1,386 9,015.38 12,495,317 - 12,495,317
BOULDER TRAP (2 Nos.)
17 Provide and place Gabions Fill Material m3 13,489 1,632.92 22,026,458 - 22,026,458
19 10% 268 508 376 14 076 258 282 584 635Other Miscellaneous items for joints of all types Drainage intrumentations etc @
CIVIL WORKS-AFRD
Rate Local Foreign Total Amount
(PKR) (PKR) (PKR) (PKR)
GAHRAIT-SWIR LASHT HYDROPOWER PROJECT (377MW)
COST ESTIMATE - CIVIL WORKS - AFRD OPTION
Sr. No Description of Activities Unit Quantity
TABLE - 7.4

7/24/2019 02-FINAL PC-I JULY,2014.pdf
http://slidepdf.com/reader/full/02-final-pc-i-july2014pdf 75/141
1 Clearing and Grubbing of Area 300m upstream of Dam m2 33,000 30.98 1,022,340 - 1,022,340
2
Excavation forcore trenchof DamEmbankment / Spillway / Intake& Outlet
Structure and Irrigation System upto design depth in Medium Hard Rock
requir ing 50% blasting i/c removing of material f rom outside of the
structure area
m3 71,830 1,254.79 81,118,409 9,013,157 90,131,566
3 Foundation Treatment LS 1 2,500,000.00 2,500,000 - 2,500,000
4 Lean Concrete 1:4:8 m3 1,199 6,234.47 7,475,130 - 7,475,130
5 AFRD
5.1 SEAL COAT 2mm m2 7,437 732.00 5,443,884 - 5,443,884
5.2 Upper Impervious layer (10cm) m3 744 38,697.56 28,790,985 - 28,790,985
5.3 Drainage Layer (8cm) m3 595 1,106.44 658,332 - 658,332
5.4 Lower Impervious layer (5cm) m3 372 38,697.56 14,395,492 - 14,395,492
5.5 Bedding layer (10cm) m3 744 885.15 658,552 - 658,552
6 Zone 1A, Fine-Grained Cohesionless Silt and Fine Sand m3 2,464 1,073.65 2,645,474 - 2,645,474
7 Zone 1B, Random Mix of Silt, Clays, Grovels and Cobbles m3 4,064 961.36 3,906,967 - 3,906,967
8 Zone 2A, Sand and Gravel Filter m3 1,059 1,258.21 1,332,444 - 1,332,444
9Zone 2B, Sand and Crusher Run Particles Nearly in
Quality Equal to Concrete Aggregate m3 1,644 2,372.25 3,899,979 - 3,899,979
10 Zone 3A, Slected Rock fill With Maximum Size of 150mm m3 36,847 207.40 7,642,068 - 7,642,068
11 Zone 3B, Rock fill With Maximum Size of 500mm m3 138,743 581.94 80,740,101 - 80,740,101
12 Zone 3c, Rock fill With Maximum Size of 1000mm m3 93,440 960.14 89,715,482 - 89,715,482
13 Down stream Slope Protection m3 9,101 4,811.95 43,793,557 - 43,793,557
14 Dewatering LS 1 60,000,000 60,000,000 - 60,000,000
15 Parapet Wall m3 574 12,954.80 7,436,055 - 7,436,055
16 Reinforcement Grade 60 in Linning ton 57 166,111.52 8,521,521 946,836 9,468,357
17 Plastic Concrete Cutt off wall m3 6,148 9,015.38 55,426,556 - 55,426,556
18 Compaction Grouting LS 1 100,000,000 100,000,000 - 100,000,000
19 Curtain Grouting LS 1 50,000,000 50,000,000 - 50,000,000
20 10% 65,712,332.80 995,999.30 66,708,332.10
722,835,661 10,955,992 733,791,653
CIVIL WORKS-AFRDASPHALTIC CONCRETE FACE ROCKFILL DAM
Miscellaneous for joints of all types, Drainage, Architectural details, finishes etc. @
Sub Total for Dam
Rate Local Foreign Total Amount
(PKR) (PKR) (PKR) (PKR)
GAHRAIT-SWIR LASHT HYDROPOWER PROJECT (377MW)
COST ESTIMATE - CIVIL WORKS - AFRD OPTION
Sr. No Description of Activities Unit Quantity
TABLE - 7.5
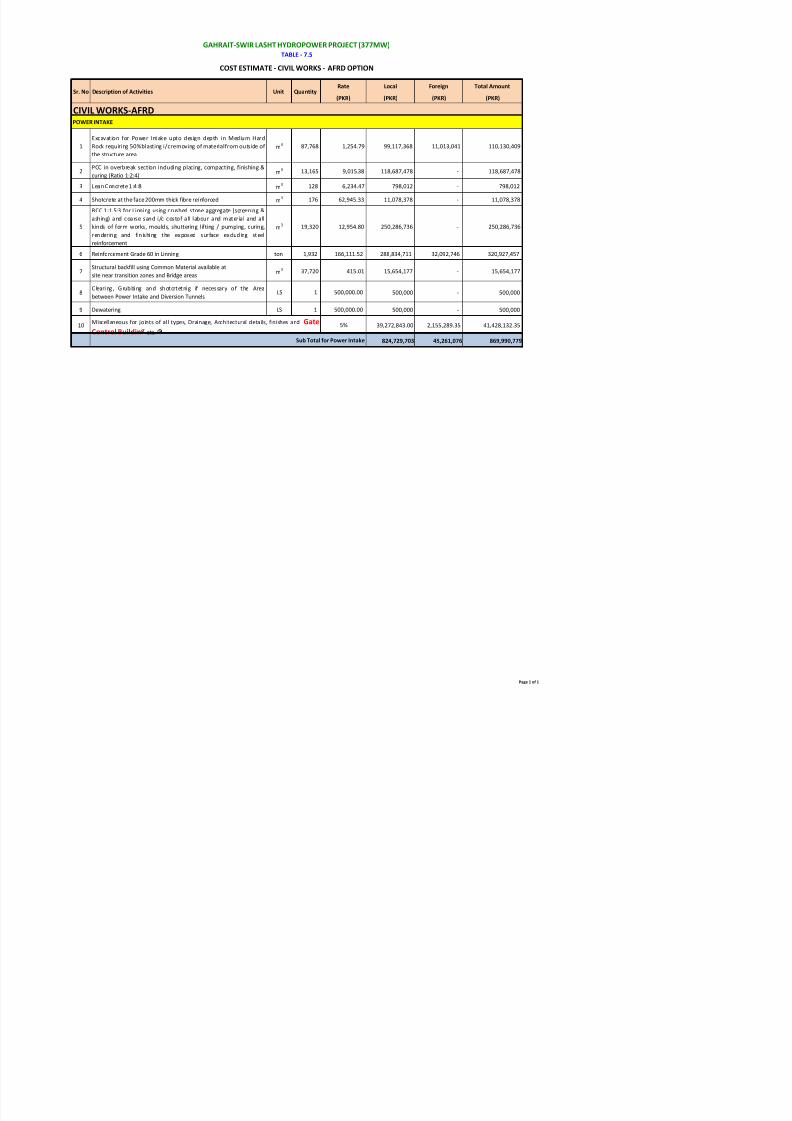
7/24/2019 02-FINAL PC-I JULY,2014.pdf
http://slidepdf.com/reader/full/02-final-pc-i-july2014pdf 76/141
1
Excavation for Power Intake upto design depth in Medium Hard
Rock requiring 50%blasting i/cremoving of materialfrom outside of
the structure area
m3 87,768 1,254.79 99,117,368 11,013,041 110,130,409
2PCC in overbreak section including placing, compacting, finishing &
curing (Ratio 1:2:4)m
3 13,165 9,015.38 118,687,478 - 118,687,478
3 Lean Concrete 1:4:8 m3 128 6,234.47 798,012 - 798,012
4 Shotcrete at the face 200mm thick fibre reinforced m3 176 62,945.33 11,078,378 - 11,078,378
5
RCC 1:1.5:3 for Linning using crushed stone aggregate (screening &ashing) and coarse sand i/c costof all labour and material and all
kinds of form works, moulds, shuttering lifting / pumping, curing,
render ing and fin ishing the exposed surface excluding steel
reinforcement
m3 19,320 12,954.80 250,286,736 - 250,286,736
6 Reinforcement Grade 60 in Linning ton 1,932 166,111.52 288,834,711 32,092,746 320,927,457
7Structural backfill using Common Material available at
site near transition zones and Bridge areasm
3 37,720 415.01 15,654,177 - 15,654,177
8Clearing, Grubbing and shotcrtetnig if necessary of the Area
between Power Intake and Diversion TunnelsLS 1 500,000.00 500,000 - 500,000
9 Dewatering LS 1 500,000.00 500,000 - 500,000
10 5% 39,272,843.00 2,155,289.35 41,428,132.35
824,729,703 45,261,076 869,990,779
CIVIL WORKS-AFRDPOWER INTAKE
Miscellaneous for joints of all types, Drainage, Architectural details, finishes and Gate
Control Buildin etc.
Sub Total for Power Intake
Rate Local Foreign Total Amount
(PKR) (PKR) (PKR) (PKR)
GAHRAIT-SWIR LASHT HYDROPOWER PROJECT (377MW)
COST ESTIMATE - CIVIL WORKS - AFRD OPTION
Sr. No Description of Activities Unit Quantity
TABLE - 7.6

7/24/2019 02-FINAL PC-I JULY,2014.pdf
http://slidepdf.com/reader/full/02-final-pc-i-july2014pdf 77/141
1
Excavation for Connecting Tunnels to Headrace Tunnel upto design
depth in Medium Hard Rock requiring 50% blasting i/c removing of
material from outside of the structure area
m3 146,705 4,813.53 635,552,027 70,616,892 706,168,919
2PCC in overbreak section including placing, compacting, finishing &
curing (Ratio 1:2:4)m
3 22,006 9,015.38 198,392,452 - 198,392,452
3 Lean Concrete 1:4:8 m3 1,395 6,234.47 8,697,086 - 8,697,086
4 Shotcrete 100mm thick-fibre reinforced m3 5,394 62,945.33 339,527,110 - 339,527,110
5
RCC 1:1.5:3 for Linning using crushed stone aggregate (screening &
ashing) and coarse sand i/c costof all labour and material and all
kinds of form works, moulds, shuttering lifting / pumping, curing,
rendering and fini shing the exposed surface excluding steel
reinforcement
m3 19,428 12,954.80 251,685,854 - 251,685,854
6 Reinforcement Grade 60 in Linning ton 1,943 166,111.52 290,479,215 32,275,468 322,754,683
7 Dewatering LS 1 400,000.00 400,000 - 400,000
8 5% 86,236,687.20 5,144,618.00 91,381,305.20
1,810,970,431 108,036,978 1,919,007,409
CIVIL WORKS-AFRDCONNECTING TUNNELS FROM POWER INTAKE TO DESANDERS
Miscellaneous for joints of all types, Drainage, Architectural details, finishes etc. @
Sub Total for Connecting Tunnel from Power Intake to Desanders
Rate Local Foreign Total Amount
(PKR) (PKR) (PKR) (PKR)
CIVIL WORKS AFRD
GAHRAIT-SWIR LASHT HYDROPOWER PROJECT (377MW)
COST ESTIMATE - CIVIL WORKS - AFRD OPTION
Sr. No Description of Activities Unit Quantity
TABLE - 7.7

7/24/2019 02-FINAL PC-I JULY,2014.pdf
http://slidepdf.com/reader/full/02-final-pc-i-july2014pdf 78/141
1
Excavation for Desanders upto design depth in Medium Hard Rock
requiring 50% blasting i/c removing of material from outside of the
structure area
m3 804,195 4,332.18 3,135,525,746 348,391,750 3,483,917,495
2 Lean Concrete 1:4:8 m3 4,704 6,234.47 29,326,947 - 29,326,947
3PCC in overbreak section including placing, compacting, finishing &
curing (Ratio 1:2:4)m
3 104,895 9,015.38 945,668,285 - 945,668,285
4 Shotcrete 150mm thick-fibre reinforced m3 24,150 62,945.33 1,520,129,720 - 1,520,129,720
5
RCC 1:1.5:3 for Linning using crushed stone aggregate (screening &
ashing) and coarse sand i/c costof all labour and material and all
kinds of form works, moulds, shuttering lifting / pumping, curing,
rendering and fini shing the exposed surface excluding steel
reinforcement
m3 96,579 12,954.80 1,251,161,629 - 1,251,161,629
6
RCC 1:1.5:3 for inspection path incuding railing using crushed stone
aggregate (screening & ashing) and coarse sand i/c costof all labour
and material andall kinds of formworks, moulds, shuttering lifting /
pumping, curing, rendering and finishing the exposed surface
excluding steel reinforcement
m3 2,646 12,954.80 34,278,401 - 34,278,401
7 Reinforcement Grade 60 in L inning and Inspection path ton 9,923 166,111.52 1,483,492,152 164,832,461 1,648,324,613
8 Rock bolts 3m long, with 2.5m spacing No. 11,816 2,660.03 31,430,914 - 31,430,914
9
Stainless Steel Hand Railing (Providing and Fixing angle iron railing,
us ing 2.5"x2.5"x3/8" angle iron post 4.5'long, 5'to 6" apart ,
complete)
m 4,200 4,260.53 17,894,226 - 17,894,226
10 Dewatering LS 1 1,000,000.00 1,000,000 - 1,000,000
11 10% 844,990,802.00 51,322,421.10 896,313,223.00
9,294,898,822 564,546,632 9,859,445,453
Miscellaneous for joints of all types, Drainage, Architectural details, finishes etc @
Sub Total for Desander Chambers
CIVIL WORKS-AFRDDESANDER CHAMBERS
Rate Local Foreign Total Amount
(PKR) (PKR) (PKR) (PKR)
GAHRAIT-SWIR LASHT HYDROPOWER PROJECT (377MW)
COST ESTIMATE - CIVIL WORKS - AFRD OPTION
Sr. No Description of Activities Unit Quantity
TABLE - 7.8
CIVIL WORKS AFRD

7/24/2019 02-FINAL PC-I JULY,2014.pdf
http://slidepdf.com/reader/full/02-final-pc-i-july2014pdf 79/141
1
Excavation for out let gate and Ventilation shaft and Tunnel D
Shaped to Adit upto design depth in Medium Hard Rock requiring
50% blasting i/c removing of material from outside of the structure
area
m3 7,607 4,813.53 32,954,871 3,661,652 36,616,523
2
Excavation for isolation gate shaft upto design depth in Medium
Hard Rock requiring 50% blasting i/c removing of material from
outside of the structure area
m3 340 4,813.53 1,472,940 163,660 1,636,600
3
Excavation for Lift well upto design depth in Medium Hard Rock
requiring 50% blasting i/c removing of material from outside of the
structure area
m3 2,154 4,813.53 9,331,510 1,036,834 10,368,344
4Excavation for Flushing Gate Chamber upto designdepth in MediumHard Rock requiring 50% blasting i/c removing of material from
outside of the structure area
m3 5,876 4,813.53 25,455,872 2,828,430 28,284,302
5
Excavation for IsolationGate Chamber upto design depth in Medium
Hard Rock requiring 50% blasting i/c removing of material from
outside of the structure area
m3 1,591 4,813.53 6,892,493 765,833 7,658,326
6
Excavation for Flushing Tunnel upto design depth in Medium Hard
Rock requiring50% blasting i/c removing of material fromoutside of
the structure area
m3 33,948 4,813.53 147,068,744 16,340,972 163,409,716
7
Excavation for Flushing Outlet upto design depth in Medium Hard
Rock requiring50% blasting i/c removing of material fromoutside of
the structure area
m3 5,086 4,813.53 22,033,453 2,448,161 24,481,614
8PCC in overbreak section including placing, compacting, finishing &
curing (Ratio 1:2:4) m3 8,490 9,015.38 76,540,576 - 76,540,576
9
RCC 1:1.5:3 in walls, bed in flushing outlet using crushed stone
aggregate (screening & ashing) and coarse sand i/c costof all labour
and material andall kinds of formworks, moulds, shuttering lifting /
pumping, curing, rendering and finishing the exposed surface
excluding steel reinforcement
m3 2,199 12,954.80 28,487,605 - 28,487,605
10 Reinforcement Grade 60 in item above ton 220 166,111.52 32,890,081 3,654,453 36,544,534
11 Lean Concrete 1:4:8 m3 1,163 6,234.47 7,250,689 - 7,250,689
12 Shotcrete 35mm thick-fibre reinforced m3 31,240 62,945.33 1,966,412,109 - 1,966,412,109
13 Rock bolts 3m long, with 4m spacing No. 828 2,660.03 2,202,505 - 2,202,505
14 Rock Bolts 4m long with 3m spacing No. 1,323 3,546.73 4,692,324 - 4,692,324
15 Steel liner - Flushing tunnels ton 1,181 291,224.03 309,542,021 34,393,558 343,935,579
16 Rip Rap armouring in outlet area m3 1,050 3,817.06 4,007,913 - 4,007,913
17 Dewatering LS 1 500,000.00 500,000 - 500,000
18 5% 133,886,785.30 3,264,677.65 137,151,462.95
2,811,622,491 68,558,231 2,880,180,722
CIVIL WORKS-AFRDFLUSHING ARRANGEMENT
Miscellaneous for joints of all types, Drainage, Architectural details, finishes etc. @
Sub Total for Flushing Arrangement
Rate Local Foreign Total Amount
(PKR) (PKR) (PKR) (PKR)
CIVIL WORKS AFRD
GAHRAIT-SWIR LASHT HYDROPOWER PROJECT (377MW)
COST ESTIMATE - CIVIL WORKS - AFRD OPTION
Sr. No Description of Activities Unit Quantity
TABLE - 7.9

7/24/2019 02-FINAL PC-I JULY,2014.pdf
http://slidepdf.com/reader/full/02-final-pc-i-july2014pdf 80/141
1
Excavation for Connecting Tunnels to Headrace Tunnel upto design
depth in Medium Hard Rock requiring 50% blasting i/c removing of
material from outside of the structure area
m3 39,546 4,813.53 171,320,271 19,035,586 190,355,857
2PCC in overbreak section including placing, compacting, finishing &
curing (Ratio 1:2:4)m
3 5,932 9,015.38 53,479,234 - 53,479,234
3 Lean Concrete 1:4:8 m3 313 6,234.47 1,951,389 - 1,951,389
4 Shotcrete 50mm thick-fibre reinforced m3 918 62,945.33 57,783,813 - 57,783,813
5
RCC 1:1.5:3 for Linning using crushed stone aggregate (screening &
ashing) and coarse sand i/c costof all labour and material and all
kinds of form works, moulds, shuttering lifting / pumping, curing,
rendering and fini shing the exposed surface excluding steel
reinforcement
m3 6,531 12,954.80 84,607,799 - 84,607,799
6 Reinforcement Grade 60 in Linning ton 653 166,111.52 97,623,741 10,847,082 108,470,823
7 Rock Bolts 4m long with 1.5-2.0m spacing No. 3,039 3,546.73 10,778,512 - 10,778,512
8 Dewatering LS 1 400,000.00 400,000 - 400,000
9 5% 23,897,237.95 1,494,133.40 25,391,371.35
501,841,997 31,376,801 533,218,798
CIVIL WORKS-AFRDCONNECTING TUNNELS TO HEADRACE
Miscellaneous for joints of all types, Drainage, Architectural details, finishes etc. @
Sub Total for Connecting Tunnel to Headrace
Rate Local Foreign Total Amount
(PKR) (PKR) (PKR) (PKR)
GAHRAIT-SWIR LASHT HYDROPOWER PROJECT (377MW)
COST ESTIMATE - CIVIL WORKS - AFRD OPTION
Sr. No Description of Activities Unit Quantity
TABLE - 7.10
CIVIL WORKS-AFRD
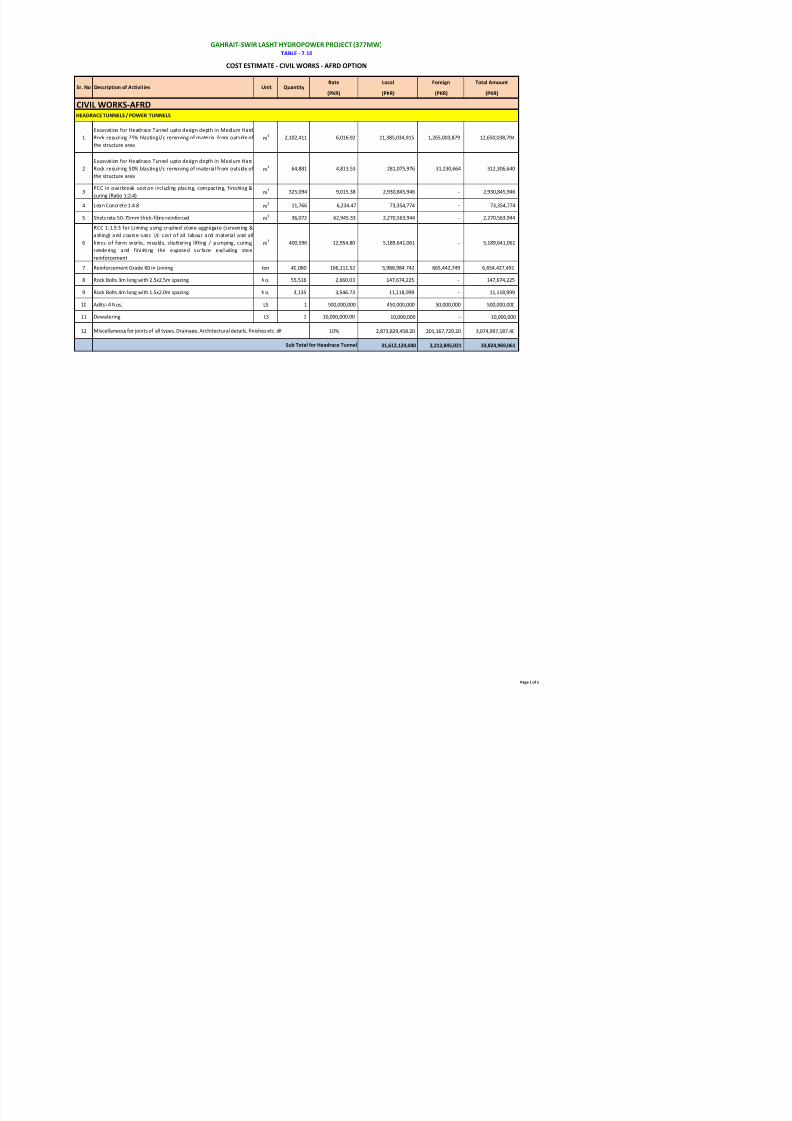
7/24/2019 02-FINAL PC-I JULY,2014.pdf
http://slidepdf.com/reader/full/02-final-pc-i-july2014pdf 81/141
1
Excavation for Headrace Tunnel upto design depth in Medium Hard
Rock requiring 75% blastingi/c removing of material from outside of
the structure area
m3 2,102,411 6,016.92 11,385,034,915 1,265,003,879 12,650,038,794
2
Excavation for Headrace Tunnel upto design depth in Medium Hard
Rock requiring 50% blastingi/c removing of material from outside of
the structure area
m3 64,881 4,813.53 281,075,976 31,230,664 312,306,640
3PCC in overbreak section including placing, compacting, finishing &
curing (Ratio 1:2:4)m
3 325,094 9,015.38 2,930,845,946 - 2,930,845,946
4 Lean Concrete 1:4:8 m3 11,766 6,234.47 73,354,774 - 73,354,774
5 Shotcrete 50-75mm thick-fibre reinforced m3 36,072 62,945.33 2,270,563,944 - 2,270,563,944
6
RCC 1:1.5:3 for Linning using crushed stone aggregate (screening &
ashing) and coarse sand i/c cost of all labour and material and all
kinds of form works, moulds, shuttering lifting / pumping, curing,
rendering and f ini shing the exposed surface excluding steel
reinforcement
m3
400,596 12,954.80 5,189,641,061 - 5,189,641,061
7 Reinforcement Grade 60 in Linning ton 40,060 166,111.52 5,988,984,742 665,442,749 6,654,427,491
8 Rock Bolts 3m long with 2.5x2.5m spacing No. 55,516 2,660.03 147,674,225 - 147,674,225
9 Rock Bolts 4m long with 1.5x2.0m spacing No. 3,135 3,546.73 11,118,999 - 11,118,999
10 Adits (4 Nos.) LS 1 500,000,000 450,000,000 50,000,000 500,000,000
11 Dewatering LS 1 10,000,000.00 10,000,000 - 10,000,000
12 10% 2,873,829,458.20 201,167,729.20 3,074,997,187.40
31,612,124,040 2,212,845,021 33,824,969,061
HEADRACE TUNNELS / POWER TUNNELS
Miscellaneous for joints of all types, Drainage, Architectural details, finishes etc. @
Sub Total for Headrace Tunnel
Rate Local Foreign Total Amount
(PKR) (PKR) (PKR) (PKR)
CIVIL WORKS-AFRD
GAHRAIT-SWIR LASHT HYDROPOWER PROJECT (377MW)
COST ESTIMATE - CIVIL WORKS - AFRD OPTION
Sr. No Description of Activities Unit Quantity
TABLE - 7.11

7/24/2019 02-FINAL PC-I JULY,2014.pdf
http://slidepdf.com/reader/full/02-final-pc-i-july2014pdf 82/141
1
Excavation for Surge Shaft upto design depth in Medium Hard Rock
requiring 50% blasting i/c removing of material from outside of the
structure area
m3 24,192 4,813.53 104,804,026 11,644,892 116,448,918
2PCC in overbreak section including placing, compacting, finishing &
curing (Ratio 1:2:4)m
3 4,838 9,015.38 43,616,408 - 43,616,408
3 Shotcrete 250mm thick-fibre reinforced m3 1,593 62,945.33 100,271,911 - 100,271,911
4
RCC 1:1.5:3 for Linning using crushed stone aggregate (screening &
ashing) and coarse sand i/c costof all labour and material and all
kinds of form works, moulds, shuttering lifting / pumping, curing,
rendering and fini shing the exposed surface excluding steel
reinforcement
m3 3,385 12,954.80 43,851,998 - 43,851,998
5 Reinforcement Grade 60 in Linning ton 339 166,111.52 50,680,625 5,631,181 56,311,805
6 Rock Bolts 3m long with 2.5m spacing No. 2,035 2,660.03 5,413,161 - 5,413,161
8 Consolidation Grouting after Concrete Lining LS 1 1,000,000.00 1,000,000 - 1,000,000
9 Dewatering LS 1 500,000.00 500,000 - 500,000
10 5% 17,506,906.45 863,803.65 18,370,710.05
367,645,035 18,139,877 385,784,911
CIVIL WORKS AFRDSURGE SHAFTS
Miscellaneous for joints of all types, Drainage, Architectural details, finishes etc. @
Sub Total for Surge Shaft
Rate Local Foreign Total Amount
(PKR) (PKR) (PKR) (PKR)
CIVIL WORKS-AFRD
GAHRAIT-SWIR LASHT HYDROPOWER PROJECT (377MW)
COST ESTIMATE - CIVIL WORKS - AFRD OPTION
Sr. No Description of Activities Unit Quantity
TABLE - 7.12

7/24/2019 02-FINAL PC-I JULY,2014.pdf
http://slidepdf.com/reader/full/02-final-pc-i-july2014pdf 83/141
1
Excavation for Pressure Shaft upto design depth in Medium Hard
Rock requiring50% blasting i/c removing of material fromoutside of
the structure area
m3 10,391 4,813.53 45,015,651 5,001,739 50,017,390
2PCC in overbreak section including placing, compacting, finishing &
curing (Ratio 1:2:4)m
3 1,559 9,015.38 14,054,977 - 14,054,977
3 Shotcrete 100mm thick-fibre reinforced m3 450 62,945.33 28,325,399 - 28,325,399
4
RCC 1:1.5:3 for Linning using crushed stone aggregate (screening &
ashing) and coarse sand i/c costof all labour and material and all
kinds of form works, moulds, shuttering lifting / pumping, curing,
rendering and fini shing the exposed surface excluding steel
reinforcement
m3 2,467 12,954.80 31,959,492 - 31,959,492
5 Reinforcement Grade 60 in Linning ton 247 166,111.52 36,926,591 4,102,955 41,029,545
6 Steel liner for Pressure Shaft 18mm thick ton 585 291,224.03 153,329,452 17,036,606 170,366,058
7 Rock Bolts 3m long with 6m spacing No. 131 2,660.03 348,464 - 348,464
8 Dewatering LS 1 500,000.00 500,000 - 500,000
9 5% 15,523,001.30 1,307,065.00 16,830,066.25
325,983,027 27,448,365 353,431,391
PRESSURE SHAFTS
Miscellaneous for joints of all types, Drainage, Architectural details, finishes etc. @
Sub Total for Pressure Shaft
Rate Local Foreign Total Amount
(PKR) (PKR) (PKR) (PKR)
GAHRAIT-SWIR LASHT HYDROPOWER PROJECT (377MW)
COST ESTIMATE - CIVIL WORKS - AFRD OPTION
Sr. No Description of Activities Unit Quantity
TABLE - 7.13
CIVIL WORKS-AFRD

7/24/2019 02-FINAL PC-I JULY,2014.pdf
http://slidepdf.com/reader/full/02-final-pc-i-july2014pdf 84/141
1
Excavation for Penstock and Mani folds upto des ign depth in
Medium Hard Rock requiring 50% blasting i/c removing of material
from outside of the structure area
m3 11,808 4,813.53 51,154,346 5,683,816 56,838,162
2PCC in overbreak section including placing, compacting, finishing &
curing (Ratio 1:2:4)m
3 1,771 9,015.38 15,966,238 - 15,966,238
3 Shotcrete 100mm thick-fibre reinforced m3 646 62,945.33 40,662,683 - 40,662,683
4
RCC 1:1.5:3 for Linning using crushed stone aggregate (screening &
ashing) and coarse sand i/c costof all labour and material and all
kinds of form works, moulds, shuttering lifting / pumping, curing,
rendering and fini shing the exposed surface excluding steel
reinforcement
m3 2,671 12,954.80 34,602,271 - 34,602,271
5 Reinforcement Grade 60 in Linning ton 267 166,111.52 39,916,598 4,435,178 44,351,776
Steel liner for Penstock 18mm thick ton 784 291,224.03 205,487,676 22,831,964 228,319,640
6 Rock Bolts 3m long with 6m spacing No. 153 2,660.03 406,985 - 406,985
7 Dewatering LS 1 400,000.00 400,000 - 400,000
8 5% 19,429,839.85 1,647,547.90 21,077,387.75
408,026,637 34,598,506 442,625,143
PENSTOCKS AND MANIFOLDS
Miscellaneous for joints of all types, Drainage, Architectural details, finishes etc. @
Sub Total for Penstock and manifolds
Rate Local Foreign Total Amount
(PKR) (PKR) (PKR) (PKR)
GAHRAIT-SWIR LASHT HYDROPOWER PROJECT (377MW)
TABLE - 7.14
COST ESTIMATE - CIVIL WORKS - AFRD OPTION
Sr. No Description of Activities Unit Quantity

7/24/2019 02-FINAL PC-I JULY,2014.pdf
http://slidepdf.com/reader/full/02-final-pc-i-july2014pdf 85/141
1
Excavation for Powerhouse and Transformer Cavern upto design
depth in Hard Rock requiring 75% blasting i/c removing of material
from outside of the structure area
m3 227,715 6,016.92 1,233,128,644 137,014,294 1,370,142,938
2 Lean Concrete 1:4:8 m3 935 5,110.22 4,778,056 - 4,778,056
3 Shotcrete 25mm thick-fibre reinforced m3 1,370 62,945.33 86,235,102 - 86,235,102
4
RCC for Sub structures and around Draft Tubes using crushed stone
aggregate (screening & ashing) and coarse sand i/c cost of all labourandmaterial andall kinds of form works, moulds, shuttering lifting /
pumping, curing, rendering and finishing the exposed surface
excluding steel reinforcement
m3 25,175 9,015.38 226,962,192 - 226,962,192
5
RCC 1:1.5:3 for walls, columns, slabs and floors using crushed stone
aggregate (screening & ashing) and coarse sand i/c cost of all labour
andmaterial andall kinds of form works, moulds, shuttering lifting /
pumping, curing, rendering and finishing the exposed surface
excluding steel reinforcement
m3 34,100 12,954.80 441,758,680 - 441,758,680
6 Reinforcement Grade 60 in Linning ton 3,410 166,111.52 509,796,255 56,644,028 566,440,283
7 Rock Bolts No. 4,500 3,546.73 15,960,285 - 15,960,285
8 Busduct, Cable and Ventilation Tunnel LS 1 500,000,000 500,000,000 - 500,000,000
9 Dewatering LS 1 200,000,000 200,000,000 - 200,000,000
10 15% 482,792,882.10 29,048,748.30 511,841,630.40
3,701,412,096 222,707,070 3,924,119,166
CIVIL WORKS-AFRDUNDER GROUND POWER HOUSE AND TRANSFORMER CAVERN
Miscellaneous for joints of all types, Drainage, Architectural details, finishes etc. @
Sub Total for Powerhouse and Transformer Cavern
Rate Local Foreign Total Amount
(PKR) (PKR) (PKR) (PKR)
CIVIL WORKS-AFRD
GAHRAIT-SWIR LASHT HYDROPOWER PROJECT (377MW)
TABLE - 7.15
COST ESTIMATE - CIVIL WORKS - AFRD OPTION
Sr. No Description of Activities Unit Quantity

7/24/2019 02-FINAL PC-I JULY,2014.pdf
http://slidepdf.com/reader/full/02-final-pc-i-july2014pdf 86/141
1
Excavation for Fish Ladder upto design depth in Medium Hard Rock
requiring 50% blasting i/c removing of material from outside of the
structure area
m3 6,301 1,254.79 7,115,789 790,643 7,906,432
2 Lean Concrete 1:4:8 m3 78 6,234.47 486,289 - 486,289
3
RCC 1:1.5:3 for Retaining and cross wall s us ing crushed stone
aggregate (screening & ashing) and coarse sand i/c costof all labour
and material andall kinds of formworks, moulds, shuttering lifting /
pumping, curing, rendering and finishing the exposed surface
excluding steel reinforcement
m3 1,492 12,954.80 19,328,562 - 19,328,562
4 Reinforcement Grade 60 in Linning ton 149 166,111.52 22,275,554 2,475,062 24,750,616
5 Dewatering LS 1 500,000.00 500,000 - 500,000
6 15% 7,455,929.10 489,855.75 7,945,784.85
57,162,123 3,755,561 60,917,684
FISH LADDER
Miscellaneous for joints of all types, Drainage, Architectural details, finishes etc. @
Sub Total for Fish Ladder
Rate Local Foreign Total Amount
(PKR) (PKR) (PKR) (PKR)
CIVIL WORKS-AFRDWATER COLLECTING CHAMBER TAILRACE TUNNEL & CHANNEL
GAHRAIT-SWIR LASHT HYDROPOWER PROJECT (377MW)
COST ESTIMATE - CIVIL WORKS - AFRD OPTION
Sr. No Description of Activities Unit Quantity
TABLE - 7.16

7/24/2019 02-FINAL PC-I JULY,2014.pdf
http://slidepdf.com/reader/full/02-final-pc-i-july2014pdf 87/141
1
Excavation for Water col lecting Chamber upto design depth in
Medium Hard Rock requiring 50% blasting i/c removing of material
from outside of the structure area
m3 8,191 3,760.57 27,722,546 3,080,283 30,802,829
2
Excavation for Tailrace Tunnel upto design depth in Medium Hard
Rock requiring50% blasting i/c removing of material fromoutside of
the structure area
m3 910,754 3,760.57 3,082,458,753 342,495,417 3,424,954,170
3
Excavation for Outlet Structure and Tailrace Channel upto design
depth in Medium Hard Rock requiring 50% blasting i/c removing of
material from outside of the structure area
m3 265,370 1,254.79 299,685,260 33,298,362 332,983,622
4Shotcrete 50-100mm thick-fibre reinforced (water col lecting
chamber, tailrace tunnel)m
3 36,656 62,945.33 2,307,324,016 - 2,307,324,016
5
RCC 1:1.5:3 for Linning using crushed stone aggregate (screening &
ashing) and coarse sand i/c costof all labour and material and all
kinds of form works, moulds, shuttering lifting / pumping, curing,
rendering and fini shing the exposed surface excluding steel
reinforcement (water collecting chamber, tailrace tunnel)
m3 138,896 12,954.80 1,799,369,901 - 1,799,369,901
6 Reinforcement Grade 60 for item above ton 13,890 166,111.52 2,076,560,112 230,728,901 2,307,289,013
7
RCC 1:1.5:3 in Piers using crushed stone aggregate (screening &
ashing) and coarse sand i/c costof all labour and material and all
kinds of form works, moulds, shuttering lifting / pumping, curing,
rendering and fini shing the exposed surface excluding steel
reinforcement
m3 151 13,691.37 2,067,397 - 2,067,397
8 Reinforcement Grade 60 for item above ton 15 166,111.52 2,242,506 249,167 2,491,673
9
Stainless Steel Hand Railing (Providing and Fixing angle iron railing,
us ing 2.5"x2.5"x3/8" angle iron post 4.5'long, 5'to 6" apart ,
complete) (Water collecting chamber)
m 154 4,260.53 656,122 - 656,122
10 Rock Bolts 4m long with 1.5x2.0m spacing No. 63,708 3,546.73 225,955,075 - 225,955,075
11 Dewatering LS 1 5,000,000.00 5,000,000 - 5,000,000
12 5% 491,452,084.40 30,492,606.50 521,944,690.90
10,320,493,772 640,344,737 10,960,838,509
WATER COLLECTING CHAMBER, TAILRACE TUNNEL & CHANNEL
Miscellaneous for joints of all types, Drainage, Architectural details, finishes etc. @
Sub Total for Water collecting chamber, Tailrace Tunnel and channel
Covered Total
GAHRAIT-SWIR LASHT HYDROPOWER PROJECT (377MW)
TABLE - 7.17
COST ESTIMATE - PRELIMINARY WORKS (I)
Camps and Housing Facilities (I-2)

7/24/2019 02-FINAL PC-I JULY,2014.pdf
http://slidepdf.com/reader/full/02-final-pc-i-july2014pdf 88/141
CoveredArea of
Each
Building
TotalCovered
Area
Plot Size / Unit
(m2) (m
2) (m
2)
Type I 2 235 470 400
Type II 5 135 675 700
Type III – Family Flats
Ground plus two floors consisting four (4)
units per floor
1 500 1,500 1,000
Type IV - Operators Hostel (Bachelor)
Ground plus two floors consisting eight
rooms (8) rooms with attached
bath/Kitchen per floor
1 500 1,500 1,000
Guest House – Double Storey
with 2 bed rooms on ground and 4 bed
rooms on 1st floor
2 280 1,120 700
Mosque 1 500 500 1,000
Hospital (15 Beds) – Double Storey 1 800 1,600 1,500
Shops 8 90 720 1,500
Office – Double Storey 1 230 460 500
College – Double Storey 1 1000 2,000 700
Total 10,545
Additional area for Infrastructure and other
Facilities @ 20% 2,109.00
Additional area for recreational Facilities @ 10% 1,054.50
Total Coverver Area 13,709
Rate Total Amount(PKR) (PKR)
Construction Cost for Buildings 10,545 50,000 527,250,000
Construction Cost for Infrastructure and
Description of Activities Unit Quantity
Type of BuildingNo. of
Buildings
Sheet 1 of 1
Sr. No Description Unit QtyRate
(Pak. Rs.)
Local
Amount
(Pak. Rs.)
Foreign
Amount
(Pak. Rs.)
Total Amount
(Pak. Rs.)
III Electrical and Mechanical Works
III-1 Hydraulic Steel Works
GAHRAIT-SWIR LASHT HYDROPOWER PROJECT (377MW)
TABLE - 7.18
COST ESTIMATE - ELECTRICAL AND MECHANICAL WORKS (III)
Schedules of Rates and Prices (April 30, 2014)
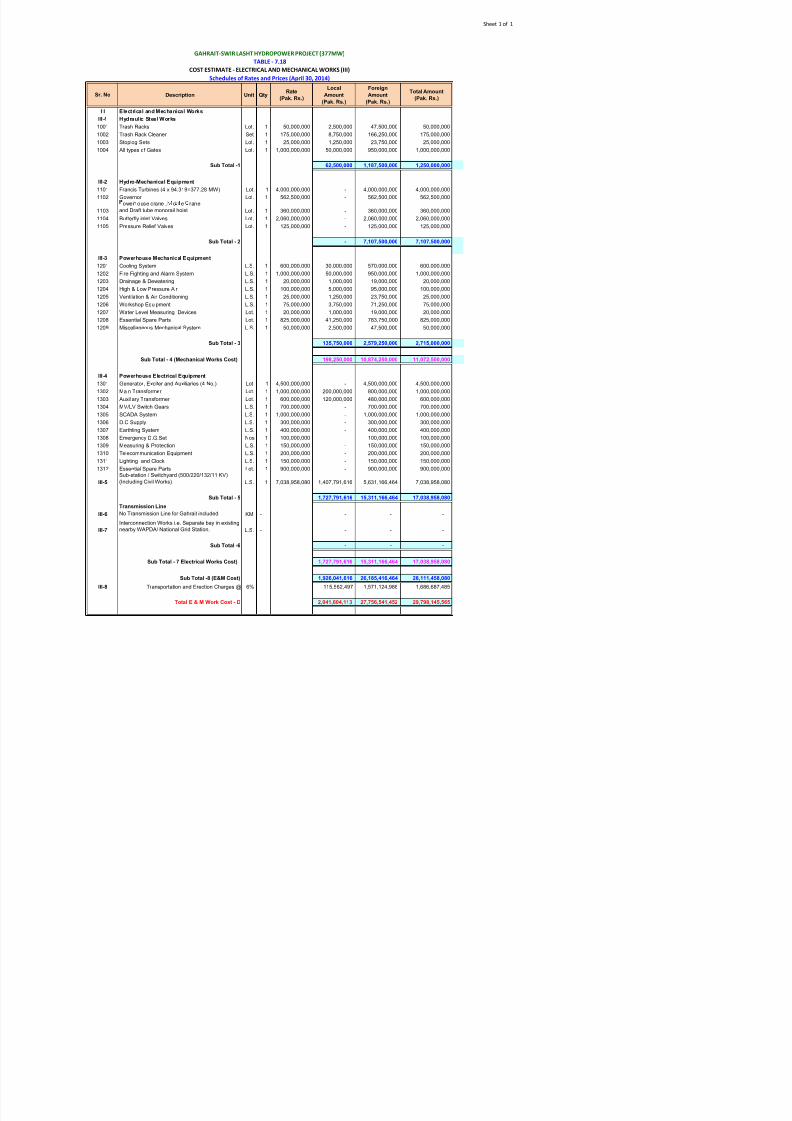
7/24/2019 02-FINAL PC-I JULY,2014.pdf
http://slidepdf.com/reader/full/02-final-pc-i-july2014pdf 89/141
I II 1 Hydraulic Steel Works1001 Trash Racks Lot. 1 50,000,000 2,500,000 47,500,000 50,000,000
1002 Trash Rack Cleaner Set 1 175,000,000 8,750,000 166,250,000 175,000,000
1003 Stoplog Sets Lot. 1 25,000,000 1,250,000 23,750,000 25,000,000
1004 All types of Gates Lot. 1 1,000,000,000 50,000,000 950,000,000 1,000,000,000
Sub Total -1 62,500,000 1,187,500,000 1,250,000,000
III-2 Hydro-Mechanical Equipment
1101 Francis Turbines (4 x 94.319=377.28 MW) Lot. 1 4,000,000,000 - 4,000,000,000 4,000,000,000
1102 Governor Lot. 1 562,500,000 - 562,500,000 562,500,000
1103
ower ouse crane , o e rane
and Draft tube monorail hoist Lot. 1 360,000,000 - 360,000,000 360,000,000
1104 Butterfly inlet Valves Lot. 1 2,060,000,000 - 2,060,000,000 2,060,000,000
1105 Pressure Relief Valves Lot. 1 125,000,000 - 125,000,000 125,000,000
Sub Total - 2 - 7,107,500,000 7,107,500,000
III-3 Powerhouse Mechanical Equipment
1201 Cooling System L.S. 1 600,000,000 30,000,000 570,000,000 600,000,000
1202 Fire Fighting and Alarm System L.S. 1 1,000,000,000 50,000,000 950,000,000 1,000,000,000
1203 Drainage & Dewatering L.S. 1 20,000,000 1,000,000 19,000,000 20,000,000
1204 High & Low Pressure Air L.S. 1 100,000,000 5,000,000 95,000,000 100,000,000
1205 Ventilation & Air Conditioning L.S. 1 25,000,000 1,250,000 23,750,000 25,000,000
1206 Workshop Equipment L.S. 1 75,000,000 3,750,000 71,250,000 75,000,000
1207 Water Level Measuring Devices Lot. 1 20,000,000 1,000,000 19,000,000 20,000,000 1208 Essential Spare Parts Lot. 1 825,000,000 41,250,000 783,750,000 825,000,000
1209 Miscellaneous Mechanical System L.S. 1 50,000,000 2,500,000 47,500,000 50,000,000
Sub Total - 3 135,750,000 2,579,250,000 2,715,000,000
Sub Total - 4 (Mechanical Works Cost) 198,250,000 10,874,250,000 11,072,500,000
III-4 Powerhouse Electrical Equipment
1301 Generator, Exciter and Auxiliaries (4 No.) Lot. 1 4,500,000,000 - 4,500,000,000 4,500,000,000
1302 Main Transformer Lot. 1 1,000,000,000 200,000,000 800,000,000 1,000,000,000
1303 Auxiliary Transformer Lot. 1 600,000,000 120,000,000 480,000,000 600,000,000
1304 MV/LV Switch Gears L.S. 1 700,000,000 - 700,000,000 700,000,000
1305 SCADA System L.S. 1 1,000,000,000 - 1,000,000,000 1,000,000,000
1306 D.C Supply L.S. 1 300,000,000 - 300,000,000 300,000,000
1307 Earthling System L.S. 1 400,000,000 - 400,000,000 400,000,000
1308 Emergency D.G.Set Nos 1 100,000,000 - 100,000,000 100,000,000
1309 Measuring & Protection L.S. 1 150,000,000 - 150,000,000 150,000,000
1310 Telecommunication Equipment L.S. 1 200,000,000 - 200,000,000 200,000,000
1311 Lighting and Clock L.S. 1 150,000,000 - 150,000,000 150,000,000
1312 Essential Spare Parts Lot. 1 900,000,000 - 900,000,000 900,000,000
III-5
Sub-station / Switchyard (500/220/132/11 KV)
(Including Civil Works) L.S. 1 7,038,958,080 1,407,791,616 5,631,166,464 7,038,958,080
Sub Total - 5 1,727,791,616 15,311,166,464 17,038,958,080
Transmission LineIII-6 No Transmission Line for Gahrait included. KM - - - -
III-7
Interconnection Works i.e. Separate bay in existing
nearby WAPDA/ National Grid Station. L.S. - - - -
Sub Total -6 - - -
TABLE - 9.1Energy Sales, Generation and Peak Demand (2000-2012)
Year Energy Sales
(GWh/a)
Energy Generation
(GWh/a)
Peak Demand
(MW)
Load Factor
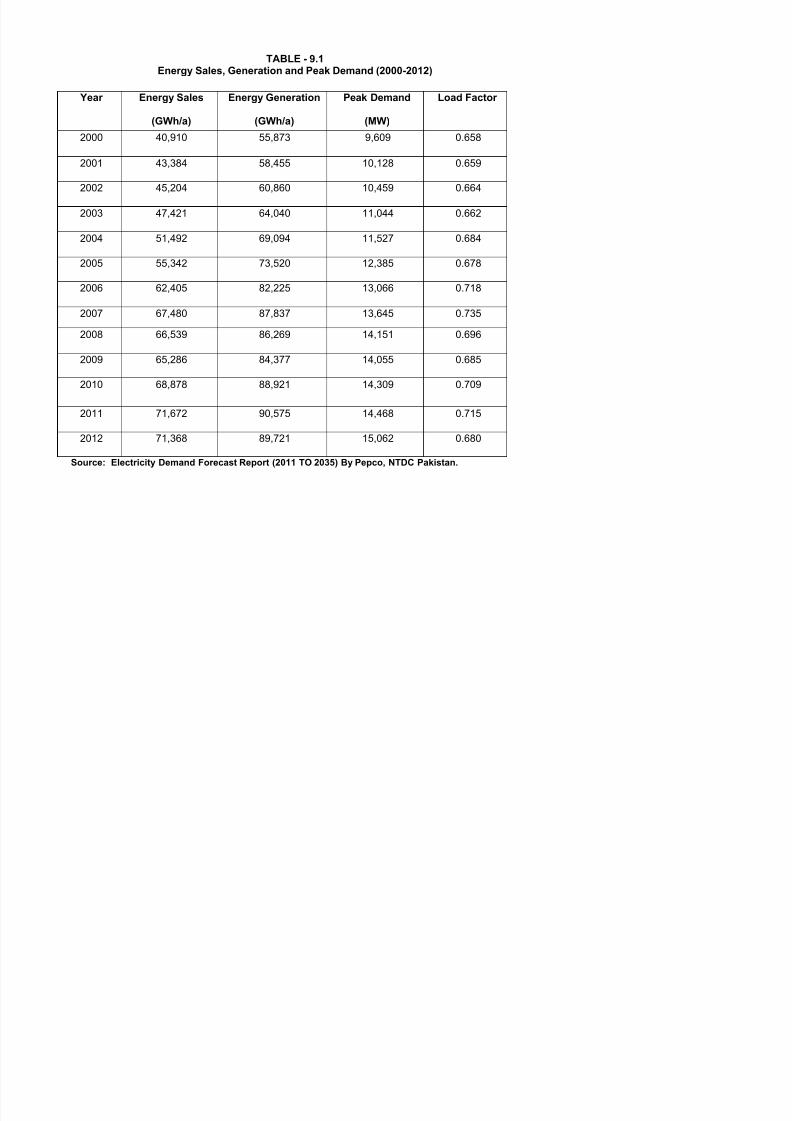
7/24/2019 02-FINAL PC-I JULY,2014.pdf
http://slidepdf.com/reader/full/02-final-pc-i-july2014pdf 90/141
(GWh/a) (GWh/a) (MW)
2000 40,910 55,873 9,609 0.658
2001 43,384 58,455 10,128 0.659
2002 45,204 60,860 10,459 0.664
2003 47,421 64,040 11,044 0.662
2004 51,492 69,094 11,527 0.684
2005 55,342 73,520 12,385 0.678
2006 62,405 82,225 13,066 0.718
2007 67,480 87,837 13,645 0.735
2008 66,539 86,269 14,151 0.696
2009 65,286 84,377 14,055 0.685
2010 68,878 88,921 14,309 0.709
2011 71,672 90,575 14,468 0.715
2012 71,368 89,721 15,062 0.680
Source: Electricity Demand Forecast Report (2011 TO 2035) By Pepco, NTDC Pakistan.
TABLE -9.2Electricity Demand Projections (2011-2035)
Year Peak Demand
(MW)
GrowthRate Energy
Generated
GrowthRate LoadFactor
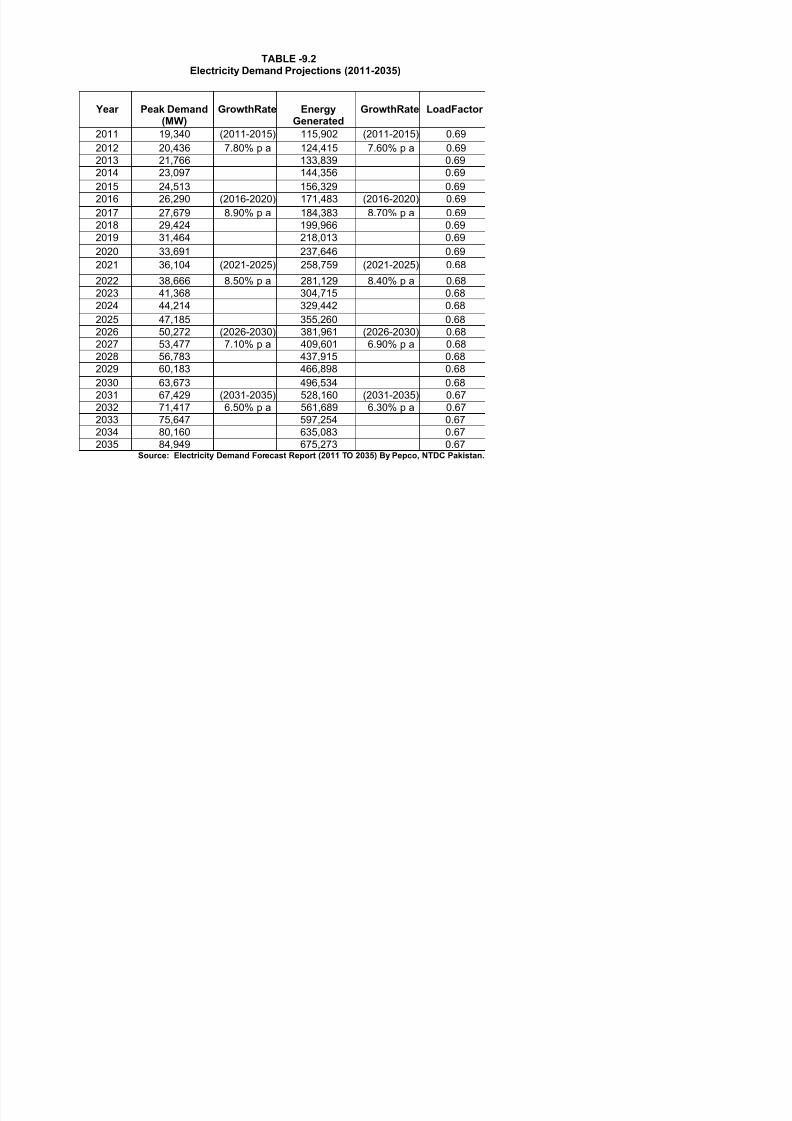
7/24/2019 02-FINAL PC-I JULY,2014.pdf
http://slidepdf.com/reader/full/02-final-pc-i-july2014pdf 91/141
(MW) Generated2011 19,340 (2011-2015) 115,902 (2011-2015) 0.69
2012 20,436 7.80% p a 124,415 7.60% p a 0.692013 21,766 133,839 0.692014 23,097 144,356 0.69
2015 24,513 156,329 0.692016 26,290 (2016-2020) 171,483 (2016-2020) 0.69
2017 27,679 8.90% p a 184,383 8.70% p a 0.692018 29,424 199,966 0.692019 31,464 218,013 0.69
2020 33,691 237,646 0.69
2021 36,104 (2021-2025) 258,759 (2021-2025) 0.68
2022 38,666 8.50% p a 281,129 8.40% p a 0.682023 41,368 304,715 0.682024 44,214 329,442 0.68
2025 47,185 355,260 0.682026 50,272 (2026-2030) 381,961 (2026-2030) 0.682027 53,477 7.10% p a 409,601 6.90% p a 0.682028 56,783 437,915 0.682029 60,183 466,898 0.68
2030 63,673 496,534 0.682031 67,429 (2031-2035) 528,160 (2031-2035) 0.67
2032 71,417 6.50% p a 561,689 6.30% p a 0.672033 75,647 597,254 0.672034 80,160 635,083 0.672035 84,949 675,273 0.67
Source: Electricity Demand Forecast Report (2011 TO 2035) By Pepco, NTDC Pakistan.
TABLE – 11.1:
Land Acquisition for Gahrait – Swir Lasht HPP (in Kanal)
Sr.No.
Structure/Item
Proprietary Land State Land
TotalCultivable Residential
CultivableWaste
Waste WasteRiverBed
Permanent Land Acquisition
1 Reservoir (HFL, 1342 masl) 183 13 17 45 2,534 801 3,593D P I t k S d T Di i

7/24/2019 02-FINAL PC-I JULY,2014.pdf
http://slidepdf.com/reader/full/02-final-pc-i-july2014pdf 92/141
2Dam, Power Intake, Sand Trap, DiversionScheme and Allied Structures
0 0 0 0 451.4 0 451
3 Flushing Tunnels (Underground) 0 0 0 0 110.9 0 111
4Powerhouse, Surge Tank, Penstock(Underground)
0 0 0 0 48.8 0 49
6 Tailrace Tunnel (Underground), Tailrace Channel 175 0 0 0 570 0 745
5 Switch Yard 5 0 0 0 0 0 5
7 Access Road for Dam Site (W=8 m x L=1500 m) 8 0 0 0 15.7 0 24
8 Access Road for Powerhouse Site (W=8 m xL=3000 m)*
0 0 0 0 130 0 130
9 Access Tunnel For Powerhouse Site 0 0 0 0 200 0 200
10 Colony at Dam site 0 0 0 42 0 0 42
11 Power Tunnel Area (Underground, 14.6 Km Long) 0 0 0 0 2,919 0 2,919
Total 371 13 17 87 6,980 801 8,269
Temporary Land Acquisition
1 Contractor's Camp at Dam Site 0 0 0 25 0 0 25
2 Contractor's Camp at Powerhouse Site 0 0 0 25 0 0 25
3 Haul Roads (W=8m x L=6000m) 0 0 0 0 0 0 0
4 Spoil Disposal** 0 0 0 0 30 0 30
Total 0 0 0 50 30 0 80
Note: All areas are in Kanal, 1 Kanal = 506 m2
*Existing Tracts will be used and upgrade**Spoil Disposal Area proposed near Village Jingerat 13 Km downstream from Dam Site & 5 Km Upstream from Powerhouse Site
TABLE – 11.2:
Details of Affected Structures at High Flood Level

7/24/2019 02-FINAL PC-I JULY,2014.pdf
http://slidepdf.com/reader/full/02-final-pc-i-july2014pdf 93/141
TABLE – 11.3:
Details of Affected Trees
N f % f N f % f
TABLE – 11.4:
Environmental Management Plan of Gahrait Swir Lasht Hydro Power Project
Resources
EnvironmentalImpact/ ImpactSource
Description Mitigation Measures Mitigation Strategy
ResponsibilitiesIndicator KeyPerformanceExecution Monitoring
PRE CONSTRUCTION & CONSTRUCTION CONSIDERATIONS
1. Land
Resources
1.1 Land
Acquisition
Permanent Land
Acquisition for:• Reservoir impounding • Payment of compensation Compensation to the level Deputy
PEDO /Non –

7/24/2019 02-FINAL PC-I JULY,2014.pdf
http://slidepdf.com/reader/full/02-final-pc-i-july2014pdf 94/141
3,593 kanal.
• Construction of Dam &allied structures 562kanal.
• Powerhouse area 799kanal.
• Access/ MaintenanceRoads 154 kanal.
•Colonies and Offices 42kanal.
Temporary LandAcquisition for:• Construction camps atdam and powerhouse site50 kanal.
• Spoil area for excavatedmaterial 30 kanal.
for acquisition of land atcurrent market price ornegotiated price as definedin Land Acquisition Act‟
• Prompt payment toaffectees before start ofconstruction work.
*Ensure transparency in landacquisition process
• Job oppor tunities toaffectees and locals.
•Temporary land will be hiredon rental basis afternegotiation with the owner30,000/year isrecommended.• Prompt payment toaffectees before start ofconstruction work• Job opportunities toaffectees and locals
of restoration in accordancewith Asian DevelopmentBank Policy Statement2009 & 2010/The WorldBank Guidelines/Land Acquisition Act 1894/RP ofPakistan 2002 Draft
Director (DD)in charge of theland acquisitionandresettlementoperations/Land RevenueDepartment(LAC)
PEDO /
Monitoring
consultants
Compliancewith landacquisitionplan.
1.2 Loss ofStructures
• 12 Residential Structuresat reservoir area will beaffected.
• 12 residential unit will berelocated to higher elevationand these will be paidreplacement cost basis, afterconsultation with the officialdepartment. Type A unit will
Compensation to the levelof restoration in accordancewith Asian DevelopmentBank Policy Statement2009 & 2010/The WorldBank Guidelines/Land
DeputyDirector (DD)in charge of theland acquisitionandresettlement
PEDO /
Monitoring
consultants
Non -Compliancewith landacquisitionplan.
Resources
EnvironmentalImpact/ ImpactSource
Description Mitigation Measures Mitigation Strategy
ResponsibilitiesIndicator KeyPerformanceExecution Monitoring
be paid Rs 1600/sq. ft, TypeB 800/sq. ft and Type C with500/sq. ft.• Prompt payment to affectees before start ofconstruction work.
• Job opportunities toaffectees and locals.
acquisition Act 1894/RP ofPakistan 2002 Draft.
operations/Land RevenueDepartment(LAC)
1.3 Loss ofCommercial
• no commercial Assetswill impacted
N/A N/A N/A N/A N/A

7/24/2019 02-FINAL PC-I JULY,2014.pdf
http://slidepdf.com/reader/full/02-final-pc-i-july2014pdf 95/141
CommercialAssets
will impacted
1.4 Loss ofcommunitystructure
• Two mosqueswill beimpacted at reservoirarea.
Both the mosques has TypeB construction materialhence Rs. 800/sq.ft will bepaid on the replacement costbasis
Compensation to the levelof restoration in accordancewith Asian DevelopmentBank Policy Statement2009 & 2010/The WorldBank Guidelines/Landacquisition Act 1894/RP ofPakistan 2002 Draft.
DeputyDirector (DD)in charge of theland acquisitionandresettlementoperations/Land RevenueDepartment
(LAC)
PEDO /
Monitoring
consultants
Non -Compliancewith landacquisitionplan.
1.5 SlopeInstability
• If hillside or valley sideslopes are left unprotectedthese will be subject to anatural weathering andbecome increasinglyprone to land sliding.
• Good engineering practiceswill help in controlling soilerosion.
Grading, compaction,pitching, retainingstructures and terracing.
Contractor PEDO Non -Compliancewith WasteManagementPlans.
1.6 Disposal ofexcavatedmaterial
• Land pollution will beactivated due tohaphazard disposal ofdebris spoil material.
• Identification of re-use ofexcavated material on site,to reduce off- site effects.
• All excavated materials tobe disposed of in designatedsites.
Prepare comprehensiveWaste Management Plan,Erosion and SedimentControl Plan.
Contractor PEDO Non -Compliancewith WasteManagementPlans.
1.7 SoilContamination
• Land may becontaminated by thespillage of chemicals likefuels, solvents, oils, paints
• The contractor will berequired to train its workforcein the storage and handlingof materials like furnace oil,
Compliance with Fuels andHazardous SubstancesManagement Plan.
Contractor SupervisionConsultant,PEDO
Non -Compliancewith WasteManagement
Resources
EnvironmentalImpact/ ImpactSource
Description Mitigation Measures Mitigation Strategy
ResponsibilitiesIndicator KeyPerformanceExecution Monitoring
and other constructionchemicals and concrete.
diesel, petrol and chemicals,etc., that can potentiallycause soil contamination.
Plans.
2. Water
Resources
2.1 Depletion of
the river flow
•No use river water forirrigation purpose• Discharge of 15 m
3/s is
recommended ecologicalflow needed to maintain
the downstreamecosystem.
•15 m / s were therecommended mean monthlyecological or residual flowwhich also covers river waterusage for the community as
well. The project hasadopted this figure for
Easy access of good waterQuality and Quantity.
Contractor SupervisionConsultant,PEDO
ApprovedPlan.

7/24/2019 02-FINAL PC-I JULY,2014.pdf
http://slidepdf.com/reader/full/02-final-pc-i-july2014pdf 96/141
y p genergy calculation of theproject.
2.2 Hazardous
Material and
Waste in water
bodies
• Water pollution from thestorage, handling anddisposal of hazardousmaterials and generalConstruction waste andaccidental spillage.
• Follow the wastemanagement plan.
• Minimize the generation ofsediment, oil and grease,excess nutrients, organicmatter, litter, debris and anyform of waste (particularlypetroleum and chemicalwastes). These substances
must not enter waterways, orunderground water tables.
Compliance withNEQS/ADB/ World BankGuidelines for on-site wastetreatment and disposalfacilities.
Contractor PEDO Non-compliancewith wastemanagementplan.
2.3 Discharge from
construction
sites in water
bodies
• During construction bothsurface and groundwaterquality may bedeteriorated due toconstruction activities inthe river, sewerages fromconstruction sites andwork camps.
• The change inhydrological regime leadsto increased rate of runoff
and in sediment andcontaminant loading,increased flooding,groundwatercontamination, and effecthabitat of fish and other
• Install temporary drainageworks (channels and bunds)in areas required forsediment and erosion controland around storage areas forconstruction materials.
• Divert runoff fromundisturbed areas aroundthe construction site.
•Stockpile materials away
from drainage lines.
•Prevent all solid and liquidwastes entering waterwaysby collecting solid waste,oils, chemicals, bitumen
Compliance withNEQS/ADB/ World BankGuidelines for on-site wastetreatment and disposalfacilities.
Contractor PEDO Non-compliancewith wastemanagementplan.
Resources
EnvironmentalImpact/ ImpactSource
Description Mitigation Measures Mitigation Strategy
ResponsibilitiesIndicator KeyPerformanceExecution Monitoring
aquatic biology. spray waste andwastewaters from brick,concrete and asphalt cuttingwhere possible and transportto approved waste disposalsite or recycling depot.
• Wash out ready-mixconcrete agitators and
t h dli i t
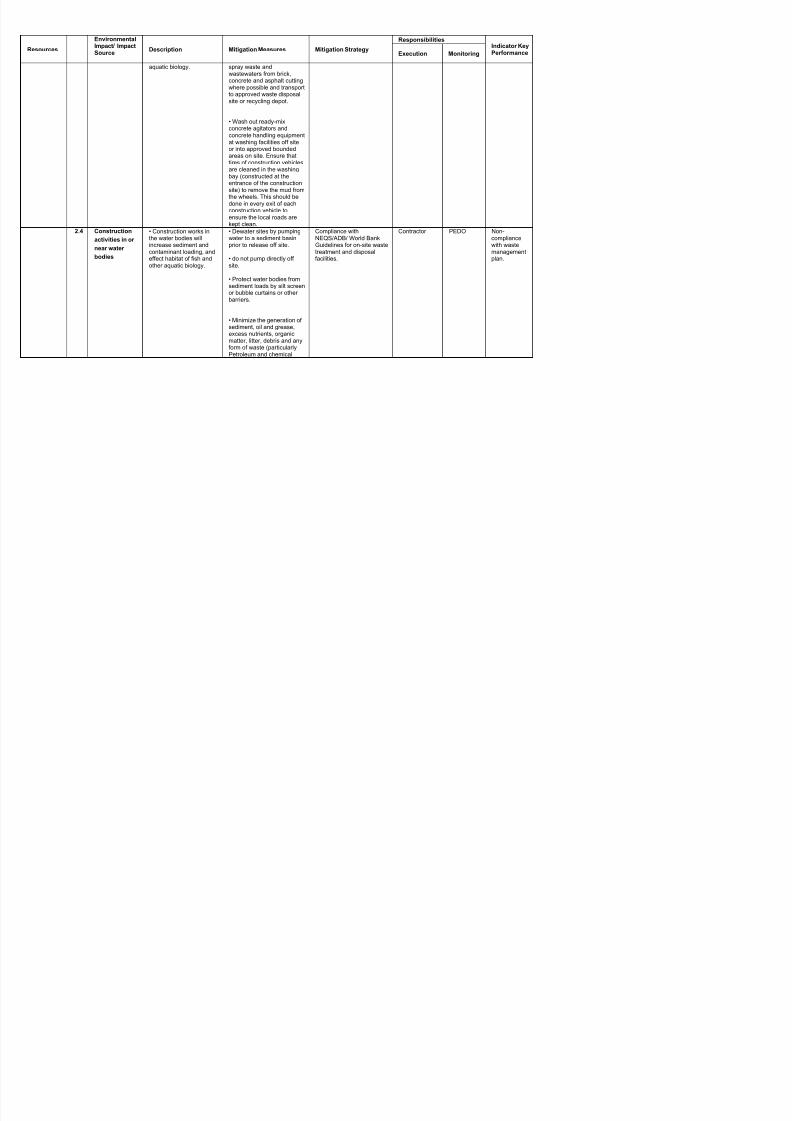
7/24/2019 02-FINAL PC-I JULY,2014.pdf
http://slidepdf.com/reader/full/02-final-pc-i-july2014pdf 97/141
concrete handling equipmentat washing facilities off siteor into approved boundedareas on site. Ensure thattires of construction vehiclesare cleaned in the washingbay (constructed at theentrance of the constructionsite) to remove the mud fromthe wheels. This should bedone in every exit of eachconstruction vehicle to
ensure the local roads arekept clean.
2.4 Construction
activities in or
near water
bodies
• Construction works inthe water bodies willincrease sediment andcontaminant loading, andeffect habitat of fish andother aquatic biology.
• Dewater sites by pumpingwater to a sediment basinprior to release off site.
• do not pump directly offsite.
• Protect water bodies fromsediment loads by silt screenor bubble curtains or otherbarriers.
• Minimize the generation ofsediment, oil and grease,excess nutrients, organicmatter, litter, debris and anyform of waste (particularlyPetroleum and chemical
Compliance withNEQS/ADB/ World BankGuidelines for on-site wastetreatment and disposalfacilities.
Contractor PEDO Non-compliancewith wastemanagementplan.
Resources
EnvironmentalImpact/ ImpactSource
Description Mitigation Measures Mitigation Strategy
ResponsibilitiesIndicator KeyPerformanceExecution Monitoring
wastes). These substancesmust not enter waterways orunderground water tables.
• Use environment friendlyand non - toxic slurry duringconstruction of piles todischarge into the river.
• Do not discharge cementand water curing used for
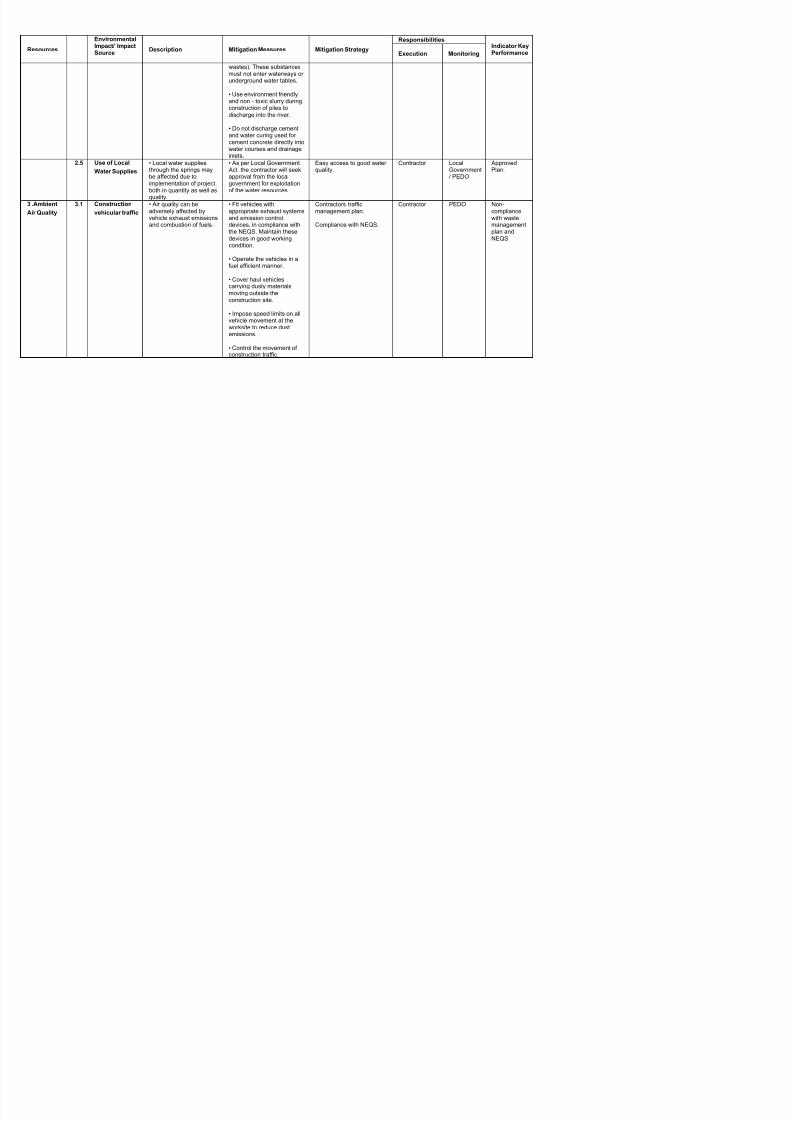
7/24/2019 02-FINAL PC-I JULY,2014.pdf
http://slidepdf.com/reader/full/02-final-pc-i-july2014pdf 98/141
and water curing used forcement concrete directly intowater courses and drainageinlets.
2.5 Use of Local
Water Supplies
• Local water suppliesthrough the springs maybe affected due toimplementation of projectboth in quantity as well asquality.
• As per Local Government Act, the contractor will seekapproval from the localgovernment for exploitationof the water resources
Easy access to good waterquality.
Contractor LocalGovernment/ PEDO
ApprovedPlan.
3 .Ambient
Air Quality
3.1 Construction
vehicular traffic
• Air quality can beadversely affected by
vehicle exhaust emissionsand combustion of fuels.
• Fit vehicles withappropriate exhaust systems
and emission controldevices, in compliance withthe NEQS. Maintain thesedevices in good workingcondition.
• Operate the vehicles in afuel efficient manner.
• Cover haul vehiclescarrying dusty materialsmoving outside theconstruction site.
• Impose speed limits on allvehicle movement at theworksite to reduce dustemissions.
• Control the movement ofconstruction traffic.
Contractors trafficmanagement plan.
Compliance with NEQS.
Contractor PEDO Non-compliance
with wastemanagementplan andNEQS.
Resources
EnvironmentalImpact/ ImpactSource
Description Mitigation Measures Mitigation Strategy
ResponsibilitiesIndicator KeyPerformanceExecution Monitoring
• Water the constructionmaterials prior to loading andtransport.
• Service all vehiclesregularly to minimize
emissions.
• Limit the idling time of
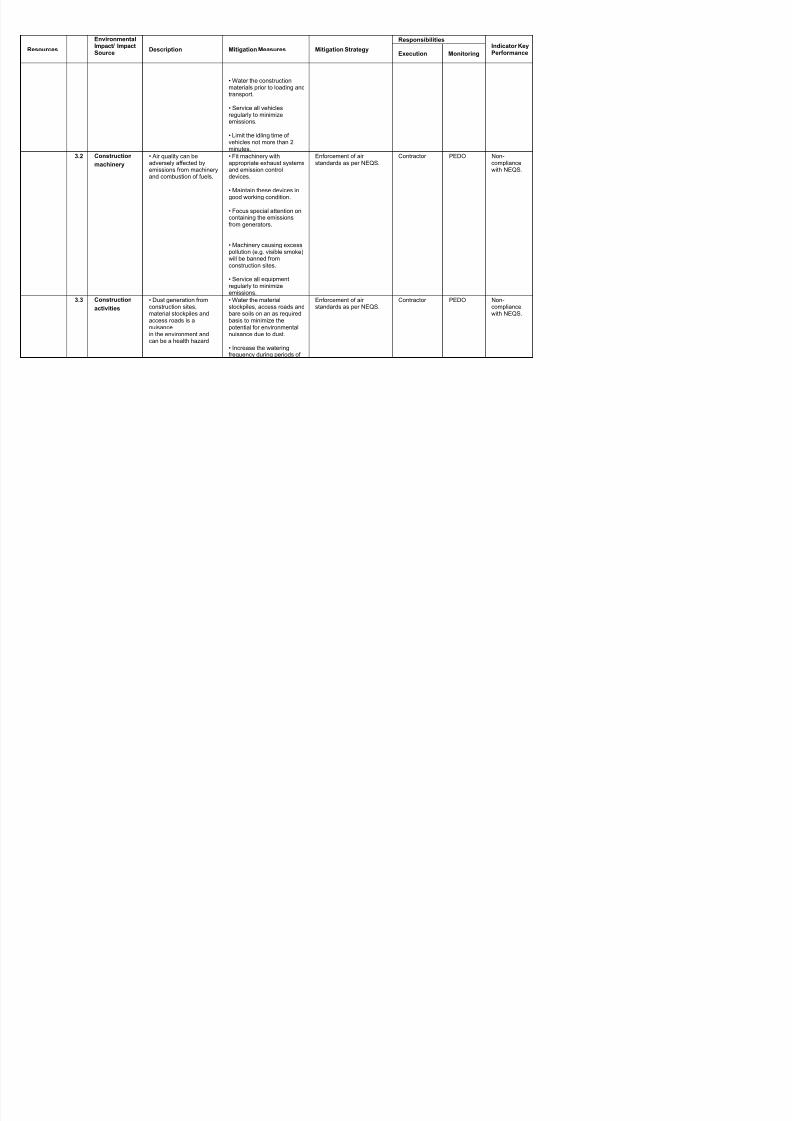
7/24/2019 02-FINAL PC-I JULY,2014.pdf
http://slidepdf.com/reader/full/02-final-pc-i-july2014pdf 99/141
Limit the idling time ofvehicles not more than 2minutes.
3.2 Construction
machinery
• Air quality can beadversely affected byemissions from machineryand combustion of fuels.
• Fit machinery withappropriate exhaust systemsand emission controldevices.
• Maintain these devices ingood working condition.
• Focus special attention on
containing the emissionsfrom generators.
• Machinery causing excesspollution (e.g. visible smoke)will be banned fromconstruction sites.
• Service all equipmentregularly to minimizeemissions.
Enforcement of airstandards as per NEQS.
Contractor PEDO Non-compliancewith NEQS.
3.3 Construction
activities
• Dust generation from construction sites,
material stockpiles andaccess roads is anuisancein the environment andcan be a health hazard
• Water the materialstockpiles, access roads and
bare soils on an as requiredbasis to minimize thepotential for environmentalnuisance due to dust.
• Increase the wateringfrequency during periods of
Enforcement of airstandards as per NEQS.
Contractor PEDO Non-compliance
with NEQS.
Resources
EnvironmentalImpact/ ImpactSource
Description Mitigation Measures Mitigation Strategy
ResponsibilitiesIndicator KeyPerformanceExecution Monitoring
high risk (e.g. high winds).
• Fugitive dust emissions willbe minimized by appropriatemethods, such as sprayingwater on soil, where requiredand appropriate.
• Reschedule earthworkactivities or vegetation

7/24/2019 02-FINAL PC-I JULY,2014.pdf
http://slidepdf.com/reader/full/02-final-pc-i-july2014pdf 100/141
gclearing activities, wherepractical, if necessary toavoid during periods of highwind and if visible dust isblowing off-site.
• Restore disturbed areas assoon as practicable byvegetation/grass turfing.
4. Noise and
Vibration
Management
4.1 Construction
vehicular traffic
• Noise quality will bedeteriorated due to
vehicular traffic.
• Maintain all vehicles inorder to keep it in good
working order in accordancewith manufacturesmaintenance procedures.
• Make sure all drivers willcomply with the traffic codesconcerning maximum speedlimit, driving hours, etc.
Enforcement of Noisestandards as per NEQS.
Follow Pak-EPA and WHOguideline values forcommunity noise in specificenvironment.
Contractor PEDO Lack of anynon -
compliancereports.
4.2 Construction
machinery
• Noise and vibration mayhave an impact on people,property, fauna, livestockand the naturalenvironment.
• Generators and vehicleswill have exhaust mufflers(silencers) to minimize noisegeneration.
• Modify equipment toreduce noise (for example,noise control kits, lining oftruck trays or pipelines).
• Maintain all equipment inorder to keep it in good
• Enforcement of noisestandards by contractor.
• Follow Pak-EPA andWHO guideline values for
community noise in specificenvironment..Use ear pads to protectdamage to ear when noiselevel is more than 80 db.
Contractor PEDO Lack of anynon -compliancereports.
Resources
EnvironmentalImpact/ ImpactSource
Description Mitigation Measures Mitigation Strategy
ResponsibilitiesIndicator KeyPerformanceExecution Monitoring
working order in accordancewith manufacturesmaintenance procedures.
•Install acoustic enclosuresaround generators to reducenoise levels.
• NEQS compliance will beensured.
4.3 Blasting and • Controlled blasting and Enforcement of noise Contractor PEDO Lack of any
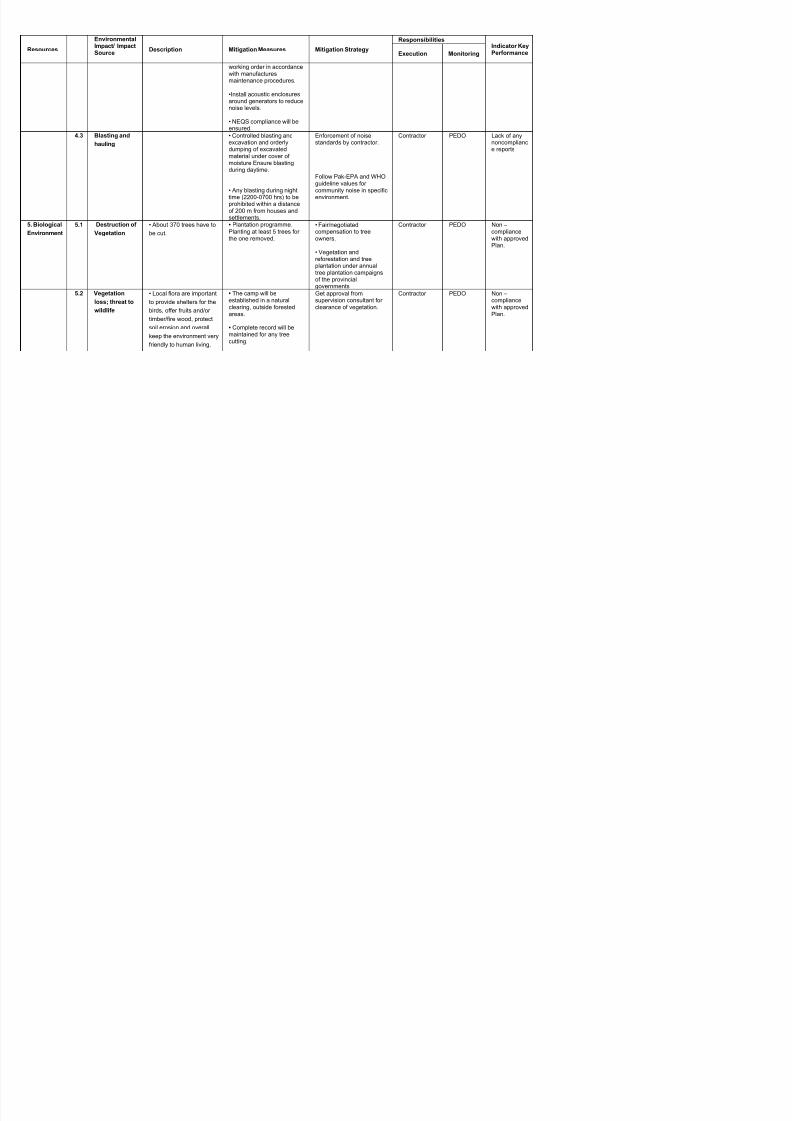
7/24/2019 02-FINAL PC-I JULY,2014.pdf
http://slidepdf.com/reader/full/02-final-pc-i-july2014pdf 101/141
hauling excavation and orderlydumping of excavatedmaterial under cover ofmoisture Ensure blastingduring daytime.
• Any blasting during nighttime (2200-0700 hrs) to beprohibited within a distanceof 200 m from houses and
settlements.
standards by contractor.
Follow Pak-EPA and WHOguideline values forcommunity noise in specificenvironment.
noncompliance reports
5. Biological
Environment
5.1 Destruction of
Vegetation
• About 370 trees have to
be cut.
• Plantation programme. Planting at least 5 trees forthe one removed.
• Fair/negotiatedcompensation to treeowners.
• Vegetation andreforestation and treeplantation under annualtree plantation campaignsof the provincialgovernments
Contractor PEDO Non – compliancewith approvedPlan.
5.2 Vegetation
loss; threat to
wildlife
• Local flora are important
to provide shelters for the
birds, offer fruits and/or
timber/fire wood, protect
soil erosion and overall
keep the environment very
friendly to human living.
• The camp will beestablished in a naturalclearing, outside forested
areas.
• Complete record will bemaintained for any treecutting.
Get approval fromsupervision consultant forclearance of vegetation.
Contractor PEDO Non – compliancewith approved
Plan.
Resources
EnvironmentalImpact/ ImpactSource
Description Mitigation Measures Mitigation Strategy
ResponsibilitiesIndicator KeyPerformanceExecution Monitoring
As such damage to flora
has wide range of adverse
environmental impacts.
• Clearance of vegetation
may impact shelter,
feeding and/or breeding
and/or physical
destruction and severing
• Provide adequateknowledge to the workersregarding nature protectionand the need of avoid fellingtrees during construction.
• The construction crew willbe provided with LPG as
cooking (and heating, ifrequired) fuel.
U f f l d ill t b
Creating awareness andimparting training toconstruction crew to avoidloss of fauna, birds andanimals habitat.
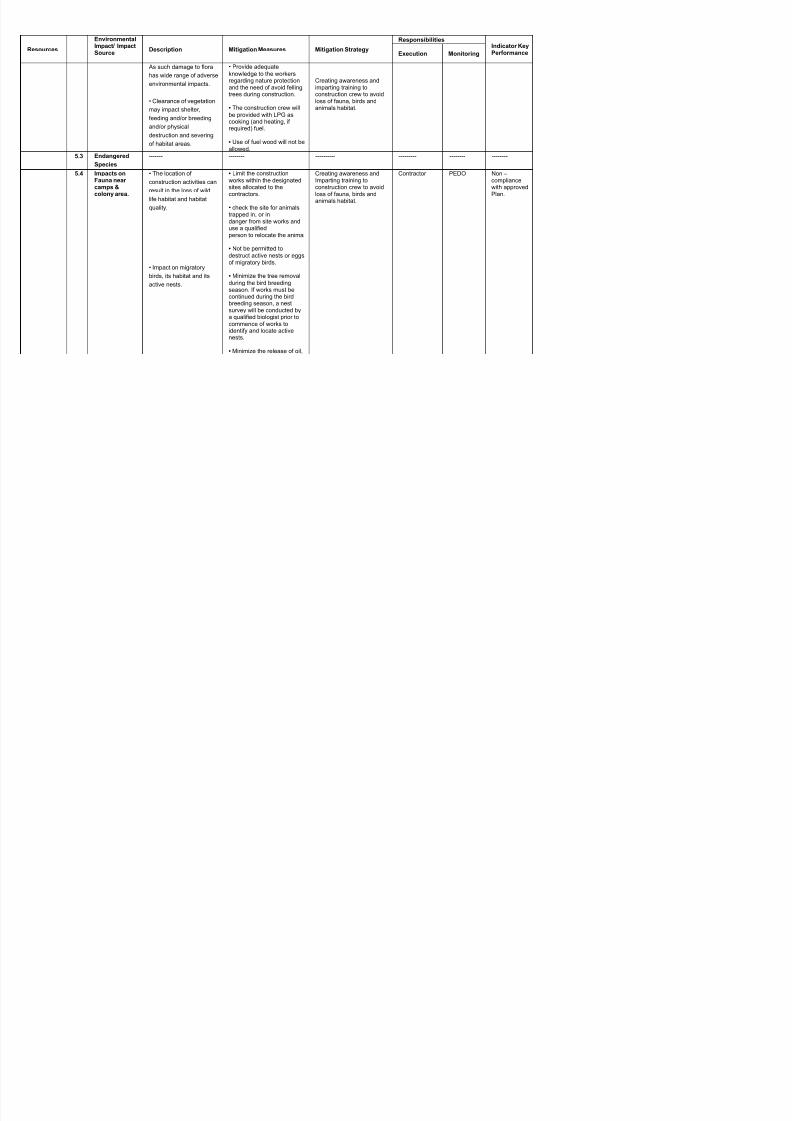
7/24/2019 02-FINAL PC-I JULY,2014.pdf
http://slidepdf.com/reader/full/02-final-pc-i-july2014pdf 102/141
of habitat areas. • Use of fuel wood will not beallowed.
5.3 Endangered
Species
------- -------- ---------- --------- -------- --------
5.4 Impacts onFauna nearcamps &colony area.
• The location of
construction activities can
result in the loss of wild
life habitat and habitat
quality,
• Impact on migratory
birds, its habitat and its
active nests.
• Limit the constructionworks within the designatedsites allocated to thecontractors.
• check the site for animalstrapped in, or in
danger from site works anduse a qualifiedperson to relocate the animal
• Not be permitted todestruct active nests or eggsof migratory birds.
• Minimize the tree removalduring the bird breedingseason. If works must becontinued during the birdbreeding season, a nestsurvey will be conducted by
a qualified biologist prior tocommence of works toidentify and locate activenests.
• Minimize the release of oil,
Creating awareness andImparting training toconstruction crew to avoidloss of fauna, birds andanimals habitat.
Contractor PEDO Non – compliancewith approvedPlan.
Resources
EnvironmentalImpact/ ImpactSource
Description Mitigation Measures Mitigation Strategy
ResponsibilitiesIndicator KeyPerformanceExecution Monitoring
oil wastes or any othersubstances harmful tomigratory birds to any watersor any areas frequented bymigratory birds.
5.5 ConstructionCamps andWild Life
• Illegal poaching • Provide adequateknowledge to the workersregarding protection of flora
and fauna, and relevantgovernment regulations andpunishments for illegalpoaching
Creating awareness andimparting training toconstruction crew to avoid
loss of fauna, birds andanimals habitat.
Contractor PEDO Non – compliancewith approved
Plan.

7/24/2019 02-FINAL PC-I JULY,2014.pdf
http://slidepdf.com/reader/full/02-final-pc-i-july2014pdf 103/141
poaching.5.6 Aquatic flora
and fauna
• The main potential
impacts to fisheries are
hydrocarbon spills and
disposal of wastes into the
river.
• The main potential
impacts to aquatic flora
and Fauna River are
increased suspended
solids from earthworks
erosion, sanitary
discharge from work
•Fish ladder will beconstructed for theconservation of aquaticfauna.
•Ensure that if boats used inthe project are wellmaintained and do not haveoil leakage to contaminateriver water.
• Contain accidental spillageand make an emergency oilspill containment plan to besupported with enoughequipments, materials andhuman resources.
• Do not dump wastes, be ithazardous or non-hazardousinto the nearby water bodiesor in the river.
• Strictly follow WaterResources Management andDrainage Management Plan.
Creating awareness andimparting training toconstruction crew to avoidloss of fauna, birds andanimals habitat.
Contractor PEDO Non – compliancewith approvedPlan.
Resources
EnvironmentalImpact/ ImpactSource
Description Mitigation Measures Mitigation Strategy
ResponsibilitiesIndicator KeyPerformanceExecution Monitoring
camps, and hydrocarbon
spills.
6. Social
Impact
6.1 Standard of
living of
resettled
people
• Social disruption and
decrease in standard of
living of resettled people.
• Uplift of standard of livingby ensuring access to parks,provision of health and socialservices. Adequatecompensation of lost assets.
Adequate Compensationprovided in the resettlementplan. There would be Socialuplift programme preparedby the contractor.
Contractor PEDO Lack of anynoncompliance reports; lackof anycomplaints.
6.2 Village water
supply
• Reduction or stress on
water resource of
community needs.
Construction of water tanksto collect spring water fordistribution in the village.
Easy access of good waterQuality.
Contractor SupervisionConsultant /PEDO
Lack of anynoncompliance reports; lackof any
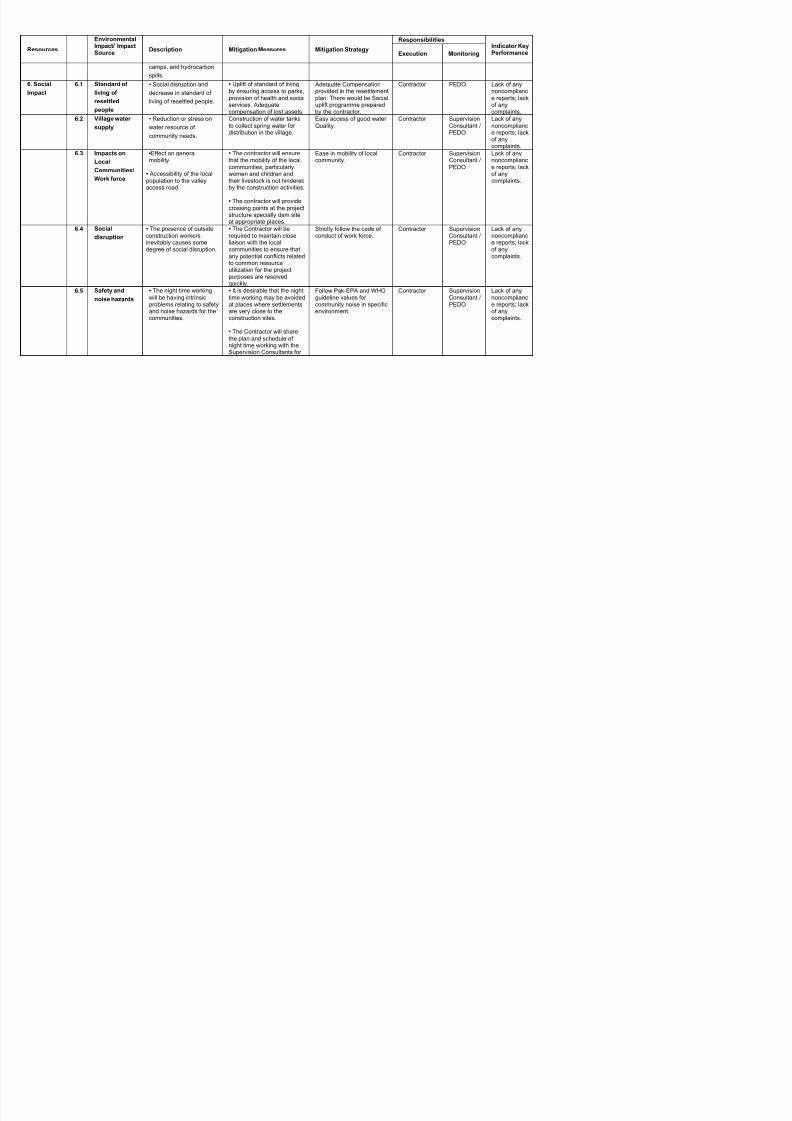
7/24/2019 02-FINAL PC-I JULY,2014.pdf
http://slidepdf.com/reader/full/02-final-pc-i-july2014pdf 104/141
complaints.6.3 Impacts on
Local
Communities/
Work force
•Effect on generalmobility.
• Accessibility of the localpopulation to the valleyaccess road.
• The contractor will ensurethat the mobility of the localcommunities, particularlywomen and children andtheir livestock is not hinderedby the construction activities.
• The contractor will providecrossing points at the projectstructure specially dam site
at appropriate places.
Ease in mobility of localcommunity.
Contractor SupervisionConsultant /PEDO
Lack of anynoncompliance reports; lackof anycomplaints.
6.4 Social
disruption
• The presence of outsideconstruction workersinevitably causes somedegree of social disruption.
• The Contractor will berequired to maintain closeliaison with the localcommunities to ensure thatany potential conflicts relatedto common resourceutilization for the projectpurposes are resolvedquickly.
Strictly follow the code ofconduct of work force.
Contractor SupervisionConsultant /PEDO
Lack of anynoncompliance reports; lackof anycomplaints.
6.5 Safety and
noise hazards
• The night time workingwill be having intrinsicproblems relating to safetyand noise hazards for the
communities.
• It is desirable that the nighttime working may be avoidedat places where settlementsare very close to the
construction sites.
• The Contractor will sharethe plan and schedule ofnight time working with theSupervision Consultants for
Follow Pak-EPA and WHOguideline values forcommunity noise in specificenvironment.
Contractor SupervisionConsultant /PEDO
Lack of anynoncompliance reports; lackof any
complaints.
Resources
EnvironmentalImpact/ ImpactSource
Description Mitigation Measures Mitigation Strategy
ResponsibilitiesIndicator KeyPerformanceExecution Monitoring
approval.
• The contractor will ensurethat blasting is not carriedout in the near vicinity of thesettlements and villagetracks that are veryfrequently used. Here only
excavators will be used.
• Effective constructioncontrols by the Contractor to
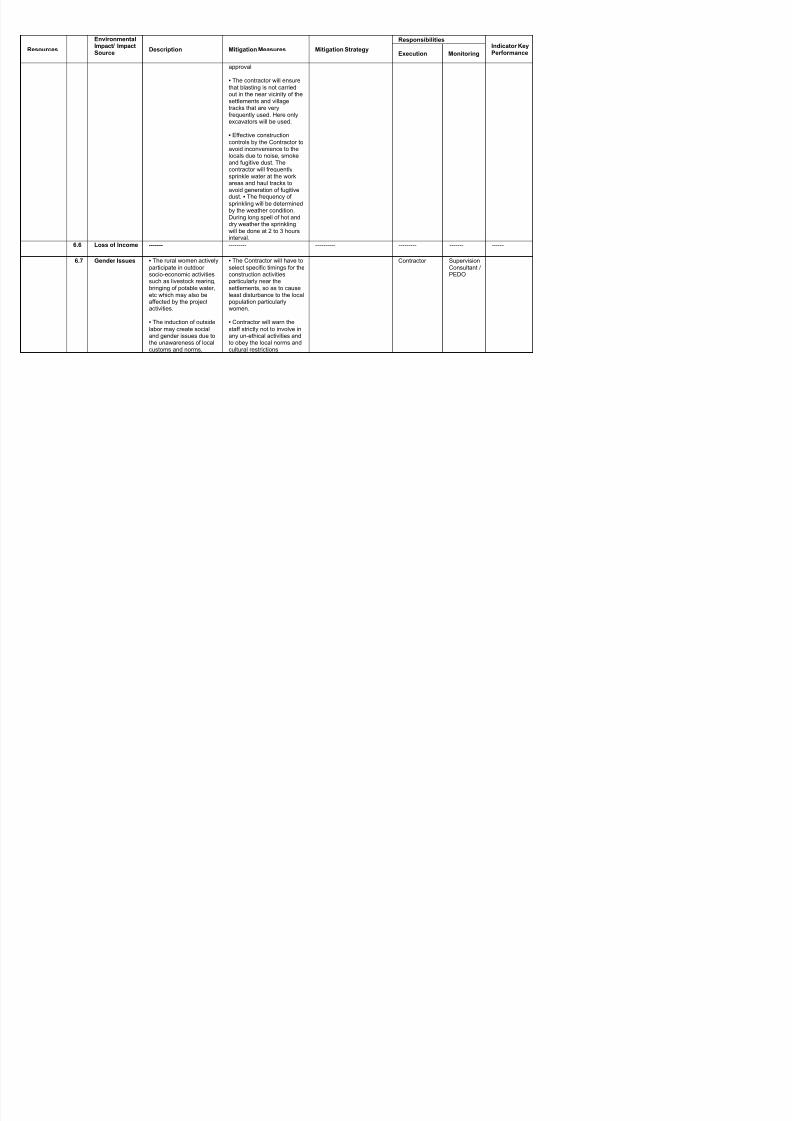
7/24/2019 02-FINAL PC-I JULY,2014.pdf
http://slidepdf.com/reader/full/02-final-pc-i-july2014pdf 105/141
yavoid inconvenience to thelocals due to noise, smokeand fugitive dust. Thecontractor will frequentlysprinkle water at the workareas and haul tracks toavoid generation of fugitivedust. • The frequency ofsprinkling will be determinedby the weather condition.
During long spell of hot anddry weather the sprinklingwill be done at 2 to 3 hoursinterval.
6.6 Loss of Income ------- --------- ---------- --------- ------- ------
6.7 Gender Issues • The rural women activelyparticipate in outdoorsocio-economic activitiessuch as livestock rearing,bringing of potable water,etc which may also beaffected by the projectactivities.
• The induction of outsidelabor may create socialand gender issues due tothe unawareness of localcustoms and norms.
• The Contractor will have toselect specific timings for theconstruction activitiesparticularly near thesettlements, so as to causeleast disturbance to the localpopulation particularlywomen.
• Contractor will warn thestaff strictly not to involve inany un-ethical activities andto obey the local norms andcultural restrictions
Contractor SupervisionConsultant /PEDO
Resources
EnvironmentalImpact/ ImpactSource
Description Mitigation Measures Mitigation Strategy
ResponsibilitiesIndicator KeyPerformanceExecution Monitoring
particularly with reference towomen.
6.8 Indigenous andVulnerableHouseholds
------- --------- ---------- --------- ------- ------
6.9 Safety Hazards • Occurrence ofaccidents/incidents duringthe construction activities.
• Complying with the safetyprecautions for constructionworkers as per International
Labour Organization (ILO)Convention No. 62, as far asapplicable to the projectcontract.
An HSE management planwill be prepared.
Contractor SupervisionConsultant /PEDO
Non -compliancewith approved
plan

7/24/2019 02-FINAL PC-I JULY,2014.pdf
http://slidepdf.com/reader/full/02-final-pc-i-july2014pdf 106/141
contract.
• Protective fencing to beinstalled around the Camp toavoid any accidents.
• The camp staff will beprovided fire - fightingtraining and firefightingequipment will be madeavailable at the camps.
• All safety precautions willbe taken to transport, handleand store hazardoussubstances, such as fuel.
Resources
EnvironmentalImpact/ ImpactSource
Description Mitigation Measures Mitigation Strategy
ResponsibilitiesIndicator KeyPerformanceExecution Monitoring
6.10 Religious,Cultural andHistorical Sites
• No historical orarcheological site hasbeen observed along theProject corridor.
• Disturbance fromconstruction works to thecultural and religious sites,
and contractors lack ofknowledge on culturalissues cause socialdisturbances.
N/A
• Do not block access tocultural and religious sites,wherever possible.
• Stop construction worksthat produce noise(particularly during prayerti ) h ld th b
N/A
Ease in mobility of localcommunity.
N/A
Contractor
N/A
SupervisionConsultant /PEDO
N/A
Lack of anynoncompliance reports; lack
of anycomplaints.

7/24/2019 02-FINAL PC-I JULY,2014.pdf
http://slidepdf.com/reader/full/02-final-pc-i-july2014pdf 107/141
time) should there be anymosque/religious/educationalinstitutions close to theconstruction sites and usersmake objections.
• Take special care and useappropriate equipment whenworking next to acultural/religious institution.
• Stop work immediately andnotify the site manager if,during construction, anarchaeological or burial siteis discovered. It is an offenceto recommence work in thevicinity of the site untilapproval to continue is givenby the relevant authority(i.e.PMU).
• Provide separate prayerfacilities to the constructionworkers.
• Show appropriate behaviorwith all construction workersespecially women andelderly people.
Resources
EnvironmentalImpact/ ImpactSource
Description Mitigation Measures Mitigation Strategy
ResponsibilitiesIndicator KeyPerformanceExecution Monitoring
• Allow the workers toparticipate in praying duringconstruction time.
• Resolve cultural issues inconsultation with localleaders and supervisionconsultants.
• Establish a mechanism thatallows local people to raiseGrievances arising from theconstruction process

7/24/2019 02-FINAL PC-I JULY,2014.pdf
http://slidepdf.com/reader/full/02-final-pc-i-july2014pdf 108/141
construction process.
6.11 Graveyard 125 graves relocated. • These Graves have to beshifted. The proponent willobtain Fatwa from local Muftibefore shifting the graves.During such operation theproponent will inform localadministration and seek theirassistance for security. Therequest will also be extendedto Health Department fordeputation of medical andparamedical staff during theoperation.
Creating social harmonyamong the locals andproponents.
Contractor SupervisionConsultant /PEDO/Localreligiousleader
Non -compliancewith approvedplan
For Operation/Maintenance Phase
1. Land
Resources
1.1 Landacquisition
• Reduction in cultivatedland.
• Increase of productivitythrough improvedmanagement of land(agricultural, range, forestry
Minimum land taken for theproject implementation.
PEDO EPA Non – compliancewith approvedPlan.
Resources
EnvironmentalImpact/ ImpactSource
Description Mitigation Measures Mitigation Strategy
ResponsibilitiesIndicator KeyPerformanceExecution Monitoring
improvements) to offseteffects of land taken forproject implementation.
1.2 Sedimentation • Sedimentation ofreservoir and loss ofstorage capacity.
• Control of land use inwatershed (especiallyprevention of conversion offorests to agriculture).
•
Reforestation and/or soilconservation activities inwatersheds.
• Hydraulic removal of
Watershed management tocontrol deforestation.
Watershed management topromote reforestation and
soil conservation activities.
Under sluicing provided
PEDO ForestDeptt.
Non – compliancewith approvedPlan.

7/24/2019 02-FINAL PC-I JULY,2014.pdf
http://slidepdf.com/reader/full/02-final-pc-i-july2014pdf 109/141
Hydraulic removal ofsediments (flushing, sluicing,release of density currents).
Under sluicing provided.
1.3 Waste Waste from powerhousearea and colony area.
• Adherence to the WasteManagement Plan andmeasures put in place.
Compliance with wastemanagement plan.
PEDO EPA Non – compliancewith approvedPlan.
2. Water
resources
2.1 Proliferation ofaquatic weeds
•Proliferation of aquaticweeds in reservoir anddownstream impairing
dam discharge andfisheries which mightcause Eutrophication.
•Clearance of woodyvegetation from inundationzone prior to flooding
Provide weed controlmeasures Harvest of weedsfor compost or fodder.
• Regulation of waterdischarge and manipulationof water levels to discourageweed growth.
• In the absence of nutrientsand high oxygen contents,no Eutrophication isforeseen.
Development of fishery inthe reservoir creatingopportunities of income for
local population.
PEDO EPA Non – compliancewith approved
Plan.
2.2 Water quality • Deterioration of waterquality in reservoir.
• Clearance of woodyvegetation from inundationzone prior to flooding.
• Control of land uses,wastewater discharges, andagricultural chemical use in
Cutting of necessarytrees/shrubs/ grasses etc.in inundation zone.
Watershed monitoring andmanagement for waterpollution control.
PEDO/ ForestDeptt.
EPA Non – compliancewith approvedPlan.
Resources
EnvironmentalImpact/ ImpactSource
Description Mitigation Measures Mitigation Strategy
ResponsibilitiesIndicator KeyPerformanceExecution Monitoring
• Poor land use practicesin catchments areasabove reservoir resultingin increased siltation and
watershed.
• Limit retention time of waterin Reservoir.
• Provision for multi-levelreleases to avoid dischargeof anoxic water.
• Afforestation programmesto be urged/ promoted byPEDO.
Reservoir operation to becoordinated withmanagement of riverdischarges/ outflows forenergy generation Undersluicing Provided.
Forest Deptt, has regularworking plans to preservethe area and to control siltloss by tree plantation.

7/24/2019 02-FINAL PC-I JULY,2014.pdf
http://slidepdf.com/reader/full/02-final-pc-i-july2014pdf 110/141
changes in water quality.y p
3. Biological
Resources
3.1 Riverinefisheries
------ ------ ---------- PEDO FisheryDeptt
Non – compliancewith approvedPlan.
4. Human
Resources
4.1 Water Use • Conflicting demands forwater use.
• As per Local Government Act, the PEDO will seekapproval from the localgovernment for exploitationof the water resources
Easy access of good waterQuality and Quantity.
PEDO MonitoringConsultant/EPA
Irrigationreleases toremainconsistentduringoperation.
4.2 Water-relateddiseases
• Increase of water-relateddiseases
• Vector control Vector control andtreatment discussed for apublic health protectionplan.
PEDO HealthDeptt.
Non – compliancewith approvedPlan.
4.3 CommunityProtection
• Reservoir bank stability.
• Noise and Vibrationto OccupationalWorkers
• Plantation of trees alongthe banks and constructionof spurs where Required.
• Compliance withOccupational Health &Safety standards.
To enhance the reservoirLife.
Contractor PEDO Monitoring ofcompliancewith Health &Safetystandards(includingmonthlyreporting ofaccidents).
4.4 Fishing • Snagging of fishing netsin submerged vegetationin reservoir.
• Construction of water tanksto collect spring water fordistribution in the village.
At present no fishingactivity exists.
PEDO - Non – compliancewith Plan.
TABLE – 11.5:
Estimated Environmental Cost
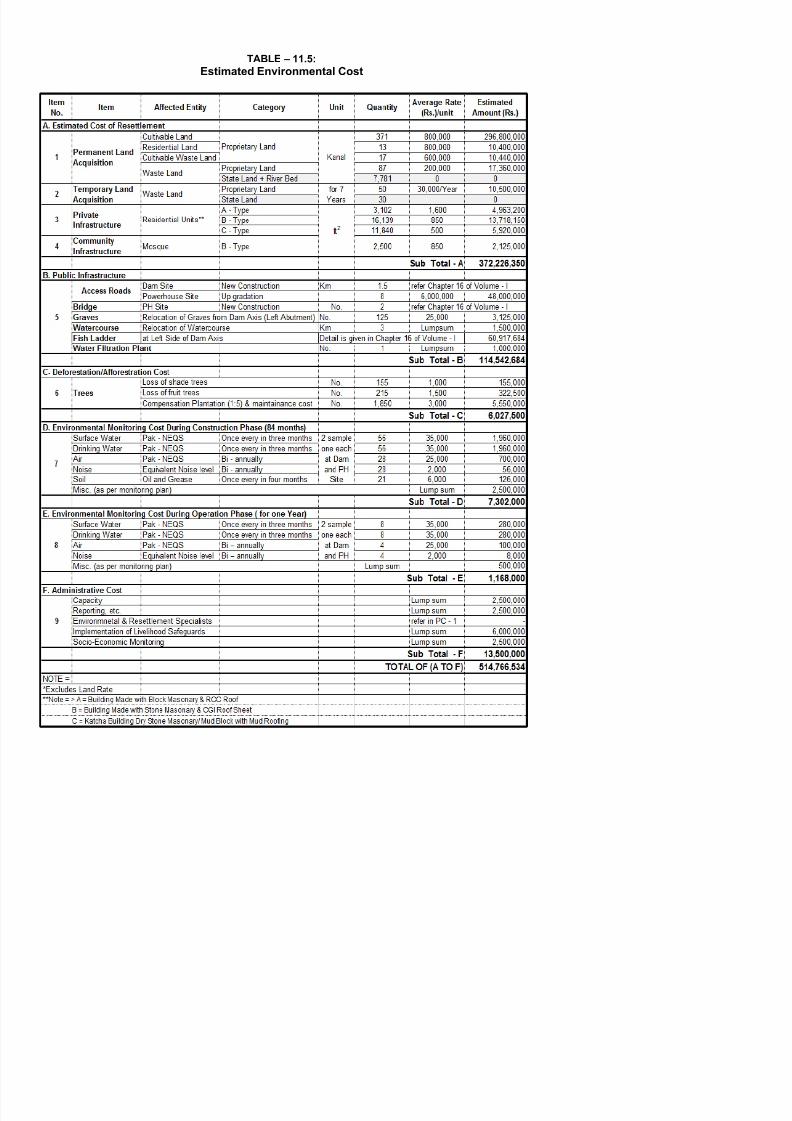
7/24/2019 02-FINAL PC-I JULY,2014.pdf
http://slidepdf.com/reader/full/02-final-pc-i-july2014pdf 111/141
Table 11.6
Alternative Thermal Power Plant Cost Summary
DescriptionCombined Cycle
Plant with Gas
Combined Cycle
Plant with
Furnace Oil
$

7/24/2019 02-FINAL PC-I JULY,2014.pdf
http://slidepdf.com/reader/full/02-final-pc-i-july2014pdf 112/141
Capital Cost, Excluding Interest during Construction (US$/kW) 1,162 2,036
Implementation Period (Years) 4.00 4.00
Auxiliary Consumption (%) 2.03% 2.03%
Sent Out Efficiency (%) 49% 43.7%
O&M Cost 3.0% 3.0%
Fuel Cost (Rs./kWh) 9.06 16.88
Equipment Life (Years) 25.00 25.00
Source: 1/ Commodity Priced Data World Bank2/ Projection of Fuel Prices by World Bank
Rs. Million
CDM TOTAL
CAPITAL COSTREFURB.
COSTO&M COST TOTAL
CAPITAL
COST
REFURB.
COSTO&M COST FUEL COST TOTAL BENEFITS BENEFITS
1 2,952.428 2,952.428 - - - - (2,952.428)
2 4,920.723 4,920.723 - - - - (4,920.723)
3 9,841.427 9,841.427 - - - - (9,841.427)
( )
TABLE 11.7
ECONOMIC ANALYSIS USING COMBINED CYCLE PLANT WITH FURNACE OIL AS THERMAL EQUIVALENT
GAHRAIT SWIR LASHT HYDROPOWER PROJECT
YEAR YEAR OF
OPERATION
PROJECT COSTS COSTS OF EQ.THERMAL PLANT
NET BENEFITS

7/24/2019 02-FINAL PC-I JULY,2014.pdf
http://slidepdf.com/reader/full/02-final-pc-i-july2014pdf 113/141
4 14,762.145 14,762.145 - - - - (14,762.145)
5 14,762.141 14,762.141 10,333.200 10,333.200 - 10,333.200 (4,428.941)
6 19,682.854 19,682.854 15,499.800 15,499.800 - 15,499.800 (4,183.054)
7 16,730.426 16,730.426 18,083.100 18,083.100 - 18,083.100 1,352.674
8 14,762.141 14,762.141 7,749.900 7,749.900 7,749.900 (7,012.241)
9 1 984.143 984.143 1,549.980 26,112.454 27,662.434 317.735 27,980.169 26,996.026
10 2 984.143 984.143 1,549.980 26,112.454 27,662.434 317.735 27,980.169 26,996.026
11 3 984.143 984.143 1,549.980 26,112.454 27,662.434 317.735 27,980.169 26,996.026 12 4 984.143 984.143 1,549.980 26,112.454 27,662.434 317.735 27,980.169 26,996.026
13 5 984.143 984.143 1,549.980 26,112.454 27,662.434 317.735 27,980.169 26,996.026
14 6 984.143 984.143 1,549.980 26,112.454 27,662.434 317.735 27,980.169 26,996.026
15 7 984.143 984.143 1,549.980 26,112.454 27,662.434 317.735 27,980.169 26,996.026
16 8 984.143 984.143 1,549.980 26,112.454 27,662.434 317.735 27,980.169 26,996.026
17 9 984.143 984.143 1,549.980 26,112.454 27,662.434 317.735 27,980.169 26,996.026
18 10 984.143 984.143 1,549.980 26,112.454 27,662.434 317.735 27,980.169 26,996.026
19 11 984.143 984.143 1,549.980 26,112.454 27,662.434 373.806 28,036.240 27,052.097
20 12 984.143 984.143 1,549.980 26,112.454 27,662.434 373.806 28,036.240 27,052.097
21 13 984.143 984.143 1,549.980 26,112.454 27,662.434 373.806 28,036.240 27,052.097
22 14 984.143 984.143 1,549.980 26,112.454 27,662.434 373.806 28,036.240 27,052.097
23 15 984.143 984.143 1,549.980 26,112.454 27,662.434 373.806 28,036.240 27,052.097
24 16 984.143 984.143 1,549.980 26,112.454 27,662.434 373.806 28,036.240 27,052.097
25 17 984.143 984.143 1,549.980 26,112.454 27,662.434 373.806 28,036.240 27,052.097
26 18 984.143 984.143 1,549.980 26,112.454 27,662.434 373.806 28,036.240 27,052.097
27 19 984.143 984.143 1,549.980 26,112.454 27,662.434 373.806 28,036.240 27,052.097
28 20 984.143 984.143 1,549.980 26,112.454 27,662.434 373.806 28,036.240 27,052.097
29 21 984.143 984.143 1,549.980 26,112.454 27,662.434 373.806 28,036.240 27,052.097
30 22 984.143 984.143 1,549.980 26,112.454 27,662.434 373.806 28,036.240 27,052.097
31 23 984.143 984.143 1,549.980 26,112.454 27,662.434 373.806 28,036.240 27,052.097
32 24 984.143 984.143 1,549.980 26,112.454 27,662.434 373.806 28,036.240 27,052.097
33 25 984.143 984.143 - 1,549.980 26,112.454 27,662.434 373.806 28,036.240 27,052.097
34 26 442.864 984.143 1,427.007 7,749.900 1,549.980 26,112.454 35,412.334 373.806 35,786.140 34,359.132
35 27 738.108 984.143 1,722.251 11,624.850 1,549.980 26,112.454 39,287.284 373.806 39,661.090 37,938.838
36 28 1,476.214 984.143 2,460.357 13,562.325 1,549.980 26,112.454 41,224.759 373.806 41,598.565 39,138.208
37 29 2,214.322 984.143 3,198.465 5,812.425 1,549.980 26,112.454 33,474.859 373.806 33,848.665 30,650.200
38 30 2,214.321 984.143 3,198.464 - 1,549.980 26,112.454 27,662.434 373.806 28,036.240 24,837.776
39 31 2,952.428 984.143 3,936.571 1,549.980 26,112.454 27,662.434 - 27,662.434 23,725.863
40 32 2,509.564 984.143 3,493.707 1,549.980 26,112.454 27,662.434 - 27,662.434 24,168.727
41 33 2,214.321 984.143 3,198.464 1,549.980 26,112.454 27,662.434 - 27,662.434 24,463.970
42 34 - 984.143 984.143 1,549.980 26,112.454 27,662.434 - 27,662.434 26,678.291
43 35 984.143 984.143 1,549.980 26,112.454 27,662.434 - 27,662.434 26,678.291
44 36 984.143 984.143 1,549.980 26,112.454 27,662.434 - 27,662.434 26,678.291
45 37 984.143 984.143 1,549.980 26,112.454 27,662.434 - 27,662.434 26,678.291
46 38 984.143 984.143 1,549.980 26,112.454 27,662.434 - 27,662.434 26,678.291
47 39 984.143 984.143 1,549.980 26,112.454 27,662.434 - 27,662.434 26,678.291
48 40 984 143 984 143 1 549 980 26 112 454 27 662 434 - 27 662 434 26 678 291
Rs. Million
CDM TOTAL
CAPITAL REFURB. O&M COST TOTAL CAPITAL REFURB. O&M COST FUEL COST TOTAL BENEFITS BENEFITS
1 2,952.428 2,952.428 - - - (2,952.428)
2 4,920.723 4,920.723 - - - (4,920.723) 3 9,841.427 9,841.427 - - - - (9,841.427)
4 14,762.145 14,762.145 - - - - (14,762.145)
5 14,762.141 14,762.141 6,341.200 - 6,341.200 6,341.200 (8,420.941)
TABLE 11.8
ECONOMIC ANALYSIS USING COMBINED CYCLE PLANT WITH GAS AS THERMAL EQUIVALENT
YEAR
YEAR OF
OPERATI
ON
PROJECT COSTS COSTS OF EQ.THERMAL PLANT NET
BENEFITS
GAHRAIT SWIR LASHT HYDROPOWER PROJECT
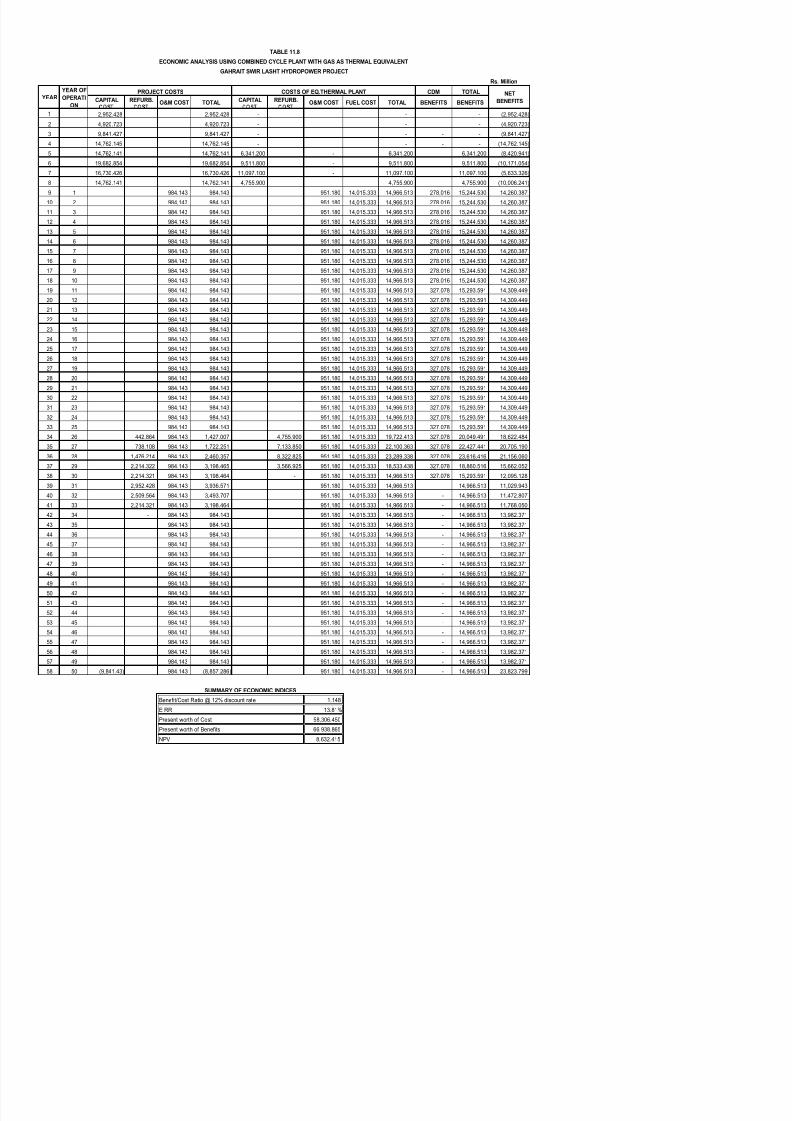
7/24/2019 02-FINAL PC-I JULY,2014.pdf
http://slidepdf.com/reader/full/02-final-pc-i-july2014pdf 114/141
6 19,682.854 19,682.854 9,511.800 - 9,511.800 9,511.800 (10,171.054)
7 16,730.426 16,730.426 11,097.100 - 11,097.100 11,097.100 (5,633.326)
8 14,762.141 14,762.141 4,755.900 4,755.900 4,755.900 (10,006.241)
9 1 984.143 984.143 951.180 14,015.333 14,966.513 278.016 15,244.530 14,260.387
10 2 984.143 984.143 951.180 14,015.333 14,966.513 278.016 15,244.530 14,260.387
11 3 984.143 984.143 951.180 14,015.333 14,966.513 278.016 15,244.530 14,260.387
12 4 984.143 984.143 951.180 14,015.333 14,966.513 278.016 15,244.530 14,260.387 13 5 984.143 984.143 951.180 14,015.333 14,966.513 278.016 15,244.530 14,260.387
14 6 984.143 984.143 951.180 14,015.333 14,966.513 278.016 15,244.530 14,260.387
15 7 984.143 984.143 951.180 14,015.333 14,966.513 278.016 15,244.530 14,260.387
16 8 984.143 984.143 951.180 14,015.333 14,966.513 278.016 15,244.530 14,260.387
17 9 984.143 984.143 951.180 14,015.333 14,966.513 278.016 15,244.530 14,260.387
18 10 984.143 984.143 951.180 14,015.333 14,966.513 278.016 15,244.530 14,260.387
19 11 984.143 984.143 951.180 14,015.333 14,966.513 327.078 15,293.591 14,309.449
20 12 984.143 984.143 951.180 14,015.333 14,966.513 327.078 15,293.591 14,309.449
21 13 984.143 984.143 951.180 14,015.333 14,966.513 327.078 15,293.591 14,309.449
22 14 984.143 984.143 951.180 14,015.333 14,966.513 327.078 15,293.591 14,309.449 23 15 984.143 984.143 951.180 14,015.333 14,966.513 327.078 15,293.591 14,309.449
24 16 984.143 984.143 951.180 14,015.333 14,966.513 327.078 15,293.591 14,309.449
25 17 984.143 984.143 951.180 14,015.333 14,966.513 327.078 15,293.591 14,309.449
26 18 984.143 984.143 951.180 14,015.333 14,966.513 327.078 15,293.591 14,309.449
27 19 984.143 984.143 951.180 14,015.333 14,966.513 327.078 15,293.591 14,309.449
28 20 984.143 984.143 951.180 14,015.333 14,966.513 327.078 15,293.591 14,309.449
29 21 984.143 984.143 951.180 14,015.333 14,966.513 327.078 15,293.591 14,309.449
30 22 984.143 984.143 951.180 14,015.333 14,966.513 327.078 15,293.591 14,309.449
31 23 984.143 984.143 951.180 14,015.333 14,966.513 327.078 15,293.591 14,309.449
32 24 984.143 984.143 951.180 14,015.333 14,966.513 327.078 15,293.591 14,309.449 33 25 984.143 984.143 951.180 14,015.333 14,966.513 327.078 15,293.591 14,309.449
34 26 442.864 984.143 1,427.007 4,755.900 951.180 14,015.333 19,722.413 327.078 20,049.491 18,622.484
35 27 738.108 984.143 1,722.251 7,133.850 951.180 14,015.333 22,100.363 327.078 22,427.441 20,705.190
36 28 1,476.214 984.143 2,460.357 8,322.825 951.180 14,015.333 23,289.338 327.078 23,616.416 21,156.060
37 29 2,214.322 984.143 3,198.465 3,566.925 951.180 14,015.333 18,533.438 327.078 18,860.516 15,662.052
38 30 2,214.321 984.143 3,198.464 - 951.180 14,015.333 14,966.513 327.078 15,293.591 12,095.128
39 31 2,952.428 984.143 3,936.571 - 951.180 14,015.333 14,966.513 - 14,966.513 11,029.943
40 32 2,509.564 984.143 3,493.707 951.180 14,015.333 14,966.513 - 14,966.513 11,472.807
41 33 2,214.321 984.143 3,198.464 951.180 14,015.333 14,966.513 - 14,966.513 11,768.050
42 34 - 984.143 984.143 951.180 14,015.333 14,966.513 - 14,966.513 13,982.371 43 35 984.143 984.143 951.180 14,015.333 14,966.513 - 14,966.513 13,982.371
44 36 984.143 984.143 951.180 14,015.333 14,966.513 - 14,966.513 13,982.371
45 37 984.143 984.143 951.180 14,015.333 14,966.513 - 14,966.513 13,982.371
46 38 984 143 984 143 951 180 14 015 333 14 966 513 - 14 966 513 13 982 371
Total CostTotal
BenefitsNet Benefits Total Cost Net Benefits Total Benef its Net Benefits Total Cost
Total
BenefitsNet Benefits
1 2,952.428 - (2,952.428) 3,247.671 (3,247.671) - (2,952.428) 3,247.671 - (3,247.671)
2 4,920.723 - (4,920.723) 5,412.795 (5,412.795) - (4,920.723) 5,412.795 - (5,412.795)
3 9,841.427 - (9,841.427) 10,825.570 (10,825.570) - (9,841.427) 10,825.570 - (10,825.570) 4 14,762.145 - (14,762.145) 16,238.359 (16,238.359) - (14,762.145) 16,238.359 - (16,238.359)
5 14,762.141 10,333.200 (4,428.941) 16,238.355 (5,905.155) 9,299.880 (5,462.261) 16,238.355 9,299.880 (6,938.475)
6 19,682.854 15,499.800 (4,183.054) 21,651.140 (6,151.340) 13,949.820 (5,733.034) 21,651.140 13,949.820 (7,701.320)
Table 11.9
SENSITIVITY ANALYSIS USING COMBINED CYCLE PLANT AS THERM AL EQUIVALENT
Years Year Of
Operation
Base Case Cost Overrun by 10% Benefits Decline by 10% Combination
GAHRAIT SWIR LASHT HYDROPOWER PROJECT

7/24/2019 02-FINAL PC-I JULY,2014.pdf
http://slidepdf.com/reader/full/02-final-pc-i-july2014pdf 115/141
7 16,730.426 18,083.100 1,352.674 18,403.469 (320.369) 16,274.790 (455.636) 18,403.469 16,274.790 (2,128.679)
8 14,762.141 7,749.900 (7,012.241) 16,238.355 (8,488.455) 6,974.910 (7,787.231) 16,238.355 6,974.910 (9,263.445)
9 1 984.143 27,980.169 26,996.026 1,082.557 26,897.612 25,182.152 24,198.009 1,082.557 25,182.152 24,099.595
10 2 984.143 27,980.169 26,996.026 1,082.557 26,897.612 25,182.152 24,198.009 1,082.557 25,182.152 24,099.595
11 3 984.143 27,980.169 26,996.026 1,082.557 26,897.612 25,182.152 24,198.009 1,082.557 25,182.152 24,099.595
12 4 984.143 27,980.169 26,996.026 1,082.557 26,897.612 25,182.152 24,198.009 1,082.557 25,182.152 24,099.595
13 5 984.143 27,980.169 26,996.026 1,082.557 26,897.612 25,182.152 24,198.009 1,082.557 25,182.152 24,099.595
14 6 984.143 27,980.169 26,996.026 1,082.557 26,897.612 25,182.152 24,198.009 1,082.557 25,182.152 24,099.595
15 7 984.143 27,980.169 26,996.026 1,082.557 26,897.612 25,182.152 24,198.009 1,082.557 25,182.152 24,099.595
16 8 984.143 27,980.169 26,996.026 1,082.557 26,897.612 25,182.152 24,198.009 1,082.557 25,182.152 24,099.595
17 9 984.143 27,980.169 26,996.026 1,082.557 26,897.612 25,182.152 24,198.009 1,082.557 25,182.152 24,099.595
18 10 984.143 27,980.169 26,996.026 1,082.557 26,897.612 25,182.152 24,198.009 1,082.557 25,182.152 24,099.595
19 11 984.143 28,036.240 27,052.097 1,082.557 26,953.682 25,232.616 24,248.473 1,082.557 25,232.616 24,150.058
20 12 984.143 28,036.240 27,052.097 1,082.557 26,953.682 25,232.616 24,248.473 1,082.557 25,232.616 24,150.058
21 13 984.143 28,036.240 27,052.097 1,082.557 26,953.682 25,232.616 24,248.473 1,082.557 25,232.616 24,150.058
22 14 984.143 28,036.240 27,052.097 1,082.557 26,953.682 25,232.616 24,248.473 1,082.557 25,232.616 24,150.058
23 15 984.143 28,036.240 27,052.097 1,082.557 26,953.682 25,232.616 24,248.473 1,082.557 25,232.616 24,150.058
24 16 984.143 28,036.240 27,052.097 1,082.557 26,953.682 25,232.616 24,248.473 1,082.557 25,232.616 24,150.058
25 17 984.143 28,036.240 27,052.097 1,082.557 26,953.682 25,232.616 24,248.473 1,082.557 25,232.616 24,150.058
26 18 984.143 28,036.240 27,052.097 1,082.557 26,953.682 25,232.616 24,248.473 1,082.557 25,232.616 24,150.058
27 19 984.143 28,036.240 27,052.097 1,082.557 26,953.682 25,232.616 24,248.473 1,082.557 25,232.616 24,150.058
28 20 984.143 28,036.240 27,052.097 1,082.557 26,953.682 25,232.616 24,248.473 1,082.557 25,232.616 24,150.058
29 21 984.143 28,036.240 27,052.097 1,082.557 26,953.682 25,232.616 24,248.473 1,082.557 25,232.616 24,150.058
30 22 984.143 28,036.240 27,052.097 1,082.557 26,953.682 25,232.616 24,248.473 1,082.557 25,232.616 24,150.058
31 23 984.143 28,036.240 27,052.097 1,082.557 26,953.682 25,232.616 24,248.473 1,082.557 25,232.616 24,150.058
32 24 984.143 28,036.240 27,052.097 1,082.557 26,953.682 25,232.616 24,248.473 1,082.557 25,232.616 24,150.058
33 25 984.143 28,036.240 27,052.097 1,082.557 26,953.682 25,232.616 24,248.473 1,082.557 25,232.616 24,150.058
34 26 1,427.007 35,786.140 34,359.132 1,569.708 34,216.432 32,207.526 30,780.519 1,569.708 32,207.526 30,637.818
35 27 1,722.251 39,661.090 37,938.838 1,894.476 37,766.613 35,694.981 33,972.729 1,894.476 35,694.981 33,800.504 36 28 2,460.357 41,598.565 39,138.208 2,706.393 38,892.172 37,438.708 34,978.351 2,706.393 37,438.708 34,732.315
37 29 3,198.465 33,848.665 30,650.200 3,518.311 30,330.354 30,463.798 27,265.334 3,518.311 30,463.798 26,945.487
38 30 3,198.464 28,036.240 24,837.776 3,518.310 24,517.929 25,232.616 22,034.152 3,518.310 25,232.616 21,714.305
39 31 3,936.571 27,662.434 23,725.863 4,330.228 23,332.205 24,896.190 20,959.619 4,330.228 24,896.190 20,565.962
40 32 3,493.707 27,662.434 24,168.727 3,843.077 23,819.356 24,896.190 21,402.483 3,843.077 24,896.190 21,053.113
41 33 3,198.464 27,662.434 24,463.970 3,518.310 24,144.123 24,896.190 21,697.726 3,518.310 24,896.190 21,377.880
42 34 984.143 27,662.434 26,678.291 1,082.557 26,579.876 24,896.190 23,912.047 1,082.557 24,896.190 23,813.633
43 35 984.143 27,662.434 26,678.291 1,082.557 26,579.876 24,896.190 23,912.047 1,082.557 24,896.190 23,813.633
44 36 984.143 27,662.434 26,678.291 1,082.557 26,579.876 24,896.190 23,912.047 1,082.557 24,896.190 23,813.633
45 37 984.143 27,662.434 26,678.291 1,082.557 26,579.876 24,896.190 23,912.047 1,082.557 24,896.190 23,813.633
46 38 984.143 27,662.434 26,678.291 1,082.557 26,579.876 24,896.190 23,912.047 1,082.557 24,896.190 23,813.633 47 39 984.143 27,662.434 26,678.291 1,082.557 26,579.876 24,896.190 23,912.047 1,082.557 24,896.190 23,813.633
48 40 984.143 27,662.434 26,678.291 1,082.557 26,579.876 24,896.190 23,912.047 1,082.557 24,896.190 23,813.633
49 41 984.143 27,662.434 26,678.291 1,082.557 26,579.876 24,896.190 23,912.047 1,082.557 24,896.190 23,813.633
50 42 984.143 27,662.434 26,678.291 1,082.557 26,579.876 24,896.190 23,912.047 1,082.557 24,896.190 23,813.633
Rs. Million
Capital Cost Refurb. Cost O&M Cost Total Cost
Energy
Generated
MkWh
Energy
Available for
Sale MkWh
Benefits from
Sale of Energy
CDM Benefit Total Benefit
1 3,280.470 - 3,280.470 - - - - - (3,280.470)
2 5,734.170 - 5,734.170 - - - - - (5,734.170)
3 12,034.090 - 12,034.090 - - - - - (12,034.090)
TABLE 11.10
FINANCIAL ANALYSIS
GAHRAIT SWIR LASHT HYDROPOWER PROJECT
Years
PROJECT COSTS PROJECT BENEFITS
Net Benefit
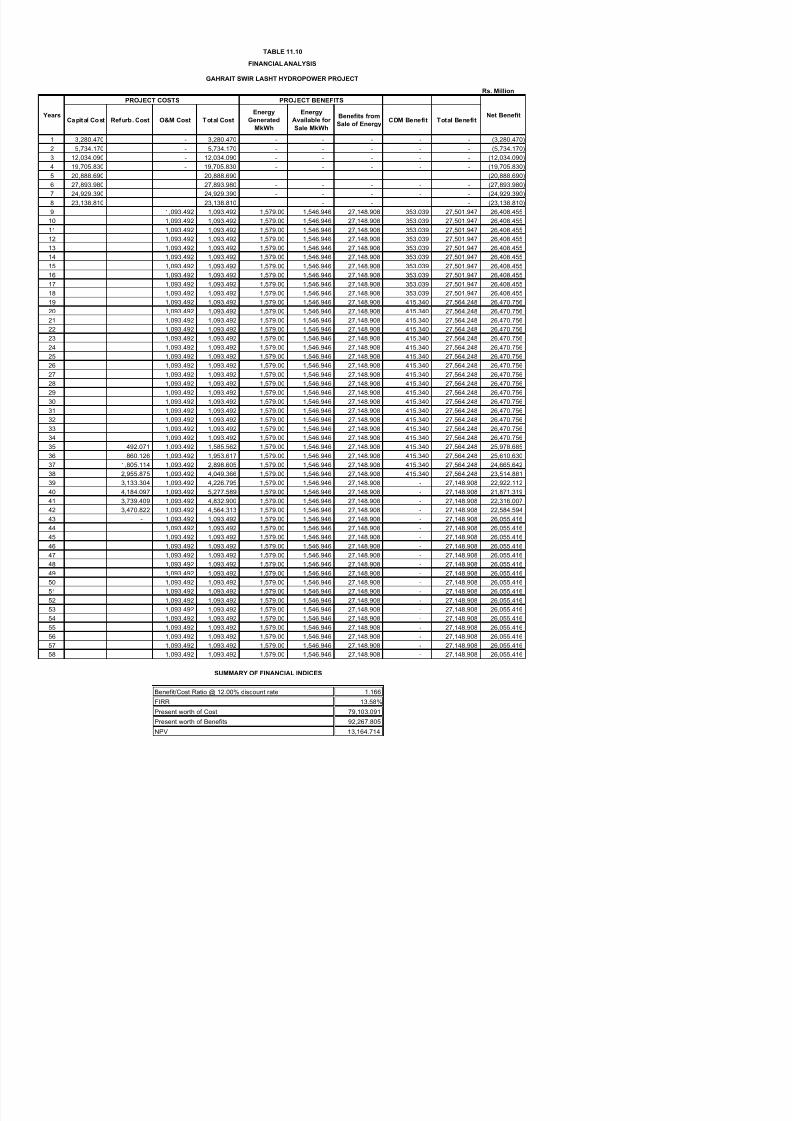
7/24/2019 02-FINAL PC-I JULY,2014.pdf
http://slidepdf.com/reader/full/02-final-pc-i-july2014pdf 116/141
, , ( , )
4 19,705.830 - 19,705.830 - - - - - (19,705.830)
5 20,888.690 20,888.690 - - - - - (20,888.690)
6 27,893.980 27,893.980 - - - - - (27,893.980)
7 24,929.390 24,929.390 - - - - - (24,929.390)
8 23,138.810 23,138.810 - - - (23,138.810)
9 1,093.492 1,093.492 1,579.00 1,546.946 27,148.908 353.039 27,501.947 26,408.455
10 1,093.492 1,093.492 1,579.00 1,546.946 27,148.908 353.039 27,501.947 26,408.455 11 1,093.492 1,093.492 1,579.00 1,546.946 27,148.908 353.039 27,501.947 26,408.455
12 1,093.492 1,093.492 1,579.00 1,546.946 27,148.908 353.039 27,501.947 26,408.455
13 1,093.492 1,093.492 1,579.00 1,546.946 27,148.908 353.039 27,501.947 26,408.455
14 1,093.492 1,093.492 1,579.00 1,546.946 27,148.908 353.039 27,501.947 26,408.455
15 1,093.492 1,093.492 1,579.00 1,546.946 27,148.908 353.039 27,501.947 26,408.455
16 1,093.492 1,093.492 1,579.00 1,546.946 27,148.908 353.039 27,501.947 26,408.455
17 1,093.492 1,093.492 1,579.00 1,546.946 27,148.908 353.039 27,501.947 26,408.455
18 1,093.492 1,093.492 1,579.00 1,546.946 27,148.908 353.039 27,501.947 26,408.455
19 1,093.492 1,093.492 1,579.00 1,546.946 27,148.908 415.340 27,564.248 26,470.756
20 1,093.492 1,093.492 1,579.00 1,546.946 27,148.908 415.340 27,564.248 26,470.756
21 1,093.492 1,093.492 1,579.00 1,546.946 27,148.908 415.340 27,564.248 26,470.756 22 1,093.492 1,093.492 1,579.00 1,546.946 27,148.908 415.340 27,564.248 26,470.756
23 1,093.492 1,093.492 1,579.00 1,546.946 27,148.908 415.340 27,564.248 26,470.756
24 1,093.492 1,093.492 1,579.00 1,546.946 27,148.908 415.340 27,564.248 26,470.756
25 1,093.492 1,093.492 1,579.00 1,546.946 27,148.908 415.340 27,564.248 26,470.756
26 1,093.492 1,093.492 1,579.00 1,546.946 27,148.908 415.340 27,564.248 26,470.756
27 1,093.492 1,093.492 1,579.00 1,546.946 27,148.908 415.340 27,564.248 26,470.756
28 1,093.492 1,093.492 1,579.00 1,546.946 27,148.908 415.340 27,564.248 26,470.756
29 1,093.492 1,093.492 1,579.00 1,546.946 27,148.908 415.340 27,564.248 26,470.756
30 1,093.492 1,093.492 1,579.00 1,546.946 27,148.908 415.340 27,564.248 26,470.756
31 1,093.492 1,093.492 1,579.00 1,546.946 27,148.908 415.340 27,564.248 26,470.756
32 1,093.492 1,093.492 1,579.00 1,546.946 27,148.908 415.340 27,564.248 26,470.756
33 1,093.492 1,093.492 1,579.00 1,546.946 27,148.908 415.340 27,564.248 26,470.756
34 1,093.492 1,093.492 1,579.00 1,546.946 27,148.908 415.340 27,564.248 26,470.756
35 492.071 1,093.492 1,585.562 1,579.00 1,546.946 27,148.908 415.340 27,564.248 25,978.685
36 860.126 1,093.492 1,953.617 1,579.00 1,546.946 27,148.908 415.340 27,564.248 25,610.630
37 1,805.114 1,093.492 2,898.605 1,579.00 1,546.946 27,148.908 415.340 27,564.248 24,665.642
38 2,955.875 1,093.492 4,049.366 1,579.00 1,546.946 27,148.908 415.340 27,564.248 23,514.881
39 3,133.304 1,093.492 4,226.795 1,579.00 1,546.946 27,148.908 - 27,148.908 22,922.112
40 4,184.097 1,093.492 5,277.589 1,579.00 1,546.946 27,148.908 - 27,148.908 21,871.319
41 3,739.409 1,093.492 4,832.900 1,579.00 1,546.946 27,148.908 - 27,148.908 22,316.007
42 3,470.822 1,093.492 4,564.313 1,579.00 1,546.946 27,148.908 - 27,148.908 22,584.594
43 - 1,093.492 1,093.492 1,579.00 1,546.946 27,148.908 - 27,148.908 26,055.416
44 1,093.492 1,093.492 1,579.00 1,546.946 27,148.908 - 27,148.908 26,055.416
45 1,093.492 1,093.492 1,579.00 1,546.946 27,148.908 - 27,148.908 26,055.416
46 1,093.492 1,093.492 1,579.00 1,546.946 27,148.908 - 27,148.908 26,055.416
47 1 093 492 1 093 492 1 579 00 1 546 946 27 148 908 - 27 148 908 26 055 416
TABLE - 11.11
GAHRAIT SWIR LASHT HYDROPOWER PROJECT
COST PER kWh and Kw
S No Description Rs In Million

7/24/2019 02-FINAL PC-I JULY,2014.pdf
http://slidepdf.com/reader/full/02-final-pc-i-july2014pdf 117/141
1 Base Cost 109,349.19
a) Local 75,239.820
b) FEC 34,109.370
2 Import Duties and Taxes @ 5% 1,387.830
3 Interest During Construction 43,510.400
- a) Local 31,652.970
- b) Foreign 11,857.430
5 Price escalation 26,868.410
- a) Local 24,877.040
- b) Foreign 1,991.370
6 Financial Cost 181,115.830
- a) Local 145,015.090
- b) Foreign 36,100.740
7 Amortization @ 10.65% for 20 years & Levelized over 50 years of : 8,891.411
- a) Amortization for Local Currency 7,119.139
- b) Amortization for Foreign Currency 1,772.272
8Operation & Maintenance cost @ 1.00% of Total Cost 1,093.492
9 Annual Recurring Cost 9,984.903
10 Annual Energy generated GWh 1,579.000
S.No Description Rs. In Million
Interest O&M Charges Depreciation Total
1 27,501.947 19,288.836 1,093.492 8,150.212 28,532.540 (1,030.594)
2 27 501 947 18 976 107 1 093 492 8 150 212 28 219 811 (717 864)
TABLE-11.12
Profit & Loss Statement- Gahrait Swir Lasht Hydropower Project
(Costs in Rs. Million)
YearsCash Inflow/
Revenue
Cash Out FlowProfit (+) or
Losses(-)
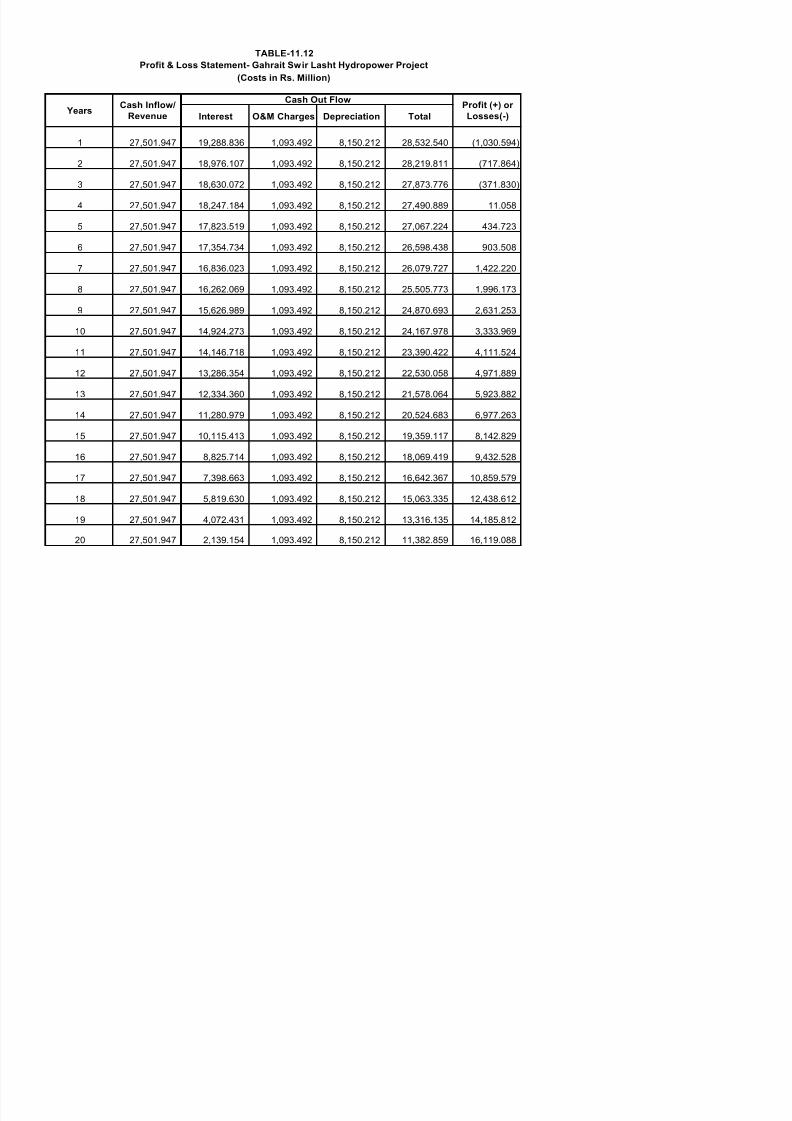
7/24/2019 02-FINAL PC-I JULY,2014.pdf
http://slidepdf.com/reader/full/02-final-pc-i-july2014pdf 118/141
2 27,501.947 18,976.107 1,093.492 8,150.212 28,219.811 (717.864)
3 27,501.947 18,630.072 1,093.492 8,150.212 27,873.776 (371.830)
4 27,501.947 18,247.184 1,093.492 8,150.212 27,490.889 11.058
5 27,501.947 17,823.519 1,093.492 8,150.212 27,067.224 434.723
6 27,501.947 17,354.734 1,093.492 8,150.212 26,598.438 903.508
7 27,501.947 16,836.023 1,093.492 8,150.212 26,079.727 1,422.220
8 27,501.947 16,262.069 1,093.492 8,150.212 25,505.773 1,996.173
9 27,501.947 15,626.989 1,093.492 8,150.212 24,870.693 2,631.253
10 27,501.947 14,924.273 1,093.492 8,150.212 24,167.978 3,333.969
11 27,501.947 14,146.718 1,093.492 8,150.212 23,390.422 4,111.524
12 27,501.947 13,286.354 1,093.492 8,150.212 22,530.058 4,971.889
13 27,501.947 12,334.360 1,093.492 8,150.212 21,578.064 5,923.882
14 27,501.947 11,280.979 1,093.492 8,150.212 20,524.683 6,977.263
15 27,501.947 10,115.413 1,093.492 8,150.212 19,359.117 8,142.829
16 27,501.947 8,825.714 1,093.492 8,150.212 18,069.419 9,432.528
17 27,501.947 7,398.663 1,093.492 8,150.212 16,642.367 10,859.579
18 27,501.947 5,819.630 1,093.492 8,150.212 15,063.335 12,438.612
19 27,501.947 4,072.431 1,093.492 8,150.212 13,316.135 14,185.812
20 27,501.947 2,139.154 1,093.492 8,150.212 11,382.859 16,119.088

7/24/2019 02-FINAL PC-I JULY,2014.pdf
http://slidepdf.com/reader/full/02-final-pc-i-july2014pdf 119/141
FIGURES
PROPOSED GAHRAIT-SWIR LASHT HYDROPOWIER
PROJEC
CHINA
A
CHINA

7/24/2019 02-FINAL PC-I JULY,2014.pdf
http://slidepdf.com/reader/full/02-final-pc-i-july2014pdf 120/141
KHYBER PASS
PUNJAB
~
0 25 50 75 100km
CLENT:
~ S U T M
p
TEAM
~
LlNEOFeoNT Rol..
. .
..
---
JAMMU KASHMIR
(DISPUTED TERRITORY)
LEGEND
®
LINE OF CONTROL (LOC)
INTERNATIONAL BOUNDARY
PROVINCIAL BOUNDARY
TOWNS, VILLAGES
CAPITAL CITY
KARAKORAM HIGHWAY (KKH)
G.TROAD
NHAROADS
--1-.. DAM BARRAGE
RIVER
. . . RESERVOIR (EXISTING)
RESERVOIR (PLANNED)
ISLAMIC REPUBLIC OF PAKISTAN
BALOCHISTAN
IRAN
MAKRAN
COASTAL AREA
ARABIAN SEA
DISTANCE CHART
PLACES DISTANCE
PESHAWAR TO CHITRAL.............. . 370
KM
DIR TO CHITRAL............ .............. ... 150 KM
CHITRAL TO GRAM CHASHMA..... 74 KM
CHITRAL TO BOONI .....................
CHITRAL TO MASTUJ ..................
CHITRAL TO GILGIT ....................
CHITRAL TO DROSH ...................
CHITRAL TO LOWARI TOP .........
O.lgn•dl l r:
75KM
105KM
380KM
45KM
90KM
Ct.cbdl l r:
__..
INDIA
PRINCIPAL DATA
Project Location (Dam) .........
.
Distance from Peshawar ........ .
Travelling time from Peshawar
Distance from Chitral. ............
Nearest Commercial Airport
..
.
Nearest Railway Station ........ .
Mobile Phone, Internet access
10 km U/S
of
Drosh Town.
335
km
10 Hrs
35
km
Chitral, Peshawar
Peshawar
Yes
GAHRAIT-SWIR LASHT HYDROPOWER PROJECT
FEASIBILITY STUDY
GOVERNMENT OF KHYBER PAKHTUNKHWA
FAROOQ
BHUTIA
M.IQBALGILL
ACE
EGC
TEAM
PAKHTUNKHWA HYDEL DEVELOPMENT ORGANIZATION
D B r :
A p p r c ~ ~ V t ~ d B y :
LOCATION PLAN
DATE:
lFIGURENO
6 1
Joint Venture
of
Associated Consulting Engin eers- ACE (Pvt.) Ltd,
(PHYDO)
IMTIAZKHAN IHALVI
JULY, 2014
I
GCandTEAM
00
NOTES:
1.
ALL
LEVELS ARE
IN
r ETERS
2.
AU
OIMEMIIONS ARE IN
METERS
UNLESS D I C T E D OTliERWISE.
1
FOR ZCXlM PLAN
OF
DAM IMl
PONERHOUBE ilEREFER
DRAWINGN0.104A1D5.
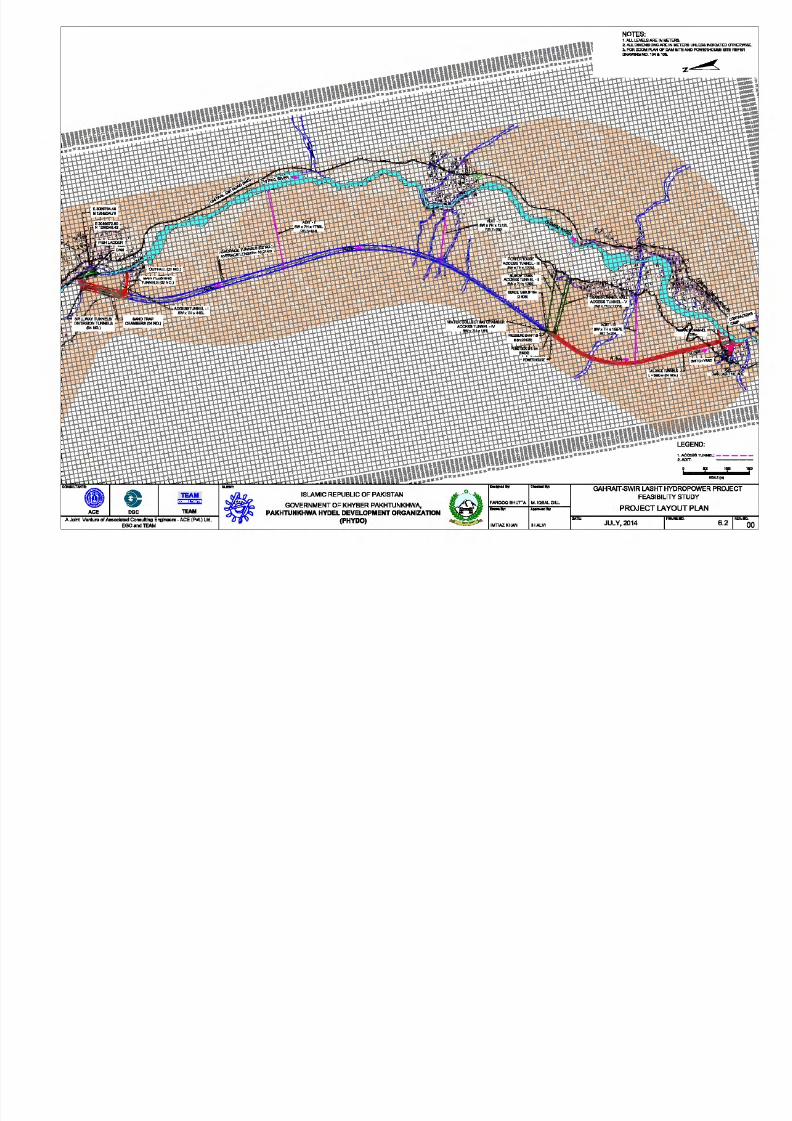
7/24/2019 02-FINAL PC-I JULY,2014.pdf
http://slidepdf.com/reader/full/02-final-pc-i-july2014pdf 121/141
GOVERNMENT OF KHYBER PAKHTUNKHWA,
PAKHTUNKHWA
HYDEL
DEVELOPMENT ORGANIZAT10N
PHYDO)
IM11AZKHAN IHALVI
1.ACCE88 T\JNNEL..:
2 ADrT:
D a 1011 1l IO
IICALE(Io)
GAHRAIT
SWIR
LASHT HYDROPOWER PROJECT
FEASIBILITY STUDY
PROJECT LAYOUT PLAN
NOTES:
1 ALL LEVELS ARE IN METERS
2
ALL
DIMENSIONS ARE
IN
METERS UNLESS INDICATED
OTiiERWISE
3
LENGTH OF
RESEVOIR
IS
APPROXIMATELY 4 47 Krn
4 RESERVIOR ARE A AT E 1337 =1 54
krn
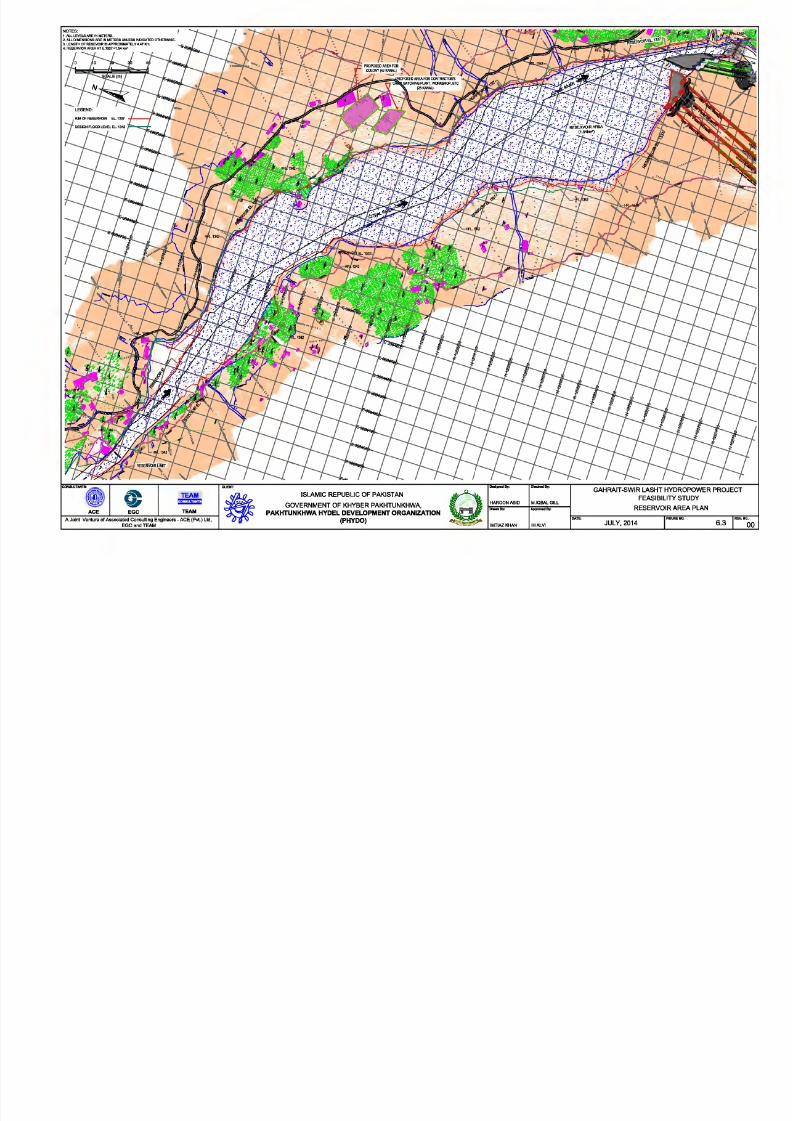
7/24/2019 02-FINAL PC-I JULY,2014.pdf
http://slidepdf.com/reader/full/02-final-pc-i-july2014pdf 122/141
TEAM
TEAM
A Joint Venture
o
Associated Consulting Engin eers- ACE Pvt.) Ltd,
EGCandTEAM
GOVERNMENT OF KHYBER PAKHTUNKHWA,
PAKHTUNKHWA HYDEL DEVELOPMENT ORGANIZATION
PHYDO)
HAROONABID
o ar:
IMTIAZKHAN
M.IQBALGILL
A p p r c ~ ~ V t ~ d B r
IHALVI
GAHRAIT-SWIR LASHT HYDROPOWER PROJECT
FEASIBILITY STUDY
RESERVOIR AREA PLAN
JULY, 2014
6.3
00

7/24/2019 02-FINAL PC-I JULY,2014.pdf
http://slidepdf.com/reader/full/02-final-pc-i-july2014pdf 123/141
GOVERNMENT OF KHYBER PAKHTUNKHWA,
PAKHTUNKHWA HYDEL DEVELOPMENT ORGANIZATION
PHYDO)
IMTIAZKHAN
M
IQBAL GILL
A p p r c ~ ~ V t ~ d B y
IHALVI
FEASIBILITY STUDY
PROJECT LAYOUT PLAN
ZOOM PLAN OF POWERHOUSE SITE
JULY, 2014 I
6 4
-
.AI I . I .E. ' I I IU_I I_
J.o11&.1....-cMMi.IN...,_,.. ,_IGCI'. T&IIImtiJMIIL
l . l . I N ' m i O I ~ · ~ M ' I I I . V 4 A f ~ .
4. ·rE. •t.oiW
I
~
teo
:11111
aco <4411
IICALE
..
:
?.;;?
i -i'
~
;.. . ;.
...
~
;:
~

7/24/2019 02-FINAL PC-I JULY,2014.pdf
http://slidepdf.com/reader/full/02-final-pc-i-july2014pdf 124/141
ACE
I
EGC I TE'AM
AJ * I
Vlntu
.
l
Allllodllld
Condng
Engl1tM 11
·ACE
(M)Ud,
EGCIIIIITEAM
:It:
Re•servoir
Ar
ea
ISLAMIC REPUBUC
OF PAKISTAN
GOVERNMENT
OF
KHYBER PAKHT\JNKHWA,
PAIOfTVNKHWA
HYDEL DEVELOPMENT
ORGANIZATION
PHYDO)
t
/
y
t>
.
Waste
Total Area
1
Cultiv
able
56,098
73717
28 2,256
Riv·
er
ed
4
3,593
I
183 13 17 45 2534
S01
-
7.4
I 53 .5 52 .9 0.0 23 .9 5.8
4.1
( }
GAHRAIT-SWIRLASHT
HYDROPOWER PROJECT
- I MIAI 'TM ZN MtQIJAL FEASIBILITY S'IUDY
_
LAND AQUISITION PlAN
AT
RESEVIOR
AREA I
.::::;Ei
Y
IMIIAZKIWI IHALYI
. . , . ,
JULY 2014
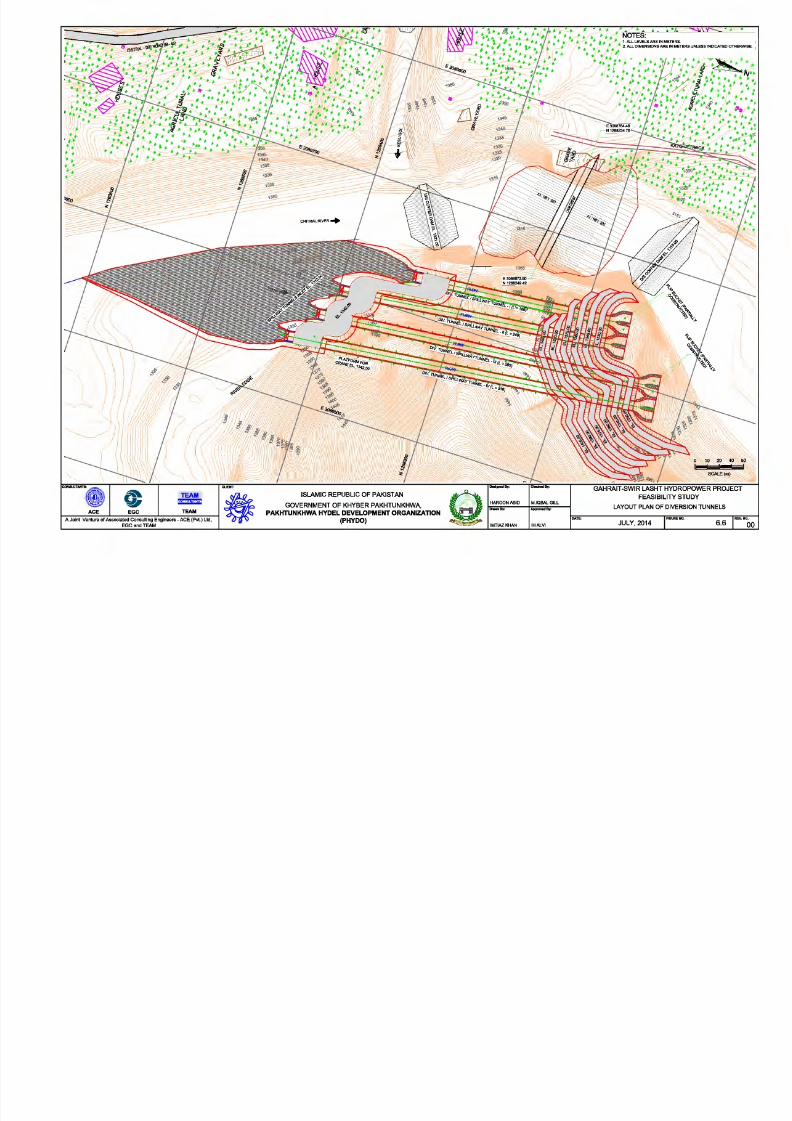
7/24/2019 02-FINAL PC-I JULY,2014.pdf
http://slidepdf.com/reader/full/02-final-pc-i-july2014pdf 125/141
GOVERNMENT OF KHYBER PAKHTUNKHWA,
PAKHTUNKHWA HYDEL DEVELOPMENT ORGANIZATION
PHYDO)
IMTIAZKHAN IHALVI
B
..._
,
/
/
NOTES:
1.
ALL LEVELS ARE IN METERS.
2. ALL DIMENSIONS ARE
IN
METERS UNLESS INDICATED OTHERWISE.
3. FOR DETAILS 8 REFER DRAWING NO. 301 & 302 IN VOLUME-IV
CONCRETE SURFACING
SECTION A-A

7/24/2019 02-FINAL PC-I JULY,2014.pdf
http://slidepdf.com/reader/full/02-final-pc-i-july2014pdf 126/141
DIVERSION TUNNEL INTAKE PLAN
Cl
RANE
OPERATING
EL1342.00--,.
AT
I
-
.00
-.,A
I
/ I
BmxH
~ ~ C E
I
;<
I
I t
'
,I
\ /
\1
\
m
I
'
1
I / \ I
/ 7.6
/
1313.00..
'
I
16.5
I
I
ELEVATION
OF PORTAL
.
EGC
..
EAM
A Joint Venture
of
Associated Consulting Engin eers- ACE
(Pvt.)
Ltd,
EGCandTEAM
GATE
7.8m
CLENT:
8.00m ROAD 14.0m SERVICE AREA
CRANE FOR
MAINTAINANCE
OF GATE
J•
1
1342.00..
~
.
I
v v
-
. .... .... .. ..,.,
GATE RAILING
/
/
_
300mm CONCRETE SURFACING
~ R O C K B O L T I N G A S P E R
J•
1
GEO TECHNICAL REQUIREMENTS
:•·.--
- ..
:• ·
DETAIL-B
(SECTION B·B)
ISLAMIC REPUBLIC OF
PAKISTAN
GOVERNMENT OF KHYBER PAKHTUNKHWA,
PAKHTUNKHWA HYDEL DEVELOPMENT ORGANIZATION
(PHYDO)
O.lgn•dl l r:
HAROONABID
D B r :
IMTIAZKHAN
Ct.cbdl l r:
120mm
(AVERAGE)
THICK SHOTCRETE
50Dmm (AVERAGE) THICKRCC LINING
12mm (AVERAGE) THICKSTEEL LINING
WITH
EXTERNALSTIFFENERS
CONTACT GROUTING
ROCK BOLTS
AND
CONSOLIDATION
GROunNG
7.60
TYPICAL SECTION
OF DIVERSION TUNNEL
&
::
e a 10
D\iALE m)
GAHRAIT- SWIR LASHT HYDROPOWER
PROJECT
FEASIBILITY STUDY
M.IQBALGILL
DETAILS OF DIVERSION TUNNEL SPILLWAY TUNNEL INLET
A p p r c ~ ~ V t ~ d B y
I HALVI
JULY, 2014
6.7
00
NOTES:
1.
ALL
LEVELS ARE IN METERS.
2.
ALL
DIMENSIONS ARE IN METERS UNLESS INDICATED OTHERWISE.
3. FOR DETAILS C REFER DRAWING NO.
3 1
&3021N VOLUME-IV.
3.00
~ t :
: : ~ : 0
;:
•• C )
... :
c:
. ~
· · · ~
6.85
;
: · · · ~
7.60
SECTION D-D

7/24/2019 02-FINAL PC-I JULY,2014.pdf
http://slidepdf.com/reader/full/02-final-pc-i-july2014pdf 127/141
SECTIONC-C
CLENT:
p
EGC
TEAM
A Joint Venture
of
Associated Consulting Engin eers- ACE
(Pvt.)
Ltd,
EGCandTEAM
ffi
0:
12.04
o1
I
i
ROCK BOLTS
ISLAMIC REPUBLIC OF PAKISTAN
GOVERNMENT OF KHYBER PAKHTUNKHWA,
PAKHTUNKHWA HYDEL DEVELOPMENT ORGANIZATION
(PHYDO)
7.00
5.04
\
SIDEWALL
-...........
'"-....
FLOW
°
OUTLET INVERT
lc
I
EL 1307.00
~ · · · ·: · ~ · . · · · · · ~ · · · · · ·
I
til
~ 2 0 0
1
1
DETAIL C
(DIVERSION TUNNEL OUTLET)
IO.Ignad l l r :
I
Ct cbdl l r:
M.IQBALGILL
A p p r c ~ ~ V t ~ d B y :
IHALVI
5.04
I
DATE:
I
• 10
SCALE(m)
GAHRAIT- SWIR LASHT HYDROPOWER PROJECT
FEASIBILITY STUDY
DETAILS OF DIVERSION TUNNEL OUTLET
JULY, 2014 6.8
00
~ · : : ~ ~
· ~ . \ . ~ : ~ ·
. ; { Y ; ~ : ~ : : ~ : ; : : ~ ~ ~
6.00
I CREST EL 1321.00 I
w::u»:..
.
:;:;:;:;
..
.
.....
.60 M RIPRAP
NOTES:
1. ALL LEVELS ARE IN METERS.
2. ALL DIMENSIONS ARE IN METERS UNLESS INDICATED OTHERWISE.
3. FOR LOCATION OF U/S AND IS COFFER DAMS REFER
DRAWING NO. 300 IN VOLUME-IV
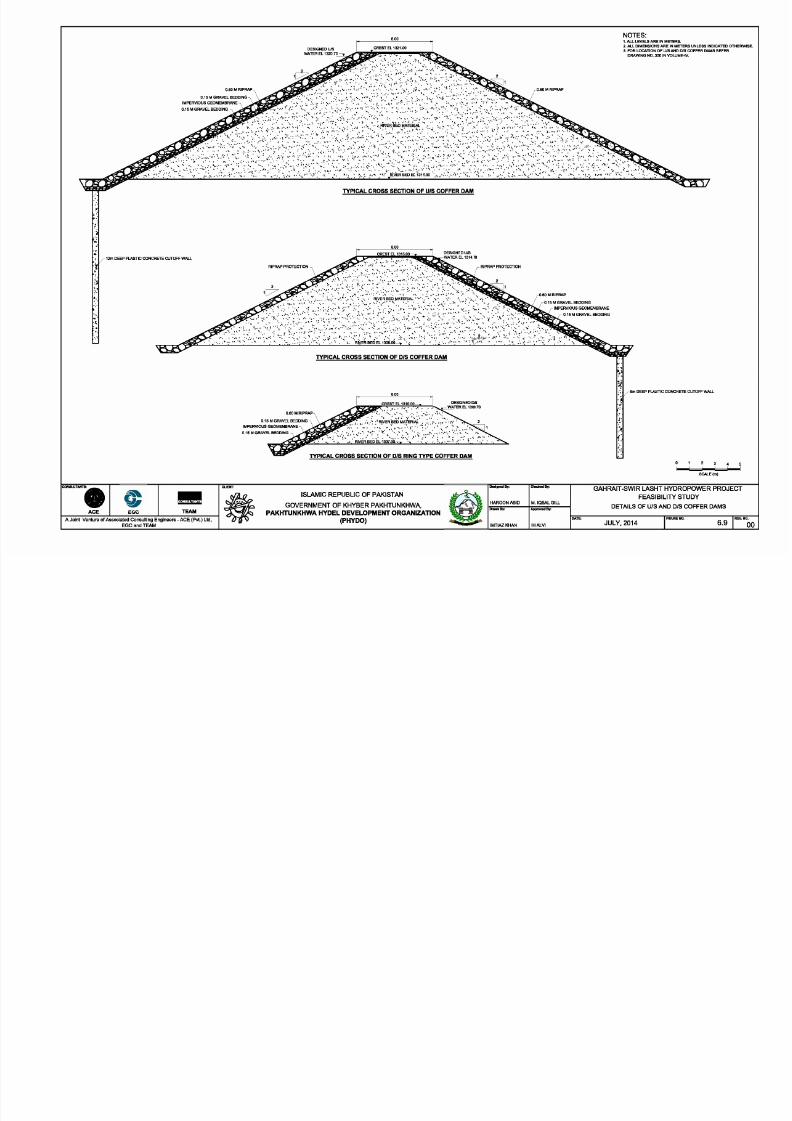
7/24/2019 02-FINAL PC-I JULY,2014.pdf
http://slidepdf.com/reader/full/02-final-pc-i-july2014pdf 128/141
\'
·
~ · .
·1
~ S U L T M B
ACE
12m DEEP PLASTIC CONCRETE CUTOFF WALL
.
EGC
..
EAM
A Joint Venture
of
Associated Consulting Engin eers- ACE
(Pvt.)
Ltd,
EGCandTEAM
CLENT:
TYPICAL CROSS SECTION OF U/S COFFER DAM
I e.oo
CRESTEL
1 3 1 5 o o ~ E D U J S
•... • • 1
••
• • • WATER EL 1314.70
. :- ·.: .·:.
_·:
:;: ·:
TYPICAL CROSS SECTION OF D/S COFFER DAM
6.00
I CREST EL 1310.00-----.. l
_
~ ~ s ~ - ~ > ; ; : ; : ; ~
TYPICAL CROSS SECTION OF D/S RING TYPE COFFER DAM
ISLAMIC REPUBLIC OF PAKISTAN
GOVERNMENT OF KHYBER PAKHTUNKHWA,
PAKHTUNKHWA HYDEL DEVELOPMENT ORGANIZATION
(PHYDO)
O.lgn•dl l r:
Ct cbdl l r:
HAROONABID M
IQBAL GILL
D Br:
A p p r c ~ ~ V t ~ d B r
IMTIAZKHAN IHALVI
l•.i
.
: ·1
~ ~ ~
1 ~ ·
·
::
8m DEEP PLASTIC CONCRETE CUTOFF WALL
SCALE(m)
GAHRAIT-SWIR LASHT HYDROPOWER PROJECT
FEASIBILITY STUDY
DETAILS OF UIS AND D/S COFFER DAMS
JULY, 2014
6.9
00
NOTES:
1.AIIIeveleareinmeters.
2. All dlmerwlons are In
melln
unless Indicated otherwise.
LEGEND
.
Talus Deposit
J INFERRED BED ROCK
. ~ ; ;
CONSOLID TION
GROUTING
PL STIC CONCRETE CUT
OFF WALL

7/24/2019 02-FINAL PC-I JULY,2014.pdf
http://slidepdf.com/reader/full/02-final-pc-i-july2014pdf 129/141
.......
.......
.......
~ S U L T M B
p
~
CE
EGC
•
"
TEAM
~
TEAM
A Joint Venture
of
Associated Consulting
Engineers ACE
(Pvt.) Ltd,
EGCandTEAM
"
CLENT:
MIN. OPERATING EL 1331.00
i
----
,.a
DISTANCES (METERS)
LONGITUDINAL SECTION ALONG DAM AXIS & BURIED VALLEY
(LOOKING DOWN STREAM)
IO.Ign•dl lr : I Ct.cbdl lr :
ISLAMIC REPUBLIC
OF
PAKISTAN
GOVERNMENT
OF
KHYBER PAKHTUNKHWA,
~ C ~ O O N = A A r ~ ~
PAKHTUNKHWA HYDEL DEVELOPMENT ORGANIZATION
D Br:
Apprc IVIdBr:
(PHYDO)
4 : . - _
I LI R Z IIH LVI
SCALE:
IDUA1
1
s:IUMi 1:1
6 IJ T T T •I•
GAHRAIT-SWIR LASHT HYDROPOWER
PROJECT
FEASIBILITY STUDY
LONGITUDINAL SECTION
ALONG
DAM
AXIS & BURIED VALLEY
JULY, 2014
I
6 101
00
I
NOTES:
1.AU..
LEVELS
ARE
IN W E T ~ .
2. ALL
DIMENSIONS
ARE
IN
t.IEIERS UNLESS INliCA.lE D OTHBlWISE.
3.
FOR
SECTIONAI..(WG DAM REFER DRAWlNO NOA 1 & 4 3 trilVOLUW6N
'- '
_.. _
......
=-
b • • • •,•
/ \
......_
,/ '
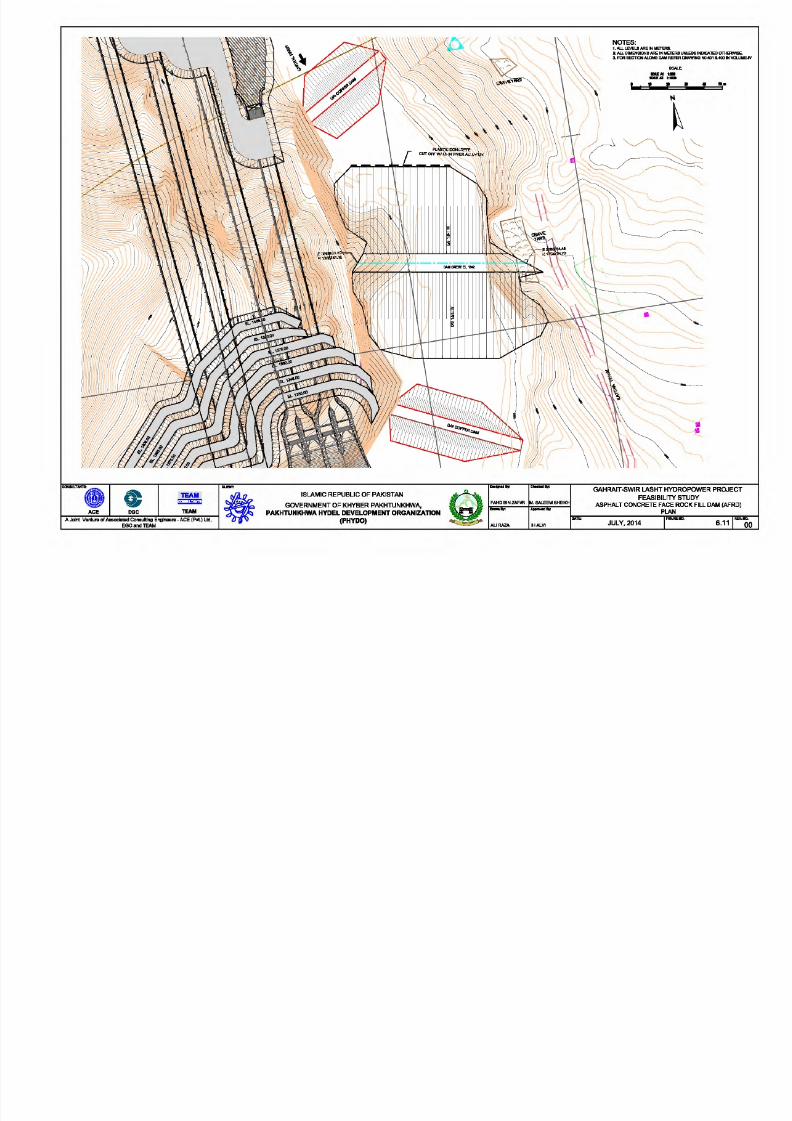
7/24/2019 02-FINAL PC-I JULY,2014.pdf
http://slidepdf.com/reader/full/02-final-pc-i-july2014pdf 130/141
e
OC
TEAM
:::::::::m:ii:l
1EAM
A Joint Vontura
o
Co,.oJtlng
Engl,..ow
-ACE
(Pvt.)
Lid.
EGCandTEAM
.._,
&
·-
........
ISLAMIC REPUBLIC
OF
PAKISTAN
GOVERNMENTOF KHYBER PAKHTUNKHWA,
Q
I_,,_M ~ · ~ ~
PAKHTUNKHWA HYDEL DEVELOPMENT ORGANIZAT10N
_.,
(PHYDO)
I
_ . . All RAZA
IH
ALVI
'
~ ~
'---
......
\
....
_
--
\
-
~
'
--
---
-
- -
--....
'-......._
~
•
~
'
GAHRAIT SWIR LASHT HYDROPOWER PROJECT
FEASIBILITY STUDY
ASPHALT CONCRETE FACE ROCK FILL DAM (AFRO)
PLAN
FlOUOEm
6.111 00
ULY 2014
......
U/S
0.28m (ASPHALT CONCRETE FACE)
SEE DETAIL A
NOTES:
1. ALL LEVELS ARE IN METERS.
2. ALL DIMENSIONS ARE IN METERS UNLESS INDICATED OTHERWISE.
DIS
1.0 m SLOPE PROTECTION
(Sleeted L.arge Rock Dazed ID DIS Face)
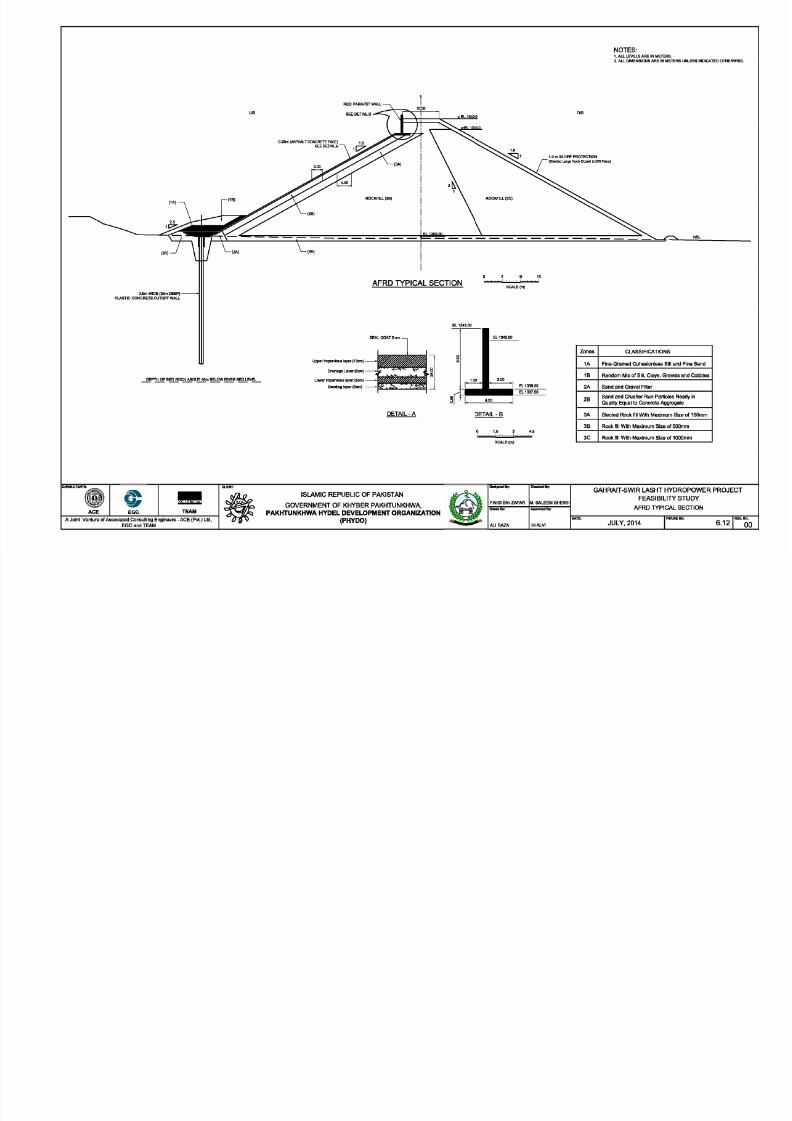
7/24/2019 02-FINAL PC-I JULY,2014.pdf
http://slidepdf.com/reader/full/02-final-pc-i-july2014pdf 131/141
0.6m WIDE (36m DEEP) ------JII
PLASTIC CONCRETE CUTOFF WALL
~ P T . . : . . Q E
~ O C ~ ~ m
~ W ~ R B . Q . b . E V E . . . . h . . . . .
CLENT:
p
GC
TEAM
A Joint Venture
of
Associated Consulting Engin eers- ACE
Pvt.)
Ltd,
EGCandTEAM
ROCKFILL
38)
ROCKFILL (3C)
0 5 10 15
AFRO TYPICAL SECTION
SCALE
(m)
Upper Impervious layer
(10cm)
Drainage Layer Scm ) - -
Lower lmpel 'louslayer
5cm) j
edding layer(Scm)
DETAIL-A
ISLAMIC REPUBLIC OF PAKISTAN
GOVERNMENT OF KHYBER PAKHTUNKHWA
PAKHTUNKHWA HYDEL DEVELOPMENT ORGANIZATION
(PHYDO)
EL
1343.00
1.50
EL
1342.00
2.00
4.00
EL 1338.00
EL
1337.50
DETAIL-B
0 1 5 3 4.5
SCALE(m)
O.lgn•dl l r:
Ct.cbdl l r :
FAHD BIN
ZJV AA
M. SALEEM SHEIKH
D-B r :
A p p r c ~ ~ V t ~ d B y :
AU RAZA IHALVI
Zones
1A
18
2A
28
3A
CLASSIFICATIONS
Fine-Grained Cohesionless Silt and Fine Sand
Random Mix of Silt, Clays, Gnavels and Cobbles
Sand and Gnavel Filter
Sand and Crusher Run Particles Nearly in
Quality Equal to Concrete Aggregate
Sleeted Rock fill With Maximum Size of 150mm
38 I Rock fill Maximum Size
of
500mm
3C Rock fill Maximum Size
of
1000mm
GAHRAIT-SWIR LASHT HYDROPOWER PROJECT
FEASIBILITY STUDY
AFRO TYPICAL SECTION
I -
JULY, 2014
I
6.121
00
ll
NOTES:
1. ALL LEVELS ARE IN METERS.
2. ALL DIMENSIONS ARE
IN METERS UNLESS
INDICATED
OTHERWISE.
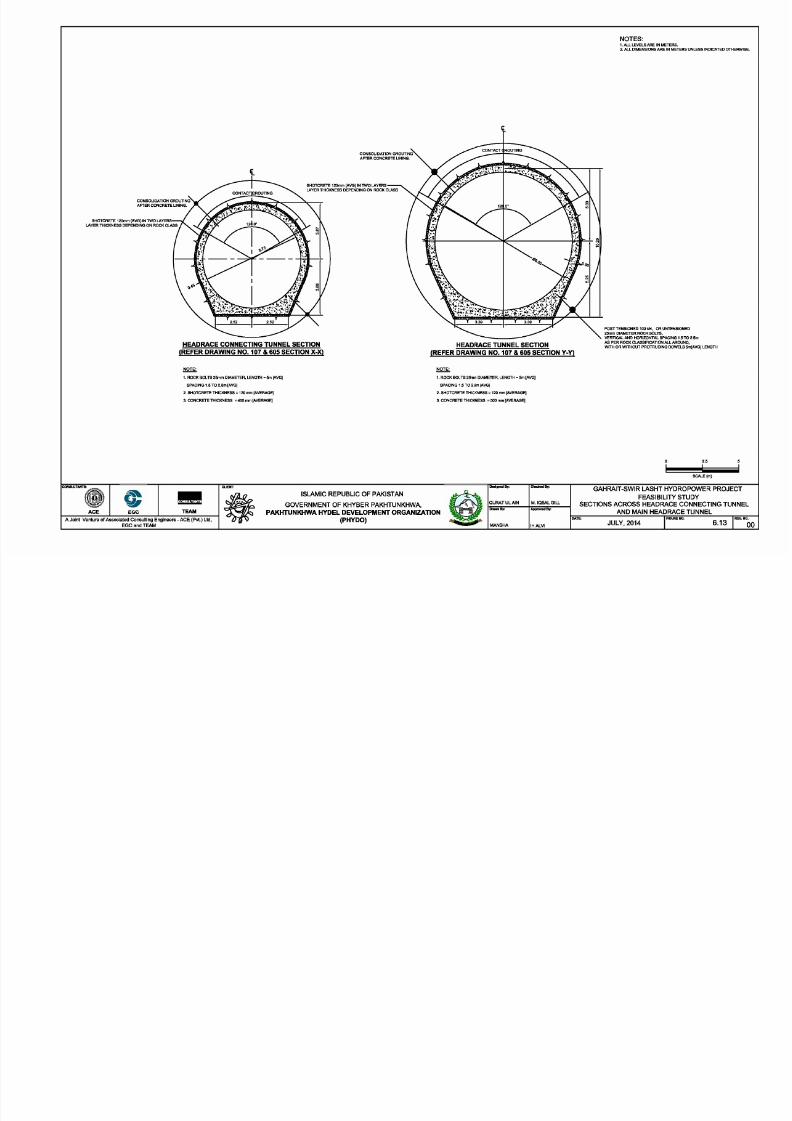
7/24/2019 02-FINAL PC-I JULY,2014.pdf
http://slidepdf.com/reader/full/02-final-pc-i-july2014pdf 132/141
SHOTCRETE
120mm
(AVG)
IN
TWO LAYERS
LAYER
THICKNESS DEPENDING
ON
ROCK
CLASS
,.
SHOTCRETE
120mm
(AVG)
IN
TWO
LAYERS
LAYER
THICKNESS DEPENDING ON
ROCK CLASS
HEADRACE CONNECTING TUNNEL SECTION
(REFER DRAWING NO. 107
&
605 SECTION X-X)
:JQ S;.
1. ROCK
BOLTS 25mm
DIAMETER, LENGTH '5m [AVG]
SPACING 1.5 TO
2.5m [AVG]
2. SHOTCRETE THICKNESS ' 120 mm
[AVERAGE]
3. CONCRETE THICKNESS
= 450 mm [AVERAGE]
CLENT:
..
ISLAMIC REPUBLIC OF PAKISTAN
GOVERNMENT OF KHYBER PAKHTUNKHWA,
HEADRACE TUNNEL SECTION
(REFER DRAWING NO. 107
&
605 SECTION Y-Y)
:JQ S;.
1. ROCK
BOLTS 25mm
DIAMETER, LENGTH ' 5m [AVG]
SPACING 1.5 TO
2.5m
[AVG]
2. SHOTCRETE THICKNESS ' 120 mm
[AVERAGE]
3. CONCRETE THICKNESS
=
500
mm [AVERAGE]
IO Ign•dl l r:
·
EGC
TEAM
PAKHTUNKHWA HYDEL DEVELOPMENT ORGANIZATION
D Br:
IQURATULAIN
I
M.
IQBAL GILL
A p p r c ~ ~ V t ~ d B r
A Joint Venture
of
Associated Consulting Engin eers- ACE
Pvt.)
Ltd,
EGCandTEAM
(PHYDO)
IMANSHA
IIH
ALVI
POST TENSIONED 100
kN, OR UNTENSIONED
25mm
DIAMETER ROCK
BOLTS,
VERTICAL AND HORIZONTAL SPACING
1.5
TO 2.5m
AS PER
ROCK CLASSIFICATION ALL
AROUND,
WITH OR
WITHOUT PROTRUDING
DOWELS 5m AVG)
LENGTH
2.5
SCALt:lmJ
GAHRAIT-SWIR LASHT HYDROPOWER PROJECT
FEASIBILITY STUDY
SECTIONS ACROSS HEADRACE CONNECTING TUNNEL
AND MAIN HEADRACE TUNNEL
JULY, 2014
I
6 13
I
00
URB PARAPET
EL1381.43
_
SOIL NAIL ROCK BOLT:
LOCK/RING
BEAM-----
EL.1378.93
200 mmSHORTCRETE ROCK BOLTS
CONSOLIDATlON GROUTING
NOTES:
1. ALL LEVELS ARE IN METERS.
2. ALL DIMENSIONS ARE
IN
METERS UNLESS INDICATED OTHERWISE.
LOCK BEAM
RING BEAM LOCK BEAM

7/24/2019 02-FINAL PC-I JULY,2014.pdf
http://slidepdf.com/reader/full/02-final-pc-i-july2014pdf 133/141
150 mm SHORTCRETE
IN
2
LAYERS WITH WIRE MESH le
ROCK BOLTS WITH DOWELS
DETAIL B
SHOTCRETE 150
mm IN
TWO
LAYERS WITH WIRE MESH.
CONCRETE LINING 400 mm THICKNESS
p
CLENT:
SECTION A-A
SURGE EL. 1376.43
__r_
:OCK BOLTS CONSOLIDAION
GROUTING ALL AROUND
ISLAMIC REPUBLIC OF PAKISTAN
A. -
GROUTING SEQUENCE
BOTTOM TO UP.
10.00
s
~ A
1
CK BOLTS WITH DOWELS
SHOTCRETE 150mm IN TWO
LAYERS WITH WIRE MESH
CONCRETE LINING 400 mm
{r==l rJ : : : : : : y ~ = = = = = = : : : : : : : : : : ~
_____ ~
r
...... -.
1306.90
L
1306.93
600 mm SHORTCRET E THICKNESS
SURGE SHAFT ELEVATION
IO.Ign•dllr: I Ct.cbdllr:
37.50
GAHRAIT-SWIR LASHT HYDROPOWER PROJECT
FEASIBILITY STUDY
~ S U L T M B
..
GOVERNMENT OF KHYBER PAKHTUNKHWA,
IQURATULAIN
I M IQBAL GILL
...... D B r :
A p p r c ~ ~ V t ~ d B r
ELEVATION AND CROSS SECTION OF SURGE SHAFT
ACE
EGC
TEAM
PAKHTUNKHWA HYDEL DEVELOPMENT ORGANIZATION
A Joint Venture
of
Associated Consulting
Engineers-ACE
Pvt.) Ltd,
(PHYDO)
EGCandTEAM
--
I
JEHANGIR A l
TAF
I IH ALVI
6.14
ULY, 2014
00
NOTES:
1. ALL LEVELS ARE IN METERS.
2. ALL DIMENSIONS ARE IN METERS UNLESS INDICATED OTHERWISE.

7/24/2019 02-FINAL PC-I JULY,2014.pdf
http://slidepdf.com/reader/full/02-final-pc-i-july2014pdf 134/141
p
EGC
SECTION N
N
(STEEL LINED PRESSURE SHAFT)
(REFER DRAWING NO. 110 803)
CLENT:
STEEL LINING 20mm THICK
ISLAMIC REPUBLIC OF PAKISTAN
GOVERNMENT OF KHYBER PAKHTUNKHWA,
TEAM
PAKHTUNKHWA HYDEL DEVELOPMENT ORGANIZATION
A Joint Venture
of
Associated Consulting
Engineers ACE
Pvt.) Ltd,
(PHYDO)
EGCandTEAM
STEEL
LINING
18mm
THICK
CONCRETE
LINING 0.60 m THICK
SECTION P P
(STEEL LINED PRESSURE TUNNEL)
(REFER DRAWING N0.110 803)
IO Ign•dllr: I Ct cbdllr :
M.
IQBAL
GILL
A p p r c ~ ~ V t ~ d l l r
I
DATE:
IH ALVI
0 1 2
SCALE m)
GAHRAIT-SWIR LASHT HYDROPOWER PROJECT
FEASIBILITY STUDY
TYPICAL CROSS SECTION OF PRESSURE SHAFT
AND PRESSURE TUNNEL
JULY, 2014
I
6.15 I 00
NOTES:
1
ALL LEVELS ARE
IN
METERS
2. ALL DIMENSIONS ARE IN MILLI METERS UNLESS
INDICATED OTHERWISE
UNIT4
<
CEILING CLADDING
UNIT3
<
UNIT2
<
UNIT1
H - - - - - - - - - - - - - - - - - - - - - - - - , 6 ~ , - - - - - - - - - - - - - - - - - - - - - - - - ~
i
769-----+ll
ROOF LEVEL
WAJ....KWAY
CEILING TRUSS
I
ERECTION BAY i 1 6 o o o ~
j --1ooo
G E N ~ ~ ~ ~ ; : ~ ~ ~ ~ ~ ~ N I T
I I I J
_f...
81500
(b
1 "
1
XII
r
1
11
I
1r
1
r
X
1
11
r
t=
11\
I ..,.,263.
j_
l
I I I I I
Tl
li
l ll
254.72m
S E E D ~ A I L 1 + t - - - - - - - - + - - - - - - - - - - - - - - - - - ~ ~ ~ E ~ B ~ ~ ~ ~ ~ ~ ~ ~ , L - - - - - - ~ - - ~ - - - - - - - - - - ~ ~ ~ ~ L - - - - + - - - - - - - - - - - - - - - - - - - - - - - - - - ~ - - - - ~ ~ - - - - - - - - - - - - ~ ~ ~ : : - - - - - - - - - - + ~ - - - - - - - - - - - - - - - - l
1:
I
l L ~
ll
A ~ ~ ~ ~ s 7
i i i T ' = " = = = = ; ~ ~ ~ F . . i T U N N E L ~
TORES Lilli

7/24/2019 02-FINAL PC-I JULY,2014.pdf
http://slidepdf.com/reader/full/02-final-pc-i-july2014pdf 135/141
I
1243.72m
____
J
.12m
.........
BEAN
_ ~ ,
--
~ . T r r I ··;·IV lrrrr= 1237nm,.1rM Tn: h ':tEAM fJ
M A I ~ ~ ~ T R O L
w ~ ~ c : ~ · r ~ z ~ : ~ · : , ~ ~ : : ~
~ . : ?
. ;,
.;;.
.
'it'...
T ; ~ · . . . .
~ · . ; :
1;·:.·.. ...i:. :.
/g ELECTRICAL 1 1 : 1
~ 0 0
II
( . ~ : ~ ; ; ; , : . . ~ · . ~ ~ j ; I .\ :;,.:. ;;: 'i-j.,; I I : . . ) ~ : : 1232.72m.., ~ ~ 1 ' , " 1 . : ( . ~ ~ ) / 1 ~ WORKSHOPS ~ ~ .,ELECTRIGALFLOOR1231 .72m
~
..
. t
::.:.
~
.
lo::.:L ••
,.
. . . .
0 ' ;/
~ ~ ~ R ~ :""-..
I
l
T 122B.72mv WORKSHOPS wllJRBINEFLOOR1228.
V IKJ
~ g ~ : ~
~ i t : ~ ~ ~ ~ - ; TUR IN : ; ~ : ~ ~ · · : . 4 ~ ~ 1225.nm .
: ~ ; . ; ; . : ~
· · ~ : ~ l ~ -
/
iKl t . d ~ j ~ / \ ~ . . ; . . .
· , . . .
···•;;.Ii ' · i · ; . , : , ~ - ~ \,;
.
• TTii p•:;.:::. ;:. . w • · ~ l · ~ 1 ; ;
(•t"''
•• ,o•• /
~ ~ ] ~ : : ; ~ · t C J ~ : ~ s r . ~ 1 ~ 2500-i-, : f l f f ~ [ ~ . i ~ t r ~ - i ·· ~ ~ ~ C J i · - ~ ) ; / . ~ · ,,,._nm
, ~ ; ~ : ~ : ;
~ l ~ - - : ~ r J = i ~ ~ - ~ ; ~ , - = .. ~ , ~ · · ~ ~ ~ - - - - - - - - - - - - - - t - . . . J ~ ~ ~ ~ ·
~ ~ . v
UNIT DEWATERING SUMP IN
FRONT OF SECTION
•<II
ROOF HEADING
TUNNEL
...
1 ·1..joo L I 1sooo I
II
I I
MAliN DRAINAGE SUMP 2 MAliN DRAINAGE SUMP 1
NIT DEWATERING SUMP IN
FRONT OF SECTION -
COOLING COOLING
WATERTANK1
WATERTANK2
. lill b.1
l-1500
LONGITUDINAL
SECTION THROUGH
MACHINE HALL CAVERN
SECTION A-A
SCALE 1:250
10000
- - - 4 ~ - - - = ~ ~ : : , 2 o o o o
UNIT DEWATERING SUMP IN
FRONT OF SECTION
-1
l -1soo 1oooo-l- -1oooo 185oo
WEARING COURSE
SUBIW3E
SECTION
B-B
SCALE 1:250
10000 20000 30000
y ,
EGC
CUENT:
I l l
TEAM
lo. gnMI. , . :
GOVERNMENT OF KHYBER PAKHTUNKHWA,
PAKHTUNKHWA HYDEL DEVELOPMENT ORGANIZATION
D ~ B y :
ICh.c-.:1.,.:
I AROOQ BHUTTA
Appruv.c By:
SCALE(nm)
GAHRAIT-SWIR LASHT HYDROPOWER PROJECT
FEASIBILITY STUDY
POWER HOUSE LONGITUDINAL SECTION
FIGURE
NO.
REV. NO.
A Joint Venrure
of
Associatsd Consulting Engineen1- ACE
(Pvt.)
Ltd,
EGCandTEAM
ISLAMIC REPUBLIC OFPAKISTAN
(PHYDO)
ISALMAN
IIHALVI
JULY, 2014
6.16
I
00
98750
r
i
NOTES:
1 ALL
LEVELS
ARE
IN
METERS
2
ALL DIMENSIONS
ARE
IN MILLI
METERS UNLESS
INDICATED OTHERWISE
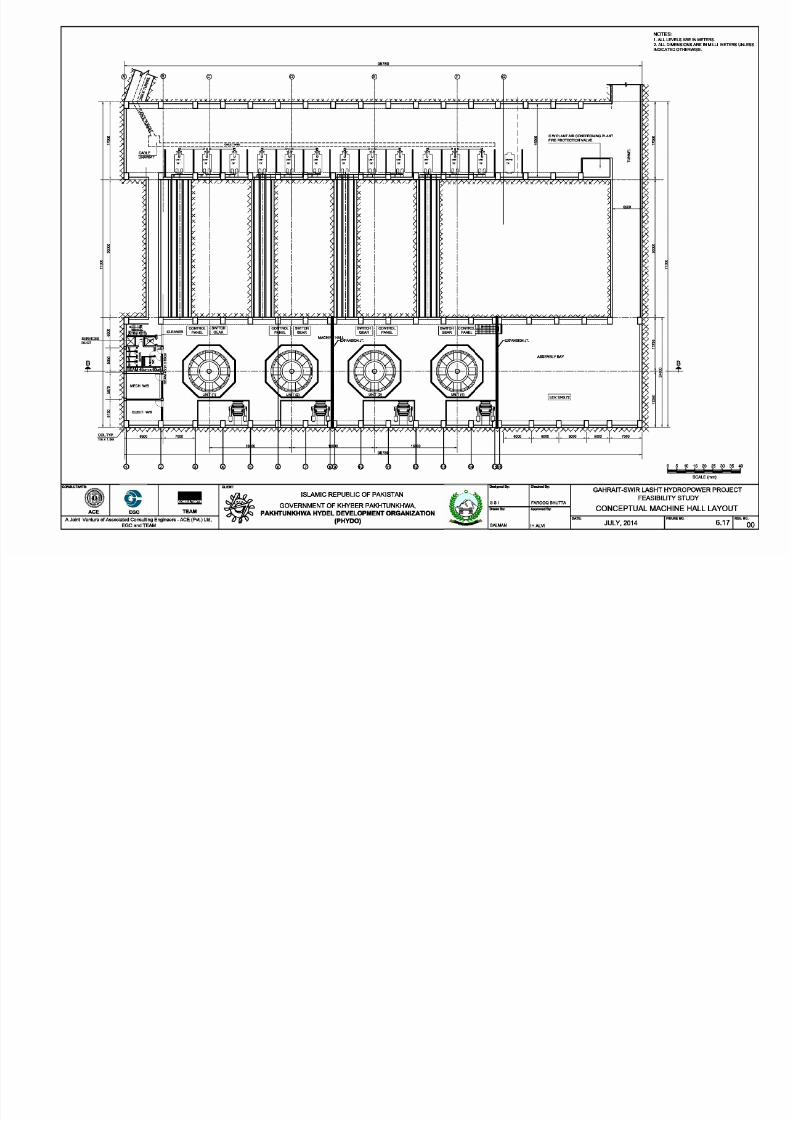
7/24/2019 02-FINAL PC-I JULY,2014.pdf
http://slidepdf.com/reader/full/02-final-pc-i-july2014pdf 136/141
CLENT:
p
ISlAMIC REPUBUC OF PAKISTAN
GOVERNMENT OF KHYBER PAKHTUNKHWA,
EGC
TEAM
PAKHTUNKHWA HYDEL DEVELOPMENT ORGANIZATION
A Joint Venture
of
Associated Consulting Engin eers- ACE
Pvt.)
Ltd,
(PHYDO)
EGCandTEAM
IO Ign•dl l r:
I Ct cbdl lr :
ISSI
_
D_Br :
I AROOQ BHUTTA
A p p r c ~ ~ V t ~ d B y :
_ .
I
SALMAN
IIH ALVI
0 5 10 15
SCALE(mm)
GAHRAIT-SWIR LASHT HYDROPOWER PROJECT
FEASIBILITY STUDY
CONCEPTUAL MACHINE HALL LAYOUT
JULY, 2014
6.17
00
1000 2000 3000
4000 5000
SCALE{mm}
ROWN
TIFLEVEL
EL:12M.et
NOTES:
1. ALL LEVELS
ARE
IN METERS.
2.
ALL DIMENSIONS
ARE
IN MILLI METERS UNLESS
INDICATED OTHERWISE.
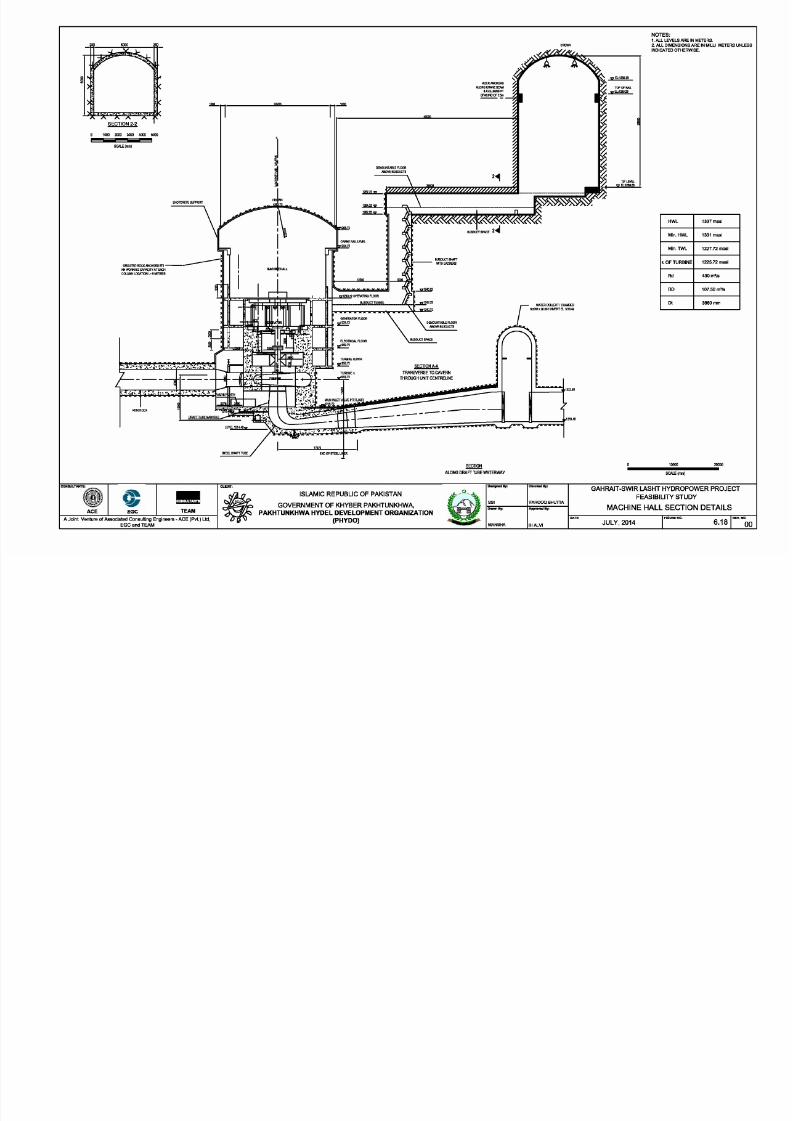
7/24/2019 02-FINAL PC-I JULY,2014.pdf
http://slidepdf.com/reader/full/02-final-pc-i-july2014pdf 137/141
GROUTEDROCKANCHORS 7D -
KN WORKING
CAPACITYAT
EACH
CCl.UMNl.OCATIONLz9METRES
~
.
EGC
..
EAM
A Joint Venture
of
Associated Consulting Engineers- ACE Pvt.) Ltd,
EGCandTEAM
:::4 p
CLENT:
EL.ECTRc.t.I..R.OOR
'St E
ISLAMIC REPUBLIC OF PAKISTAN
GOVERNMENT OF KHYBER PAKHTUNKHWA,
PAKHTUNKHWA HYDEL DEVELOPMENT ORGANIZATION
(PHYDO)
WATER
ca.J..ECTI CHAMIER
5. 1.1Wx20.00HINVERTB.121BA2
~ ' ' ~
ALONG DRAFT TUBE WATERWAY
O.lgrMI IJ:
Ch.c -IIIJ :
SSI
FAROOQ BHUTTA
~ B y Appruv.c By:
MANSHA
IHALVI
HWL 1337masl
Min.
HWL
1331 masl
Min.lWL 1227.72 masl
•OF
TURBINE
1225.72 masl
Rd
430ms/s
RD 1 0 7 5 0 ~ / s
Dt
3660 mm
10000
20000
SCAI...E mm)
GAHRAIT-SWIR LASHT HYDROPOWER PROJECT
FEASIBILITY STUDY
MACHINE HALL SECTION DETAILS
REV. NO.
JULY, 2014
FIGURE NO.
6.18
I
00

7/24/2019 02-FINAL PC-I JULY,2014.pdf
http://slidepdf.com/reader/full/02-final-pc-i-july2014pdf 138/141
IMPLEMENTATION SCHEDULE

7/24/2019 02-FINAL PC-I JULY,2014.pdf
http://slidepdf.com/reader/full/02-final-pc-i-july2014pdf 139/141

7/24/2019 02-FINAL PC-I JULY,2014.pdf
http://slidepdf.com/reader/full/02-final-pc-i-july2014pdf 140/141
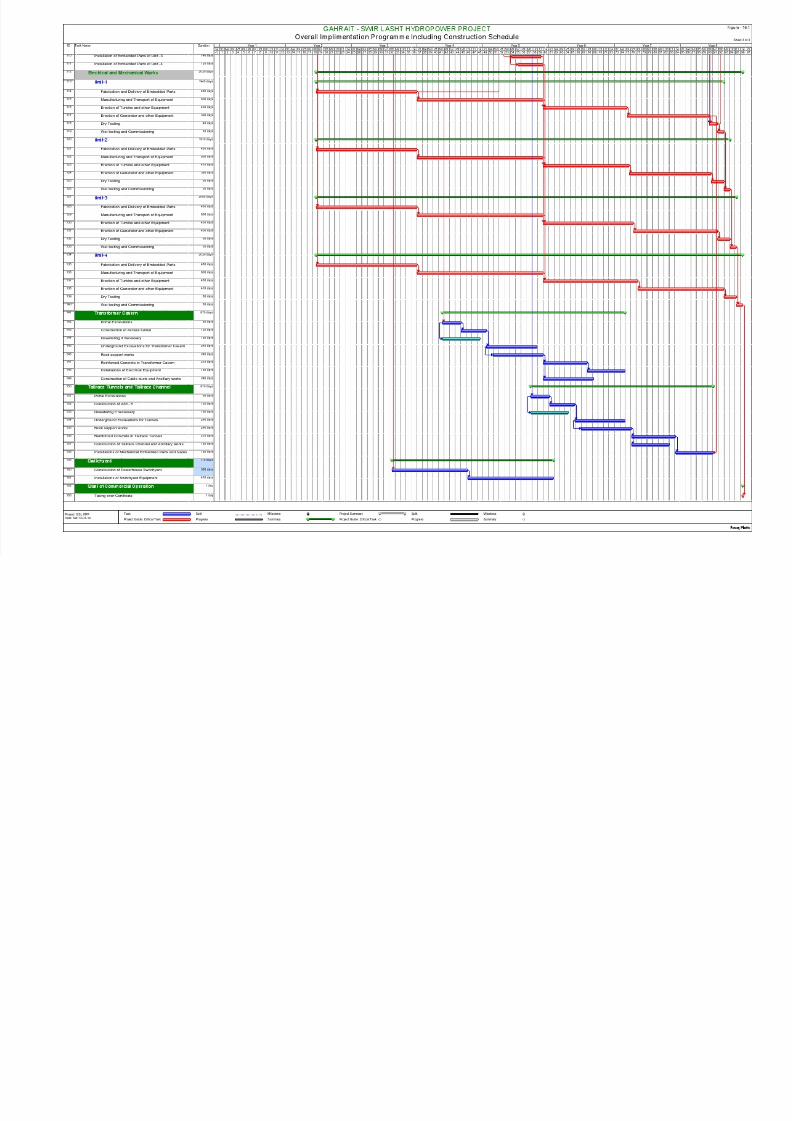
7/24/2019 02-FINAL PC-I JULY,2014.pdf
http://slidepdf.com/reader/full/02-final-pc-i-july2014pdf 141/141