
02 CincoLey1996
4
T Distinguished Author Series Well-Test Analysis for Naturally Fractured Reservoirs Heber Cinco-Ley. CSIPSA and UNAM Summary Well testing provides a powerful tool to detect and to evaluate hetero- geneities in naturally fractured reservoirs (NFR's). Experience has shown that this type of reservoir may display behavior that consists of a variety of flow models. This paper presents a discussion of the applications and limitations of pressure-transient tests in the evalua- tion of NFR's. Introduction Optimizing the exploitation of a reservoir requires a complete de- scription of the formation. A combination of information from vari- ous sources allows a reliable characterization of the system so that data from seismology, geology, well logging, well tests, core and fluid analysis, and well flow rates can be used to estimate reservoir ge- ometry, oil and gas in place, and flow characteristics of the porous me- dium among other factors. Well testing I-I 0 provides an ideal tool to find reservoir-flow parameters and to detect and evaluate heteroge- neities that affect the flow process in the formation. NFR's contain a considerable amount of the world hydrocarbon re- serves. As Fig. 1 shows, the rock in these types of systems may include several elements (i.e., vugs, fractures, and matrix). Hydrocarbons are contained in both fractures and rock matrix; usually, fractures act as chan- nels to yield high well-flow rates. Reservoir studies must consider these heterogeneities because they can affect oil and gas recovery significantly. Because of the importance ofNFR's, many publications have appeared that provide an understanding of the behavior of these types of reser- voirs.11.I2 Currently, advances in well-test analysis allow a more reliable characterization of these systems based on new flow models that properly account for heterogeneities offractured reservoirs. Owing to space limita- tions, discussing every publication that contributed to the technology used is impossible. Experience has shown that NFR's may behave according to a vari- ety of reservoir-flow models: (I) homogeneous reservoir, (2) multi- ple region or composite reservoir, (3) anisotropic medium, (4) single fracture system, and (5) double-porosity medium. Fig. 2 shows the main elements of these models, and Table 1 shows the different sets of parameters that have to be found to describe the flow behavior in the reservoir for each case. Next, we discuss the application and li- mitations of these models in well-test analysis. Homogeneous Reservoir Model. This model considers that reser- voir properties are constant and do not vary throughout the reservoir. Fractures and rock matrix act as a single medium so that fluid produc- Copyright 1996 Society of Petroleum Engineers ThiS paper is SPE 31162. Distinguished Author Series articles are general, descriptive pa- pers that summarize the state of the art in an area of technology by describing recent devel- opments for readers who are not speCialists in the topics discussed. Written by individuals recognized as experts in the area, these articles proVide key references to more defrnitive work and present specific details only to illustrate the technology. Purpose: to inform the general readership of recent advances In various areas of petroleum engineering. A soft- bound anthology, SPE Distinguished Author Senes: Dec. 1981-Dec. 1983.15 available trom the SPE Book Order Dept. ,flY" • January 1996 tion is caused by the simultaneous expansion of both elements, and fluid transfer between them, if any, occurs instantaneously without re- sistance. This behavior is exhibited by either aheavily fractured reser- voir with small matrix blocks (Fig. 2a) or by an NFR where fluids are contained mainly in the fracture system (Fig. 2b). The presence of fractures can be detected by the analysis of well logs and cores. In general, well-test-analysis methods have been developed forho- mogeneous reservoirs. The pressure behavior in these systems is con- trolled by the formation flow capacity, kh; porosity ¢' fluid viscosity Ji, and total compressibility, Ct. An essential part of well-test-analysis methods is a flow-regime diagnosis achieved through the application of a log-log graph of both pressure and pressure derivative. I3 This process allows the detection of flow geometries and the presence of heterogeneities in the reservoir. The parameters of the system areesti- mated by use of the specialized graphs of pressure, p, vs. time. t (e.g., p vs.log t,p vs. t'1"pvs. t'l.,p vs. t_'h,p vs. lit, andp vs. :t, correspond- ing to radial,14 linear,15 bilinear,16 spherical,17 constant pressure boundary, 18 and pseudosteady-state 2 flows, respectively. Fig. 3 illustrates the behavior of a single-well test (drawdown or buildup) forradial flow in homogeneous systems. The first part of the pressure-derivative graph (unit-slope straight line) shows the pres- ence of well bore-storage effects followed (after a transition zone) by a horizontal portion representing a radial-flow behavior. The kh of the formation and the skin factor can be determined from the straight line on the semi log graph. The estimated kh for an NFR represents an equivalent value for the fracture/matrix system. As a complement to single-well tests, interference tests are used toestimate the storativity of the formation (¢crh); this value is usually high for NFR's because it includes the storativity of both fractures and matrix. Sometimes a high-productivity well produces from a reservoir with small hydrocarbon reserves; here, the tluids are contained main- ly in the fractures and the system behaves as a homogeneous medium. Extended drawdown tests allow the early detection of this case during the appraisal phase of the reservoir. Multiple Region or Composite Reservoir Model. Some NFR's are fractured regionally (Fig. 2c) and can therefore be considered to be composed of two regions: a high- and a low-transmissibility region. In this case, the reservoir behaves as a composite radial system. 19 Wells producing from the fractured region exhibit higher productiv- ity than those in the unfractured region. The system is characterized by the flow capacity of both regions (kh)1 and (khh. A single-well pressure test carried out in a well in the fractured re- gion is first affected by the properties of this nearby region and then the pressure behavior is controlled by the unfractured region. Fig. 4 presents the graphs for the interpretation of this case. Here a log-log graph of the pressure derivative shows, at early time, the typical be- havior for wellbore-storage effects, followed by a horizontal straight- line portion representing a radial tlow controlled by the fractured re- gion. Then, after a transition period, the derivative curve exhibits another straight-line portion above the first horizontal line. If a high contrast exists between the properties of the two regions, the transi- tion period can reach a unit-slope straight line. suggesting the pres- 51
-
Upload
ivan-velazquez-ramirez -
Category
Documents
-
view
7 -
download
0
description
RESERVOIR
Transcript of 02 CincoLey1996
T Distinguished Author Series
Well-Test Analysis for Naturally Fractured Reservoirs
Heber Cinco-Ley. CSIPSA and UNAM
Summary
Well testing provides a powerful tool to detect and to evaluate heterogeneities in naturally fractured reservoirs (NFR's). Experience has shown that this type of reservoir may display behavior that consists of a variety of flow models. This paper presents a discussion of the applications and limitations of pressure-transient tests in the evaluation of NFR's.
Introduction
Optimizing the exploitation of a reservoir requires a complete description of the formation. A combination of information from various sources allows a reliable characterization of the system so that data from seismology, geology, well logging, well tests, core and fluid analysis, and well flow rates can be used to estimate reservoir geometry, oil and gas in place, and flow characteristics of the porous medium among other factors. Well testing I-I 0 provides an ideal tool to find reservoir-flow parameters and to detect and evaluate heterogeneities that affect the flow process in the formation.
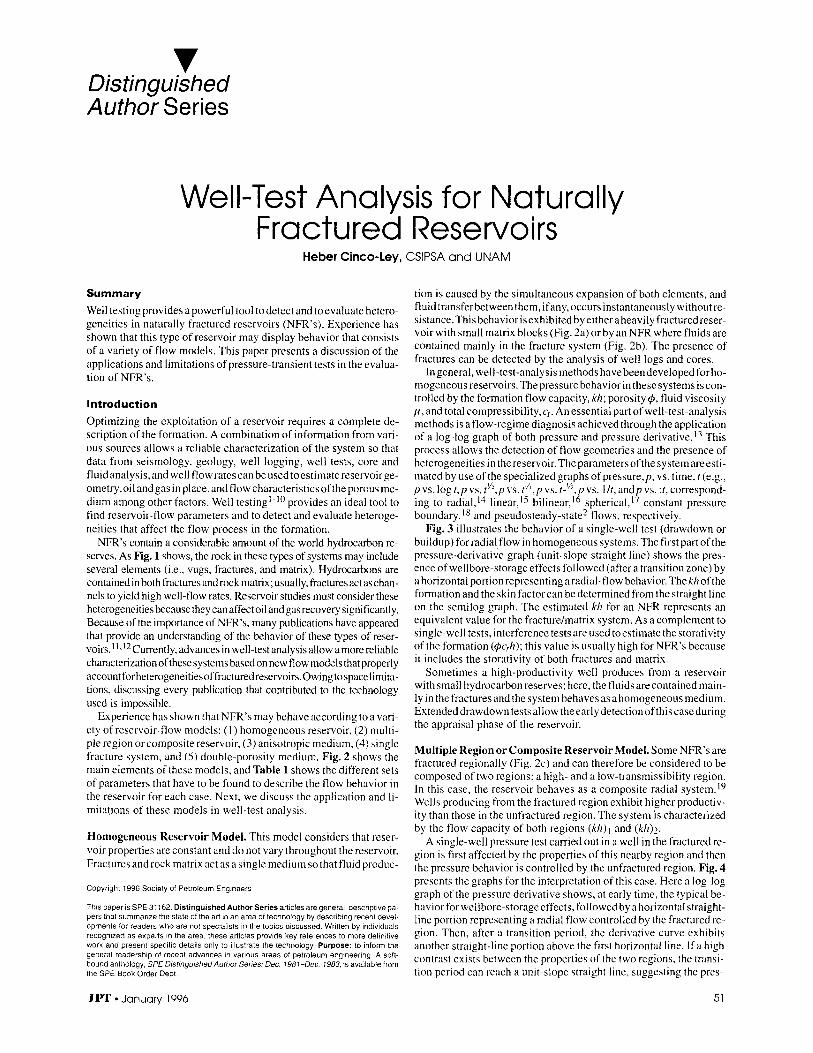
NFR's contain a considerable amount of the world hydrocarbon reserves. As Fig. 1 shows, the rock in these types of systems may include several elements (i.e., vugs, fractures, and matrix). Hydrocarbons are contained in both fractures and rock matrix; usually, fractures act as channels to yield high well-flow rates. Reservoir studies must consider these heterogeneities because they can affect oil and gas recovery significantly. Because of the importance ofNFR's, many publications have appeared that provide an understanding of the behavior of these types of reservoirs.11.I2 Currently, advances in well-test analysis allow a more reliable characterization of these systems based on new flow models that properly account for heterogeneities offractured reservoirs. Owing to space limitations, discussing every publication that contributed to the technology used is impossible.
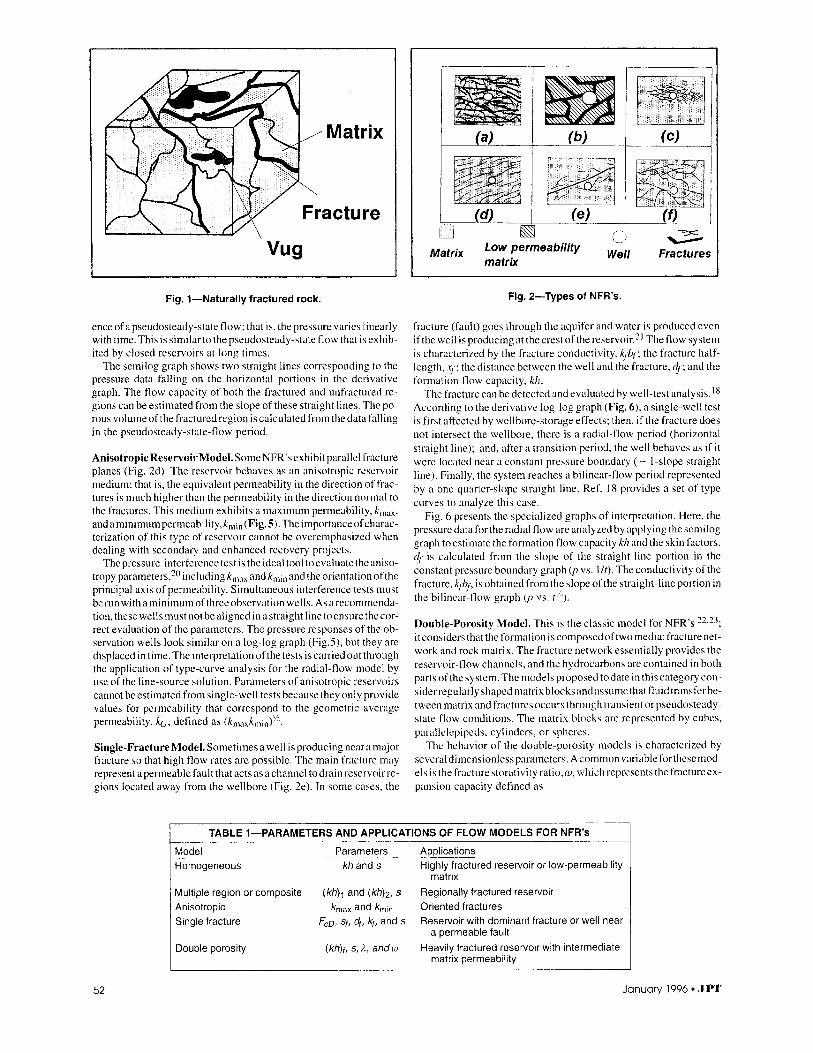
Experience has shown that NFR's may behave according to a variety of reservoir-flow models: (I) homogeneous reservoir, (2) multiple region or composite reservoir, (3) anisotropic medium, (4) single fracture system, and (5) double-porosity medium. Fig. 2 shows the main elements of these models, and Table 1 shows the different sets of parameters that have to be found to describe the flow behavior in the reservoir for each case. Next, we discuss the application and limitations of these models in well-test analysis.
Homogeneous Reservoir Model. This model considers that reservoir properties are constant and do not vary throughout the reservoir. Fractures and rock matrix act as a single medium so that fluid produc-
Copyright 1996 Society of Petroleum Engineers
ThiS paper is SPE 31162. Distinguished Author Series articles are general, descriptive papers that summarize the state of the art in an area of technology by describing recent developments for readers who are not speCialists in the topics discussed. Written by individuals recognized as experts in the area, these articles proVide key references to more defrnitive work and present specific details only to illustrate the technology. Purpose: to inform the general readership of recent advances In various areas of petroleum engineering. A softbound anthology, SPE Distinguished Author Senes: Dec. 1981-Dec. 1983.15 available trom the SPE Book Order Dept.
,flY" • January 1996
tion is caused by the simultaneous expansion of both elements, and fluid transfer between them, if any, occurs instantaneously without resistance. This behavior is exhibited by either aheavily fractured reservoir with small matrix blocks (Fig. 2a) or by an NFR where fluids are contained mainly in the fracture system (Fig. 2b). The presence of fractures can be detected by the analysis of well logs and cores.
In general, well-test-analysis methods have been developed forhomogeneous reservoirs. The pressure behavior in these systems is controlled by the formation flow capacity, kh; porosity ¢' fluid viscosity Ji, and total compressibility, Ct. An essential part of well-test-analysis methods is a flow-regime diagnosis achieved through the application of a log-log graph of both pressure and pressure derivative. I3 This process allows the detection of flow geometries and the presence of heterogeneities in the reservoir. The parameters of the system areestimated by use of the specialized graphs of pressure, p, vs. time. t (e.g., p vs.log t,p vs. t'1"pvs. t'l.,p vs. t_'h,p vs. lit, andp vs. :t, corresponding to radial,14 linear,15 bilinear,16 spherical,17 constant pressure boundary, 18 and pseudosteady-state2 flows, respectively.
Fig. 3 illustrates the behavior of a single-well test (drawdown or buildup) forradial flow in homogeneous systems. The first part of the pressure-derivative graph (unit-slope straight line) shows the presence of well bore-storage effects followed (after a transition zone) by a horizontal portion representing a radial-flow behavior. The kh of the formation and the skin factor can be determined from the straight line on the semi log graph. The estimated kh for an NFR represents an equivalent value for the fracture/matrix system. As a complement to single-well tests, interference tests are used toestimate the storativity of the formation (¢crh); this value is usually high for NFR's because it includes the storativity of both fractures and matrix.
Sometimes a high-productivity well produces from a reservoir with small hydrocarbon reserves; here, the tluids are contained mainly in the fractures and the system behaves as a homogeneous medium. Extended drawdown tests allow the early detection of this case during the appraisal phase of the reservoir.
Multiple Region or Composite Reservoir Model. Some NFR's are fractured regionally (Fig. 2c) and can therefore be considered to be composed of two regions: a high- and a low-transmissibility region. In this case, the reservoir behaves as a composite radial system. 19
Wells producing from the fractured region exhibit higher productivity than those in the unfractured region. The system is characterized by the flow capacity of both regions (kh)1 and (khh.
A single-well pressure test carried out in a well in the fractured region is first affected by the properties of this nearby region and then the pressure behavior is controlled by the unfractured region. Fig. 4 presents the graphs for the interpretation of this case. Here a log-log graph of the pressure derivative shows, at early time, the typical behavior for wellbore-storage effects, followed by a horizontal straightline portion representing a radial tlow controlled by the fractured region. Then, after a transition period, the derivative curve exhibits another straight-line portion above the first horizontal line. If a high contrast exists between the properties of the two regions, the transition period can reach a unit-slope straight line. suggesting the pres-
51
Matrix
Fracture
Vug
Fig. 1-Naturally fractured rock.
ence of a pseudosteady-state flow; that is, the pressure varies linearly with time. This is similarto the pseudostcady-state flow that is exhibited by closed reservoirs at long times.
The semi log graph shows two straight lines corresponding to the pressure data falling on the horizontal portions in the derivative graph. The flow capacity of both the fractured and unfractured regions can be estimated from the slope of these straight lines. The porous volume of the fractured region is calculated from the data falling in the pseudosteady-state-flow period.
Anisotropic Reservoir Model. Some NFR's exhibit parallel fracture planes (Fig. 2d). The reservoir behaves as an anisotropic reservoir medium; that is, the equivalent permeability in the direction offractures is much higher than the permeability in the direction normal to the fractures. This medium exhibits a maximum permeability, kOla" and aminimum permeability, kOlin (Fig. 5). The importance of characterization of this type of reservoir cannot be overemphasized when dealing with secondary and enhanced recovery projects.
The pressure-interference test is the ideal tool toevaluate the anisotropy parameters,20 including kmax and kOlin and the orientation of the principal axis of permeability. Simultaneous interference tests mmt be run with a minimum of three observation wells. As a recommendation, these wells must not be aligned in a straight line to ensure the correct evaluation of the parameters. The pressure responses of the observation wells look similar on a log-log graph (Fig.5), but they are displaced in time. The interpretation of the tests is carried out through the application of type-curve analysis for the radial-flow model by use of the line-source solution. Parameters of anisotropic reservoirs cannot be estimated from single-well tests because they only provide values for permeability that correspond to the geometric average permeability, kc, defined as (kOlaxkOl in)'I2.
Single-Fracture Model. Sometimes a well is producing near a major fracture so that high flow rates are possible. The main fracture may represent a permeable fault that acts as a channel to drain reservoir regions located away from the wellborc (Fig. 2e). In somc cases, the
•.........•.................... i' '::" '.. ~ . . .
- , ::. . : .~ .:;
_~.-'-)_-+-_~(c~)_-1
~~~; ~'< •• :, ••..•• . (;:.! •.. ,.,'>' .. ~ .'. ' ........ ~
::" ·~.··~·i,' "':"', ",' ,". "~
~---'...::( d:L,J _==ok--_--'-(=e)_---L.._....!..:.!(fL~ o ~ 0 ~
Low permeability Well Fractures matrix
Matrix
Fig. 2-Types of NFR's.
fracture (fault) goes through the aquifcr and water is produced even if the well is producing at the crest of the reservoir2 J The flow system is characterized by the fracture conducti vity, kjbf; the fracture halflength, xr; the distance between the well and the fracture, dj; and the formation flow capacity. kh.
The fracture can be detected and evaluated by well-test analysis. J 8
According to the derivative Jog-log graph (Fig. 6), a single-well test is first affected by well bore-storage effects; then, if the fracture does not intersect the well bore, there is a radial-flow period (horizontal straight line); and, after a transition period, the well behaves as if it were located near a constant pressure boundary ( - I-slope straight line). Finally, the system reaches a bilinear-now period represented by a one-quarter-slope straight line. Ref. 18 provides a set of type curves to analyze this case.
Fig. 6 presents the specialized graphs of interpretation. Here, the pressure data fOrlhe radial tlow are analyzed by applying the semilog graph to estimate the formation now capacity kh and the skin factors. dr is calculated from the slope of the straight-line portion in the constant pressure boundary graph (p vs. lit). The conductivity of the fracture, krhr, is obtained from the slope of the straight-line portion in the bilincar-flow graph (p vs. t'/,).
Double-Porosity Model. This is the classic model for NFR's 22,23;
it considers thatthe formation is composed of two media: fracture network and rock matrix. The fracture network essentially provides the reservoir-flow channcls, and the hydrocarbons are contained in both parts of the system. The models proposed to date in this category consider regularly shaped matrix blocks and assume that fluid transferbetween matrix and fractures occurs through transient orpseudosteadystate flow conditions. The matrix blocks are rcpresented by cubes, parallelepipeds, cylinders, or spheres.
The behavior of the double-porosity models is characterized by several dimensionless parameters. A common variable forthese models is the fracture storativity ratio, w, which represents the fracture expansion capacity defined as
TABLE 1-PARAMETERS AND APPLICATIONS OF FLOW MODELS FOR NFR's
52
Model Homogeneous
Multiple region or composite Anisotropic Single fracture
Double porosity
Parameters kh and 5
(kh)1 and (kh)2, 5
k max and kOlin
FeD, sl, dl, kl' and 5
(kh)l, 5, ),' and w
Applications Highly fractured reservoir or low-permeability
matrix
Regionally fractured reservoir Oriented fractures Reservoir with dominant fracture or well near
a permeable fault
Heavily fractured reservoir with intermediate matrix permeability
January 1996 • .JIr l'

I -a. Radial flow I
OJ /~ PI
0 ...J
Log t Log t
Fig. 3-0erivative and semilog graph for radial flow in homogeneous reservoir.
In undersaturated reservoirs, Eq. I calculates how much oil is being produced from the fractures expressed as a fraction of the total oil produced. Typical values of ware between 0.001 and 0.5
Another parameter is the dimensionless diffusi vity of the matrix n
1]maD = 1]maT~/1]fh,;a, ............................. (2)
where 1]ma = matrix hydraulic diffusivity, 1]f = fracture hydraulic diffusivity, Tw = well bore radius, and hma = characteristic length of matrix blocks. This parameter is related to how fast the matrix/fracture interaction occurs. Typical values of 1]maD are between 10 - 9 and 10- 4. As the value of this parameter increases, the interaction betwecn matrix and fractures occurs at shorter times.
A third parameterfor double-porosity reservoirs is the dimensionless matrix/fracture interaction area defined as
(3)
where Vb = rock bulk volume, v'na = matrix volume, and Ajb = matrix/fracture areas of interaction per unit of rock volume. Ajb is a key parameter in the imbibition process present in waterflooding or water encroachment. The value of AJD is 2, 4, and 6 for slabs, cylinders, and cubes, respectively.
In some NFR's, fractures are partially filled by minerals which reduce the flow interaction between matrix and fractures. This situation can be handled introducing a fracture skin factor expressed as:
SmaD = kmax"/k,,h ma , ............................. (4)
whereXd = average fracture-damage thickness andkd = average fracture-damage permeability. The effect of SmaD is to delay the interaction between matrix and fractures. For high SIIIGD values (severe restriction in the matrixlfracture interaction), the pressure behavior of
Fig. 5-log-log graph for observation pressures in interference tests in an anisotropic reservoir.
.J)>>"f • January 1996
Ii _ Weltbore Storage
pi a. /; . ;~I .3
I I I
Log t Log t
Fig. 4-0erivative and semilog graph for radial flow in a two-region reservoir.
the system can be dcscribed by two parameters only: wand).. TheA. results from a combination of AJD, S"'(lD, and 1]"'(lD as
A. = AjD1]maD/SmaD' ............................... (5)
The values forA. are between 10 -9 and 10 -4. Ahigh valueofthis parameter indicates a fast interaction bctween matrix and fractures and vice versa. This case is referred to as the pseudosteady-state matrixtlow model, or the Warren and Root22 model.
Fig. 7 presents typical behavior for a single-well test. Here, the loglog graph of the pressure derivative shows the wellbore-storage effects at early time; and, after a transition period, there is a horizontal line showing a radial flow dominated by the expansion of the fractures. Following this, the rock matrix interacts with the fractures, producing a V-shaped curve; and finally, when the matrix-fracture fluid transfer reaches pseudosteady-state flow conditions, the derivative follows another horizontal line. The semi log graph shows two parallel straight lines, which represent the fracture-dominated flow period and the total-system (fracture/matrix) -dominated now period, respectively. The tlow capacity kh of the total system is estimated from the slope of the semilog straight lines, and the skin factor is calculated from either the first or the second straight line.
The shape of the transition between the two parallel semilog straight lines depends on the magnitude of the restriction of the matrix/fracture interaction; that is, if a free matrix/fracture interaction (no restriction) exists, the transition may approach a straight line with a slope equal to one-half the slope of the two parallel straight lines. The fracture area perunit of rock volume is estimated from the intersection of the transition straight line and the last straight line. If the matrix/
Wellbore Storage
-a. !? OJ o
...J
1 It
Fig. 6-0erivative and specialized graphs for a well near a conductive fault.
53

Wellbore Storage
-0. ;0 Cl
.3
Log t Log t
Fig. 7-Derivative and semilog graph for radial flow in a doubleporosity reservoir.
fracture interaction is restricted, the transition zone approaches a stabilized value that can be used to calculate A.
The parameters of the double-porosity model may also be estimated through the application of type curves.
Comments
The previous discussion covers the basic models used in the analysis of pressure transient tests in NFR's. In practice, combining these models is sometimes necessary for reliable interpretation of the data; therefore, the double-porosity model may be combined with the other models that have been presented and discussed.
Another aspect that deserves special attention is related to the design and the conducting of the tests. Use of high-resolution pressure gauges is desirable to detect small pressure changes observed in many cases, and use of bottomhole shut-in tools is desirable to eliminate wellbore-storage effects that can mask valuable information related to heterogeneities in fractured reservoirs.
Conclusions
I. The behavior of NFR's can be studied through the application of a variety of models that must be considered in simulation studies.
2. Pressure transient testing provides a reliable tool to detect and to evaluate reservoir heterogeneities that affect the flow process and hydrocarbon recovery in NFR's.
3. The application of the pressure-derivative curve is essential in the analysis of pressure tests to determine the proper flow model for the reservoir.
4. Single- and multiple-well tests are complementary fordetermining flow characteristics of reservoirs.
5. Information obtained from a well test must be combined with data from other sources to understand the production mechanisms present in the reservoirs.
Acknowledgments
This paper is dedicated to Henry 1. Ramey, who must be considered the "father of modern well-test analysis" for his valuable and fundamental contributions in this area.
Nomenclature
54
B = Oil FYF, L3/L3 b= width, L
Ct = total system compressibility, Lt2/m (~= distance to fault, L
f~D = dimensionless fracture conductivity = kfbflk:g h = height, L k = permeability, L 2
m= slope p = pressure. m/Lt2 q = flow rate, L3/t s = skin factor. dimensionless (= time, t
Xj= fracture half-length, L
YJ = hydraulic diffusivity, k/rjJWt rjJ = porosity A = matrix/fracture interaction parameter Jl = viscosity w = relative fracture expansion
Subscripts D = dimensionless f= fracture
ma= matrix max = maximum min = minimum
t= total I = Region I 2 = Region 2
References
1. Matthews, C.S. and Russell, D.G.: Pre.\·surc·Buildup and F1oll' Tests in Wells, Monograph Series, SPE, Richardson, TX (1967) 1.
2. Earlougher. R.C. Jr.: Advances in Well Test Analysis, Monograph Series. SPE. Richardson. TX (1977) 5.
3. Ramey, H.1. Jr .. Kumar. A .. and Gulati, M.S.: Gas Well Test Analysis Under Water·Drive Conditions. American Gas Assn., Arlington. VA (1975).
4. Theory and Practice of tlze Testin!! of Gas Wells. Energy Resources Conservation Board, Calgary (1975).
5. Lee, 1.: "Well Testing," Textbook Series, SPE. Richardson, TX (1982). 6. Streltsova, T.D.: Well Testin!! in Hetero!!eneous Form<llions. John Wiley
& Sons, New York City (1988). 7. Stanislav, J.P. and Kabic C.S.: Pressure Transient Analysis, Prentiee
Hall Inc., Englewood Cliffs. NJ (1990). 8. Sabet. M.A.: Well Test Analysis, Gulf Publishing Co .. Houston (1991). 9. Gringarten. A.C.: 'Type Curve Analysis: What It Can and Cannot Do,"
JPT(Jan. 1987) II. 10. Ehlig-Economides, c.: "Usc of the Pressure Derivative for Diagnosing
Pressure-Transient Behavior," JPT (Oct. 1988) 1280. II. Aguilera, R.: Naturally Fractured Reservoirs, Petroleum Publishing Co ..
Tulsa, OK (1980). 12. van Golf-Raeht. T.D.: Fundamentals of FraCllIred Reservoir Engineer
ing, Elsevier Scientific Publishing Co., Amsterdam (1982). 13. Bourdet. D. et al.: "A New Set of Type Curves Simplifies Well Test Anal
ysis," World Oil (May 1983). 14. Horner, D.R.: "Pressure Build Up in Wells." Proc., Third World Pet.
Cong., The Hague, The Netherlands (1951) Sec. II. 503. 15. Millheim. K.K. and Cichowicz. L.: "Testing and Analyzing Low-Perme
ability Fractured Gas Wells," JPT (Feb. 1968) 193; Trans., AIME. 243. 16. Cinco-Ley, H. and Samaniego-V., F: "Transient Pressure Analysis for
Fractured Wells." JPT(Sept. 1981) 1749. 17. Raghavan. R. and Clark. K.K.: "Vertical Permeability From Limited
Entry Flow Tests in Thick formations," SPEJ (Feb. 1975) 65; TrailS., AIME,259.
18. Abbaszadeh. M.D. and Cinco-Ley, H.: "Pressure Transient Behavior in a Reservoir With a Finite-Conductivity Fault." SPEFE (March 1995) 26.
19. van Poolden, H.K. and Bixel, H.C.: "Pressure Drawdown and Buildup in the Presence of Radial Discontinuities," SPEJ (Sept 1967) 30 I; TrailS .. AIME,240.
20. Ramey. H.1. Jr.: "Interference Analysis for Anisotropic Fnrrnations-A Case History." JPT (Oct. 1975) 1290; Trans .. AIME. 259.
21. Trocchio, 1.1.: "Investigation of fateh Mishrif Fluid Conductive Faults." JPT (Aug. 1990) 1038; Trans., AI ME. 289.
22. Warren. J .E. and Root, P.1.: "The Behavior of Naturally Fractured Reservoirs," SPEJ (Sept. 1963) 245; TrailS., AIME, 228.
23. de Swaan-O., A.: "Analytical Solutions for Determining Naturally Fractured Reservoir Properties by Well Testing," SPEJ (June 1976) 117; Trans., AIME, 261.
Heber Cinco-Ley is a professor at U. Natl. de Mexico (UNAM). His research interests include reservoir engineering and reservoir simulation, well-test analysis, and geothermal reservoir engineering. He previously was a research engineer at Ins!. Mexicano del Petr61eo and an instructor at Stanford U. Cinco-Ley was a 1993-94 Section Program Chairman, was on the Editorial Review Committee from 1987--89, and was a member of several SPE Annual Meeting technical program committees. He holds BS and MS degrees from UNAM and a PhD degree from Stanford U., all in petroleum engineering. Photograph for CincoLey is unavailable.
January 1996 • .fly!'