01 f ijab 12-363, 001-010
10
INTERNATIONAL JOURNAL OF AGRICULTURE & BIOLOGY ISSN Print: 1560–8530; ISSN Online: 1814–9596 12–363/2013/15–1–1–10 http://www.fspublishers.org Full Length Article To cite this paper: Mubeen, M., A. Ahmad, A. Wajid, T. Khaliq and A. Bakhsh, 2013. Evaluating CSM-CERES-Maize model for irrigation scheduling in semi-arid conditions of Punjab, Pakistan. Int. J. Agric. Biol., 15: 1‒10 Evaluating CSM-CERES-Maize Model for Irrigation Scheduling in Semi-arid Conditions of Punjab, Pakistan Muhammad Mubeen 1* , Ashfaq Ahmad 1 , Aftab Wajid 1 , Tasneem Khaliq 1 and Allah Bakhsh 2 1 Agro-climatology Lab, Department of Agronomy, University of Agriculture, Faisalabad, Pakistan 2 Department of Irrigation and Drainage, University of Agriculture, Faisalabad, Pakistan *For correspondence: [email protected] Abstract This study was conducted to evaluate the CSM-CERES-Maize model for simulating maize growth and yield against different irrigation regimes in semi-arid conditions of Punjab (Pakistan). The data required to run the model were collected from field experiments conducted at University of Agriculture Faisalabad during 2009 and 2010. Two autumn-sown maize hybrids (Monsanto-919 and Pioneer-30Y87) were grown under variable irrigation regimes: I 1 = no irrigation (control), I 2 (4 irrigations, 1 st at V6 i.e., 6 leaf stage, 2 nd at V10, 3 rd at V14, 4 th at V18), I 3 (6 irrigations, the first 4 as in I 2 and the subsequent two at reproductive stages R1 and R2), I 4 (8 irrigations, the first 6 as in I 3 and the subsequent two at R3 and R4), I 5 (10 irrigations, the first 8 as in I 4 and the subsequent two at R5 and R6), I 6 : irrigation at 25 mm potential soil moisture deficit (PSMD) and I 7 : irrigation at 50 mm PSMD. The genetic co-efficients calibrated against the treatment I 6 giving superior performance regarding yield and yield components for the two hybrids during 2009, were used to evaluate the model accuracy for irrigation treatments of 2010 season. The model performance during calibration was quite good. During evaluation, the model showed variability of 1.1 to 11.2% and -4.3 to 6.4% in total dry matter and -8.5 to 24.3% and -15.8 to 28.7% in grain yield for Monsanto-919 and Pioneer-30Y87, respectively for different irrigation regimes. Daily simulations of total dry matter were also good with d-statistics values higher than 0.970 in all treatments. The results showed that CSM-CERES-Maize can be successfully used in simulation studies of autumn-sown maize under semi-arid conditions of Punjab. © 2013 Friends Science Publishers Keywords: Zea mays L.; Leaf stage; PSMD; Simulation; Irrigation scheduling; Model evaluation Introduction The success of sustainable agriculture is dependent on water availability in arid and semi-arid areas of the world. Agricultural output of Pakistan is closely associated with the supply of irrigation water (Shah, 2008). Effective use of irrigation water is rapidly becoming an issue in dry regions and one of the main decisions an irrigator makes in irrigation management is the timing of irrigations (Usman et al., 2009). Water stress tolerance will become the most critical when population pressure and climate change link together to make water a scarce resource in the world (Farooq et al., 2009; Hussain et al., 2009). Drought is an elementary reason of low grain yield in many field crops including maize (Zea mays L.). Drought at critical stages of maize decreases yield up to 40%. The critical growth periods of maize are the two weeks before silking and 2-3 weeks after silking (Singh and Singh, 1995; Cakir, 2004). There has been proof of water stress tolerance of maize during the vegetative stage, but very sensitive during tasseling, silking and pollination, and moderately sensitive during the grain filling period (McKersie and Leshem, 1994; Otegui et al., 1995). Identifying growth stages for any promising cultivar under local environments of soil fertility and climate permits irrigation scheduling to get the maximum yield and most proficient use of insufficient water resources (Doorenbos and Kassam, 1979; Pandey et al., 2000). The span of dry period cannot be forecast under arid and semi-arid conditions which mostly prevail in Pakistan and satisfactory grain yields is dependent upon the crop cultivar for its ability to tolerate water stress (Banzinger et al., 2002; FAO, 2008) and soil features- especially the capacity of the soil to retain and release water to the growing crop (Kramer and Boyer, 1995). The model of potential soil moisture deficit (PSMD) simultaneously takes into account variability in soil water supply and water demand of atmosphere by measuring ‘drought’ at any stage of crop growth as the balance between the crop demand for water (potential evapotranspiration, PET) and the supply of water (rainfall and irrigation). The PSMD has the benefit that it incorporates the effects of timing and intensity of drought into a single index, and it assists a simple yet dependable analysis of the impacts of drought on canopy performance and therefore, radiation interception (Monteith, 1977; Stone et al., 1998; 2001). This concept seems to be more needed in conditions of Pakistan, where farmers do not consider the
Transcript of 01 f ijab 12-363, 001-010

INTERNATIONAL JOURNAL OF AGRICULTURE & BIOLOGY ISSN Print: 1560–8530; ISSN Online: 1814–9596 12–363/2013/15–1–1–10 http://www.fspublishers.org
Full Length Article
To cite this paper: Mubeen, M., A. Ahmad, A. Wajid, T. Khaliq and A. Bakhsh, 2013. Evaluating CSM-CERES-Maize model for irrigation scheduling in semi-arid conditions of Punjab, Pakistan. Int. J. Agric. Biol., 15: 1‒10
Evaluating CSM-CERES-Maize Model for Irrigation Scheduling in Semi-arid Conditions of Punjab, Pakistan
Muhammad Mubeen1*, Ashfaq Ahmad1, Aftab Wajid1, Tasneem Khaliq1 and Allah Bakhsh2 1Agro-climatology Lab, Department of Agronomy, University of Agriculture, Faisalabad, Pakistan 2Department of Irrigation and Drainage, University of Agriculture, Faisalabad, Pakistan *For correspondence: [email protected]
Abstract
This study was conducted to evaluate the CSM-CERES-Maize model for simulating maize growth and yield against different irrigation regimes in semi-arid conditions of Punjab (Pakistan). The data required to run the model were collected from field experiments conducted at University of Agriculture Faisalabad during 2009 and 2010. Two autumn-sown maize hybrids (Monsanto-919 and Pioneer-30Y87) were grown under variable irrigation regimes: I1 = no irrigation (control), I2 (4 irrigations, 1st at V6 i.e., 6 leaf stage, 2nd at V10, 3rd at V14, 4th at V18), I3 (6 irrigations, the first 4 as in I2 and the subsequent two at reproductive stages R1 and R2), I4 (8 irrigations, the first 6 as in I3 and the subsequent two at R3 and R4), I5 (10 irrigations, the first 8 as in I4 and the subsequent two at R5 and R6), I6: irrigation at 25 mm potential soil moisture deficit (PSMD) and I7: irrigation at 50 mm PSMD. The genetic co-efficients calibrated against the treatment I6 giving superior performance regarding yield and yield components for the two hybrids during 2009, were used to evaluate the model accuracy for irrigation treatments of 2010 season. The model performance during calibration was quite good. During evaluation, the model showed variability of 1.1 to 11.2% and -4.3 to 6.4% in total dry matter and -8.5 to 24.3% and -15.8 to 28.7% in grain yield for Monsanto-919 and Pioneer-30Y87, respectively for different irrigation regimes. Daily simulations of total dry matter were also good with d-statistics values higher than 0.970 in all treatments. The results showed that CSM-CERES-Maize can be successfully used in simulation studies of autumn-sown maize under semi-arid conditions of Punjab. © 2013 Friends Science Publishers Keywords: Zea mays L.; Leaf stage; PSMD; Simulation; Irrigation scheduling; Model evaluation
Introduction The success of sustainable agriculture is dependent on water availability in arid and semi-arid areas of the world. Agricultural output of Pakistan is closely associated with the supply of irrigation water (Shah, 2008). Effective use of irrigation water is rapidly becoming an issue in dry regions and one of the main decisions an irrigator makes in irrigation management is the timing of irrigations (Usman et al., 2009). Water stress tolerance will become the most critical when population pressure and climate change link together to make water a scarce resource in the world (Farooq et al., 2009; Hussain et al., 2009). Drought is an elementary reason of low grain yield in many field crops including maize (Zea mays L.). Drought at critical stages of maize decreases yield up to 40%. The critical growth periods of maize are the two weeks before silking and 2-3 weeks after silking (Singh and Singh, 1995; Cakir, 2004). There has been proof of water stress tolerance of maize during the vegetative stage, but very sensitive during tasseling, silking and pollination, and moderately sensitive during the grain filling period (McKersie and Leshem, 1994; Otegui et al., 1995). Identifying growth stages for any promising cultivar under local environments
of soil fertility and climate permits irrigation scheduling to get the maximum yield and most proficient use of insufficient water resources (Doorenbos and Kassam, 1979; Pandey et al., 2000).
The span of dry period cannot be forecast under arid and semi-arid conditions which mostly prevail in Pakistan and satisfactory grain yields is dependent upon the crop cultivar for its ability to tolerate water stress (Banzinger et al., 2002; FAO, 2008) and soil features-especially the capacity of the soil to retain and release water to the growing crop (Kramer and Boyer, 1995). The model of potential soil moisture deficit (PSMD) simultaneously takes into account variability in soil water supply and water demand of atmosphere by measuring ‘drought’ at any stage of crop growth as the balance between the crop demand for water (potential evapotranspiration, PET) and the supply of water (rainfall and irrigation). The PSMD has the benefit that it incorporates the effects of timing and intensity of drought into a single index, and it assists a simple yet dependable analysis of the impacts of drought on canopy performance and therefore, radiation interception (Monteith, 1977; Stone et al., 1998; 2001). This concept seems to be more needed in conditions of Pakistan, where farmers do not consider the

Mubeen et al. / Int. J. Agric. Biol., Vol. 15, No. 1, 2013
2
need of the crop (based on evapo-transpiration) and apply water haphazardly. Even the recommendation of the agriculture department is that water should be applied at a week‘s interval especially after silking (Government of Punjab, 2011). These practices increase the cost of production reducing the water use efficiency drastically.
Robust crop simulation models can play a role in evaluating the timing and amount of water application under limited water resources. The Cropping Systems Model (CSM)-Crop Environment Resource Synthesis (CERES)-Maize (Jones and Kiniry, 1986) was aimed to mimic maize grain response in a given year and location (Garrison et al., 1999). CSM-CERES-Maize has been quite ingenious in the simulation of yield factors and layer-wise soil moisture removal pattern (Panda et al., 2004). The model has a capacity to simulate the daily crop growth, development and yield for variable soil and climatic conditions with various agronomic managements (Khaliq et al., 2007). CSM-CERES-Maize response regarding yield simulation has been tested in Virginia (Hodges et al., 1987), Australia (Hargreaves and McCown, 1988) and Illinois (Kunkel et al., 1994). Llewelyn and Featherstone (1997) showed that the CSM-CERES-Maize model has been widely used to evaluate irrigation strategies for maize.
CERES-Maize model simulates grain yield under water limiting conditions by calculating potential evaporation; potential soil water evaporation and potential plant water transpiration are derived from potential evaporation and leaf area index. Based on the soil water supply and crop water demand, a water stress factor is estimated to decrease daily crop growth and grain yield. Simulations of deficit irrigation practices using models like the CSM-CERES-Maize can be used to look at numerous weather years and geographic locations. The objective of this study was to evaluate the CSM-CERES-Maize model in simulating maize growth and yield under different irrigation regimes in semi-arid conditions of Punjab (Pakistan). Materials and Methods Experimental Details and Treatments Field experiments were conducted during autumn season of 2009 and 2010 at Agronomic Research Area located in University of Agriculture, Faisalabad (latitude 31° 26´ N, longitude 73° 04´ E and 184 m a. s. l.).
The study comprised of 2 × 7 arrangement of two popular maize hybrids and seven irrigation schedules (I) in a split plot design with three replicates. Hybrids were assigned to main plots and irrigation scheduling treatments to subplots. Monsanto-919 and Pioneer-30Y87 were used as two maize hybrids. Out of seven irrigation scheduling treatments, one was control (no irrigation except stand establishment irrigation, I1), four consisted of irrigation at different stages based on Corn-Iowa method (Hanway and Ritchie, 1984): I2 (4 irrigations, 1st at V6 i.e., 6 leaf stage, 2nd
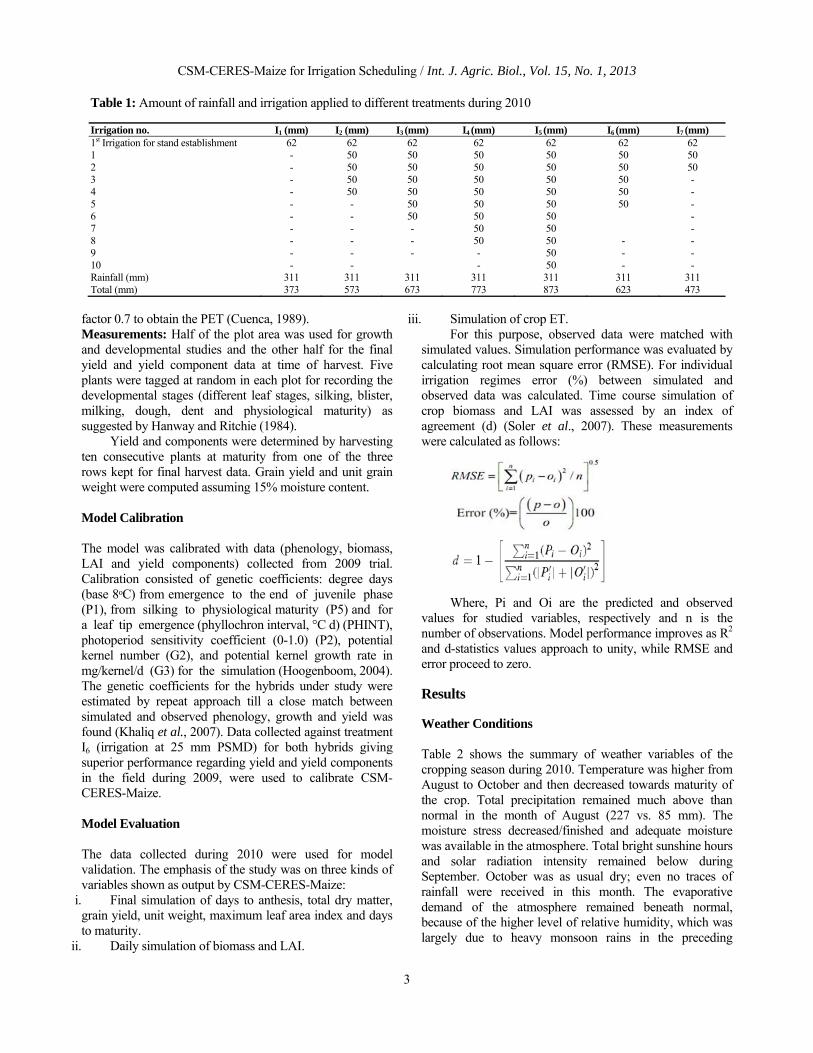
at V10, 3rd at V14, 4th at V18), I3 (6 irrigations, the first 4 as in I2 and the subsequent two at reproductive stages R1 and R2), I4 (8 irrigations, the first 6 as in I3 and the subsequent two at R3 and R4), I5 (10 irrigations, the first 8 as in I4 and the subsequent two at R5 and R6); here R1, R2, R3, R4, R5 and R6 denote silking, blister, milking, dough, dent and physiological maturity, respectively. Two of irrigation treatments consisted of irrigation at 25 mm potential soil moisture deficit (PSMD) (I6) and at 50 mm PSMD (I7). Irrigation schedules based on the assumption that the consecutive irrigations as in all the leaf stage treatments, but followed by drought in some of the treatments like I2, I3 and I4 etc., may or may not affect the yield. Similarly, potential soil moisture deficit treatments following the leaf stage treatments show the impact of deficit irrigation compared with non-deficit irrigations (I2 to I5). The number and amount of irrigation applied plus rainfall (I+R) during the growing season is given in the Table 1.
In both years, the land was prepared using a disc plough and field cultivator. For the ease of cultural operations including water application, a ridger was used, which converted the experimental area into ridges and furrows spaced at 75 cm. The net plot size was 4.5 m x 5.0 m. To avoid lateral flow of water, a buffer plot of 150 cm was kept between two plots. Maize seeds in 2009 and 2010 were planted on August 01 and August 04, respectively using a dibbler putting two seeds per hill keeping inter- and intra-row spacing of 75 cm and 25 cm, respectively. First irrigation for stand establishment was applied at the time of sowing; the water applied was 62 mm, which was sufficient to facilitate settling of ridges as well as making the seepage of water available to the shoulder height of the ridge to the planted seeds. Plots were thinned at two weeks after seeding to a plant density of 5.55 plants m-2.
NPK fertilizers were applied at the rate of 200-100-50 kg ha-1 (as per recommendations of Department of Agriculture) in the form of urea, diammonium phosphate and sulphate of potash. Half of N and all the P and K were applied as side dressing prior to establishment. Remaining half of N was applied as top dressing in two splits: first at 15 days after sowing and second at tasseling. Herbicide atrazine @ 700 mL ha-1 was applied twice (at 8 and 21 days after sowing) followed by one hand weeding since the area had been previously infested by intensive weeds. Two insecticides (furadan and chlorpyriphos) were applied @ 25 kg ha-1 and 2.5 L ha-1 respectively.
As stated earlier, treatments I6 and I7 were based on potential soil moisture deficit (25 mm and 50 mm, respectively), which was calculated as a difference between potential evapotranspiration (PET) and rainfall plus irrigation, as suggested by French and Legg (1979). Daily pan evaporation data were collected (from the observatory of Department of Crop Physiology, University of Agriculture, Faisalabad, which is located at a distance of 200 m from the experimental site) and then multiplied by a
CSM-CERES-Maize for Irrigation Scheduling / Int. J. Agric. Biol., Vol. 15, No. 1, 2013
3
factor 0.7 to obtain the PET (Cuenca, 1989). Measurements: Half of the plot area was used for growth and developmental studies and the other half for the final yield and yield component data at time of harvest. Five plants were tagged at random in each plot for recording the developmental stages (different leaf stages, silking, blister, milking, dough, dent and physiological maturity) as suggested by Hanway and Ritchie (1984).
Yield and components were determined by harvesting ten consecutive plants at maturity from one of the three rows kept for final harvest data. Grain yield and unit grain weight were computed assuming 15% moisture content.
Model Calibration The model was calibrated with data (phenology, biomass, LAI and yield components) collected from 2009 trial. Calibration consisted of genetic coefficients: degree days (base 8ᵒC) from emergence to the end of juvenile phase (P1), from silking to physiological maturity (P5) and for a leaf tip emergence (phyllochron interval, °C d) (PHINT), photoperiod sensitivity coefficient (0-1.0) (P2), potential kernel number (G2), and potential kernel growth rate in mg/kernel/d (G3) for the simulation (Hoogenboom, 2004). The genetic coefficients for the hybrids under study were estimated by repeat approach till a close match between simulated and observed phenology, growth and yield was found (Khaliq et al., 2007). Data collected against treatment I6 (irrigation at 25 mm PSMD) for both hybrids giving superior performance regarding yield and yield components in the field during 2009, were used to calibrate CSM-CERES-Maize. Model Evaluation The data collected during 2010 were used for model validation. The emphasis of the study was on three kinds of variables shown as output by CSM-CERES-Maize:
i. Final simulation of days to anthesis, total dry matter, grain yield, unit weight, maximum leaf area index and days to maturity.
ii. Daily simulation of biomass and LAI.
iii. Simulation of crop ET. For this purpose, observed data were matched with
simulated values. Simulation performance was evaluated by calculating root mean square error (RMSE). For individual irrigation regimes error (%) between simulated and observed data was calculated. Time course simulation of crop biomass and LAI was assessed by an index of agreement (d) (Soler et al., 2007). These measurements were calculated as follows:
Where, Pi and Oi are the predicted and observed values for studied variables, respectively and n is the number of observations. Model performance improves as R2 and d-statistics values approach to unity, while RMSE and error proceed to zero. Results Weather Conditions Table 2 shows the summary of weather variables of the cropping season during 2010. Temperature was higher from August to October and then decreased towards maturity of the crop. Total precipitation remained much above than normal in the month of August (227 vs. 85 mm). The moisture stress decreased/finished and adequate moisture was available in the atmosphere. Total bright sunshine hours and solar radiation intensity remained below during September. October was as usual dry; even no traces of rainfall were received in this month. The evaporative demand of the atmosphere remained beneath normal, because of the higher level of relative humidity, which was largely due to heavy monsoon rains in the preceding
Table 1: Amount of rainfall and irrigation applied to different treatments during 2010 Irrigation no. I1 (mm) I2 (mm) I3 (mm) I4 (mm) I5 (mm) I6 (mm) I7 (mm) 1st Irrigation for stand establishment 62 62 62 62 62 62 62 1 - 50 50 50 50 50 50 2 - 50 50 50 50 50 50 3 - 50 50 50 50 50 - 4 - 50 50 50 50 50 - 5 - - 50 50 50 50 - 6 - - 50 50 50 - 7 - - - 50 50 - 8 - - - 50 50 - - 9 - - - - 50 - - 10 - - - 50 - - Rainfall (mm) 311 311 311 311 311 311 311 Total (mm) 373 573 673 773 873 623 473

Mubeen et al. / Int. J. Agric. Biol., Vol. 15, No. 1, 2013
4
months. Again in November, no rainfall occurred. The weather picture discussed above shows the uncertainty of semi-arid conditions. Calibration of Model Data collected from treatment I6 (irrigation at 25 mm PSMD) for both hybrids exposed that I6 gave superior performance regarding yield and yield components in the field during 2009. So this treatment was used to calibrate CSM-CERES-Maize. The two hybrids did not differ much in genetic coefficient calibration.
Calibration results in Table 3 showed that CSM-CERES-Maize predicted one day more in flowering for Monsanto-919 and Pioneer-30Y87. The model simulated equal days (97) to maturity for Monsanto-919. There was very good agreement between observed and simulated values of total dry matter in the two hybrids with an error percentage of -1.3 to 0.1. Similarly d-statistics values were higher (0.976 and 0.972 for Monsanto-919 and Pioneer-30Y87, respectively) for time course comparison of total dry matter accumulation in both hybrids. The model also estimated the grain yield well with an error of 1.8 to 3.3% for the two hybrids.
Unit kernel weight was also simulated well by the model and difference of 1.7% and -3.2% was found in Monsanto-919 and Pioneer-30Y87, respectively. Model
performance in the prediction of maximum leaf area index showed under-estimation within the range of 8 to 8.7%. The d-statistics values for the time-course simulation of LAI were reasonably good (d-statistics values of 0.792 and 0.809 for Monsanto-919 and Pioneer-30Y87, respectively) (Table 3). Model Evaluation (a) Final simulation: The results in Table 4 showed that there was reasonable agreement between observed and simulated values for days to anthesis in the two hybrids with an error percentage of 1.8 to 5.7. As regards total dry matter at maturity, there was generally satisfactory agreement between all observed and simulated values of the two hybrids; the range of variation was 1.1 to 11.2% and -4.3 to 6.4% for Monsanto-919 and Pioneer-30Y87, respectively. It can be seen that only the treatments I2 (9.5 and 5.8%) and I7 (11.2 and 6.4%) showed slightly higher simulated values than observed ones in Monsanto-919 and Pioneer-30Y87, respectively (Table 4).
The grain yield was under-estimated in control treatment, with an error percentage of 8.5 and 15.8 in Monsanto-919 and Pioneer-30Y87, respectively. Other treatments like I5 and I7 showed over-estimation of 9.2 to 24.3 and 16.1 to 28.7% in Monsanto-919 and Pioneer-30Y87, respectively (Table 4). Regarding unit kernel
Table 2: Monthly weather conditions (average of 2010 and long-term) at Faisalabad during crop period Month Max. Temp.
(°C) Min. Temp. (°C) Mean Temp. (°C) Relative humidity (%) Total Rainfall (mm) Bright sunshine
hours (h) August Average 34.9 26.1 30.5 74.6 226.6 6.0 Long-term 37.6 27.9 32.7 59.6 85.4 7.6 September Average 33.9 23.3 28.6 66.8 86.5 7.9 Long-term 36.4 24.6 30.5 56.9 68.7 8.5 October Average 32.9 19.7 26.3 59.6 0 7.6 Long-term 32.6 18.2 25.4 57.9 4.5 8.4 November Average 27.1 10.5 18.8 62.3 0 8.5 Long-term 28.1 10.8 20.4 58.3 4.4 7.3
Table 3: Summary of observed and simulated results during model calibration with treatment I6 (irrigation at 25 mm PSMD) for Monsanto-919 and Pioneer-30Y87 Variable Unit Hybrid Observed Simulated Error (%age) d-stat Anthesis
day
Monsanto-919 52 53 1.9 Pioneer-30Y87 52 53 1.9
Total dry matter at maturity kg ha-1 Monsanto-919 19373 19392 0.1 Pioneer-30Y87 19825 19558 -1.3
Total dry matter (time course) kg ha-1 Monsanto-919 9607 10870 0.976 Pioneer-30Y87 9676 10963 0.972
Maturity yield kg ha-1 Monsanto-919 7718 7854 1.8 Pioneer-30Y87 7688 7943 3.3
Unit weight g/unit Monsanto-919 0.292 0.297 1.7 Pioneer-30Y87 0.310 0.300 -3.2
Maximum leaf area index Monsanto-919 5.38 4.95 -8.0 Pioneer-30Y87 5.43 4.96 -8.7
Leaf area index (time course) Monsanto-919 3.92 3.88 0.792 Pioneer-30Y87 4.12 3.90 0.809
Maturity
day Monsanto-919 97 97 0.0 Pioneer-30Y87 98 97 -1.0

CSM-CERES-Maize for Irrigation Scheduling / Int. J. Agric. Biol., Vol. 15, No. 1, 2013
5
weight, it was again under-estimated in stressed treatment (control) to as low as 28.6 and 32.2% in Monsanto-919 and Pioneer-30Y87, respectively. The other treatments showed variability in the range of 3.2% for treatment I7 to 9.2% for treatment I3 in Monsanto-919 and -3.9% for treatment I2 to 2.7% for treatment I3 in Pioneer-30Y87 (Table 4).
The model under-estimated leaf area index in both hybrids to a level of 18.3 and 22.2% in treatment I5 of Monsanto-919 and Pioneer-30Y87, respectively. It can be seen from Table 4 that under-estimation increased from less-irrigated treatments to more-irrigated treatments
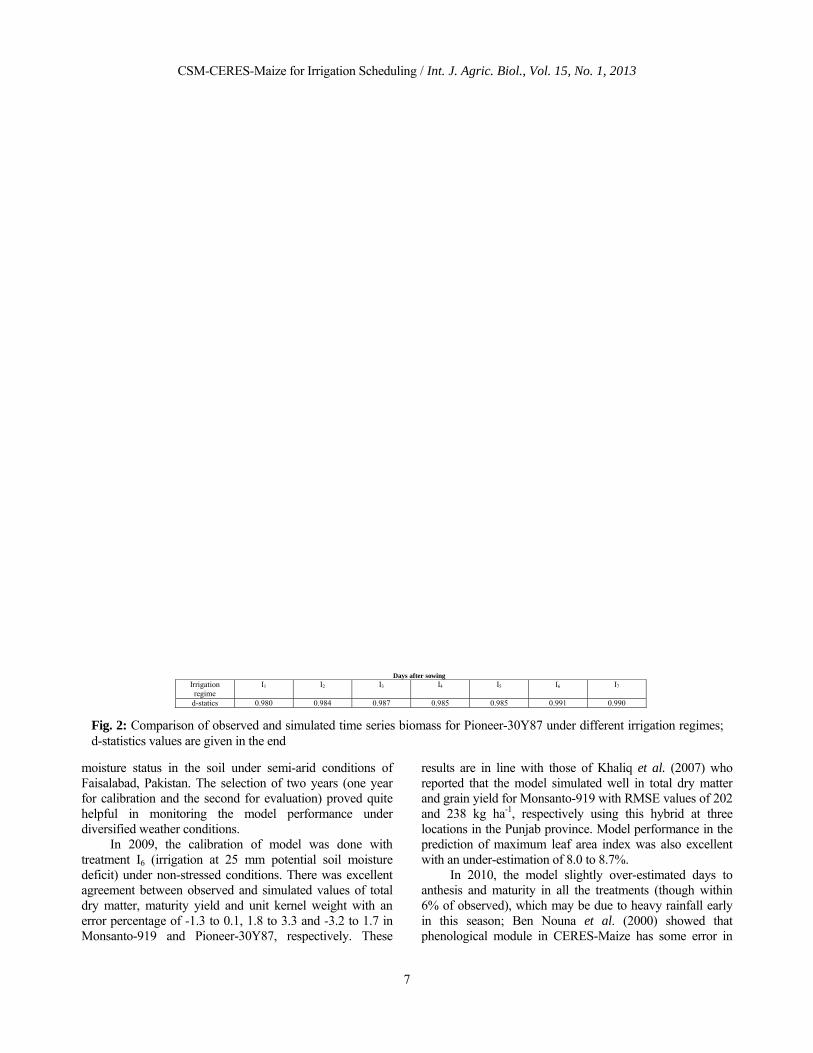
(treatments I2 to I5) in both hybrids. The model showed difference of 1.0 to 5.3% in days to maturity in all the treatments of both hybrids. It can be seen that the error percentage increased as the stress increased. (b). Time course simulation of TDM and LAI: The daily simulation of total dry biomass was quite good. It is obvious from Figs. 1 and 2 that d-statistics values were higher than 0.970 in all treatments of the two hybrids. At early stages the model over-estimated the TDM in all the treatments and over-estimated in some of the treatments at later stages of growth especially in stressed treatments of I1, I2 and I7 (Figs 1 and 2).
Table 4: Summary of observed and simulated results and their percentage error during model evaluation with Monsanto-919 and Pioneer-30Y87 Monsanto-919 Pioneer-30Y87 Irrigation regimes
Anthesis day
Total dry matter (kg/ha)
Maturity Yield
(kg/ha)
Unit weight (g/unit)
LAI maximum
Maturity day
Anthesis day
Total dry matter (kg/ha)
Maturity Yield
(kg/ha)
Unit weight (g/unit)
LAI maximum
Maturity day
I1 Obs 53 14285 4254 0.196 4.71 95 53 15200 4661 0.208 4.75 96 Sim 56 14574 3892 0.140 5.05 100 55 14550 3924 0.141 5.03 100 Error (%) 5.7 2.0 -8.5 -28.6 7.2 5.3 3.8 -4.3 -15.8 -32.2 5.9 4.2
I2 Obs 53 15533 5367 0.229 5.13 96 53 16379 5847 0.259 5.26 97 Sim 56 17014 6568 0.238 4.46 100 55 17333 6832 0.249 4.33 100 Error (%) 5.7 9.5 22.4 3.9 -13.1 4.2 3.8 5.8 16.8 -3.9 -17.7 3.1
I3 Obs 54 18091 6816 0.272 5.20 97 53 19003 6965 0.292 5.39 98 Sim 56 19360 8143 0.297 4.41 100 55 19495 8280 0.3 4.42 100 Error (%) 3.7 7.0 19.5 9.2 -15.2 3.1 3.8 2.6 18.9 2.7 -18.0 2.0
I4 Obs 55 18711 7149 0.281 5.32 97 53 18900 6954 0.296 5.5 98 Sim 56 19435 8176 0.297 4.44 100 55 19218 8195 0.3 4.3 100 Error (%) 1.8 3.9 14.4 5.7 -16.5 3.1 3.8 1.7 17.8 1.4 -21.8 2.0
I5 Obs 55 19185 7478 0.283 5.41 98 54 19785 7084 0.309 5.59 99 Sim 56 19399 8165 0.297 4.42 100 55 19321 8227 0.3 4.35 100 Error (%) 1.8 1.1 9.2 4.9 -18.3 2.0 1.9 -2.3 16.1 -2.9 -22.2 1.0
I6 Obs 54 20180 7320 0.287 5.50 97 53 20856 7297 0.298 5.71 98 Sim 56 20636 8460 0.297 5.02 100 55 20803 8612 0.3 5.01 100 Error (%) 3.7 2.3 15.6 3.5 -8.7 3.1 3.8 -0.3 18.0 0.7 -12.3 2.0
I7 Obs 54 17986 6475 0.281 5.26 95 54 18908 6339 0.291 5.3 97 Sim 56 19998 8047 0.290 5.05 100 55 20113 8158 0.292 5.03 100 Error (%) 3.7 11.2 24.3 3.2 -4.0 5.3 1.9 6.4 28.7 0.3 -5.1 3.1
RMSEa 2.14 1116 1110 0.025 0.68 3.72 1.77 691 1261 0.026 0.88 2.59 aroot mean square error; contains the same unit as that of the parameter I1 = nil irrigation (control) I2 = 4 irrigations (1st at 6 LS i.e. leaf stage, 2nd at 10 LS, 3rd at 14 LS, 4th at 18 LS) I3 = 6 irrigations (1st at 6 LS, 2nd at 10 LS, 3rd at 14 LS, 4th at 18 LS, 5th at silking, 6th at blister) I4 = 8 irrigations (1st at 6 LS, 2nd at 10 LS, 3rd at 14 LS, 4th at 18 LS, 5th at silking, 6th at blister, 7th at milking, 8th at dough) I5 = 10 irrigations (1st at 6 LS, 2nd at 10 LS, 3rd at 14 LS, 4th at 18 LS, 5th at silking, 6th at blister, 7th at milking, 8th at dough, 9th at denting and 10th at physiological maturity) I6 = irrigation at 25mm potential soil moisture deficit I7 = irrigation at 50mm potential soil moisture deficit Table 5: Comparison of simulated crop ET and observed crop ET (mm) for the two hybrids Monsanto-919 Pioneer-30Y87 Irrigation treatment Simulated
crop ET Observed crop ET
Simulated crop ET
Observed crop ET
I1 = nil irrigation (control) 264 279 264 282 I2 = 4 irrigations (1st at 6 LS, 2nd at 10 LS, 3rd at 14 LS, 4th at 18 LS) 313 290 320 299 I3 = 6 irrigations (1st at 6 LS, 2nd at 10 LS, 3rd at 14 LS, 4th at 18 LS, 5th at silking, 6th at blister) 361 296 353 307 I4 = 8 irrigations (1st at 6 LS, 2nd at 10 LS, 3rd at 14 LS, 4th at 18 LS, 5th at silking, 6th at blister, 7th at milking, 8th at dough)
359 298 353 313
I5 = 10 irrigations (1st at 6 LS, 2nd at 10 LS, 3rd at 14 LS, 4th at 18 LS, 5th at silking, 6th at blister, 7th at milking, 8th at dough, 9th at denting and 10th at physiological maturity)
363 298 359 315
I6 = irrigation at 25mm potential soil moisture deficit 355 300 355 315 I7 = irrigation at 50mm potential soil moisture deficit 346 296 346 295

Mubeen et al. / Int. J. Agric. Biol., Vol. 15, No. 1, 2013
6
As far as time variation of leaf area index is concerned, it was well-estimated by the model and d-statistics values were satisfactory in all treatments of the two hybrids, (ranging from 0.834 to 0.939 and from 0.701 to 0.910 for Monsanto-919 and Pioneer-30Y87, respectively). However, some over-estimation of leaf area index early in the growing season in all treatments and under-estimation from flowering to maturity was found in many of the treatments of both hybrids (Figs. 3 and 4). (c). Simulation of crop ET: Regarding the relationship between simulated and observed crop ET, the two hybrids behaved differently. Monsanto-919 showed regression coefficient of 0.943, whereas Pioneer-30Y87 showed a
regression value of 0.786 (Fig. 5). It is evident from Table 5 that the model simulated values of crop ET were somewhat higher than the observed in all treatments of the two hybrids but in control treatment the reverse was observed. Discussion Many scientists calibrated and parameterized cropping system model CSM-CERES-Maize to evaluate irrigation strategies in maize for future use in different parts of the world (Llewelyn and Featherstone, 1997; Ben Nouna et al., 2000; Hoogenboom et al., 2004; Panda et al., 2004). There was a dire need to evaluate this model for quantification of management options considering seasonal variability of
Days after sowing
Irrigation regime
I1 I2 I3 I4 I5 I6 I7
d-statics 0.975 0.981 0.988 0.988 0.987 0.992 0.987
Fig. 1: Comparison of observed and simulated time series biomass for Monsanto-919 under different irrigation regimes; d-statistics values are given in the end
CSM-CERES-Maize for Irrigation Scheduling / Int. J. Agric. Biol., Vol. 15, No. 1, 2013
7
moisture status in the soil under semi-arid conditions of Faisalabad, Pakistan. The selection of two years (one year for calibration and the second for evaluation) proved quite helpful in monitoring the model performance under diversified weather conditions.
In 2009, the calibration of model was done with treatment I6 (irrigation at 25 mm potential soil moisture deficit) under non-stressed conditions. There was excellent agreement between observed and simulated values of total dry matter, maturity yield and unit kernel weight with an error percentage of -1.3 to 0.1, 1.8 to 3.3 and -3.2 to 1.7 in Monsanto-919 and Pioneer-30Y87, respectively. These
results are in line with those of Khaliq et al. (2007) who reported that the model simulated well in total dry matter and grain yield for Monsanto-919 with RMSE values of 202 and 238 kg ha-1, respectively using this hybrid at three locations in the Punjab province. Model performance in the prediction of maximum leaf area index was also excellent with an under-estimation of 8.0 to 8.7%.
In 2010, the model slightly over-estimated days to anthesis and maturity in all the treatments (though within 6% of observed), which may be due to heavy rainfall early in this season; Ben Nouna et al. (2000) showed that phenological module in CERES-Maize has some error in
Days after sowing
Irrigation regime
I1 I2 I3 I4 I5 I6 I7
d-statics 0.980 0.984 0.987 0.985 0.985 0.991 0.990
Fig. 2: Comparison of observed and simulated time series biomass for Pioneer-30Y87 under different irrigation regimes; d-statistics values are given in the end

Mubeen et al. / Int. J. Agric. Biol., Vol. 15, No. 1, 2013
8
case of excess water in the soil. Similarly, model showed some over-estimation of leaf area index early in the growing season and under-estimation from flowering to maturity but the range of d-stat values from 0.701 to 0.939 for the two hybrids did not deviate from the previous findings of Khaliq et al. (2007) showing that d- Index values ranged from 0.70 to 0.99 for all treatments at different locations. Despite these shortfalls the performance of CSM-CERES-Maize, evaluated on the basis of both the daily and final simulations, was reasonably well regarding phenology, above-ground biomass, LAI, grain yield and crop evapotranspiration. Fair to excellent results were found in this study because the simulation is considered excellent when error is less than 10%, good if it is 10 to
20%, fair if 20 to 30%, and poor if the error exceeds 30% (Soler et al., 2007). Kiniry et al. (1997) evaluated the yield response of the CERES-Maize model for nine locations in the United States and reported that simulated mean grain yield was within 5% of measured grain yields for all nine locations. Some over-estimation of crop ET in all treatments (except control) shows goodness of simulation and is in accordance with previous studies. For example, Dogan et al. (2006) reported that the CERES-Maize simulated values of ET were higher than the calculated values and Ouda et al. (2006) showed that water consumptive use was over-predicted by the model they used in their study (Yield-Stress Model) and the prediction varied with different hybrids.
Days after sowing
Irrigation regime
I1 I2 I3 I4 I5 I6 I7
d-statics 0.893 0.918 0.874 0.866 0.834 0.890 0.939
Fig. 3: Comparison of observed and simulated time series leaf area index for Monsanto-919 under different irrigation regimes; d-statistics values are given in the end

CSM-CERES-Maize for Irrigation Scheduling / Int. J. Agric. Biol., Vol. 15, No. 1, 2013
9
Days after sowing
Irrigation regime
I1 I2 I3 I4 I5 I6 I7
d-statics 0.897 0.848 0.823 0.720 0.701 0.806 0.910
Fig. 4: Comparison of observed and simulated time series leaf area index for Pioneer-30Y87 under different irrigation regimes; d-statistics values are given in the end
Fig 5: Relationship between simulated crop ET and observed crop ET for (a) Monsanto-919, (b) Pioneer-30Y87
Mubeen et al. / Int. J. Agric. Biol., Vol. 15, No. 1, 2013
10
Simulation using CSM-CERES-Maize was equally good in both weather conditions (drier 2009 and wetter, 2010). So it appears from this study and previous work of Khaliq et al. (2007) that this model could be successfully used for maize crop in the semi-arid conditions of Punjab. CSM-CERES-Maize under DSSAT may be used for generating climate change scenarios under different climatic zones in Pakistan to assess the drastic effects of rising temperature, enhancing CO2 and changing rainfall patterns in order to develop site specific mitigation and adaptation strategies.
Acknowledgements
The authors are highly grateful to Higher Education Commission (HEC), Pakistan for their financial support for the research work and endowment of computer hardware as well as software. References Banzinger, M., G.O. Edmeades and H.R. Lafitte, 2002. Physiological
mechanisms contributing to increase N stress tolerance of tropical maize selected for drought tolerance. Field Crops Res., 75: 223–233
Ben Nouna, B., N. Katerji and M. Mastrorilli, 2000. Using the CERES-Maize model in a semi-arid Mediterranean environment. Evaluation of model performance. Eur. J. Agron., 13: 309–322
Cakir, R., 2004. Effect of water stress at different development stages on vegetative and reproductive growth of corn. Field Crops Res., 89: 1–16
Cuenca, R.H., 1989. Irrigation System Design: An Engineering Approach. Prentice Hall, New Jersey, USA
Dogan, E., G.A. Clark, D.H. Rogers, V. Martin and R.L. Vanderlip, 2006. On-farm scheduling studies and CERES-Maize simulation of irrigated corn. Appl. Eng. Agric., 22: 509–516
Doorenbos, J. and A.K. Kassam, 1979. Yield Response to Water, p: 176. Irrigation and Drainage Paper 33. FAO, United Nations, Rome
FAO, 2008. Crop Water Information: Maize. Water development and management unit. FAO Retrieved November, 2008, from http://www.fao.org/nr/water/cropinfo_maize.html
Farooq, M., A. Wahid, N. Kobayashi, D. Fujita and S.M.A. Basra, 2009. Plant drought stress: effects, mechanisms and management. Agron. Sustain. Dev., 29: 185–212
French, B.K. and B.J. Legg, 1979. Rothamsted irrigation, 1964–1976. J. Agric. Sci., 92: 15–37
Garrison, M.V., W.D. Batchelor, R.S. Kanwar and J.T. Ritchie, 1999. Evaluation of CERES-Maize water and nitrogen balances under tile-drained conditions. Agric. Sys., 62: 189–200
Government of Punjab, 2011. Production Technology for Maize. Directorate of Agricultural Information, Punjab, Pakistan
Hanway, J.J. and S.W. Ritchie, 1984. How a Corn Plant Develops: Special Report No. 48. Iowa State University
Hargreaves, J.N.G. and R.L. McCown, 1988. CERES-Maize: A Versatile Interactive Version of CERES-Maize. CSIRO Trop. Agron. Technical. Mem/CSIRO Div. of Tropical Crops and Pastures. St. Luica, QLD, Australia
Hodges, T., D. Botner, C. Sakamoto and J.H. Haug, 1987. Using the CERES-Maize model to estimate production for the US corn belt. Agric. For. Meteorol., 45: 293–303
Hoogenboom, G., 2004. Genetic Coefficients-CERES-maize/sorghum/millet. In: South Asia Regional Training Workshop on “Crop Simulation Modeling” at the Multiple Cropping Center, Chiang Mai University, Thailand, pp: 255–269. Hussain, S.S. and M. Mudasser (eds.). Islamabad, Pakistan; GCISC
Hoogenboom, G., J.W. Jones, P.W. Wilkens, C.H. Porter, W.D. Batchelor, K.A. Hunt, K.J. Boote, U. Singh, O. Uryasev, W.T. Bowen, A.J. Gijsman, A. Dutoit, J.W. White and G.Y. Tsuji, 2004. Decision Support System for Agro-Technology Transfer Version 4.0 [cd-rom]. University of Hawaii, Honolulu, USA
Hussain, I., M. Ahsan, M. Saleem and A. Ahmad, 2009. Gene action studies for agronomic traits in maize under normal and water stress conditions. Pak. J. Agric. Sci., 46: 107
Jones, C.A. and J.R. Kiniry, 1986. CERES-Maize: A Simulation Model of Maize Growth and Development. College Station, Texas A & M University Press, Texas, USA
Khaliq, T., A. Ahmad, A. Hussain, A. Wajid and G. Hoogenboom, 2007. Modeling nitrogen use efficiency of maize cropping system in Pakistan. In: International Annual Meetings, American Society of Agronomy- Crop Science Society of America- Soil Science Society of America, November 4-8
Kiniry, J.M., J.R. Williams, R.L. Vanderlip, J.D. Atwood, D.C. Reicosky, J. Mulliken, W.J. Cox, H.J. Mascagni Jr., S.E. Holliger and W.J. Wiebold, 1997. Evaluation of two maize models for nine U.S. locations. Agron. J., 89: 421–426
Kramer, P.J. and J.S. Boyer, 1995. Water Relations of Plants and Soil, p: 495. Academic Press Inc., San Diego, California, USA
Kunkel, K.E., S.E. Hollinger and B.C. Reinke, 1994. Impact of Midwestern Flooding on Crop Production. Midwestern Regional Climate Center. State Water Survey. Illinois Department of Natural Resources, Champaign, Illinois, USA
Llewelyn, R.V. and A.M. Featherstone, 1997. A comparison of crop production functions using simulated data for irrigated corn in western Kansas. Agric. Sys., 54: 521–538
Mckersie, B. and Y.Y. Leshem, 1994. Stress and Stress Coping in Cultivated Plants, p: 256. Kluwer Academic Publisher Group, Dordrecht, The Netherlands
Monteith, J.L., 1977. Climate Efficiency of Crop Production in Britain, pp: 277–294. Philosophical transaction of Royal Society of London
Otegui, M.E., F.H. Andrade, F.H. and E.E. Suero, 1995. Growth, water use and kernel abortion of maize subjected to drought at silking. Field Crops Res., 40: 87–94
Ouda, S.A., F.A. Khalil and M.M. Tantawy, 2006. Predicting the impact of water stress on the yield of different maize hybrids. Res. J. Agric. Biol. Sci., 2: 369–374
Panda, R.K., S.K. Behera and P.S. Kashyap, 2004. Effective management of irrigation water for maize under stressed conditions. Agric. Water Manage., 66: 181–203
Pandey, R.K., J.W. Maranville and A. Admou, 2000. Deficit irrigation and nitrogen effects on maize in a Sahelian environment I. Grain yield and yield components. Agric. Water Manage., 46: 1–13
Shah, M., 2008. Irrigation, Agricultural Productivity and Poverty Alleviation: A Case Study of Chashma Right Bank Canal (CRBC) in D.I. Khan. Ph.D. Thesis, Department of Economics, Gomal University, D.I. Khan, Pakistan
Singh, B.R. and D.P. Singh, 1995. Agronomic and physiological responses of sorghum, maize and pearl millet to irrigation. Field Crops Res., 42: 57–67
Soler, C.M.T., P.C. Sentelhas and G. Hoogenboom, 2007. Application of the CSM-CERES-Maize model for planting date evaluation and yield forecasting for maize grown off-season in a subtropical environment. Eur. J. Agron., 27: 165–177
Stone, P.J., D.R. Wilson and R.N. Gillespie, 1998. Drought Effects on Canopy Development in Sweet Corn. New Zealand Institute for Crop and Food Research Ltd., Hastings and Lincoln, New Zealand
Stone, P.J., D.R. Wilson, J.B. Reid and R.N. Gillespie, 2001. Water deficit effects on sweet corn water use, radiation use efficiency, growth, and yield. Aust. J. Agric. Res., 52: 103–113
Usman, M., A. Ahmad, S. Ahmad, M. Arshad, T. Khaliq, A. Wajid, K. Hussain, W. Nasim, T.M. Chattha, R. Trethowan and G. Hoogenboom, 2009. Development and application of crop water stress index for scheduling irrigation in cotton (Gossypium hirsutum L.) under semiarid environment. J. Food Agric. Environ., 7: 386–391
(Received 06 July 2012; Accepted 16 October 2012)