01. BPK B Cover page - bqk-kos.org · publications namely, BPK Bulletin and Working Paper series....
52
Research and Statistics Department No.1 Pristina 2005 BPK BULLETIN (Structure of Commercial Banking Sector) BANKING AND PAYMENTS AUTHORITY OF KOSOVO AUTORITETI BANKAR DHE I PAGESAVE TË KOSOVËS BANKARSKI I PLATNI AUTORITET KOSOVA
Transcript of 01. BPK B Cover page - bqk-kos.org · publications namely, BPK Bulletin and Working Paper series....

and
De
Pristina 2005
BPK BULLETIN (Structure of Commercial Banking Sector)
BANKING AND PAYMENTS AUTHORITY OF KOSOVO AUTORITETI BANKAR DHE I PAGESAVE TË KOSOVËS BANKARSKI I PLATNI AUTORITET KOSOVA
Research
Statistics
partment
No.1

BANKING AND PAYMENTS AUTHORITY OF KOSOVO AUTORITETI BANKAR DHE I PAGESAVE TË KOSOVËS
BANKARSKI I PLATNI AUTORITET KOSOVA
BPK BULLETIN
(STRUCTURE OF COMMERCIAL BANKING SECTOR)

PUBLISHER
Banking and Payments Authority of Kosovo Research and Statistics Department 33 Garibaldi, Prishtina Telephone:++381 38 222 243 Fax: ++381 38 243 763
WEB www.bpk-kos.org
E-mail [email protected]
EDITOR-IN-CHIEF Gani GËRGURI
EDITORIAL BOARD Esat Durguti
Mentor Geci Florim Maxharraj
Valentin Toçi
EDITORS Semra Tyrbedari
Bedri Zymeri
PRINTED BY "TEKNIKA" Prishtinë.
Users of the data from this publication are requested to cite the source. Any correction that might be required will be made in the web site version. Printed in 100 copies.

ABREVIATIONS ABK American Bank of Kosovo ATM Automated Teller Machine BE Economic Bank BKP Credit Bank of Pristina BPB Bank for Private Business BPK Banking and Payments Authority of Kosovo BRK New Bank of Kosovo DEM Deutsche Mark EBRD European Bank for Reconstruction and Development EUR Euro FMO Financ. Maatschappij voor Ontwikkelings-landen GDP Gross Domestic Product HHI Herfindahl-Hirschman Index IFC International Finance Corporation IMF International Monetary Fund IMF(IMI) Investment Micro Finance KFW Kreditanstalt für Wiederaufbau KSB Kasabank MEB Micro Enterprise Bank MEF Ministry of Economy and Finance NIM Net Interest Margin PCB ProCredit Bank PISG Provisional Institutions of Self Government RBKO Raiffeisen Bank of Kosovo ROAA Return on Average Assets ROAE Return on Average Equity RZB Raiffeisen Zentralbank UNMIK United Nations Mission in Kosovo
1

List of Tables Table 1 Commercial banking structure by total assets Table 2 Employees and banking units in the commercial banking sector Table 3 Structure of commercial banking sector assets Table 4 Structure of commercial banking sector liabilities Table 5 Structure of commercial banking sector capital Table 6 Structure of commercial banking sector income statement List of Figures Figure 1 Number of banks Figure 2 Geographical distribution of banking units Figure 3 Percentage change in the number of banking units Figure 4 Number of banking units and ATMs by bank groups Figure 5 Indicators of productivity per employee Figure 6 Herfindahl-Hirschman Index Figure 7 Share of three largest banks assets (deposits, loans) to total assets
(deposits, loans) Figure 8 Structure of loans by institutional sectors Figure 9 Structure of loans by industry Figure 10 Structure of loans by maturity Figure 11 Maturity structure of deposits – Depositor structure of deposits Figure 12 Capital adequacy ratio Figure 13 Structure of income Figure 14 Structure of expenses Figure 15 Overhead cost to gross income Figure 16 Return on average assets Figure 17 Return on average equity Figure 18 Net Interest Margin Figure 19 Liquid assets to total assets Figure 20 Structure of liquid assets of total banking sector Figure 21 Loan to deposit ratio List of Boxes Box 1 Composition of the bank groups Box 2 Productivity by banking groups Box 3 Main categories of assets by banking groups Box 4 Loans granted by banking groups Box 5 Main categories of liabilities by banking groups Box 6 Deposits structure by banking groups Box 7 Structure of capital by banking groups
2
Contents
1. Introduction 4
2. Structure of Commercial Banking Sector in Kosovo 7
2.1 Banking Population 7 2.2 Geographical Distribution of Banking Units 9 2.3 New Technology 10 2.4 Employment 11
2.5 Concentration in the Banking Activity 14
3. The Structure of Balance Sheet of Commercial Banks in Kosovo
15
3.1 Structure of Assets 15 3.11 Loans Granted by Commercial Banks in Kosovo 17 3.2 Structure of Liabilities 20
3.21 Deposits of Commercial Banking Sector 22
4. The Structure of Capital of Commercial Banks in Kosovo
25
5. Financial Performance of Commercial Banks in Kosovo 27
5.1 Structure of Income and Expenditure Statement 27 5.11 Main Components 27
Structure of Income 28 Structure of Expenditures 29 5.2 Profitability and Efficiency 31
5.3 Liquidity 33
Notes on Methodology
36
List of banks 43
3

1. Introduction
The Banking and Payments Authority of Kosovo (BPK) is launching the new publication “BPK
Bulletin” with the aim informing in more detail the public on the main developments in the
financial sector in line with regulatory responsibility of the BPK. This issue will put emphasis
on the structure of the commercial banking sector which represents largest component of the
financial sector in Kosovo. Apart from indicators which reflect main developments in the
banking sector as a whole, to facilitate the analysis, the commercial banks are divided in two
groups, group 1 comprising banks with majority owned foreign capital and group 2 comprising
banks with majority owned domestic capital.
The BPK is established in November 1999 based on the UNMIK Regulation 1999/20, amended
in UNMIK Regulation 2001/24, as a public legal entity. The principal objectives of the BPK
are to:
• Foster an efficient and safe system for domestic payments;
• Foster the liquidity, solvency, and efficient functioning of a stable market-based
financial system, including regulating banks, insurance companies and other financial
institutions.
Within these objectives the BPK has, among others, the following specific powers to:
• Recommend broad policy guidelines to the Special Representative of the Secretary-
General in areas under its responsibility, under the guidance of the Deputy Special
Representative for Economic Reconstruction and Development;
• Conduct regular economic and monetary analysis of the Kosovo economy, make public
the results, and submit proposals and measures to the UN Interim Administration in
Kosovo on the basis of such analysis;
• License, supervise, and regulate financial institutions and dealers in foreign exchange;
• Act as banker and fiscal agent to the PISG (MEF) and to provide financial advice at its
request,
In 2004 the BPK adopted the new organization structure consisting two main pillars:
Supervision of Financial Institutions and Operations, and the function of the Inspector
General. The reorganization was in the function of Kosovarisation process of the BPK where
two high-level management positions were created, namely functions of Chief Supervision
Officer and Chief Operations Officer. Also the reorganization was in the function of adjustment
4

to specific tasks and activities that will provide grounds for higher quality of executive and
work performance.
BPK 2005 ORGANIZATION CHART
Governing Board
Chairman: Ajri Begu3 Executive Directors: MD, DMD, DMD2 UNMIK represenatives: Joachim Rücker (DSRSG)Chiara Bronchi (FAO)Individual Member: Gazmend Luboteni
Managing Director (MD)Michel Svetchine
Office of Managing Director:
- Asset Management - Institutional & Media Relations - Office of Legal Advisor - Project manager - Executive Assistant
Audit Committee
2 Non Executive Directors
Chiara BronchiGazmend Luboteni
Deputy Managing Director (DMD)David Weatherman
Chief Supervision Officer (CSO)Hashim Rexhepi
Accounting
Deputy Managing Director (DMD)Benoit Waelkens
Chief Operation Officer (COO)Gani Gërguri
Inspector GeneralAgron Dida
Executive Committee
Supervision Committee
Statistics Committee
Human Resources
Research & StatisticsBanking Supervision
Insurance Supervision
Pension Supervision Administration
Banking Services
Information Technology
Cash & Vault
Internal Audit
Operations Analysis
Cost Accounting
Executive Comittee
As shown in the organizational chart, the first level consists of BPK Governing Board that
formulates policies, which are then executed by the BPK Management and staff.
Under the Section 9 of the BPK regulation, the BPK shall inform the public on a regular and
timely basis of its analysis of macroeconomic and financial market developments and on
related statistical information. Research and Statistics Department of the BPK publishes in its
Monthly Statistics Bulletin statistics covering entire financial system and other sector statistics.
Financial sector statistics has improved in quality and coverage in line with international
standards that creates the grounds for analytical work. This will be developed through new
publications namely, BPK Bulletin and Working Paper series.
This issue aims to describe key developments in the commercial banking system in Kosovo.
The banking sector in Kosovo experienced continuous positive developments in five years of
its operation. The banking sector balance sheet total grew by 37.1% in 2004 to 797.0 EUR
million, influenced mainly by the continuous expansion of lending and the rise in deposits.
5

Commercial banks concentrated their lending towards private non-financial corporations,
though loans to households experienced improvement in 2004. Up till 2004, deposits were
mainly shorter term, whereas in 2004 other (time and savings) deposits composed 59.2% of
total consumer deposits. Commercial banks ended their financial year with 90.5% increase in
net profits, with net interest income being the largest component. Profitability and cost
efficiency also experienced improvement during the course of 2004. The commercial banks’
capitalization remains adequate.
6

2. Structure of Commercial Banking Sector in Kosovo
2.1 Banking population
The banking sector is the largest component of Kosovo's financial sector. As of end 2004,
banking sector assets accounted for an excess of 85.0 % of total financial system assets.
Immediately, after the war in 1999, there were no banks operating in Kosovo whereas
transactions were developed in cash. The first bank established in January 2000 was Micro
Enterprise Bank (MEB), now named ProCredit Bank, which was mainly owned by the
development agencies and foreign financial institutions. Between March and November 2001
banking sector in Kosovo registered an increase in the number of banks, as six other banks
were established which in turn contributed to the increase in competition in the provision of
banking services. Although no new bank was granted with a license from the BPK since then,
Kosovo’s commercial banks expanded significantly their network through the increase in the
number of their operating units accompanied by a provision of a wide range of products.
As of December 2004, banking sector in Kosovo consisted of seven commercial banks:
ProCredit Bank (PCB), Raiffeisen Bank of Kosovo (RBKO), New Bank of Kosovo (BRK),
Bank for Private Business (BPB), Economic Bank (BE), Kasabank (KSB), and Credit Bank of
Pristina (BKP).
To facilitate the analysis of the banking sector, banks have also been classified into two groups
and are commented in the boxes of different chapters. The criterion of banks' majority
ownership (foreign versus domestic), which captures the size effect as well, is used as the basis
for the analysis of banks in addition to the analysis of the banking sector as a whole. As of end
2004, Group I consisted of two banks in-full-foreign ownership, whereas Group II consisted of
five banks with majority (though there are minority foreign shareholders) domestic ownership.
7

As depicted in Figure 1, the ownership structure of the banking sector does not appear to have
changed over this period of four years. However, there were some changes in Group I banks
considering that in November 2003 MEB has been transformed into the ProCredit Bank, which
is still owned by the development agencies and foreign financial institutions such as EBRD,
IFC, FMO (the Netherlands), KFW, IMF (Investment Micro Finance, Frankfurt) and
Commerzbank. Additionally, in November 2001, American Bank of Kosovo (ABK) has been
transformed into the Raiffeisen Bank of Kosovo (RBKO), following the purchase of 76.0 % of
ABK by the Raiffeisen Zentralbank Österreich AG (RZB-Austria) and since July 2003 RBKO
is fully owned by RZB-Austria.
With respect to the size of assets at end-2004, Group I bank assets accounted for 62.0 % of total
banking system assets, testifying in this way the continuing concentration in the banking
system, which is principally dominated by the two largest banks in majority foreign ownership.
Group I Group II
ProCredit Bank (PCB) Raiffeisen Bank of Kosovo (RBKO)
New Bank of Kosovo (BRK) Bank for Private Business (BPB) Economic Bank (BE) Kasabank (KSB) Credit Bank of Pristina (BKP)
Box 1. Composition of the bank groups
12 2 2 2
5 5 55
2000 2001 2002 2003 2004
In foreign ownership In domestic ownership
Figure 1. Number of banks
8

Table 1. Commercial banking sector structure by total assets, in EUR thousands and percentage share
2000 Share in % 2001 Share in % 2002 Share in % 2003 Share in % 2004 Share in %
I In foreign ownership 102,964 100.0 385,315 74.2 344,380 73.1 370,869 63.8 494,539 62.0
II In domestic ownership - 0.0 133,670 25.8 126,813 26.9 210,614 36.2 302,528 38.0
102,964 518,985 471,193 581,483 797,067 Banking sector total
Group
Despite the fact that the largest share of total assets is registered for by Group I banks, over the
observed period, the concentration of banks with foreign ownership in terms of their asset size
has gradually decreased (see table 1). As of end 2003, the share of Group I banks assets in total
assets decreased by 9.3 percentage points relative to the end 2002 reaching the share of 63.8 %
in total banking system assets. This decrease in the share of Group I assets in total banking
sector assets continued, but to a lesser extent in 2004, representing a fall in the share by 1.8
percentage points.
2.2 Geographical Distribution of Banking Units
There were 217 banking units (branches and sub-branches) operating in Kosovo as of
December 2004, covering a wide geographical area and being present in all five main regions1.
Although no new bank has been licensed during the 2001-2004 period, commercial banks have
increased their number of banking units in Kosovo with 70 new opened units in 2004. Even if
the year-on-year comparison shows significant differences, the yearly average of new opened
units reached around 50.
With respect to the regional distribution of operating units, as of end 2004, the highest
concentration of banking units was in Pristina, accounting for 25.6 % of total operating units in
Kosovo (see figure 2). The second largest concentration was in Gjilan which represents 24.6 %
of total operating units. The three remaining regions show mutually comparable shares: Prizren
(17.4 %), Peja (16.9 %), and Mitrovica (15.5 %).
1 Note that the municipalities throughout Kosovo comprise particular region f.i. Ferizaj is included in the Gjilan region. We based our analysis in the five main regions of Kosovo which are: Pristina, Prizren, Peja, Mitrovica and Gjilan.
9

Figure 2. Geographical distribution of banking units, as of end 2004
Mitrovi
Pristina
Prizren
Peja
Gjilan
As illustrated in figure 3, in 2004 compared with 2003, the largest change in the number of
banking units was recorded for by the Prizren region (80.0 %). The next largest increase in
relative terms is recorded in Pristina region (55.9%), Mitrovica (39.1 %), and Peja (29.6 %).
Gjilan recorded for the smallest change during 2004 with an increase of 18.6 %.
Figure 3. Percentage change in the number of banking units, as of end 2004
Pristina
Mitrovica
Peja
Prizren Gjilan
Group II banks, representing 38.0% of total assets, had the largest number of banking units at
end-2004. Accounting for 80.2 % of total number of operating units in Kosovo, they expanded
their number of operating units in 2004 with 39.3%
2.3 New Technology
From 2002 onwards, banks in Kosovo are optimising their banking network by utilising new
technology. The establishment of new technology has enabled banks to increase the security in
10

providing their services, widen the range of the products they provide and creating in turn
grounds for them to increase their efficiency. Moreover, new technology (ATMs) has enabled
clients to use banking services directly and continuously throughout 24 hours.
As of December 2004, the number of ATMs in the banking sector reached 43. As evidenced by
figure 4, Group I banks accounted for 100 % of the total ATMs installed throughout the region,
suggesting that new technology in the banking system is initiated by banks in majority foreign
ownership.
43 46
171
0
20
40
60
80
100
120
140
160
180
Group I Group II
ATMs Banking units
Figure 4. Number of Banking units and ATM's by Bank Groups, as of end 2004
Following the trend of development of the world banking as well as the changing behaviour of
population in Kosovo towards better use of banking services, banks have provided their clients
with other new products such as credit and debit cards (Visa, Master Card, Maestro Card)
which are mainly promoted by the banks in majority foreign ownership.
As for the regional distribution of ATMs, Pristina region represents 41.9 % of total installed
ATMs. The next largest concentrations are Peja and Gjilan (18.6% and 16.3%), whereas
Mitrovica and Prizren are the least concentrated regions each accounting for 11.6% of total
ATMs installed.
2.4 Employment
In 2004, the trend towards increasing banking units was accompanied with a rise in
employment by commercial banks, which by the end of 2004 reached 2,068 full time
equivalent employees. In 2004, employment in the banking sector rose by 23.4 % against
20.3% in 2003.
11

A labour productivity indicator, expressed by the number of employees per banking unit, has
shown continuous improvement during the 2001-2004 period (see table 2). In 2004, the number
of employees per banking unit amounted 10 which compared to 2001 represents a decrease of
13 employees per banking units. Even so, we should exercise a caution when making a
comparison with 2000 and 2001 given that only few banks were operating in Kosovo2. Table 2. Employees and Banking Units in the commercial banking sector
2001 2002 2003 2004
No. of banking units 28 110 147 207
No. of employees 637 1,393 1,676 2,068
No of employees per banking unit 23 13 11 10
Total Assets
Per banking unit, in '000 EUR 18,535 4,284 3,956 3,851
Per employee, in '000 EUR 814.7 338.3 346.9 385.4
Number of citizens (in thousands) 1,867 1,899 1,931 1,964
Per banking unit 66,679 17,264 13,136 9,488
Per employee 2,931 1,363 1,152 950
Loans
Per employee, in 000' EUR 40.7 62.1 138.9 181.0
Per banking unit, in 000' EUR 925.6 786.3 1,583.5 1,808.4
Deposits
Per employee, in 000' EUR 772.8 306.7 306.7 331.6
Per banking unit, in 000' EUR 17,581 3,884 3,497 3,313
Description
In addition, the size of assets managed by an operating unit does not point to the
rationalisation of banking activities due to the fact that as of end 2004 the volume of
assets managed by an operating branch fell, although at a slower rate, as compared to
the preceding year. As of end 2004, assets managed per banking unit amounted to 3,9
EUR million which corresponds to a decrease of 2.7% against a decrease of 7.7% in
2003. The increased is most marked for the loans, where the volume of loans granted
by a banking unit increased with 14.2% in 2004. On the deposit side, the volume
managed by banking unit decreased in 2004 by 5.3% amounting to 3,3 EUR million.
However, productivity measured by the size of assets managed by an employee, reveals an
increase over the last three years. The total assets managed by an employee amounted to
385,400 EUR at end-2004 against 346,900 EUR at end-2003 representing a growth of 11.1%.
Though, we should also pay attention to the workload during the period of conversion of DEM
2 Mainly in the large cities
12

into EUR in 2001, which may also overestimate the productivity indicators during this period.
For the total banking sector, loans granted per employee experienced an increase by 30.1% in
2004 compared to 2003, reaching 180,691 EUR, whereas deposits per employee grew by 9.2%
and amounted to 331,571 EUR.
With respect to the indicator of “bankarisation” in Kosovo, measured by the number of
inhabitants served by a banking unit, table 2 reveals that the indicator experienced a downward
trend. In 2003, the number of citizens per banking unit amounted to 13,136 which is a decrease
of 23.9% compared with 2002. Following this decrease, in 2004 the number of citizens served
by a banking unit further went down to 9,488, a decrease of 27.8%. Similar picture is revealed
from the indicator measuring the number of citizens served by an employee, which in 2004
decreased by 17.6% against 15.5% in 2003 and reached 950 citizens per employee.
Box 2. Productivity by banking groups
Although the banks of Group I outstand the banks of Group II in terms of the level of total
assets, deposits and loans per employee, the two groups show opposite tendencies.
The Group II increased all three indicators measured per employee, while Group I did so only
for loans. The level of total assets and deposits managed per employee by Group II represents
38.6% (+6.8 percentage points compared to 2003) and 36.7% (+8.3 percentage points
compared to 2003) respectively of the level reached by Group I. Regarding the loans managed
by employee, the relative position of Group II diminished with 2.4 percentage points
compared to 2003, reaching 48.7% of the level obtained by Group I.
623
618
198 23
9
573
539
162 19
8
204
264
105 12
9
0
100
200
300
400
500
600
700
2003 2004 2003 2004
Group I Group II
Total Assets Deposits Loans
Figure 5. Indicators of productivity per employee, in EUR thousands
13

2.5 Concentration in the Banking Activity
The Herfindahl-Hirschman Index (HHI) is used to represent the developments in the structure
and the change of the market shares in the banking system. As figure 6 indicates, concentration
in the banking sector with respect to total assets experienced a slight decrease from 4,058 at
end 2002, over 2,803 points at end-2003, to 2,536 points by end-2004.
Meanwhile, the level of the concentration for deposit taking experienced a downward trend
during 2004, reaching the HHI value of 2,625 points. In addition, the concentration for deposit
taking experienced a further decrease during 2003, changing from 4,239 points at end-2002 to
3,276 at end-2003. All this change in the concentration level in the banking sector might be the
result of a more competitive environment.
Additionally, the increase in the index and hence the decrease of competition was observed in
the loan market. During the observed period the HHI concentration for loans experienced an
upward trend reaching the value of HH index of 2,053 points at end 2004 which represents an
increase of 176 points relative to the end 2003 and 373 points relative to end 2002.
-
2,000
4,000
6,000
8,000
10,000
2001 2002 2003 2004-
2,000
4,000
6,000
8,000
10,000
Total assets Total deposits Total loans
Figure 6. Herfindahl- Hirschman Index (HHI) (All banks)
Another measure of competitiveness in the banking industry is also the concentration of the
three largest banks (C3). Figure 7 indicates that the market shares of the three largest banks
within the domestic banking market are falling gradually as far as assets and deposits are
concerned. As of end 2004, the concentration of the three major banks’ share -measured as a
combined participation of the three banks in total banking sector assets- followed a downward
trend.
14

In particular, the share of three largest banks assets in total assets fell by 0.5 percentage points
and reached the share of 73.8 % of total banking system assets, while the share of the three
major banks' deposits to total banking sector deposits has continuously decreased and
accounted for 74.4 % at end-2004 from 79.2 % and 83.3 % at end-2003 and 2002, respectively.
On the other hand, the C3 concentration on loans granted reached at 71.1 % at end-2004,
which is 4.0 percentage points higher compared with end-2003, whereas in 2002 it
stood at 59.1% or 33.3 percentage points higher compared with 2001.
50%
60%
70%
80%
90%
100%
2001 2002 2003 200450%
60%
70%
80%
90%
100%3 largest banks assets/Total assets 3 largest banks' deposits/Total deposits
3 largest banks' loans/Total loans
Figure 7. Share of three Largest Banks' Assets (deposits,loans) to Total Assets (deposits,loans)
Regarding the defined group of banks’ share, Group I accounted for 62.0% of total assets as of
end 2004. The share of Group I banks in total banking sector loans reached 56.4%, which
represents 4.2 percentage points increase compared with 2003, while the share of Group I
banks in total banking sector deposits decreased by 3.4 percentage points accounting for 63.0 %
of total deposits in 2004.
3. The Structure of Balance Sheet of Commercial Banks in Kosovo
3.1 Structure of Assets
Commercial banks in 2004 experienced a further growth in their total assets influenced mainly
by the increase in lending on the asset side and a rise in deposits on the liability side.
Total banking sector assets stood at 797.0 EUR million as of end-2004, an increase of 37.1%
(or 215.6 EUR million) relative to the end 2003. Total banking sector assets grew from 32.4%
of GDP in 2003 to 42.1% of GDP in 2004, whereas they represented 27.2% of GDP in 2002.
The share of the main categories of assets in total assets is presented in the table 3. As indicated
15

in the table, liquid and less risky assets (cash, balances with BPK, placements in banks abroad
and investments in foreign securities) experienced substantial changes during this five-year
period. As of end 2004, they experienced an increase of 24.7% with respect to their volume and
amounted to 413.9 EUR million. In terms of their share to balance sheet total, liquid assets
experienced a continuous decrease which by the end of 2004 accounted for 51.9% of balance
sheet total, representing a decrease of 5.2 and 27.5 percentage points compared with 2003 and
2002, respectively.
Table 3. Structure of commercial banking sector assets, in EUR thousands and percentage
Amount Share in % Amount Share in % %∆ Amount Share in % %∆ Amount Share in % %∆
Currency 88,342 17.0 35,597 7.6 -59.7 46,611 8.0 30.9 43,293 5.4 -7.1
Balance with BPK 176,793 34.1 45,740 9.7 -74.1 59,569 10.2 30.2 73,000 9.2 22.5
Loans to financial corporations(placements) 212,753 41.0 292,725 62.1 37.6 106,205 18.3 -63.7 185,815 23.3 75.0
Securities 7,498 1.4 - - - 119,620 20.6 - 111,778 14.0 -6.6
Gross loans to non-financial sector 25,916 5.0 86,498 18.4 233.8 232,773 40.0 169.1 374,339 47.0 60.8
Less: provisions for loan losses 781 0.2 2,522 0.5 222.9 7,715 1.3 205.9 15,947 2.0 106.7
Net Loans 25,135 4.8 83,976 17.8 234.1 225,058 38.7 168.0 358,392 45.0 59.2
Property and equipment, net of depreciation 4,544 0.9 9,498 2.0 109.0 12,265 2.1 29.1 15,051 1.9 22.7
Interest receivable and other assets 3,920 0.8 3,657 0.8 -6.7 12,155 2.1 232.4 9,738 1.2 -19.9
Total assets 518,985 100 471,193 100 -9.2 581,483 100 23.4 797,067 100 37.1
Description Dec. 2001 Dec. 2002 Dec. 2003 Dec. 2004
As of end 2004, the volume of cash and balances with BPK amounted to 116.3 EUR million
which represents an increase of 9.5 % compared with 2003. However, with respect to their
share in balance sheet total, cash and balances with BPK of the total banking sector
experienced 3.7 percentage points decrease mainly due to the decrease in cash, and by the end
of 2004 accounted for 14.6% of total assets.
Accounting for a substantial share in total assets, placements in banks abroad and investments
in (foreign) securities amounted to 297.6 EUR million at end-2004, an increase by 31.8%
compared with 2003. Even though they experienced an increase in outstanding amounts, in
2004, their share in balance sheet total decreased by 1.5 percentage points which was mainly as
a result of the decrease of investments in foreign securities which represent 37.6% of total
investments abroad.
The lower share of investments abroad was mainly compensated by a higher share of customer
credits granted by banks which in 2004 grew by 7.0 percentage points compared with 2003. In
addition, they generated positive contribution to the growth of assets by 24.3% and at end 2004
amounted to 374.3 EUR million.
16

Box 3. Main categories of assets by banking groups
Share of Group I in total banking sector in 2004 and change in percentage points against 2003:
48.2% of Cash and balances with BPK (-4.9 percentage points)
74.1% of placements and investments in securities (-8.8 percentage points)
56.4% of Loans (+4.2 percentage points)
Within Group I, the share of cash and balances with BPK represented 11.3% of total assets as
of end 2004 or down by 3.9 percentage points compared with 2003. The corresponding share
within Group II was 19.9%, also a decrease of 3.8 percentage points compared with 2003.
Similarly, the share of placements and investments in securities abroad of Group I as part of
its total assets reduced and accounted for 44.6%. On the contrary, Group II banks increased in
2004 their placements and investments in securities abroad as a share in their total assets to
25.4%, an increase by 7.1 percentage points compared with 2003.
The share of Group I loans in total Group I assets increased from 32.8% in 2003 to 42.7% in
2004. The share of loans provided by Group II to total Group II assets increased slightly from
52.8% in 2003 to 53.9% in 2004.
3.1.1 Loans Granted by Commercial Banks in Kosovo
From 2002 onwards, commercial banks in Kosovo have continuously improved their role in
providing intermediation to the domestic economy. Loans grew with 60.8% in 2004 with
private non-financial corporations being the largest beneficiaries, though loans to households
boost with 125.7%. Trading industry is the largest beneficiary whereas commercial banks are
directing their activity towards longer-terms loans, with loans over one year accounting, since
2004, for the largest share to total loans.
As of December 2004, total outstanding gross loans granted by banks amounted to 374.3 EUR
million, which represents a year-on-year increase of 60.8%. The volume of net loans attained
358.4 EUR million, or a year-on-year increase of 59.2%. Furthermore, the growth rate of loans
was higher than the growth of GDP. In 2004, the share of total loans to GDP accounted for
19.7% representing an increase of 6.8 percentage points compared with 2003. The share of
17

loans to balance sheet total reached 47.0% which corresponds to 7.0 percentage points increase
compared with 2003.
The volume of loans granted to non-financial corporations increased from 193.9 EUR million
in 2003 to 286.6 EUR million in 2004 (see figure 8), which represents an increase of 47.8%
compared with 2003. However, loans to non-financial corporation experienced a reduction (6.7
percentage points compared with 2003) in terms of their share to total loans, and they
accounted by the end of 2004 for 76.6% of total loans.
0%
10%
20%
30%
40%
50%
60%
70%
80%
90%
100%
2001 2002 2003 2004-
50,000
100,000
150,000
200,000
250,000
300,000
350,000
400,000
Non-financial corporations Households Total loans in '000 EUR (Right axis)
Figure 8. Structure of Loans by institutional sectors
Loans granted to non-financial corporations, were for 99.6% channelled to private enterprises
representing an increase of 47.8% compared with 2003 whereas the volume as well as the share
of loans granted to public and social enterprises remains negligible.
The volume of loans granted to households attained 87.8 EUR million in 2004, which in
comparison to 2003 represented an increase by 125.7% pointing to a significant increase in
loan activities towards households. Following their increase in volume, loans extended to
households increased in terms of their share to total loans as well. In 2004, the share of loans
granted to households reached 23.4% which correspond to 6.7 percentage points increase
compared with 2003.
The structure of loans by economic activity continued to be in proportion to the industry
structure of the economy of Kosovo, where the trade had the dominant position. As of end
2004, from the total volume of loans granted by the banking sector, 214.3 EUR million were
channelled to the trading industry which corresponds to 15.7% year-on-year increase. As
18

illustrated in figure 9, the share of loans channelled to the trading industry reduced in 2004 to
75.3% while in 2003 they accounted for 86.7% of total loans.
Transportation andWarehousing
0.6%
Administration, OtherPublic Services
0.1%
Other2.3%
Trade and catering86.7%
Manufacturing8.8%
Agriculture2.1%
Construction0.9%
Civil Engineering0.8%
Figure 9. Structure of loans by industry, Dec. 2003, in % Dec. 2004, in %
Administration, OtherPublic Services
1.1%
Transportation andWarehousing
1.0%
Other7.4%
Trade and catering75.3%
Civil Engineering9.0%
Manufacturing8.4%
Agriculture3.6%
Construction1.8%
Additionally, significant increase is recorded for by the loans granted to civil engineering (25.6
EUR million by end-2004), increasing their share to total loans to 9.0%, an increase of 8.2
percentage points compared with 2003. The share of loans to manufacturing industry (23.8
EUR million as of end 2004) in total loans remained stable around 8.4%, while agriculture,
with outstanding loans of 10.1 EUR million, increased their share with 1.5 percentage points to
3.6%. The loans to administration and public services increased in 2004 their share in total
loans to 1.1%, against 0.1% in 2003.
0%
10%
20%
30%
40%
50%
60%
70%
80%
90%
100%
2001 2002 2003 2004-
50,000
100,000
150,000
200,000
250,000
300,000
350,000
400,000
Up to 1 year Over 1 Year Total loans in '000 EUR (Right axis)
Figure 10. Structure of Loans by maturity
As illustrated in figure 10, the term structure of loans has also experienced changes during the
course of 2004. In 2004, loans with maturities of over one year amounted to 204.6 EUR million
in 2004 which corresponds to the increase of 110.7 % compared with 2003. Owing to this
significant increase in volume, loans with maturities of over one year experienced an increase
in their share to total loans as well, reaching 54.7% in 2004.
19
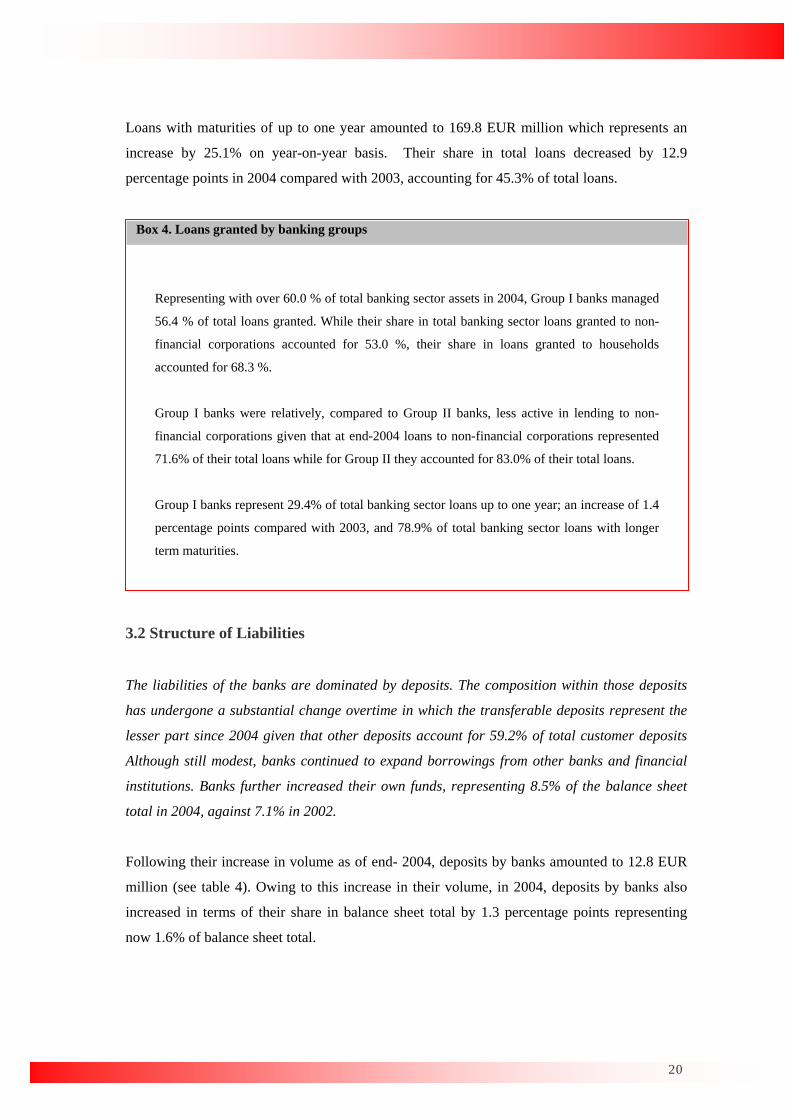
Loans with maturities of up to one year amounted to 169.8 EUR million which represents an
increase by 25.1% on year-on-year basis. Their share in total loans decreased by 12.9
percentage points in 2004 compared with 2003, accounting for 45.3% of total loans.
Box 4. Loans granted by banking groups
Representing with over 60.0 % of total banking sector assets in 2004, Group I banks managed
56.4 % of total loans granted. While their share in total banking sector loans granted to non-
financial corporations accounted for 53.0 %, their share in loans granted to households
accounted for 68.3 %.
Group I banks were relatively, compared to Group II banks, less active in lending to non-
financial corporations given that at end-2004 loans to non-financial corporations represented
71.6% of their total loans while for Group II they accounted for 83.0% of their total loans.
Group I banks represent 29.4% of total banking sector loans up to one year; an increase of 1.4
percentage points compared with 2003, and 78.9% of total banking sector loans with longer
term maturities.
3.2 Structure of Liabilities
The liabilities of the banks are dominated by deposits. The composition within those deposits
has undergone a substantial change overtime in which the transferable deposits represent the
lesser part since 2004 given that other deposits account for 59.2% of total customer deposits
Although still modest, banks continued to expand borrowings from other banks and financial
institutions. Banks further increased their own funds, representing 8.5% of the balance sheet
total in 2004, against 7.1% in 2002.
Following their increase in volume as of end- 2004, deposits by banks amounted to 12.8 EUR
million (see table 4). Owing to this increase in their volume, in 2004, deposits by banks also
increased in terms of their share in balance sheet total by 1.3 percentage points representing
now 1.6% of balance sheet total.
20

The increased share of deposits by banks was partly compensated by lower customer deposits
whose share to balance sheet total decreased by 2.4 percentage points and at end-2004
amounted to 685.7 EUR million.
Borrowings experienced a substantial increase in terms of their volume (60.3% by end 2004)
amounting 14.3 EUR million, which corresponds to 0.3 percentage points increase in their
share to balance sheet total .
Table 4. Structure of commercial banking sector liabilities, in EUR thousands and percentages
Amount Share in % Amount Share in % %∆ Amount Share in % %∆ Amount Share in % %∆
Deposits By banks and OFC - - 1,802 0.3 12,753 1.6 607.7
Customer deposits 492,257 94.8 427,194 90.7 -13.2 513,994 88.4 20.3 685,689 86.0 33.4
Transferable deposits in EUR 365,891 74.3 295,909 69.3 -19.1 290,453 56.5 -1.8 279,687 40.8 -3.7
Residents 353,584 96.6 281,380 95.1 -20.4 273,376 94.1 -2.8 269,580 96.4 -1.4
Non-financial corporations 137,089 38.8 159,882 56.8 16.6 138,969 50.8 -13.1 125,734 46.6 -9.5
Households 216,495 61.2 121,498 43.2 -43.9 134,407 49.2 10.6 143,846 53.4 7.0
Nonresidents 12,307 3.4 14,529 4.9 18.1 17,077 5.9 17.5 10,107 3.6 -40.8
Other deposits in EUR 126,366 25.7 131,285 30.7 3.9 223,541 43.5 70.3 406,002 59.2 81.6
Residents 124,789 98.8 128,280 97.7 2.8 220,605 98.7 72.0 403,443 99.4 82.9
Non-financial corporations 31,318 25.1 23,921 18.6 -23.6 87,131 39.5 264.2 185,610 46.0 113.0
Households 93,471 74.9 104,359 81.4 11.6 133,474 60.5 27.9 217,833 54.0 63.2
Nonresidents 1,577 1.2 3,005 2.3 90.6 2,936 1.3 -2.3 2,559 0.6 0.0
Borrowings 5,045 1.0 5,418 1.1 7.4 8,893 1.5 64.1 14,253 1.8 60.3
Interest Payable and other liabilities 1,249 0.2 4,046 0.9 223.9 9,742 1.7 140.8 9,253 1.2 -5.0
Subordinated debts - - 1,291 0.3 2,045 0.4 58.4 7,045 0.9 244.5
Total Liabilities 498,551 96.1 437,949 92.9 -12.2 536,476 92.3 22.5 728,993 91.5 35.9
Shareholder's Equity 20,435 3.9 33,244 7.1 62.7 45,007 7.7 35.4 68,074 8.5 51.3
Total liabilities and shareholders' equity 518,986 100 471,193 100 -9.2 581,483 100 23.4 797,067 100 37.1
Description Dec. 2003 Dec. 2004Dec. 2001 Dec. 2002
Additionally, the share of subordinated debt to balance sheet total remained stable around
0.9%, amounting 9.3 EUR million. Shareholders equity, as a decisive component of own funds,
recorded a significant increase in their volume in 2004, attaining 68.1 EUR million which
represents 51.3% increase compared with 2003. Their share in balance sheet total reached 8.6
% in 2004 from 7.7% in 2003.
21

Box 5. Main categories of liabilities by banking groups
Share of Group I in total banking sector in 2004 and change in percentage points against 2003.
63.0% of total deposits (-3.4 percentage points)
49.1% of Shareholders’ equity (+5.1 percentage points)
The customer deposits, representing the bulk of total deposits in the market, of Group I to
their balance sheet total decreased, accounting for 87.7% in 2004 against 92.3% in 2003. On
the contrary, the share of customer deposits of Group II in total Group II balance sheet total
experienced a slight increase and at end-2004 accounted for 83.3% of total Group II assets.
The share of Group I shareholders’ equity to total Group I balance sheet reached 6.8% as of
end-2004, whereas Group II banks shareholders’ equity accounted for 11.5% of Group II
balance sheet total.
3.2.1 Deposits of Commercial Banking Sector
Customer deposits retain their position representing a decisive component of commercial
banks’ external funds. The largest share of customer deposits as of end 2004 consisted of
deposits received by households which grew with 35.5% in 2004. Term and savings deposits
represented the largest share of total customer deposits for the first time in 2004 following
their increase of 62.8%.
In 2004, total banking sector deposits accounted for 36.5% of GDP which represented an
increase of 7.9 percentage points compared with 2003. As of end 2004, the volume of total
banking sector deposits attained 685.7 EUR million corresponding to the 34.7% increase
compared with 2003.
As for the maturity structure of deposits, other deposits (time and savings) represent the most
important component of total deposits. In 2004, as figure 11 shows, the volume of other
deposits amounted to 366.9 EUR million representing an increase by 62.8% compared with
2003. As a result of this increase, other deposits increased as a share in total deposits as well
22

which by the end of 2004 accounted for 52.8% of total deposits corresponding to 8.9
percentage points increase compared with 2003.
0%
10%
20%
30%
40%
50%
60%
70%
80%
90%
100%
2001 2002 2003 2004-
100,000
200,000
300,000
400,000
500,000
600,000
700,000
800,000
Other Depsits Transferable deposits Total deposits in '000 EUR (right axis)
0%
10%
20%
30%
40%
50%
60%
70%
80%
90%
100%
2002 2003 2004-
100,000
200,000
300,000
400,000
500,000
600,000
700,000
800,000
Households Non-financial corporations Total deposits in '000 EUR (right axis)
Figure 11. Maturity structure of deposits Depositor structure of deposits
As of end 2004, the volume of transferable deposits attained 327.9 EUR million or 13.9%
increase compared with 2003. Their share in total deposits saw a slight decline which at end-
2004 accounted for 47.2% of total deposits.
With respect to the structure of deposits by type of depositor, the largest share is registered to
households’ deposits. Specifically, as of end 2004, the volume of households deposits was
370.9 EUR million which compared with 2003 represented an increase of 35.5%. 53.4 % of
total banking sector deposits in 2004 correspond to the deposits of households.
The volume of non-financial corporations’ deposits in 2004 attained 323.9 EUR million or up
by 35.3% compared with 2003. However, their share in total banking sector deposits did not
experience significant change in 2004 compared with 2003 and remained at 46.6% of total
deposits.
23

Box 6. Deposit structure by banking groups
Share of Group I in total banking sector in 2004 and change in percentage points against 2003:
70.5% of Transferable deposits (-2.3 percentage points)
56.4% of other deposits (-1.8 percentage points)
69.9% of deposits held by households
55.2% of deposits held by non-financial corporations (-7.2 percentage points)
By nature of deposit
The share of transferable deposits with Group I in total Group I deposits experienced a decline by 8.7
percentage points, though they accounted for a largest share (52.8%) in total Group I deposits.
Accounting for 37.7% of total deposits of Group II, the share of Group II transferable deposits
declined from 45.4% in 2003 to 37.7% in 2004.
In 2004, other deposits of Group I banks accounted for 47.2% of total Group I deposits and this
corresponds to 8.7 percentage points increase compared with 2003. Even though other deposits
account for a smaller proportion of total deposits of Group I, the data reveal that their share is
continuously increasing with a concurrent fall of the share of transferable deposits in total Group I
deposits. On the contrary, the share of other deposits of Group II in total Group II deposits accounted
62.3% in 2004, which represents an increase by 7.7 percentage points compared with 2003.
By nature of client
In 2004 Group I banks represented 69.9% of total banking sector households’ deposits showing minor
changes in their share compared with 2003. On the other hand, the share of households deposits of
Group I in total Group I deposits increased by 3.1 percentage points in 2004 compared with 2003 and
accounted for 59.2%. On the contrary, the share of households’ deposits of Group II banks in total
Group II deposits decreased slightly from 47.8% in 2003 to 43.5% in 2004.
Furthermore, from the total deposits received by banks in Group I, 40.8% correspond to deposits of
non-financial corporations which compared with 2003 fell by 3.1 percentage points. In contrast, as of
end-2004 total deposits of Group II banks were dominated by deposits of non-financial corporations
which compared with 2003 rose by 4.3 percentage points and accounted for 56.5% of total Group II
deposits.
24
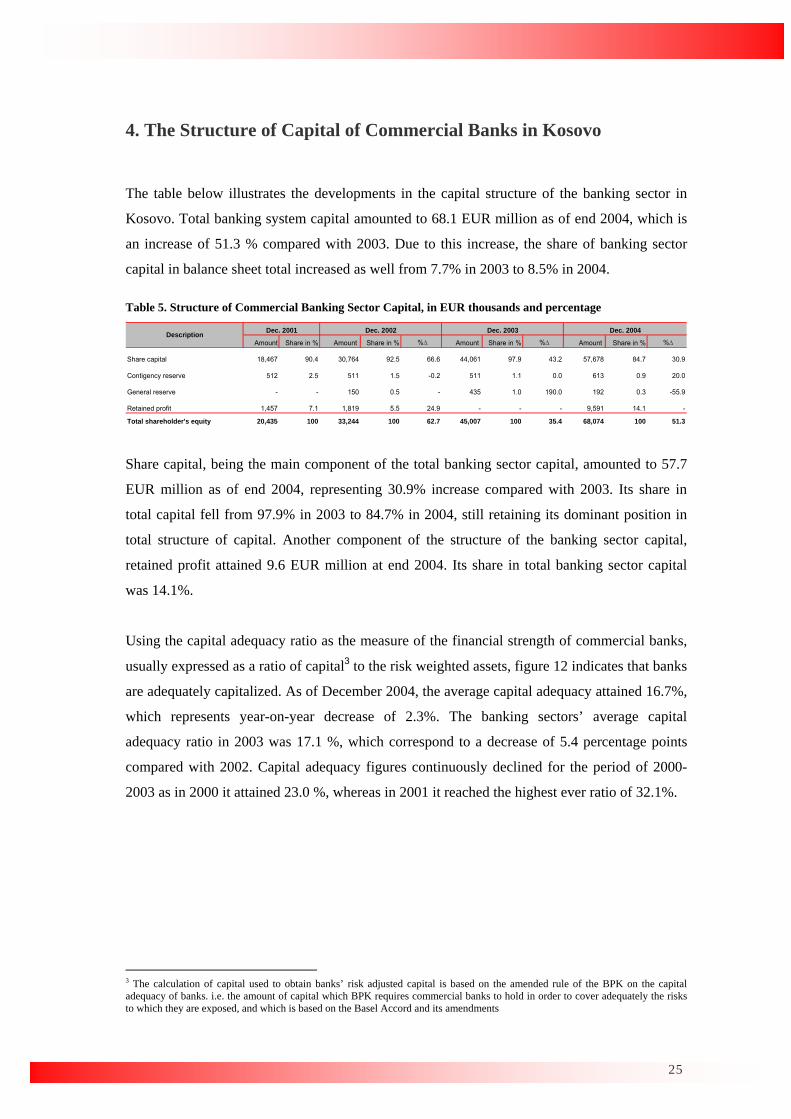
4. The Structure of Capital of Commercial Banks in Kosovo The table below illustrates the developments in the capital structure of the banking sector in
Kosovo. Total banking system capital amounted to 68.1 EUR million as of end 2004, which is
an increase of 51.3 % compared with 2003. Due to this increase, the share of banking sector
capital in balance sheet total increased as well from 7.7% in 2003 to 8.5% in 2004.
Table 5. Structure of Commercial Banking Sector Capital, in EUR thousands and percentage
Amount Share in % Amount Share in % %∆ Amount Share in % %∆ Amount Share in % %∆
Share capital 18,467 90.4 30,764 92.5 66.6 44,061 97.9 43.2 57,678 84.7 30.9
Contigency reserve 512 2.5 511 1.5 -0.2 511 1.1 0.0 613 0.9 20.0
General reserve - - 150 0.5 - 435 1.0 190.0 192 0.3 -55.9
Retained profit 1,457 7.1 1,819 5.5 24.9 - - - 9,591 14.1 -
Total shareholder's equity 20,435 100 33,244 100 62.7 45,007 100 35.4 68,074 100 51.3
Description Dec. 2004Dec. 2001 Dec. 2002 Dec. 2003
Share capital, being the main component of the total banking sector capital, amounted to 57.7
EUR million as of end 2004, representing 30.9% increase compared with 2003. Its share in
total capital fell from 97.9% in 2003 to 84.7% in 2004, still retaining its dominant position in
total structure of capital. Another component of the structure of the banking sector capital,
retained profit attained 9.6 EUR million at end 2004. Its share in total banking sector capital
was 14.1%.
Using the capital adequacy ratio as the measure of the financial strength of commercial banks,
usually expressed as a ratio of capital3 to the risk weighted assets, figure 12 indicates that banks
are adequately capitalized. As of December 2004, the average capital adequacy attained 16.7%,
which represents year-on-year decrease of 2.3%. The banking sectors’ average capital
adequacy ratio in 2003 was 17.1 %, which correspond to a decrease of 5.4 percentage points
compared with 2002. Capital adequacy figures continuously declined for the period of 2000-
2003 as in 2000 it attained 23.0 %, whereas in 2001 it reached the highest ever ratio of 32.1%.
3 The calculation of capital used to obtain banks’ risk adjusted capital is based on the amended rule of the BPK on the capital adequacy of banks. i.e. the amount of capital which BPK requires commercial banks to hold in order to cover adequately the risks to which they are exposed, and which is based on the Basel Accord and its amendments
25

10
15
20
25
30
35
40
2001 2002 2003 2004
Capita to risk weighted assets%
Figure 12. Capital adequacy ratio
The capital adequacy ratio of the banking sector as a whole has deteriorated somewhat during
2004. The growing share of loans granted to the private sector in the banking loan portfolio
contributed to the faster growth of risk weighted assets relative to the rate of regulatory capital
growth. However, all banks in the banking sector of Kosovo managed to maintain their capital
adequacy ratio above the requirement of minimum 8%.
Share of Group I in total banking sector in 2004 and change in percentage points against 2003
49.1% of Shareholders’ equity (+5.0 percentage points)
48.2% of Share capital (-3.5 percentage points)
53.1% of Retained profit
The share of capital of Group I in Group I banks’ balance sheet total increased by 1.4 percentage
points and stood at 6.8%. On the contrary, the share of capital of Group II in balance sheet total
of Group II experienced a slight decline and reached 11.5%.
Share capital of Group I represented in 2004 83.2% (+ 22.0% compared with 2003) of total Group
I capital whereas the share of Group II share capital in total Group II capital stood at 86.2% in
2004, against 84.5% in 2003.
Group I banks’ retained profit accounted for 15.2% of total Group I capital structure , an increase
of 32.8 percentage points against 2003 whereas Group II experienced a slight decrease in the
retained profit as a share to total Group II capital by 0.8 percentage points accounting for 13.0%.
Box 7. Structure of capital by banking groups
26

5. Financial Performance of Commercial Banks in Kosovo
5.1 Structure of Income and Expenditure Statement As of end 2004, banking sector in Kosovo has shown a favourable picture of its financial
performance. Financial results have improved repeatedly during 2001-2004 period despite the
increased competition due to expanding business activities of banks, regulatory requirements
for the proper provisioning against loan losses as well as the increase in the minimum capital
requirements by the BPK. Commercial banks ended their financial year with 13.0 EUR million
net profits mainly on account of the increase in net interest income which grew by 73.2% in
2004.
5.1.1 Main Components
Owing to the significant increase of net interest income, the after tax profit of the banking
system for 2004 stood at 13.0 EUR million, which represents 90.5% increase compared to the
preceding year. On the other hand, as table 6 indicates, the before tax profit for the banking
sector attained 15.1 EUR million as of end 2004 corresponding to 72.8% increase compared
with 2003.
Table 6. Structure of Commercial Banking Sector Income Statement, in EUR thousands and percentage
2001
Amount Amount %∆ Amount %∆ Amount %∆
Net Interest Income 5,867 14,348 144.6 25,416 77.1 44,021 73.2
Interest income 7,179 17,818 148.2 30,695 72.3 53,999 75.9
Interest expenditures 1,312 3,470 164.4 5,279 52.1 9,978 89.0
Net non-interest income 7,895 8,242 4.4 7,761 -5.8 4,510 -41.9
Non-Interest income 9,402 14,034 49.3 17,984 28.1 19,449 8.1
Non-Interest expenditures 1,507 5,792 284.4 10,223 76.5 14,939 46.1
General and administrative expenses 7,271 19,130 163.1 25,379 32.7 33,952 33.8
Net operating income 6,491 3,460 -46.7 7,798 125.4 14,579 87.0
Net gains/losses from dealing securities - - - 342 - -441 -228.9
Net gains/losses from dealing in foreign exchange 699 509 -27.2 658 29.3 328 -50.2
Net gains losses from foreign currency revaluations -19 53 -380.2 -85 -260.4 593 -797.6
Net operating income before taxes 7,172 4,022 -43.9 8,713 116.6 15,059 72.8
Provision for taxes 456 1,306 186.7 1,912 46.4 2,104 10.0
Net profit/Loss for the period 6,716 6,186 -7.9 6,801 9.9 12,955 90.5
Retained profit 1,457 4,068 179.3 6,801 67.2 12,955 90.5
2003 2004Description
2002
With respect to main components of the structure of income statement, significant changes
were recorded for the period under review, with interest revenues recording the largest
27

influence on the banking system profit. Thus, net interest income increased by 73.2 %
compared with 2003 and amounted to 44.0 EUR million. Meanwhile, as evidenced by table 6,
net non-interest income has experienced a fall by 41.9% and as a result, in 2004 they amounted
to 4.5 EUR million.
General and administrative expenses increased by 33.8% in 2004 compared with 2003 and as a
result they attained 33.9EUR million. However, regarding their share in total expenses, in 2004
general and administrative expenses composed 57.7% of total expenses which corresponds to
4.4 percentage points decrease compared with 2003.
The volume of banks net income from other banking activities (net gain/losses from dealing
securities, net gain/losses from dealing in foreign exchange and, net gain/losses from foreign
currency revaluation) in 2004 amounted to 480,000 EUR, which represents 47.5% decrease
compared with 2003.
Structure of Income
From the interest income side, the volume of interest income from loans attained 48.1 EUR
million as of end 2004 which is 102.3% increase compared with 2003. Moreover, the share of
interest income from loans to total interest income increased as well, accounting for the largest
share (89.1 %) which corresponds to an increase by 11.6 percentage points compared with 2003
(see figure 13).
Income from placements with other banks decreased by 59.8% in 2004 compared with 2003
amounting to 2.5 EUR million. As a result, income from placements with other banks
accounted for mere 4.5 % of total interest income representing a decrease of 15.3 percentage
points compared with 2003.
Income from securities, mainly dominated by banks in Group I, amounted at end 2004 to 3.4
EUR million or 317.6 % increase compared with 2003. Following this significant increase in
their volume, income from securities increase in terms of its share to total interest income as
well and accounted for 6.4% in 2004.
The structure of non-interest income saw a moderate changes relative to the interest income
side, which in 2004 amounted to 19.4 EUR million or 8.1 % higher compared with 2003.
28

With respect to the structure of non-interest income, income from fees and commissions
increased by 4.6% in 2004 and as a result amounted to 17.5 EUR million. However, in terms of
their share to total non-interest income, income from fees and commissions experienced 3.0
percentage points decline compared with 2003 and accounted for 90.1 % of total non-interest
income.
0%
10%
20%
30%
40%
50%
60%
70%
80%
90%
100%
2001 2002 2003 2004-
10,000
20,000
30,000
40,000
50,000
60,000
70,000
80,000
Interest income Non-Interest income Total income, in EUR thousands (Interest income + Non-interest income)
Figure 13. Structure of Income
The volume of banking sector other operating income reached 1.9 EUR million as of end 2004,
registering an increase by 56.2% compared with 2003. Due to this significant increase in their
volume, banking sector other operating income also increased as a share in total non-interest
income by 3.0 percentage points and amounted to 9.9%.
Structure of Expenditures
With respect to the structure of expenditures, interest expenses in 2004 increased by 89.0%
compared with 2003 and amounted to 10.0 EUR million. Due to this considerable increase, the
share of interest expenses to total banking sector expenses increased as well from 12.9% in
2003 to 16.9% in 2004.
Significant part of interest expenses of total banking sector is composed by the interest
expenses on deposits which in 2004 attained 9.2 EUR million or 93.2% increase compared with
2003. Following this increase in volume, interest expenses on deposits increased as a share in
total interest expenses as well and accounted for 92.6%.
In respect to the interest expenses on borrowings, in 2004 they were characterized by an
increase of 49.1% and reached 0.7 EUR million. However, as a share in total interest expenses,
29

interest expenses on borrowing experienced a decline by 2.0 percentage points and accounted
for mere 7.4%.
0%
10%
20%
30%
40%
50%
60%
70%
80%
90%
100%
2001 2002 2003 2004-
10,000
20,000
30,000
40,000
50,000
60,000
70,000
Interest expenses Non-Interest expenses
General and administrative expenses Total expenses in '000 EUR (right axis)
Figure 14. Structure of Expenses
As regards the non-interest expenses, figure 14 reveals that they experienced an increase by
46.1% in 2004 and attained 14.9 EUR million. As a share in total expenses, non-interest
expenses experienced a slight increase and accounted for 25.4% of total expenditures.
Provisions for loans losses were characterized by an increase of 43.4% in 2004 and amounted
to 11.1 EUR million. However, this increase in volume was not reflected in their share to total
non-interest expenses as in 2004 the share of provisions for loans losses decreased by 1.4
percentage points and accounted 74.1%.
15
20
25
30
35
40
2002 2003 2004-
10,000
20,000
30,000
40,000
50,000
60,000
70,000
80,000Gross income (interest income+ non-interest income)
Overhead cost Ratio (left axis)
%
Figure 15. Overhead cost to gross income
It is important to point out that general and administrative expenses made up the largest part
of total expenses in 2004. Figure 15 illustrates the ratio between overhead expenses and gross
income (interest income + non-interest income), an indicator of efficiency of banking sector. It
30

shows that the ratio is continuously declining, partly as a result of the significant increase in
total income (+50.9% compared with 2003) and a slight increase in the overhead expenses
(+9.3% compared with 2003). Thus, the ratio reached 19.5% in 2004 representing 7.4
percentage points decrease compared with 2003.
5.2 Profitability and Efficiency The positive trends of the profitability of banking sector, which began to appear in 2003,
continued in 2004. An indicator measuring how efficiently the assets of the banking sector are
used, the return4 on average assets (ROAA), reached by the end-2004 2.1 % an improvement of
0.8 percentage points compared with 2003 (see figure 16). The fall in ROAA of total banking
sector is registered in 2002 (9.7%), which is due to a fall of ROAA of Group I banks.
0.0
0.5
1.0
1.5
2.0
2.5
3.0
3.5
2001 2002 2003 2004
Gorup I Group II Total banking sector%
Figure 16. Return on average assets (ROAA) , expressed in %
Nevertheless, the largest contribution to the increase in the return on average assets in 2004 is
accounted for by the Group I banks, the ROAA of which grew by 1.2 percentage points
compared with the end 2003 and reached 2.1%. Banks in Group II experienced a modest
decline in their ROAA, which in 2004 fell to 1.9% from 2.1% in 2003 and as a result the total
banking sector ROAA increased from 1.3% in 2003 to 2.1% in 2004.
As illustrated in figure 17, the rate of return on average equity at end-2004 was 24.6%, which
corresponds to 5.8 percentage points increase compared with end-2003. Due to a considerable
increase of net profit after tax and a concurrent moderate increase in the equity, the banking
sector ROAE in 2003 reached 18.8% whereas in 2002 it stood at 9.7%.
4 Measured by the net profit after tax
31

0
10
20
30
40
50
60
70
2001 2002 2003 2004
Gorup I Group II Total banking sector%
Figure 17. Return on average equity (ROAE), expressed in %
The largest rate of return on average equity in 2004 is registered for by Group I banks which
increased to 33.4% from 15.9% in 2003. Group II banks have recorded a negligible downturn
in their ROAE during 2004. This was mainly due to the steady growth in the average equity
against a concurrent fall in their net profit after tax. Thus, in 2004 Group II banks had the
average rate of return on equity of 16.4 % while in 2003 it reached 22.1%.
0.0
1.0
2.0
3.0
4.0
5.0
6.0
7.0
8.0
2001 2002 2003 2004
Group I Group II Total banking sector%
Figure 18. Net Interest margin, expressed in %
In respect to the net interest margin (NIM), banks in Kosovo have improved their position in
2004. The net interest margin for the total banking sector in 2004 was 5.5% which corresponds
to 1.2 percentage points increase compared with 2003. A continuous rise in interest margin of
the total banking sector, during the observed period, has contributed significantly to the
banking sector profitability.
As figure 18 depicts, the ratio of net interest margin has experienced an increase for both
banking Groups and at end 2004 it amounted 5.5% for both groups. However, the value of the
32

ratio in 2004 corresponds to a 1.5 percentage points increase compared with 2003 for banks in
Group I whereas the ratio for Group II banks rose by mere 0.4 percentage points.
5.3 Liquidity
According to the liquidity ratios, banking system liquidity risk might be judged as increasing,
due to the increase in the loan-to-deposit and the accompanying concurrent fall in the ratio of
liquid assets.
The ratio of liquid assets (which comprise cash, balances with BPK, accounts with other banks,
placements abroad and security investments) to total assets for the entire banking sector also
experienced a substantial decrease during the 2001-2004 period. As of end 2004, the fall by 9.1
% in the liquid assets ratio was driven by the faster increase in total assets as compared to the
increase in the liquid assets. As a result, in 2004 the ratio declined to 51.9 % from 57.1 % in the
preceding year.
0
10
20
30
40
50
60
70
80
90
100
2001 2002 2003 2004
Group I Group II Total banking sector%
Figure 19. Liquid assets to total assets, expressed in %
With respect to the defined group of banks, the downward trend in the ratio of liquid assets to
total assets was experienced by Group I banks, the ratio of which dropped from 65.7 % in 2003
to 56.0 % in 2004. Liquid assets of Group I increased by 13.6 % in 2004 against a decline of
19.3% in 2003, while total assets increased by 33.4 % in 2004, following an upsurge of 7.7 %
in 2003.
Quite the reverse, Group II banks had to cope with an increase in the ratio by 3.4 percentage
points, which during 2004 reached 45.3 %, due mainly to the increase of 55.3 % of liquid assets
and 43.6 % of total assets in 2004 compared with 2003.
33

0%
10%
20%
30%
40%
50%
60%
70%
80%
90%
100%
2001 2002 2003 20040
100,000
200,000
300,000
400,000
500,000
600,000
700,000
800,000
900,000
Cash Balance with BPK
Placements Investments in securities
Total assets in '000 EUR (right axis)
Figure 20. Structure of liquid assets of total banking sector
Compared with 2003, the overall volume of liquid assets increased by 24.7 % in 2004 due
mainly to the 55.3% increase in the liquid assets of banks in Group II. Regarding the
composition within liquidity, investment in securities increased substantially in 2003 which
was mainly at the expense of the decrease in placements abroad. However, in 2004, placements
abroad turned up again at the expense of investments in securities and hence the largest share of
liquid assets is accounted for by the placements abroad and investments in securities and, to a
lesser extent to cash and deposits in the BPK (including mandatory reserves).
0
10
20
30
40
50
60
70
80
90
2001 2002 2003 2004
Group I Group II Total banking sector%
Figure 21. Loan to deposit ratio, expressed in %
As indicated in figure 19, banking sectors’ loan-to-deposit ratio increased to 50.5% in 2004
from 33.7% in 2003. The increase in the ratio of the total banking system was mainly attributed
to the fast increase in loans and the accompanying moderate increase in deposits. In particular,
loans increased by 106.7% in 2004 compared with 2003, whereas deposits grew at a rate of
34.9%.
34

With respect to the defined group of banks, banks in Group II had the highest loan-to-deposit
ratio which in 2004 reached 63.2%. Nevertheless, Group II banks have seen improvement in
their liquidity position during 2004 given that their loan-to-deposit ratio decreased by 14.0
percentage points compared with 2003 which was mainly on account of the faster rate of
growth of received deposits compared with the rate of lending growth. By contrast, Group I
banks experienced a continuous increase in the loan-to-deposit ratio. As of end 2004, the loan-
to-deposit ratio of Group I reached to 48.0% or 12.5 percentage points increase compared with
2003.
35

Notes on methodology
Figure 1. Number of banks
According to the ownership structure, commercial banks in Kosovo are classified into two
groups: foreign owned and domestic owned, and thus named as Group I, and II respectively.
Group I comprises banks which have more than 50.0 % of foreign ownership whereas Group II
comprises those banks which are in majority domestic ownership. The figure shows the number
of banks during the period 2000-2004, which also captures the ownership structure. The data on
the number of banks in Kosovo are obtained by the BPK statistics.
Table 1. Commercial banking sector structure by total assets
The table shows the comparison between groups of banks with respect to their size of assets
which also captures the ownership structure of the banking sector in Kosovo. It includes the
amounts and the percentages share to total assets by banking groups whereas the schedule BS is
the source of data on the amounts of assets (Statistical Bank Report, BPK Form No. 11)
Figure 2. Geographical distribution of banking units
The figure illustrates the concentration of branches and sub-branches by regions. The triangles
positioned along the regions of Kosovo represent the concentration, with the largest triangle
representing the largest concentration of banking units of the particular region relative to other
regions. The largest triangle is taken as a benchmark for comparing the remaining
concentrations throughout Kosovo. In this case, Pristina region represents the largest
concentration and hence it is labelled by the largest triangle whereas Mitrovica is three times
less concentrated by the number of banking units therefore it is denoted by the triangle that is
three times smaller.
Figure 3. Percentage change in the number of banking units
The figure depicts the percentage change in the number of banking units throughout Kosovo in
2004 compared with 2003, which is presented by the size of cycles. The largest cycle stands for
the largest percentage change of the banking units in the particular region relative to the
36

preceding year. In this case, the largest cycle positioned in the Prizren region denotes the
largest relative change whereas the Gjilan has recorded three times lower percentage change in
the number of banking units compared with Pristina and hence it is represented by the three
times smaller cycle. Regions that recorded no change are not denoted by a cycle.
Figure 4. Number of banking units and ATM's by Bank Groups
The figure illustrates the number of banking units for the particular banking group as well as
the number of total ATM's installed by the banking group during the course of 2004.
Table 2. Employees and banking units in the commercial banking sector
According to the number of banking units of total banking system the labour productivity was
measured on the year-on-year basis. Moreover, the number of employees per branch was also a
good indicator for measuring the developments of the productivity of labour. The number of
employees per banking unit was calculated as the ratio between the number of employees for
the total banking sector and the total number of banking units for the total banking sector. The
ratio of total assets managed by the banking unit and by an employee is calculated in the same
manner. The ratio between the number of citizens5 and the number of banking units and/or
number of employees is calculated to capture the “bankarisation” degree in Kosovo. Total
banking sector loans per employee/banking unit and deposits per employee/banking unit is
measured as the ratio between total banking sector loans (deposits) and total number of
employees/banking units.
The schedule BS (Balance Sheet) is the source for data on the amount of assets, loans, and
deposits whereas BPK is the source of data on the number of banking units and the number of
employees.
Figure 5. Indicators of productivity per employee by banking group
In order to capture the labour productivity for the particular banking group, the ratios of assets,
loans, and deposits per employee are calculated. The calculations were made in the similar way
as for the total banking sector but the figures are divided by banking groups.
5 The data for the number of citizens is taken from the IMF staff estimates- mission in 2004
37

Figure 6. Herfindahl-Hirschman Index (HHI) (All banks)
The concentration of assets, loans and deposits for the each bank is calculated using the
formula of HHI.
This formula is calculated as follows: 2
100),(sec
),(⎟⎟⎠
⎞⎜⎜⎝
⎛⋅
loansdepositsassetstorbankingTotalloansdepositsAssets
Schedule BS is the source for the data on the amounts of assets, deposits, and loans (Statistical
Bank Report, BPK Forms No. 11).
Figure 7. Share of three largest banks' Assets (deposits, loans) to total assets
(deposits, loans)
The criterion of banks asset size was used for selecting of three largest banks in the banking
sector in Kosovo. Accordingly, the share of the three largest banks assets to total assets was
calculated as a ratio between the sum of assets of the three largest banks and the total banking
sector assets. The same was applied for calculating the share of the three largest banks to total
deposits and total loans. The schedule BS is the source of data on the assets, deposits and loans
(Statistical Bank Report, BPK Forms No. 11).
Table 3. Structure of assets of commercial banking sector in Kosovo
The table presents each category of assets in volume and their share in total assets for
the particular period. In addition, the change for each item in the year-on-year basis is
calculated, showing the percentage change of the item relative to the balance reported
in the preceding year. Schedule BS is the source for the data on the amount of assets for
the banking sector in Kosovo.
Figure 8. Structure of loans by institutional sectors
The sectoral diversification of the loan exposure is presented by the type of beneficiaries. First,
the share of loans for each category in total banking sector loans is calculated and presented by
bars in the figure. Than, total loans for each sector are added up and presented with a line
38

which corresponds to the right axis of the figure. The schedule BS/LBM is the source of loans
by institutional sectors.
Figure 9. Structure of loans by industry
The table shows the industrial diversification of loan exposure during the course of 2003 and
2004. Total loans extended by industrial sector of each bank are added up and then the share of
loans extended to each industry in total loans extended is calculated for each year. Schedule
BS/LBI (Loans By Industry) is the source of data for the amounts of loans extended.
Figure 10. Structure of loans by maturity
The maturity structure of loans is reported for the period 2001-2004 for the total banking sector
in Kosovo. Loans are split up by their maturity and presented by bars which represents their
shares in total loans, whereas the line corresponds to the total banking sector loans presented in
volume. Schedule BS/LBM (Loans By Maturity) is the source of data for the maturity structure
of loans.
Table 4. Structure of commercial banking sector liabilities
The calculation of commercial banking sectors' liabilities is made in the same manner as the
calculation of assets. First, each category of the liability side of balance sheet is stated in
volume. Second, for each category of balance sheet the share in balance sheet total is stated in
the second column of the corresponding year. Finally, the change in balance sheet categories
indicates their percentage change relative to their balance recorded in the preceding year.
Schedule BS is the source of data on the amount of the liability side of total banking sector
balance sheet.
Figure 11. Structure of deposits
The structure of deposits by testimony date and by depositors is computed in the following
manner. First the breakdown of deposits with respect to their maturity is made into the
transferable and other (term and savings) which are then presented by bars as a share to total
deposits. The line corresponds to the total deposits stated in volume. The right panel of figure
shows the breakdown of deposits by the type of depositor into the non-financial corporations
39

and households which are stated as the share in total deposits. Total deposits are presented with
line which corresponds to the right axis. The schedule BS/DBM (Deposits By Maturity) is the
source for the amount of data on deposits.
Table 5. Structure of commercial banking sector capital
The table illustrates the detailed developments of the banking sector capital structure. The share
of main components of capital in the total banking system capital is expressed as the ratio
between each capital component and total banking sector capital and thus multiplied by 100.
The change in capital depicts the percentage change compared with the capital items recorded
in the previous year. Schedule BS is the source for the data on the banking system capital.
Figure 12. Capital adequacy ratio
Capital adequacy ratio is calculated in accordance with the rule on Capital Adequacy of Banks.
The figure illustrates the ratio between the consolidated total capital and the risk-weighted
assets and then multiplied by 100. This calculation is made by the supervision department of
the BPK based on the amended rule on capital adequacy.
Table 6. Structure of commercial banking sector income statement
For the four-year period, each category of the income statement is summed up for the total
banking sector. Additionally the change in the income statement is the percentage change for
the each item in comparison to the statement recorded in the preceding year. Schedule IS
(Income Statement) is the source of the data on the amounts of income statement items for the
banks.
Figure 13. Structure of Income The figure plots the structure of the particular component of income for the total banking
sector. It shows the amounts for the total income represented by the line and corresponds to the
right axis and the share of each component of the income structure to the total income
presented by bars. The Schedule IS is the source of data on the banks' income.
Figure 14. Structure of expenses
40

Same as in the previous figure, the structure of expenditures for the total banking sector is
plotted, with interest expenditures, non interest expenditures, and the general and
administrative expenses presented by bars. The bars in the figure show the share of each
expenditure component while the line presents total expenditures stated in volume. Schedule IS
is the source of data on the expenses of banking sector.
Figure 15. Overhead cost to gross income
The amounts of income and the overhead expenses of total banking sector are presented by bars
and stated in volume corresponding to the right axis. The ratio between overhead cost and the
gross income is then plotted by line and stated in percentage (left axis). Schedule IS is the
source of data on the amounts of overhead cost and gross income.
Figure 16. Return on average assets
The ratio between the after-tax profit and the average assets is calculated for each group of
banks as follows. First, the after tax profit for each bank recorded for the particular period is
added up for all banks in the group of banks. Than the banks’ assets are added up for each
group. Than the amounts thus calculated are divided and multiplied by 100. The same applies
for the total banking sector.
The average assets are calculated as the sum of the monthly averaged assets for each bank for
the particular period.
Schedule IS is the source of data for the profit after tax whereas BS is the source for the amount
of assets for the banking sector.
Figure 17. Return on average equity
The ratio between after tax profit and average equity for each group of banks is calculated as
follows. First, the after tax profit for the particular period is added up for each defined group of
banks. Than the average equity is calculated and added up for each group. The summed
amounts are thus divided and multiplied by 100.
The average equity is expressed as arithmetic mean, which is calculated as the sum of the
monthly averaged equity for the particular year for each bank. Schedule IS is the source for
data on the banks' profits and schedule BS is the source for data on equity.
41

Figure 18. Net Interest Margin (NIM)
To analyse the profitability of defined group of banks as well as the total banking sector, the
ratio between banks’ interest margin and total assets is calculated. The interest margin is
measured using the following formula: (Interest Income – Interest Expense). This amount thus
is divided by total assets of a particular group and multiplied by 100. The schedule IS and BS is
the source of data for the interest income and interest expenses and for total assets.
Figure 19. Liquid assets to total assets
Each bank group ratio between liquid assets and total assets is calculated as follows. First liquid
assets of each bank are added up in the banks group. Second Total assets for each bank group
are added up. The sum of liquid assets of each bank group and total assets of each banks group
are expressed as a ratio and thus multiplied by 100.
Liquid assets are calculated as the sum of the cash, balances with BPK, accounts with other
banks, placements abroad and security investments.
Schedule BS is the source for data on liquid assets and for total assets for each bank and thus
bank group.
Figure 20. Structure of liquid assets
The figure plots the components of liquid assets as a share in total liquid assets for each year.
Total assets are presented by line which corresponds to the right axis (in volume).
Figure 21. Loan to deposit ratio
The ratio between loans granted and customer deposits received is calculated as
follows. First, total loans granted by each bank are added up for the particular group
and for the particular period. Second, the customer deposits received for each bank in
the bank group are added up for the specific period. The totals then are expressed as a
ratio and multiplied by 100. The ratio for the total banking sector is calculated in the
same manner. Schedule BS/LBM is the source for the data on loans granted whereas
schedule BS/DBM is the source for the data on deposits.
42

List of banks As of December 2004
RAIFFEISENBANK KOSOVO
Address: UÇK Street 51, Pristina
Phone: ++381 38/ 226 400, 401
Fax: ++38138/ 226 408
e-Mail: [email protected]
Internet: www.raiffeisen-kosovo.com
Balance sheet, as of December 2004, in EUR '000
14,933 Deposits by banks and OFI 1,545
31,777 Costumer deposits 127,725
- Total deposits 129,270
101,536 Borrowings -
3,841 3,128
97,695 Subordinated debts -
3,057 Total liabilities 132,398
2,753 Total shareholder's equity 17,817
150,215 TOTAL (liab. and shareholder's equity) 150,215
Cash and balances with BPK
Loans to financial instutitions(placement)
Ineterest payable and other liabilities
STRUCTURE OF ASSETS STRUCTURE OF LIABILITIES
Securities
Gross loans to non-financial institutions
Less: Provisions for loan losses
Net loans
Total Assets
Interest receivable and other assets
Property and equipment, net of deprecations
43

PROCREDIT BANK
Address: Skenderbeu Street, Pristina
Phone: ++381 38/ 240 248
Fax: ++38138/ 248 777
e-Mail: [email protected]
Internet: www.procreditbank-kos.com
Balance sheet, as of December 2004, in EUR '000
41,138 Deposits by banks and OFI -
114,250 Custumer deposits 311,156
Securities 74,638 Total deposits 311,156
109,771 Borrowings 9,318
2,567 1,218
Net loans 107,204 Subordinated debts 7,045
3,546 Total liabilities 328,737
3,548 Total shareholder's equity 15,587
344,324 Total (liab. and shareholder's equity) 344,324
STRUCTURE OF LIABILITIES
Ineterest payable and other liabilities
Property and equipment, net of deprecations
Interest receivable and other assets
Cash and Balance with BPK
Loans to financial instutitions(placement)
STRUCTURE OF ASSETS
Gross loans to non-financial institutions
Less: Provisions for loan losses
Total Assets
44

BANK FOR PRIVATE BUSINESS
Address: “Vellusha” street, no.6, Pristina
Phone: ++381 38/ 244 666
Fax: ++38138/ 243 656, 243 657
e-Mail: [email protected]
Internet: www.bpb-bank.com
Balance sheet, as of December 2004, in EUR '000
10,982 Deposits by banks and OFI -
14,022 Custumer deposits 46,938
Securities - Total deposits 46,938
30,805 Borrowings 1,399
2,072 301
Net loans 28,733 Subordinated debts -
1,209 Total liabilities 48,638
2,012 Total shareholder's equity 8,320
56,958 Total (liab. and shareholder's equity) 56,958
STRUCTURE OF LIABILITIES
Ineterest payable and other liabilities
STRUCTURE OF ASSETS
Gross loans to non-financial institutions
Less: Provisions for loan losses
Property and equipment, net of deprecations
Interest receivable and other assets
Total Assets
Cash and Balance with BPK
Loans to financial instutitions(placement)
45

CREDIT BANK OF PRISTINA
Address: Tirana Street Nr. 29, Pristina
Phone: ++381 38/249 851
Fax: N/A
e-Mail: N/A
Internet: N/A
Balance sheet, as of December 2004, in EUR '000
10,606 Deposits by banks and OFI 3,517
10,830 Custumer deposits 45,832
Securities - Total deposits 49,349
33,786 Borrowings -
917 1,930
Net loans 32,869 Subordinated debts -
1,331 Total liabilities 51,279
975 Total shareholder's equity 5,332
56,611 Total (liab. and shareholder's equity) 56,611
STRUCTURE OF LIABILITIES
Total Assets
Ineterest payable and other liabilities
STRUCTURE OF ASSETS
Cash and Balance with BPK
Loans to financial instutitions(placement)
Gross loans to non-financial institutions
Less: Provisions for loan losses
Property and equipment, net of deprecations
Interest receivable and other assets
46

NEW BANK OF KOSOVO
Address: Mother Teresa No. 54, Pristina
Phone: ++381 38/225 871 ; 223 976
Fax: N/A
e-Mail: N/A
Internet: www.brk-bank.com
0
Balance sheet, as of December 2004, in EUR '0015,843 Deposits by banks and OFI -
15,600 Costumer deposits 51,029
- Total deposits 51,029
26,607 Borrowings -
1,268 586
25,339 Subordinated debts -
766 Total liabilities 51,615
58 Total shareholder's equity 5,991
57,606 TOTAL (liab. and shareholder's equity) 57,606
STRUCTURE OF ASSETS STRUCTURE OF LIABILITIES
Interest receivable and other assets
Cash and balances with BPK
Loans to financial instutitions(placement)
Ineterest payable and other liabilities
Property and equipment, net of deprecations
Securities
Gross loans to non-financial institutions
Less: Provisions for loan losses
Net loans
Total Assets
47

KASA BANK
Address: Pal Palucaj No. 1, Pristina
Phone: ++381 38/543 688
Fax: N/A
e-Mail: N/A
Internet: www.kasabank.com
Balance sheet, as of December 2004, in EUR '000
14,336 Deposits by banks and OFI -
25,065 Custumer deposits 79,421
Securities - Total deposits 79,421
54,965 Borrowings 3,536
4,896 1,703
Net loans 50,069 Subordinated debts -
4,422 Total liabilities 84,660
174 Total shareholder's equity 9,406
94,066 Total (liab. and shareholder's equity) 94,066
Cash and Balance with BPK
Loans to financial instutitions(placement)
Less: Provisions for loan losses
Property and equipment, net of deprecations
Interest receivable and other assets
Ineterest payable and other liabilities
STRUCTURE OF LIABILITIES
Total Assets
STRUCTURE OF ASSETS
Gross loans to non-financial institutions
48

ECONOMIC BANK Address: UCK Street No. 5, Pristina
Phone: ++381 38/ 248 997
Fax: N/A
e-Mail: N/A
Internet: www.bankaekonomike.com
0
Balance sheet, as of December 2004, in EUR '008,455 Deposits by banks and OFI -
11,411 Custumer deposits 31,279
Securities - Total deposits 31,279
16,869 Borrowings -
386 387
Net loans 16,483 Subordinated debts -
720 Total liabilities 31,666
218 Total shareholder's equity 5,621
37,287 Total (liab. and shareholder's equity) 37,287
Property and equipment, net of deprecations
Ineterest payable and other liabilities
STRUCTURE OF LIABILITIES
Cash and Balance with BPK
Loans to financial instutitions(placement)
STRUCTURE OF ASSETS
Interest receivable and other assets
Total Assets
Gross loans to non-financial institutions
Less: Provisions for loan losses
49