01 BOARD OF DIR 020609 - ITCitcportal.com/about-itc/shareholder-value/annual-reports/itc... · ITC...
39
ITC Report and Accounts 2009 81 Schedules to the Accounts As at As at 31st March, 2009 31st March, 2008 (Rs. in Crores) (Rs. in Crores) 1. Capital Authorised 5,00,00,00,000 Ordinary Shares of Re. 1.00 each (2008 - 5,00,00,00,000 Ordinary Shares of Re. 1.00 each) 500.00 500.00 Issued & Subscribed 3,77,43,99,560 Ordinary Shares of Re. 1.00 each, fully paid (2008 - 3,76,86,10,050 Ordinary Shares of Re. 1.00 each, fully paid) 377.44 376.86 A) Of the above, following were allotted: a) as fully paid up Bonus Shares – 3,79,00,000 in 1978-79 by Capitalisation of Capital Reserve, Share Premium Reserve and General Reserve; 4,54,80,000 in 1980-81 by Capitalisation of Capital Reserve and General Reserve; 33,16,81,100 in 1989-90 by Capitalisation of Capital Reserve, Share Premium Reserve, Export Promotion Reserve and General Reserve; 39,80,17,320 in 1991-92 by Capitalisation of General Reserve; 1,21,31,81,770 in 1994-95 by Capitalisation of General Reserve; 1,25,17,12,290 in 2005-06 by Capitalisation of General Reserve. b) as fully paid up Shares – 10,59,50,750 in 1991-92 consequent to the amalgamation of erstwhile Tribeni Tissues Limited to the Shareholders of erstwhile Tribeni Tissues Limited. 2,09,69,820 in 2002-03 consequent to the amalgamation of erstwhile ITC Bhadrachalam Paperboards Limited to the Shareholders of erstwhile ITC Bhadrachalam Paperboards Limited. 1,21,27,470 in 2005-06 consequent to the amalgamation of erstwhile ITC Hotels Limited & Ansal Hotels Limited to the Shareholders of erstwhile ITC Hotels Limited & Ansal Hotels Limited. B) Under Employee Stock Option Schemes the Company has granted (net of Options lapsed*) : a) 10,78,605 (2008 - 10,91,728) Options in 2003-04 (including 1,83,501 Bonus Options allocated on unvested Options), of which 10,78,605 vested Options have been exercised. b) 10,88,158 (2008 - 10,88,158) Options in 2004-05 (including 2,85,987 Bonus Options allocated on unvested Options), of which 10,74,422 vested Options have been exercised. c) 13,77,495 (2008 - 13,80,055) Options in 2005-06 (including 4,75,638 Bonus Options allocated on unvested Options), of which 5,28,069 vested Options have been exercised. d) 52,31,345 (2008 - 54,01,893) Options in 2006-07, of which 16,543 vested Options have been exercised. e) 48,81,072 (2008 - 50,77,768) Options in 2007-08, of which 8,753 vested Options have been exercised. f) 54,97,232 Options in 2008-09, of which no Option has been exercised. Note: Each Option entitles the holder thereof to apply for and be allotted 10 Ordinary Shares of the face value of Re. 1.00 each. * Includes Options which were not exercised during the relevant Exercise Period. (Figures for the previous year have been rearranged to conform with the revised presentation)
Transcript of 01 BOARD OF DIR 020609 - ITCitcportal.com/about-itc/shareholder-value/annual-reports/itc... · ITC...

ITC Report and Accounts 2009 81
Schedules to the Accounts
As at As at31st March, 2009 31st March, 2008
(Rs. in Crores) (Rs. in Crores)
1. Capital
Authorised
5,00,00,00,000 Ordinary Shares of Re.1.00 each(2008 - 5,00,00,00,000 Ordinary Shares of Re.1.00 each) 500.00 500.00
Issued & Subscribed
3,77,43,99,560 Ordinary Shares of Re.1.00 each, fully paid(2008 - 3,76,86,10,050 Ordinary Shares of Re.1.00 each, fully paid) 377.44 376.86
A) Of the above, following were allotted:
a) as fully paid up Bonus Shares –
3,79,00,000 in 1978-79 by Capitalisation of Capital Reserve, Share Premium Reserve and General Reserve;
4,54,80,000 in 1980-81 by Capitalisation of Capital Reserve and General Reserve;
33,16,81,100 in 1989-90 by Capitalisation of Capital Reserve, Share Premium Reserve, Export Promotion Reserve and GeneralReserve;
39,80,17,320 in 1991-92 by Capitalisation of General Reserve;
1,21,31,81,770 in 1994-95 by Capitalisation of General Reserve;
1,25,17,12,290 in 2005-06 by Capitalisation of General Reserve.
b) as fully paid up Shares –
10,59,50,750 in 1991-92 consequent to the amalgamation of erstwhile Tribeni Tissues Limited to the Shareholders of erstwhileTribeni Tissues Limited.
2,09,69,820 in 2002-03 consequent to the amalgamation of erstwhile ITC Bhadrachalam Paperboards Limited to the Shareholdersof erstwhile ITC Bhadrachalam Paperboards Limited.
1,21,27,470 in 2005-06 consequent to the amalgamation of erstwhile ITC Hotels Limited & Ansal Hotels Limited to theShareholders of erstwhile ITC Hotels Limited & Ansal Hotels Limited.
B) Under Employee Stock Option Schemes the Company has granted (net of Options lapsed*) :
a) 10,78,605 (2008 - 10,91,728) Options in 2003-04 (including 1,83,501 Bonus Options allocated on unvested Options), of which10,78,605 vested Options have been exercised.
b) 10,88,158 (2008 - 10,88,158) Options in 2004-05 (including 2,85,987 Bonus Options allocated on unvested Options), of which10,74,422 vested Options have been exercised.
c) 13,77,495 (2008 - 13,80,055) Options in 2005-06 (including 4,75,638 Bonus Options allocated on unvested Options), of which5,28,069 vested Options have been exercised.
d) 52,31,345 (2008 - 54,01,893) Options in 2006-07, of which 16,543 vested Options have been exercised.
e) 48,81,072 (2008 - 50,77,768) Options in 2007-08, of which 8,753 vested Options have been exercised.
f) 54,97,232 Options in 2008-09, of which no Option has been exercised.
Note:
Each Option entitles the holder thereof to apply for and be allotted 10 Ordinary Shares of the face value of Re. 1.00 each.
* Includes Options which were not exercised during the relevant Exercise Period.
(Figures for the previous year have been rearrangedto conform with the revised presentation)
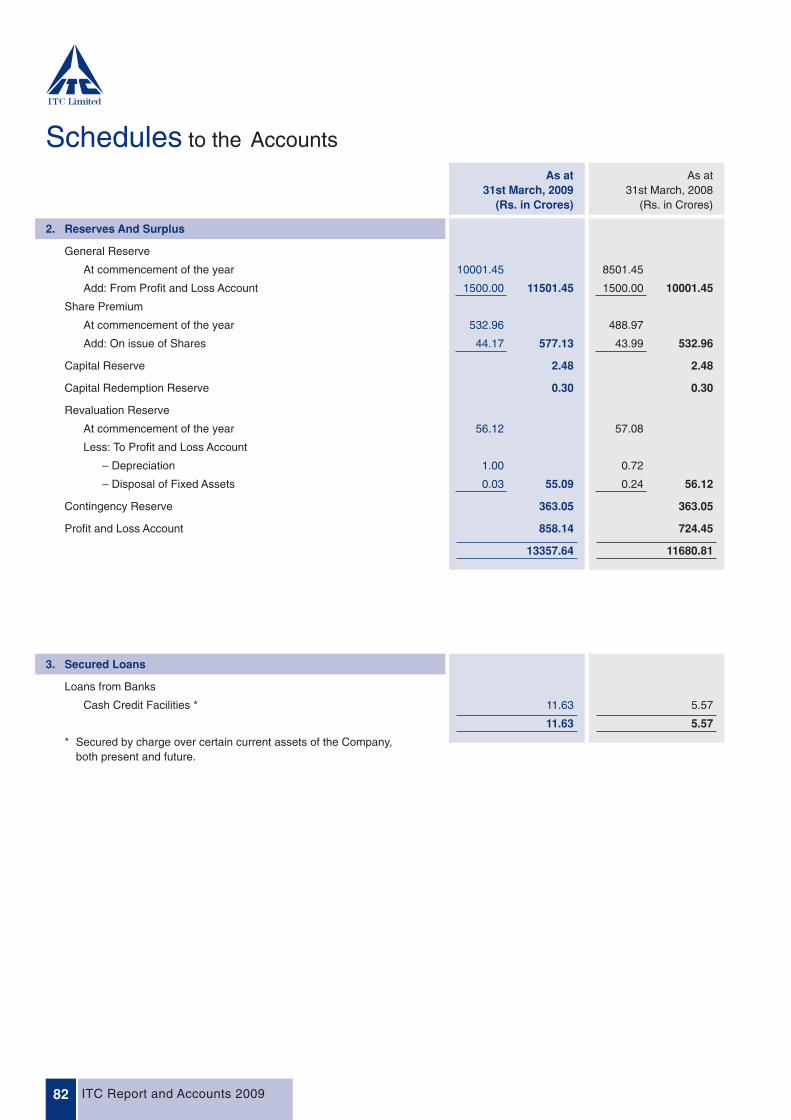
General Reserve
At commencement of the year 10001.45 8501.45
Add: From Profit and Loss Account 1500.00 11501.45 1500.00 10001.45
Share Premium
At commencement of the year 532.96 488.97
Add: On issue of Shares 44.17 577.13 43.99 532.96
Capital Reserve 2.48 2.48
Capital Redemption Reserve 0.30 0.30
Revaluation Reserve
At commencement of the year 56.12 57.08
Less: To Profit and Loss Account
– Depreciation 1.00 0.72
– Disposal of Fixed Assets 0.03 55.09 0.24 56.12
Contingency Reserve 363.05 363.05
Profit and Loss Account 858.14 724.45
13357.64 11680.81
ITC Report and Accounts 200982
Schedules to the Accounts
As at As at31st March, 2009 31st March, 2008
(Rs. in Crores) (Rs. in Crores)
2. Reserves And Surplus
3. Secured Loans
Loans from Banks
Cash Credit Facilities * 11.63 5.57
11.63 5.57
* Secured by charge over certain current assets of the Company,both present and future.
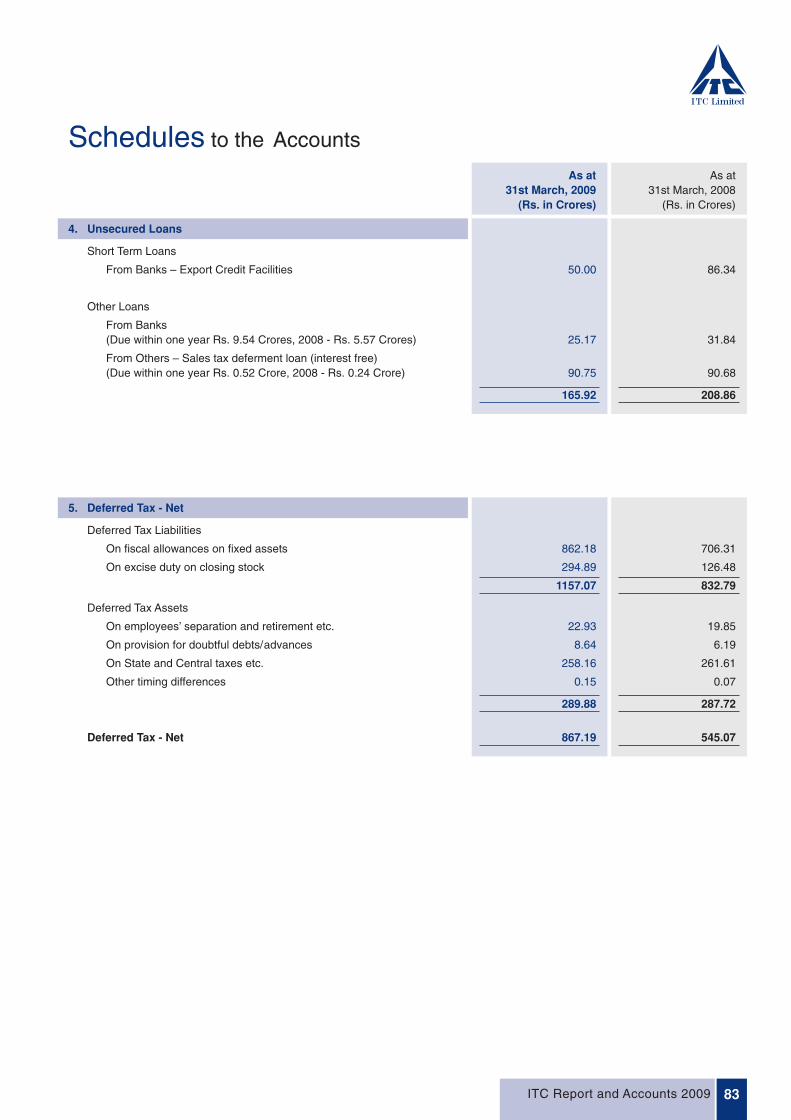
Schedules to the Accounts
As at As at31st March, 2009 31st March, 2008
(Rs. in Crores) (Rs. in Crores)
Short Term Loans
From Banks – Export Credit Facilities 50.00 86.34
Other Loans
From Banks(Due within one year Rs. 9.54 Crores, 2008 - Rs. 5.57 Crores) 25.17 31.84
From Others – Sales tax deferment loan (interest free)(Due within one year Rs. 0.52 Crore, 2008 - Rs. 0.24 Crore) 90.75 90.68
165.92 208.86
4. Unsecured Loans
5. Deferred Tax - Net
Deferred Tax Liabilities
On fiscal allowances on fixed assets 862.18 706.31
On excise duty on closing stock 294.89 126.48
1157.07 832.79
Deferred Tax Assets
On employees’ separation and retirement etc. 22.93 19.85
On provision for doubtful debts/advances 8.64 6.19
On State and Central taxes etc. 258.16 261.61
Other timing differences 0.15 0.07
289.88 287.72
Deferred Tax - Net 867.19 545.07
ITC Report and Accounts 2009 83

ITC Report and Accounts 200984
Schedules to the Accounts
Net Book Depreciation Value
@ As at @ As at Depreciation upto as atcommencement Withdrawals the end of Depreciation on Withdrawals 31st March, 31st March,
of the year Additions and adjustments the year for the year and adjustments 2009 2009(Rs. in Crores) (Rs. in Crores) (Rs. in Crores) (Rs. in Crores) (Rs. in Crores) (Rs. in Crores) (Rs. in Crores) (Rs. in Crores)
Trademarks & Goodwill 10.94 – – 10.94 5.51 – 9.10 1.84
Know-how, Business andCommercial Rights 60.36 – – 60.36 7.58 – 32.87 27.49
Land Freehold * 700.72 57.37 – 758.09 – – – 758.09
Buildings Freehold * 1541.29 255.30 4.01 1792.58 37.51 1.66 272.44 1520.14
Leasehold Properties 120.79 20.66 – 141.45 1.10 – 7.09 134.36
Licensed Properties -Building Improvement 29.77 9.74 1.03 38.48 5.32 0.20 12.48 26.00
Railway Sidings etc. 1.17 – – 1.17 0.05 – 0.78 0.39
Plant & Machinery 5628.66 1223.21 49.29 6802.58 395.17 34.20 2457.58 4345.00
Capitalised Software 106.53 26.05 1.17 131.41 19.72 1.23 61.73 69.68
Computers, Servers andOther I.T. Equipments 343.78 40.86 11.34 373.30 42.24 10.46 221.80 151.50
Furniture & Fixtures 358.41 31.01 6.96 382.46 30.54 4.17 194.06 188.40
Motor Vehicles etc. 57.28 14.54 5.99 65.83 5.67 2.62 16.81 49.02
8959.70 1678.74 79.79 10558.65 550.41 54.54 3286.74 7271.91
Capital Work-in-Progress 1126.82 1675.38 1588.14 1214.06 – – – 1214.06
Total 10086.52 3354.12 1667.93 11772.71 550.41 54.54 3286.74 8485.97
Previous Year 8000.45 3780.72 1694.65 10086.52 439.18 37.85 2790.87 7295.65
6. Fixed Assets
@ Original Cost/Professional Valuation as at 30th June, 1986
Land Freehold includes the provisional purchase price of (a) Rs.17.29 Crores (2008 - Rs.17.29 Crores) in respect of land at Bangalore. Final purchaseprice is to be determined by the Karnataka Industrial Areas Development Board, on settlement of which and on execution of a Sale Deed, title willpass to the Company in 21 years time from the date of agreement (b) Rs. 8.92 Crores (2008 - Rs. 7.60 Crores) in respect of land at Mysore.Final purchase price is to be determined by the Karnataka Industrial Areas Development Board, on settlement of which and on execution of a SaleDeed, title will pass to the Company in 6 years time from the date of agreement.
Land Freehold includes certain lands at Munger which stood vested with the State of Bihar under the Bihar Land Reforms Act, 1950, for whichcompensation has not yet been determined.
Litigation seeking cancellation of lease of Wakf land in Bangalore pertaining to ITC Windsor is pending before various forums including the Hon’bleHigh Court of Karnataka. In the opinion of the management based upon legal advice, the Company’s title to the property is tenable.
Buildings Freehold include Rs. 561.75 Crores (2008 - Rs. 532.50 Crores) aggregate cost of building on leasehold land situated at various locations.
“Trademarks & Goodwill” includes purchased Trademark amounting to Rs. 6.04 Crores (2008 - Rs. 6.04 Crores) which are being amortisedover 10 years.
Out of the total amount of “Know-how, Business and Commercial Rights” aggregating Rs. 60.36 Crores (2008 - Rs. 60.36 Crores) : -
– Rs. 47.34 Crores (2008 - Rs. 47.34 Crores) acquired in earlier years are being amortised over 10 years.
– Rs. 4.97 Crores (2008 - Rs. 4.97 Crores) acquired in earlier years are being amortised over 4 years.
– Rs. 8.05 Crores (2008 - Rs. 8.05 Crores) acquired in earlier years are being amortised over 5 years.
Applications for exemption in respect of vacant land under the Urban Land (Ceiling & Regulation) Act,1976 have been made, wherever applicable.
Capital expenditure commitments are Rs. 754.13 Crores (2008 - Rs. 886.67 Crores).
Capital Work-in-Progress includes intangible assets yet to be capitalised Rs. 39.49 Crores (2008 - Rs. 19.53 Crores).
Depreciation for the year includes Rs. 1.00 Crore (2008 - Rs. 0.72 Crore) transferred from Revaluation Reserve in respect of revalued assets.
* Includes certain properties for which deeds of conveyance are awaited.
ITC Report and Accounts 2009 85
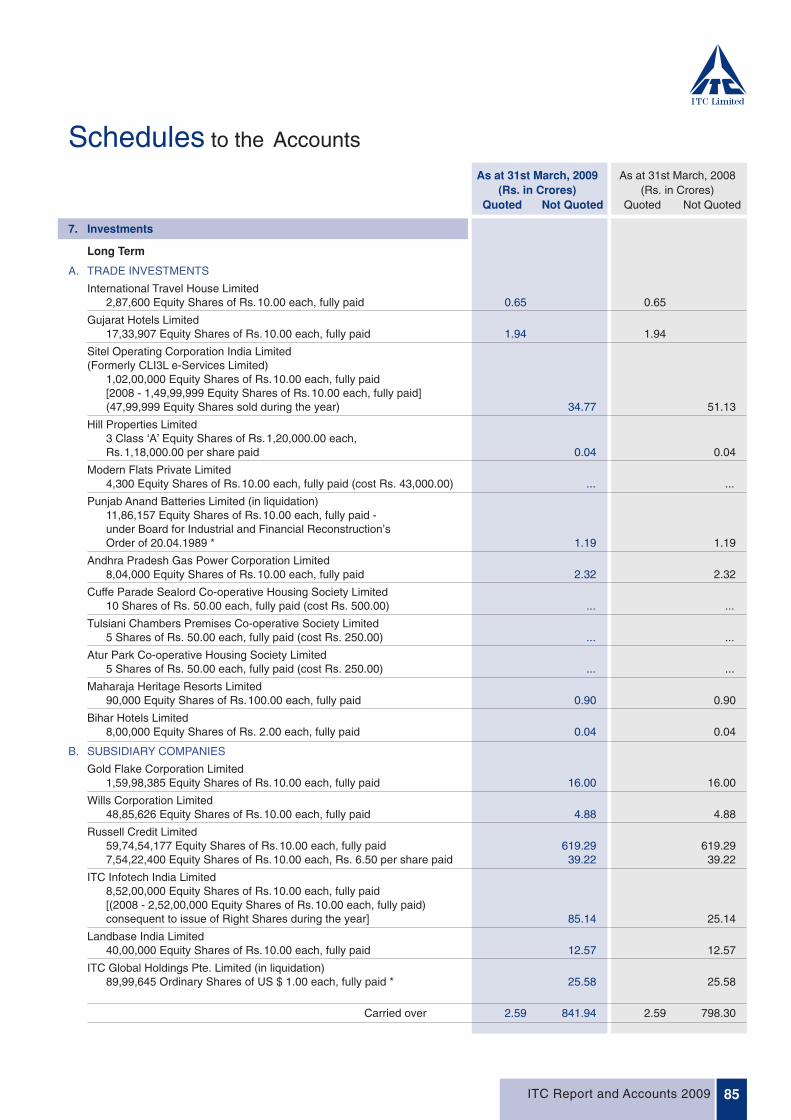
Schedules to the Accounts
As at 31st March, 2009 As at 31st March, 2008(Rs. in Crores) (Rs. in Crores)
Quoted Not Quoted Quoted Not Quoted
7. Investments
Carried over 2.59 841.94 2.59 798.30
Long Term
A. TRADE INVESTMENTS
International Travel House Limited2,87,600 Equity Shares of Rs.10.00 each, fully paid 0.65 0.65
Gujarat Hotels Limited17,33,907 Equity Shares of Rs.10.00 each, fully paid 1.94 1.94
Sitel Operating Corporation India Limited(Formerly CLI3L e-Services Limited)
1,02,00,000 Equity Shares of Rs.10.00 each, fully paid[2008 - 1,49,99,999 Equity Shares of Rs.10.00 each, fully paid](47,99,999 Equity Shares sold during the year) 34.77 51.13
Hill Properties Limited3 Class ‘A’ Equity Shares of Rs.1,20,000.00 each,Rs.1,18,000.00 per share paid 0.04 0.04
Modern Flats Private Limited4,300 Equity Shares of Rs.10.00 each, fully paid (cost Rs. 43,000.00) ... ...
Punjab Anand Batteries Limited (in liquidation)11,86,157 Equity Shares of Rs.10.00 each, fully paid -under Board for Industrial and Financial Reconstruction’s Order of 20.04.1989 * 1.19 1.19
Andhra Pradesh Gas Power Corporation Limited8,04,000 Equity Shares of Rs.10.00 each, fully paid 2.32 2.32
Cuffe Parade Sealord Co-operative Housing Society Limited10 Shares of Rs. 50.00 each, fully paid (cost Rs. 500.00) ... ...
Tulsiani Chambers Premises Co-operative Society Limited5 Shares of Rs. 50.00 each, fully paid (cost Rs. 250.00) ... ...
Atur Park Co-operative Housing Society Limited5 Shares of Rs. 50.00 each, fully paid (cost Rs. 250.00) ... ...
Maharaja Heritage Resorts Limited90,000 Equity Shares of Rs.100.00 each, fully paid 0.90 0.90
Bihar Hotels Limited8,00,000 Equity Shares of Rs. 2.00 each, fully paid 0.04 0.04
B. SUBSIDIARY COMPANIES
Gold Flake Corporation Limited1,59,98,385 Equity Shares of Rs.10.00 each, fully paid 16.00 16.00
Wills Corporation Limited48,85,626 Equity Shares of Rs.10.00 each, fully paid 4.88 4.88
Russell Credit Limited59,74,54,177 Equity Shares of Rs.10.00 each, fully paid 619.29 619.297,54,22,400 Equity Shares of Rs.10.00 each, Rs. 6.50 per share paid 39.22 39.22
ITC Infotech India Limited8,52,00,000 Equity Shares of Rs.10.00 each, fully paid[(2008 - 2,52,00,000 Equity Shares of Rs.10.00 each, fully paid)consequent to issue of Right Shares during the year] 85.14 25.14
Landbase India Limited40,00,000 Equity Shares of Rs.10.00 each, fully paid 12.57 12.57
ITC Global Holdings Pte. Limited (in liquidation)89,99,645 Ordinary Shares of US $ 1.00 each, fully paid * 25.58 25.58
ITC Report and Accounts 200986
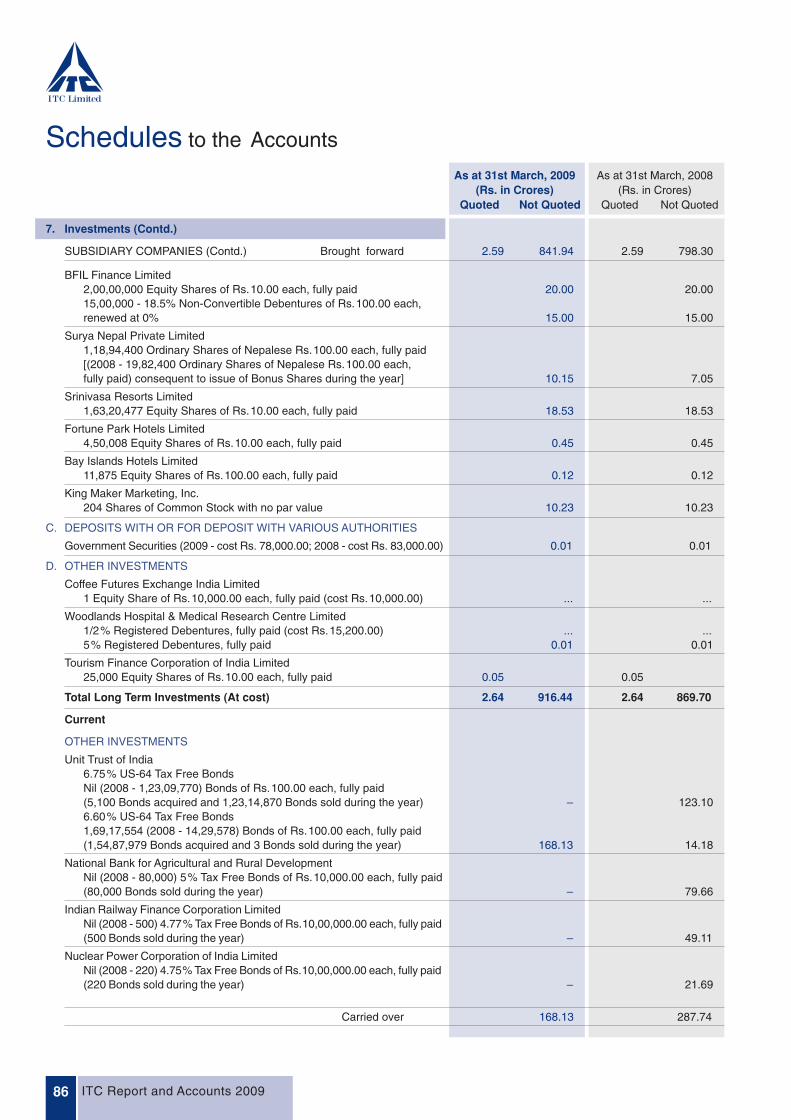
Schedules to the Accounts
7. Investments (Contd.)
Carried over 168.13 287.74
SUBSIDIARY COMPANIES (Contd.) Brought forward 2.59 841.94 2.59 798.30
As at 31st March, 2009 As at 31st March, 2008(Rs. in Crores) (Rs. in Crores)
Quoted Not Quoted Quoted Not Quoted
BFIL Finance Limited2,00,00,000 Equity Shares of Rs.10.00 each, fully paid 20.00 20.0015,00,000 - 18.5% Non-Convertible Debentures of Rs.100.00 each,renewed at 0% 15.00 15.00
Surya Nepal Private Limited1,18,94,400 Ordinary Shares of Nepalese Rs.100.00 each, fully paid[(2008 - 19,82,400 Ordinary Shares of Nepalese Rs.100.00 each,fully paid) consequent to issue of Bonus Shares during the year] 10.15 7.05
Srinivasa Resorts Limited1,63,20,477 Equity Shares of Rs.10.00 each, fully paid 18.53 18.53
Fortune Park Hotels Limited4,50,008 Equity Shares of Rs.10.00 each, fully paid 0.45 0.45
Bay Islands Hotels Limited11,875 Equity Shares of Rs.100.00 each, fully paid 0.12 0.12
King Maker Marketing, Inc.204 Shares of Common Stock with no par value 10.23 10.23
C. DEPOSITS WITH OR FOR DEPOSIT WITH VARIOUS AUTHORITIES
Government Securities (2009 - cost Rs. 78,000.00; 2008 - cost Rs. 83,000.00) 0.01 0.01
D. OTHER INVESTMENTS
Coffee Futures Exchange India Limited1 Equity Share of Rs.10,000.00 each, fully paid (cost Rs.10,000.00) ... ...
Woodlands Hospital & Medical Research Centre Limited1/2% Registered Debentures, fully paid (cost Rs.15,200.00) ... ...5% Registered Debentures, fully paid 0.01 0.01
Tourism Finance Corporation of India Limited25,000 Equity Shares of Rs.10.00 each, fully paid 0.05 0.05
Total Long Term Investments (At cost) 2.64 916.44 2.64 869.70
Current
OTHER INVESTMENTS
Unit Trust of India 6.75% US-64 Tax Free BondsNil (2008 - 1,23,09,770) Bonds of Rs.100.00 each, fully paid(5,100 Bonds acquired and 1,23,14,870 Bonds sold during the year) – 123.106.60% US-64 Tax Free Bonds 1,69,17,554 (2008 - 14,29,578) Bonds of Rs.100.00 each, fully paid(1,54,87,979 Bonds acquired and 3 Bonds sold during the year) 168.13 14.18
National Bank for Agricultural and Rural Development Nil (2008 - 80,000) 5% Tax Free Bonds of Rs.10,000.00 each, fully paid(80,000 Bonds sold during the year) – 79.66
Indian Railway Finance Corporation Limited Nil (2008 - 500) 4.77% Tax Free Bonds of Rs.10,00,000.00 each, fully paid
(500 Bonds sold during the year) – 49.11
Nuclear Power Corporation of India Limited Nil (2008 - 220) 4.75% Tax Free Bonds of Rs.10,00,000.00 each, fully paid(220 Bonds sold during the year) – 21.69

ITC Report and Accounts 2009 87
Schedules to the Accounts
7. Investments (Contd.)
Carried over 704.02 791.65
Current
OTHER INVESTMENTS (Contd.) Brought forward 168.13 287.74
As at 31st March, 2009 As at 31st March, 2008(Rs. in Crores) (Rs. in Crores)
Quoted Not Quoted Quoted Not Quoted
Power Finance Corporation Limited Nil (2008 - 2,000) 10.40% Tax Free Bonds of Rs.1,00,000.00 each, fully paid(2,000 Bonds sold during the year) – 20.31
IIFCL 6.85% 2014 Tax Free Bonds (22/01/2014)17,000 (2008 - Nil) Bonds of Rs.1,00,000.00 each, fully paid(17,000 Bonds acquired during the year) 169.76 –6.85% 2014 Tax Free Bonds Series II (06/03/2014)3,000 (2008 - Nil) Bonds of Rs.1,00,000.00 each, fully paid(3,000 Bonds acquired during the year) 30.00 –
ICICI Bank Limited350 Non-Cumulative, Non-Participating, Non-VotingPreference Shares of Rs.1,00,00,000.00 each, fully paid 133.48 131.29
AIG India Treasury Fund - Super Institutional Plan - Daily Dividend Reinvestment5,42,38,414 (2008 - Nil) Units of Rs.10.00 each(60,30,14,498 Units purchased and 54,87,76,084 Units sold during the year) 54.30 –
Birla Cash Plus - Institutional Premium - GrowthNil (2008 - 91,80,966) Units of Rs.10.00 each(91,80,966 Units sold during the year) – 10.00
Birla FTP - Institutional - Series Y - GrowthNil (2008 - 1,50,00,000) Units of Rs.10.00 each(1,50,00,000 Units sold during the year) – 15.00
Birla FTP - Institutional - Series AA - GrowthNil (2008 - 2,50,00,000) Units of Rs.10.00 each(2,50,00,000 Units sold during the year) – 25.00
Birla FTP - Institutional - Series AC - GrowthNil (2008 - 1,00,00,000) Units of Rs.10.00 each(1,00,00,000 Units sold during the year) – 10.00
Birla Income Plus - Quarterly Dividend - ReinvestmentNil (2008 - 12,34,75,977) Units of Rs.10.00 each(21,67,77,688 Units purchased and 34,02,53,665 Units sold during the year) – 130.64
Birla Sun Life Income Fund - Quarterly Dividend - ReinvestmentNil (2008 - 62,94,566) Units of Rs.10.00 each(62,94,566 Units sold during the year) – 6.69
Birla Sun Life Short Term Fund - Fortnightly Dividend - ReinvestmentNil (2008 - 8,45,34,890) Units of Rs.10.00 each(1,13,241 Units purchased and 8,46,48,131 Units sold during the year) – 84.98
BSL Dynamic Bond Fund Retail Plan Monthly Dividend Reinvestment11,51,16,780 (2008 - Nil) Units of Rs.10.00 each(11,51,16,780 Units purchased during the year) 118.35 –
BSL Quarterly Interval - Series 4 - Dividend PayoutNil (2008 - 2,50,00,000) Units of Rs.10.00 each(2,50,00,000 Units sold during the year) – 25.00
Canara Robeco Interval Monthly Institutional Dividend FundNil (2008 - 1,49,82,620) Units of Rs.10.00 each(1,49,82,620 Units sold during the year) – 15.00
Canara Robeco Liquid Fund - Institutional - Growth2,39,78,529 (2008 - 2,39,78,529) Units of Rs.10.00 each 30.00 30.00
ITC Report and Accounts 200988
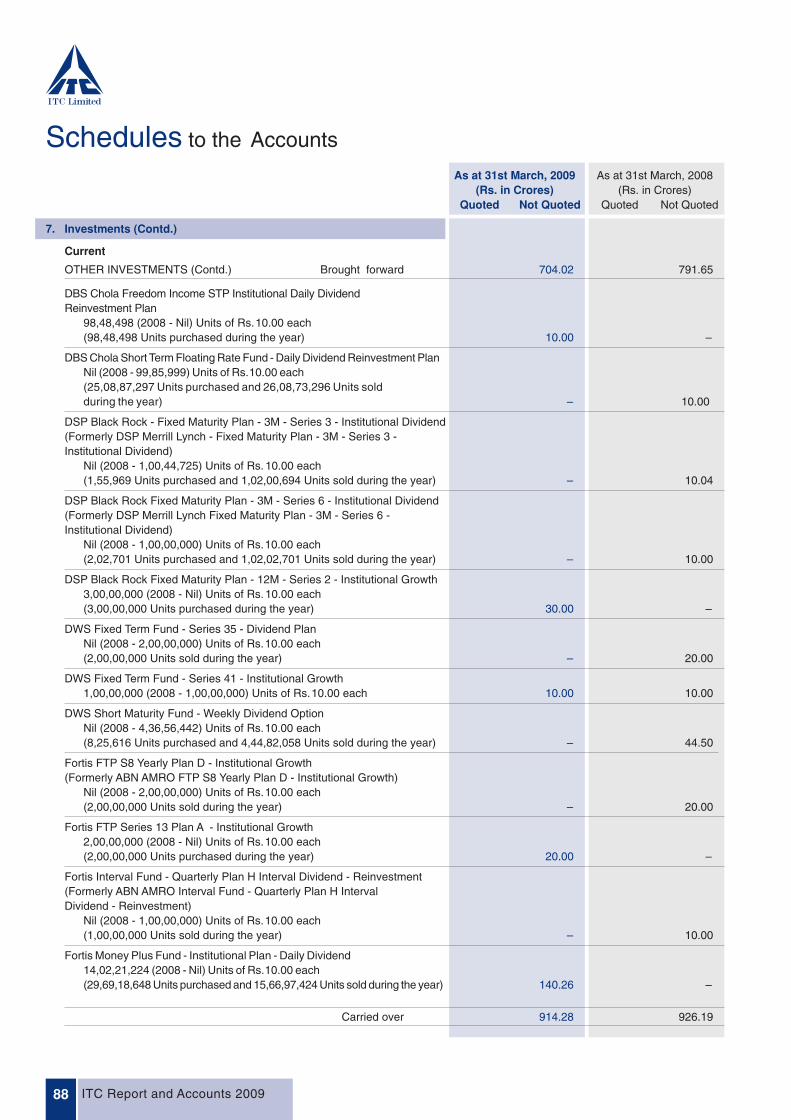
Schedules to the Accounts
7. Investments (Contd.)
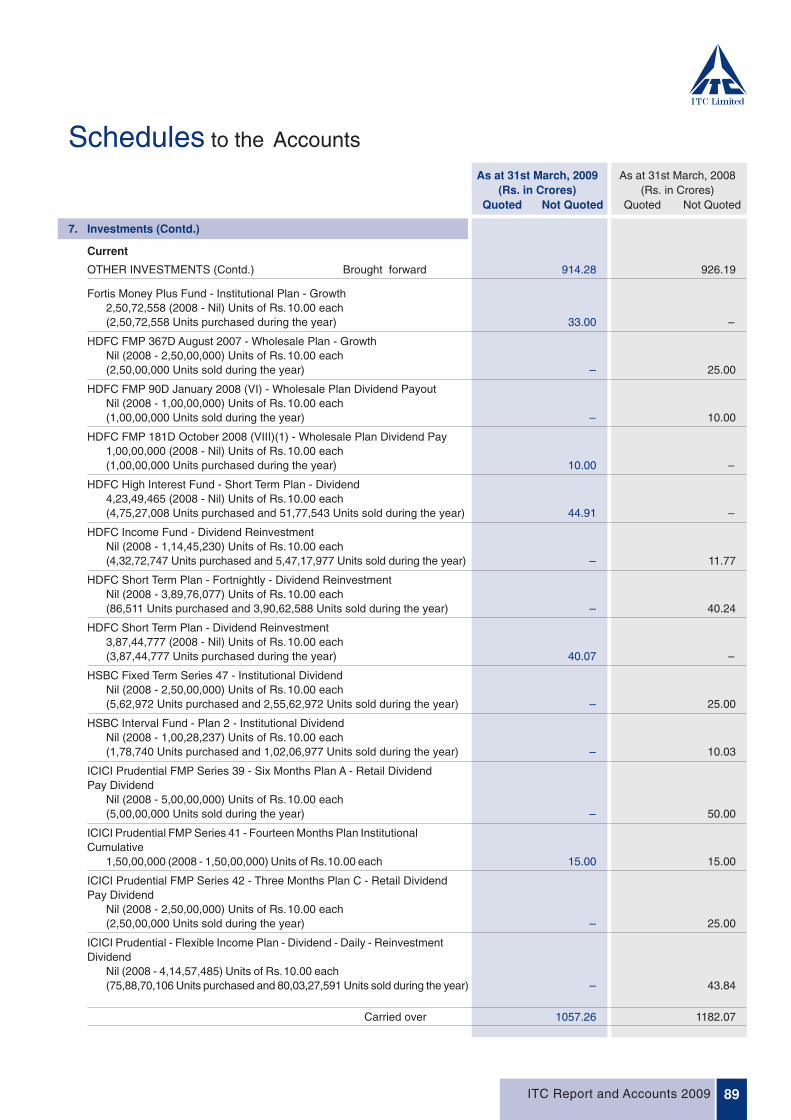
Carried over 914.28 926.19
Current
OTHER INVESTMENTS (Contd.) Brought forward 704.02 791.65
As at 31st March, 2009 As at 31st March, 2008(Rs. in Crores) (Rs. in Crores)
Quoted Not Quoted Quoted Not Quoted
DBS Chola Freedom Income STP Institutional Daily DividendReinvestment Plan
98,48,498 (2008 - Nil) Units of Rs.10.00 each(98,48,498 Units purchased during the year) 10.00 –
DBS Chola Short Term Floating Rate Fund - Daily Dividend Reinvestment PlanNil (2008 - 99,85,999) Units of Rs.10.00 each(25,08,87,297 Units purchased and 26,08,73,296 Units soldduring the year) – 10.00
DSP Black Rock - Fixed Maturity Plan - 3M - Series 3 - Institutional Dividend(Formerly DSP Merrill Lynch - Fixed Maturity Plan - 3M - Series 3 -Institutional Dividend)
Nil (2008 - 1,00,44,725) Units of Rs. 10.00 each(1,55,969 Units purchased and 1,02,00,694 Units sold during the year) – 10.04
DSP Black Rock Fixed Maturity Plan - 3M - Series 6 - Institutional Dividend(Formerly DSP Merrill Lynch Fixed Maturity Plan - 3M - Series 6 -Institutional Dividend)
Nil (2008 - 1,00,00,000) Units of Rs.10.00 each(2,02,701 Units purchased and 1,02,02,701 Units sold during the year) – 10.00
DSP Black Rock Fixed Maturity Plan - 12M - Series 2 - Institutional Growth3,00,00,000 (2008 - Nil) Units of Rs.10.00 each(3,00,00,000 Units purchased during the year) 30.00 –
DWS Fixed Term Fund - Series 35 - Dividend PlanNil (2008 - 2,00,00,000) Units of Rs.10.00 each(2,00,00,000 Units sold during the year) – 20.00
DWS Fixed Term Fund - Series 41 - Institutional Growth1,00,00,000 (2008 - 1,00,00,000) Units of Rs.10.00 each 10.00 10.00
DWS Short Maturity Fund - Weekly Dividend OptionNil (2008 - 4,36,56,442) Units of Rs.10.00 each(8,25,616 Units purchased and 4,44,82,058 Units sold during the year) – 44.50
Fortis FTP S8 Yearly Plan D - Institutional Growth(Formerly ABN AMRO FTP S8 Yearly Plan D - Institutional Growth)
Nil (2008 - 2,00,00,000) Units of Rs.10.00 each(2,00,00,000 Units sold during the year) – 20.00
Fortis FTP Series 13 Plan A - Institutional Growth2,00,00,000 (2008 - Nil) Units of Rs.10.00 each(2,00,00,000 Units purchased during the year) 20.00 –
Fortis Interval Fund - Quarterly Plan H Interval Dividend - Reinvestment(Formerly ABN AMRO Interval Fund - Quarterly Plan H IntervalDividend - Reinvestment)
Nil (2008 - 1,00,00,000) Units of Rs.10.00 each(1,00,00,000 Units sold during the year) – 10.00
Fortis Money Plus Fund - Institutional Plan - Daily Dividend14,02,21,224 (2008 - Nil) Units of Rs.10.00 each(29,69,18,648 Units purchased and 15,66,97,424 Units sold during the year) 140.26 –
ITC Report and Accounts 2009 89
Schedules to the Accounts
7. Investments (Contd.)
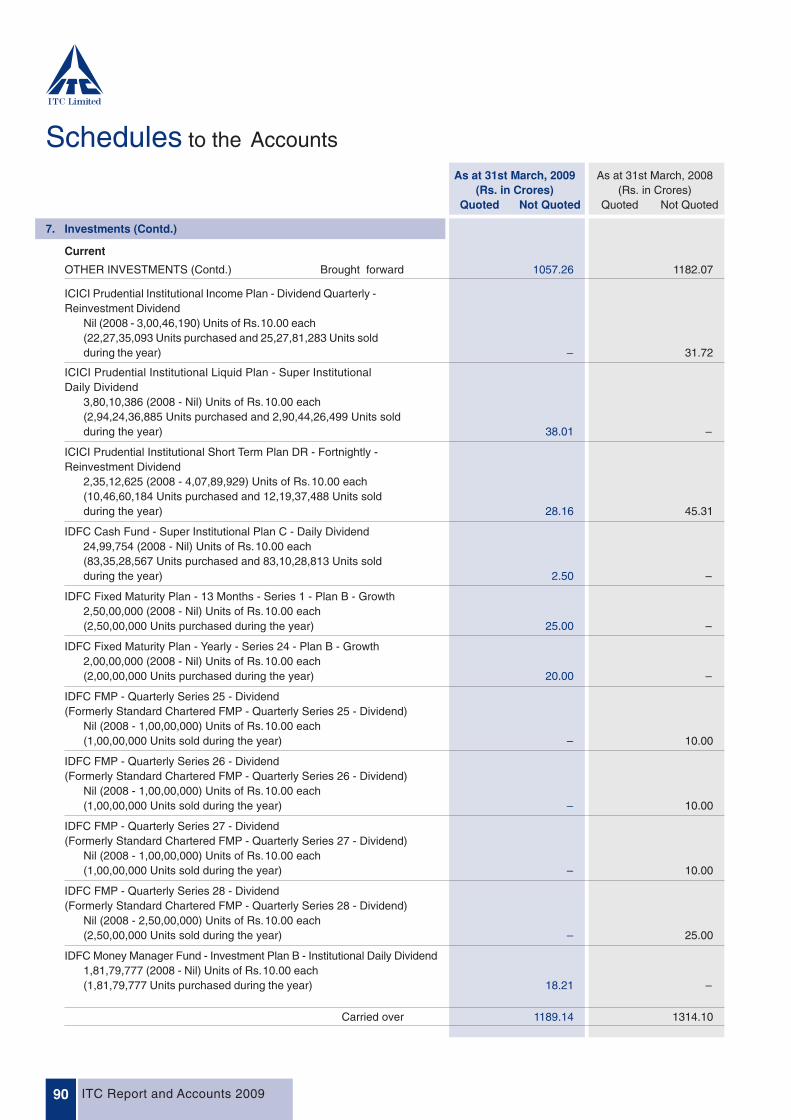
Carried over 1057.26 1182.07
Current
OTHER INVESTMENTS (Contd.) Brought forward 914.28 926.19
As at 31st March, 2009 As at 31st March, 2008(Rs. in Crores) (Rs. in Crores)
Quoted Not Quoted Quoted Not Quoted
Fortis Money Plus Fund - Institutional Plan - Growth2,50,72,558 (2008 - Nil) Units of Rs.10.00 each(2,50,72,558 Units purchased during the year) 33.00 –
HDFC FMP 367D August 2007 - Wholesale Plan - GrowthNil (2008 - 2,50,00,000) Units of Rs.10.00 each(2,50,00,000 Units sold during the year) – 25.00
HDFC FMP 90D January 2008 (VI) - Wholesale Plan Dividend PayoutNil (2008 - 1,00,00,000) Units of Rs.10.00 each(1,00,00,000 Units sold during the year) – 10.00
HDFC FMP 181D October 2008 (VIII)(1) - Wholesale Plan Dividend Pay1,00,00,000 (2008 - Nil) Units of Rs.10.00 each(1,00,00,000 Units purchased during the year) 10.00 –
HDFC High Interest Fund - Short Term Plan - Dividend4,23,49,465 (2008 - Nil) Units of Rs.10.00 each(4,75,27,008 Units purchased and 51,77,543 Units sold during the year) 44.91 –
HDFC Income Fund - Dividend ReinvestmentNil (2008 - 1,14,45,230) Units of Rs.10.00 each(4,32,72,747 Units purchased and 5,47,17,977 Units sold during the year) – 11.77
HDFC Short Term Plan - Fortnightly - Dividend ReinvestmentNil (2008 - 3,89,76,077) Units of Rs.10.00 each(86,511 Units purchased and 3,90,62,588 Units sold during the year) – 40.24
HDFC Short Term Plan - Dividend Reinvestment3,87,44,777 (2008 - Nil) Units of Rs.10.00 each(3,87,44,777 Units purchased during the year) 40.07 –
HSBC Fixed Term Series 47 - Institutional DividendNil (2008 - 2,50,00,000) Units of Rs.10.00 each(5,62,972 Units purchased and 2,55,62,972 Units sold during the year) – 25.00
HSBC Interval Fund - Plan 2 - Institutional DividendNil (2008 - 1,00,28,237) Units of Rs.10.00 each(1,78,740 Units purchased and 1,02,06,977 Units sold during the year) – 10.03
ICICI Prudential FMP Series 39 - Six Months Plan A - Retail DividendPay Dividend
Nil (2008 - 5,00,00,000) Units of Rs.10.00 each(5,00,00,000 Units sold during the year) – 50.00
ICICI Prudential FMP Series 41 - Fourteen Months Plan InstitutionalCumulative
1,50,00,000 (2008 - 1,50,00,000) Units of Rs.10.00 each 15.00 15.00
ICICI Prudential FMP Series 42 - Three Months Plan C - Retail DividendPay Dividend
Nil (2008 - 2,50,00,000) Units of Rs.10.00 each(2,50,00,000 Units sold during the year) – 25.00
ICICI Prudential - Flexible Income Plan - Dividend - Daily - ReinvestmentDividend
Nil (2008 - 4,14,57,485) Units of Rs.10.00 each(75,88,70,106 Units purchased and 80,03,27,591 Units sold during the year) – 43.84
ITC Report and Accounts 200990
Schedules to the Accounts
7. Investments (Contd.)
Carried over 1189.14 1314.10
Current
OTHER INVESTMENTS (Contd.) Brought forward 1057.26 1182.07
As at 31st March, 2009 As at 31st March, 2008(Rs. in Crores) (Rs. in Crores)
Quoted Not Quoted Quoted Not Quoted
ICICI Prudential Institutional Income Plan - Dividend Quarterly -Reinvestment Dividend
Nil (2008 - 3,00,46,190) Units of Rs.10.00 each(22,27,35,093 Units purchased and 25,27,81,283 Units soldduring the year) – 31.72
ICICI Prudential Institutional Liquid Plan - Super InstitutionalDaily Dividend
3,80,10,386 (2008 - Nil) Units of Rs.10.00 each(2,94,24,36,885 Units purchased and 2,90,44,26,499 Units soldduring the year) 38.01 –
ICICI Prudential Institutional Short Term Plan DR - Fortnightly -Reinvestment Dividend
2,35,12,625 (2008 - 4,07,89,929) Units of Rs.10.00 each(10,46,60,184 Units purchased and 12,19,37,488 Units soldduring the year) 28.16 45.31
IDFC Cash Fund - Super Institutional Plan C - Daily Dividend24,99,754 (2008 - Nil) Units of Rs.10.00 each(83,35,28,567 Units purchased and 83,10,28,813 Units soldduring the year) 2.50 –
IDFC Fixed Maturity Plan - 13 Months - Series 1 - Plan B - Growth2,50,00,000 (2008 - Nil) Units of Rs.10.00 each(2,50,00,000 Units purchased during the year) 25.00 –
IDFC Fixed Maturity Plan - Yearly - Series 24 - Plan B - Growth2,00,00,000 (2008 - Nil) Units of Rs.10.00 each(2,00,00,000 Units purchased during the year) 20.00 –
IDFC FMP - Quarterly Series 25 - Dividend(Formerly Standard Chartered FMP - Quarterly Series 25 - Dividend)
Nil (2008 - 1,00,00,000) Units of Rs.10.00 each(1,00,00,000 Units sold during the year) – 10.00
IDFC FMP - Quarterly Series 26 - Dividend(Formerly Standard Chartered FMP - Quarterly Series 26 - Dividend)
Nil (2008 - 1,00,00,000) Units of Rs.10.00 each(1,00,00,000 Units sold during the year) – 10.00
IDFC FMP - Quarterly Series 27 - Dividend(Formerly Standard Chartered FMP - Quarterly Series 27 - Dividend)
Nil (2008 - 1,00,00,000) Units of Rs.10.00 each(1,00,00,000 Units sold during the year) – 10.00
IDFC FMP - Quarterly Series 28 - Dividend(Formerly Standard Chartered FMP - Quarterly Series 28 - Dividend)
Nil (2008 - 2,50,00,000) Units of Rs.10.00 each(2,50,00,000 Units sold during the year) – 25.00
IDFC Money Manager Fund - Investment Plan B - Institutional Daily Dividend1,81,79,777 (2008 - Nil) Units of Rs.10.00 each(1,81,79,777 Units purchased during the year) 18.21 –
ITC Report and Accounts 2009 91
Schedules to the Accounts
7. Investments (Contd.)
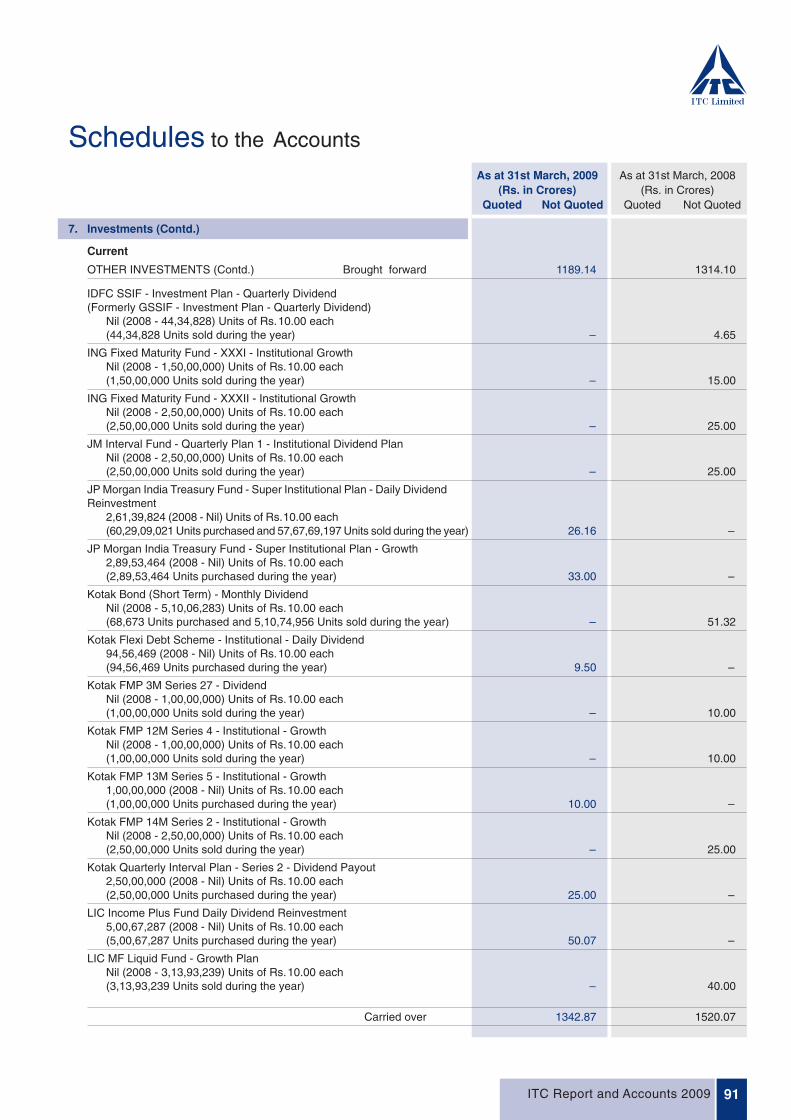
Carried over 1342.87 1520.07
Current
OTHER INVESTMENTS (Contd.) Brought forward 1189.14 1314.10
As at 31st March, 2009 As at 31st March, 2008(Rs. in Crores) (Rs. in Crores)
Quoted Not Quoted Quoted Not Quoted
IDFC SSIF - Investment Plan - Quarterly Dividend(Formerly GSSIF - Investment Plan - Quarterly Dividend)
Nil (2008 - 44,34,828) Units of Rs.10.00 each(44,34,828 Units sold during the year) – 4.65
ING Fixed Maturity Fund - XXXI - Institutional GrowthNil (2008 - 1,50,00,000) Units of Rs.10.00 each(1,50,00,000 Units sold during the year) – 15.00
ING Fixed Maturity Fund - XXXII - Institutional GrowthNil (2008 - 2,50,00,000) Units of Rs.10.00 each(2,50,00,000 Units sold during the year) – 25.00
JM Interval Fund - Quarterly Plan 1 - Institutional Dividend PlanNil (2008 - 2,50,00,000) Units of Rs.10.00 each(2,50,00,000 Units sold during the year) – 25.00
JP Morgan India Treasury Fund - Super Institutional Plan - Daily DividendReinvestment
2,61,39,824 (2008 - Nil) Units of Rs.10.00 each(60,29,09,021 Units purchased and 57,67,69,197 Units sold during the year) 26.16 –
JP Morgan India Treasury Fund - Super Institutional Plan - Growth2,89,53,464 (2008 - Nil) Units of Rs.10.00 each(2,89,53,464 Units purchased during the year) 33.00 –
Kotak Bond (Short Term) - Monthly DividendNil (2008 - 5,10,06,283) Units of Rs.10.00 each(68,673 Units purchased and 5,10,74,956 Units sold during the year) – 51.32
Kotak Flexi Debt Scheme - Institutional - Daily Dividend94,56,469 (2008 - Nil) Units of Rs.10.00 each(94,56,469 Units purchased during the year) 9.50 –
Kotak FMP 3M Series 27 - DividendNil (2008 - 1,00,00,000) Units of Rs.10.00 each(1,00,00,000 Units sold during the year) – 10.00
Kotak FMP 12M Series 4 - Institutional - GrowthNil (2008 - 1,00,00,000) Units of Rs.10.00 each(1,00,00,000 Units sold during the year) – 10.00
Kotak FMP 13M Series 5 - Institutional - Growth1,00,00,000 (2008 - Nil) Units of Rs.10.00 each(1,00,00,000 Units purchased during the year) 10.00 –
Kotak FMP 14M Series 2 - Institutional - GrowthNil (2008 - 2,50,00,000) Units of Rs.10.00 each(2,50,00,000 Units sold during the year) – 25.00
Kotak Quarterly Interval Plan - Series 2 - Dividend Payout2,50,00,000 (2008 - Nil) Units of Rs.10.00 each(2,50,00,000 Units purchased during the year) 25.00 –
LIC Income Plus Fund Daily Dividend Reinvestment5,00,67,287 (2008 - Nil) Units of Rs.10.00 each(5,00,67,287 Units purchased during the year) 50.07 –
LIC MF Liquid Fund - Growth PlanNil (2008 - 3,13,93,239) Units of Rs.10.00 each(3,13,93,239 Units sold during the year) – 40.00
ITC Report and Accounts 200992
Schedules to the Accounts
7. Investments (Contd.)
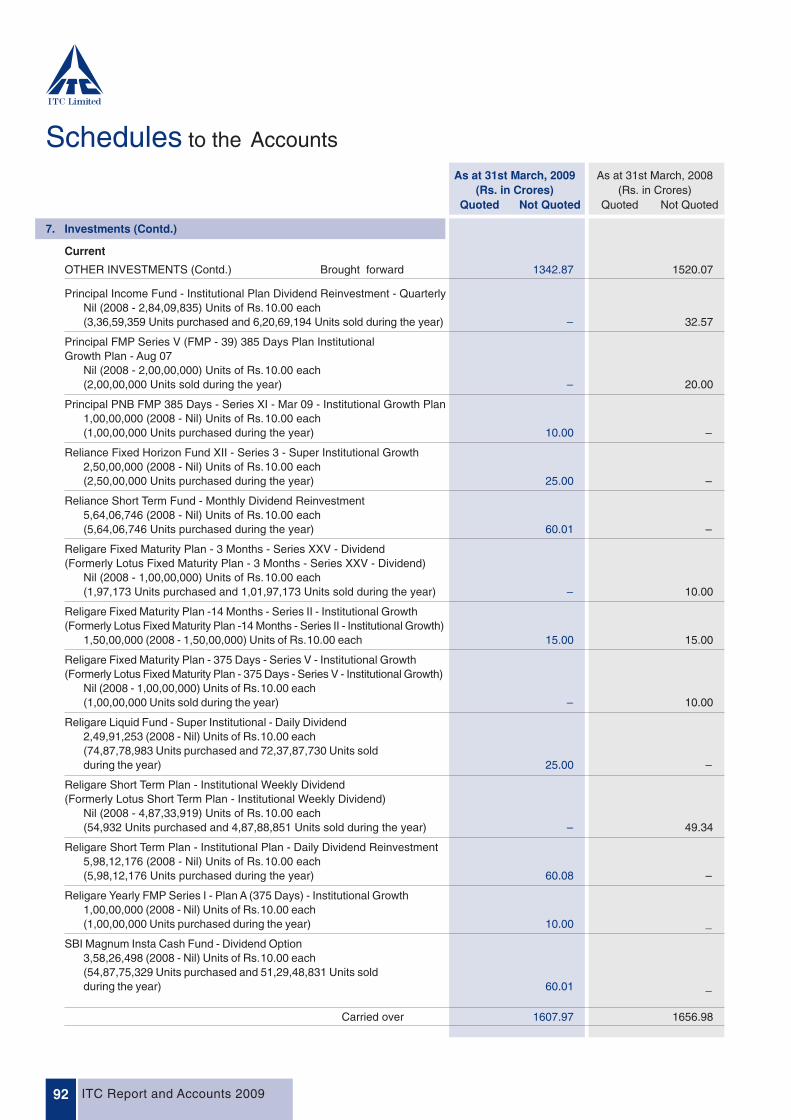
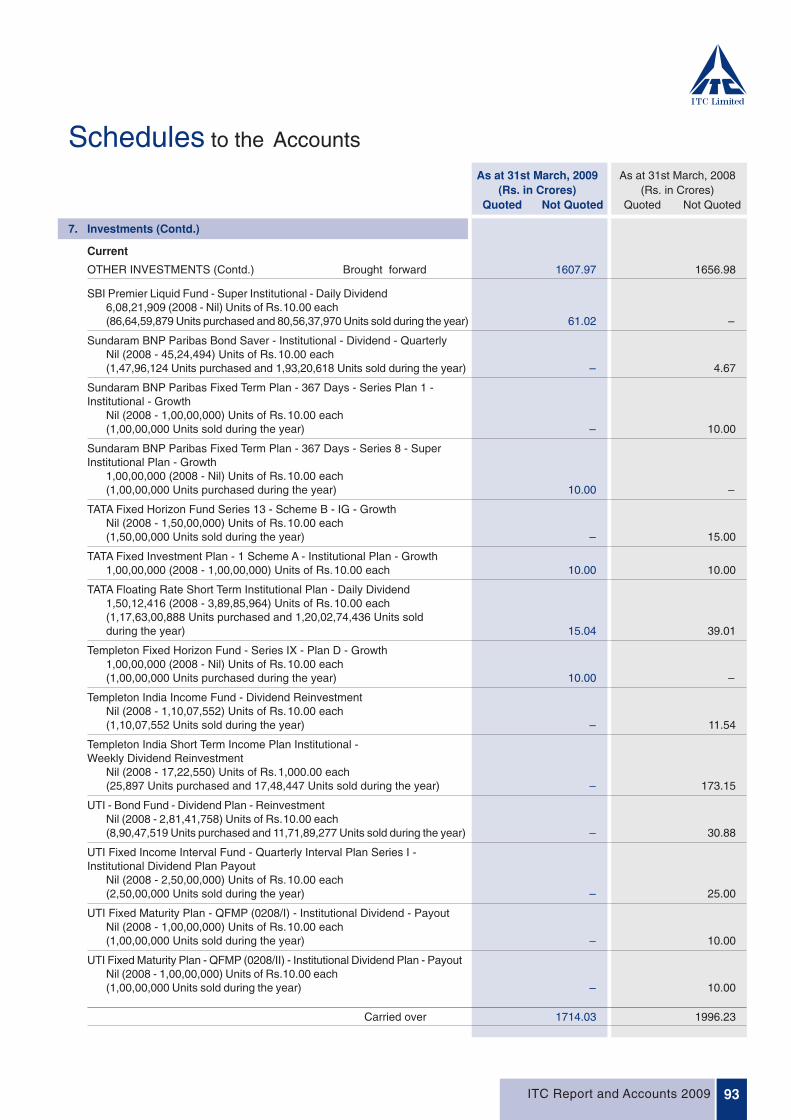
Carried over 1607.97 1656.98
Current
OTHER INVESTMENTS (Contd.) Brought forward 1342.87 1520.07
As at 31st March, 2009 As at 31st March, 2008(Rs. in Crores) (Rs. in Crores)
Quoted Not Quoted Quoted Not Quoted
Principal Income Fund - Institutional Plan Dividend Reinvestment - QuarterlyNil (2008 - 2,84,09,835) Units of Rs.10.00 each(3,36,59,359 Units purchased and 6,20,69,194 Units sold during the year) – 32.57
Principal FMP Series V (FMP - 39) 385 Days Plan InstitutionalGrowth Plan - Aug 07
Nil (2008 - 2,00,00,000) Units of Rs.10.00 each(2,00,00,000 Units sold during the year) – 20.00
Principal PNB FMP 385 Days - Series XI - Mar 09 - Institutional Growth Plan1,00,00,000 (2008 - Nil) Units of Rs.10.00 each(1,00,00,000 Units purchased during the year) 10.00 –
Reliance Fixed Horizon Fund XII - Series 3 - Super Institutional Growth2,50,00,000 (2008 - Nil) Units of Rs.10.00 each(2,50,00,000 Units purchased during the year) 25.00 –
Reliance Short Term Fund - Monthly Dividend Reinvestment5,64,06,746 (2008 - Nil) Units of Rs.10.00 each(5,64,06,746 Units purchased during the year) 60.01 –
Religare Fixed Maturity Plan - 3 Months - Series XXV - Dividend(Formerly Lotus Fixed Maturity Plan - 3 Months - Series XXV - Dividend)
Nil (2008 - 1,00,00,000) Units of Rs.10.00 each(1,97,173 Units purchased and 1,01,97,173 Units sold during the year) – 10.00
Religare Fixed Maturity Plan -14 Months - Series II - Institutional Growth(Formerly Lotus Fixed Maturity Plan -14 Months - Series II - Institutional Growth)
1,50,00,000 (2008 - 1,50,00,000) Units of Rs.10.00 each 15.00 15.00
Religare Fixed Maturity Plan - 375 Days - Series V - Institutional Growth(Formerly Lotus Fixed Maturity Plan - 375 Days - Series V - Institutional Growth)
Nil (2008 - 1,00,00,000) Units of Rs.10.00 each(1,00,00,000 Units sold during the year) – 10.00
Religare Liquid Fund - Super Institutional - Daily Dividend2,49,91,253 (2008 - Nil) Units of Rs.10.00 each(74,87,78,983 Units purchased and 72,37,87,730 Units soldduring the year) 25.00 –
Religare Short Term Plan - Institutional Weekly Dividend(Formerly Lotus Short Term Plan - Institutional Weekly Dividend)
Nil (2008 - 4,87,33,919) Units of Rs.10.00 each(54,932 Units purchased and 4,87,88,851 Units sold during the year) – 49.34
Religare Short Term Plan - Institutional Plan - Daily Dividend Reinvestment5,98,12,176 (2008 - Nil) Units of Rs.10.00 each(5,98,12,176 Units purchased during the year) 60.08 –
Religare Yearly FMP Series I - Plan A (375 Days) - Institutional Growth1,00,00,000 (2008 - Nil) Units of Rs.10.00 each(1,00,00,000 Units purchased during the year) 10.00 _
SBI Magnum Insta Cash Fund - Dividend Option3,58,26,498 (2008 - Nil) Units of Rs.10.00 each(54,87,75,329 Units purchased and 51,29,48,831 Units soldduring the year) 60.01 _
ITC Report and Accounts 2009 93
Schedules to the Accounts
7. Investments (Contd.)
Carried over 1714.03 1996.23
Current
OTHER INVESTMENTS (Contd.) Brought forward 1607.97 1656.98
As at 31st March, 2009 As at 31st March, 2008(Rs. in Crores) (Rs. in Crores)
Quoted Not Quoted Quoted Not Quoted
SBI Premier Liquid Fund - Super Institutional - Daily Dividend6,08,21,909 (2008 - Nil) Units of Rs.10.00 each(86,64,59,879 Units purchased and 80,56,37,970 Units sold during the year) 61.02 –
Sundaram BNP Paribas Bond Saver - Institutional - Dividend - QuarterlyNil (2008 - 45,24,494) Units of Rs.10.00 each(1,47,96,124 Units purchased and 1,93,20,618 Units sold during the year) – 4.67
Sundaram BNP Paribas Fixed Term Plan - 367 Days - Series Plan 1 -Institutional - Growth
Nil (2008 - 1,00,00,000) Units of Rs.10.00 each(1,00,00,000 Units sold during the year) – 10.00
Sundaram BNP Paribas Fixed Term Plan - 367 Days - Series 8 - SuperInstitutional Plan - Growth
1,00,00,000 (2008 - Nil) Units of Rs.10.00 each(1,00,00,000 Units purchased during the year) 10.00 –
TATA Fixed Horizon Fund Series 13 - Scheme B - IG - GrowthNil (2008 - 1,50,00,000) Units of Rs.10.00 each(1,50,00,000 Units sold during the year) – 15.00
TATA Fixed Investment Plan - 1 Scheme A - Institutional Plan - Growth1,00,00,000 (2008 - 1,00,00,000) Units of Rs.10.00 each 10.00 10.00
TATA Floating Rate Short Term Institutional Plan - Daily Dividend1,50,12,416 (2008 - 3,89,85,964) Units of Rs.10.00 each(1,17,63,00,888 Units purchased and 1,20,02,74,436 Units soldduring the year) 15.04 39.01
Templeton Fixed Horizon Fund - Series IX - Plan D - Growth1,00,00,000 (2008 - Nil) Units of Rs.10.00 each(1,00,00,000 Units purchased during the year) 10.00 –
Templeton India Income Fund - Dividend ReinvestmentNil (2008 - 1,10,07,552) Units of Rs.10.00 each(1,10,07,552 Units sold during the year) – 11.54
Templeton India Short Term Income Plan Institutional -Weekly Dividend Reinvestment
Nil (2008 - 17,22,550) Units of Rs.1,000.00 each(25,897 Units purchased and 17,48,447 Units sold during the year) – 173.15
UTI - Bond Fund - Dividend Plan - ReinvestmentNil (2008 - 2,81,41,758) Units of Rs.10.00 each(8,90,47,519 Units purchased and 11,71,89,277 Units sold during the year) – 30.88
UTI Fixed Income Interval Fund - Quarterly Interval Plan Series I -Institutional Dividend Plan Payout
Nil (2008 - 2,50,00,000) Units of Rs.10.00 each(2,50,00,000 Units sold during the year) – 25.00
UTI Fixed Maturity Plan - QFMP (0208/I) - Institutional Dividend - PayoutNil (2008 - 1,00,00,000) Units of Rs.10.00 each(1,00,00,000 Units sold during the year) – 10.00
UTI Fixed Maturity Plan - QFMP (0208/II) - Institutional Dividend Plan - PayoutNil (2008 - 1,00,00,000) Units of Rs.10.00 each(1,00,00,000 Units sold during the year) – 10.00
ITC Report and Accounts 200994
Schedules to the Accounts
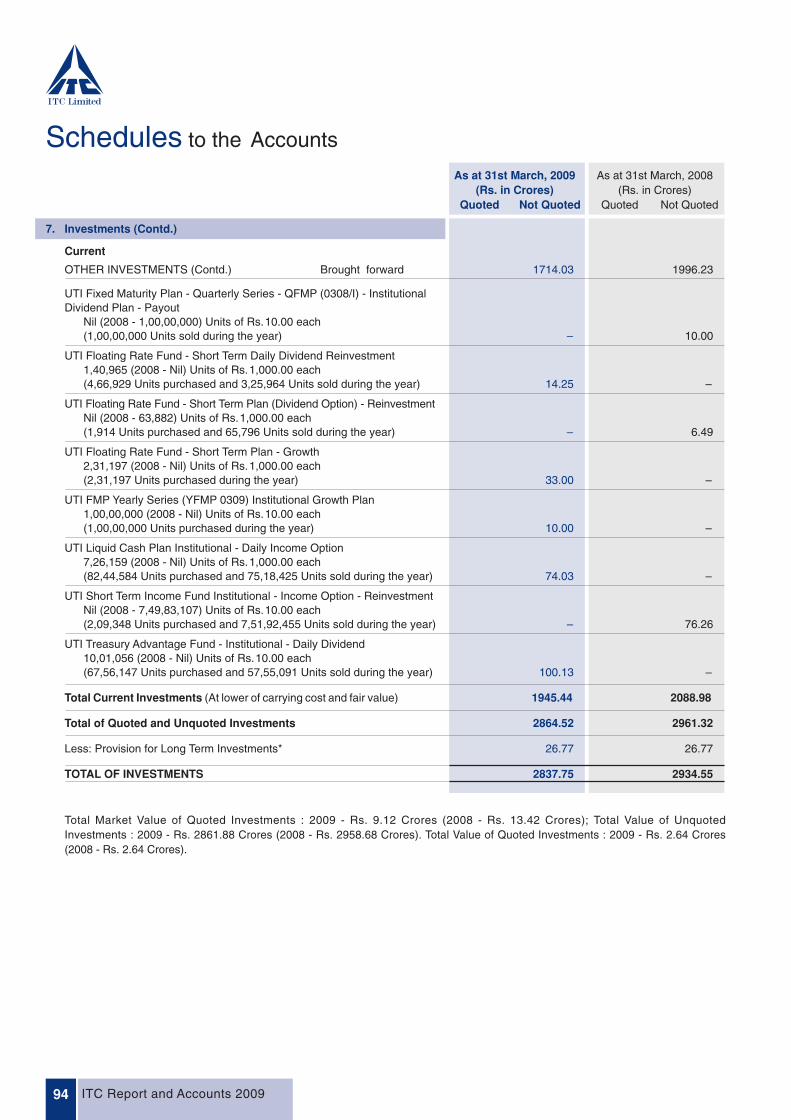
7. Investments (Contd.)
Current
OTHER INVESTMENTS (Contd.) Brought forward 1714.03 1996.23
As at 31st March, 2009 As at 31st March, 2008(Rs. in Crores) (Rs. in Crores)
Quoted Not Quoted Quoted Not Quoted
UTI Fixed Maturity Plan - Quarterly Series - QFMP (0308/I) - InstitutionalDividend Plan - Payout
Nil (2008 - 1,00,00,000) Units of Rs.10.00 each(1,00,00,000 Units sold during the year) – 10.00
UTI Floating Rate Fund - Short Term Daily Dividend Reinvestment1,40,965 (2008 - Nil) Units of Rs.1,000.00 each(4,66,929 Units purchased and 3,25,964 Units sold during the year) 14.25 –
UTI Floating Rate Fund - Short Term Plan (Dividend Option) - ReinvestmentNil (2008 - 63,882) Units of Rs.1,000.00 each(1,914 Units purchased and 65,796 Units sold during the year) – 6.49
UTI Floating Rate Fund - Short Term Plan - Growth2,31,197 (2008 - Nil) Units of Rs.1,000.00 each(2,31,197 Units purchased during the year) 33.00 –
UTI FMP Yearly Series (YFMP 0309) Institutional Growth Plan1,00,00,000 (2008 - Nil) Units of Rs.10.00 each(1,00,00,000 Units purchased during the year) 10.00 –
UTI Liquid Cash Plan Institutional - Daily Income Option7,26,159 (2008 - Nil) Units of Rs.1,000.00 each(82,44,584 Units purchased and 75,18,425 Units sold during the year) 74.03 –
UTI Short Term Income Fund Institutional - Income Option - ReinvestmentNil (2008 - 7,49,83,107) Units of Rs.10.00 each(2,09,348 Units purchased and 7,51,92,455 Units sold during the year) – 76.26
UTI Treasury Advantage Fund - Institutional - Daily Dividend10,01,056 (2008 - Nil) Units of Rs.10.00 each(67,56,147 Units purchased and 57,55,091 Units sold during the year) 100.13 –
Total Current Investments (At lower of carrying cost and fair value) 1945.44 2088.98
Total of Quoted and Unquoted Investments 2864.52 2961.32
Less: Provision for Long Term Investments* 26.77 26.77
TOTAL OF INVESTMENTS 2837.75 2934.55
Total Market Value of Quoted Investments : 2009 - Rs. 9.12 Crores (2008 - Rs. 13.42 Crores); Total Value of UnquotedInvestments : 2009 - Rs. 2861.88 Crores (2008 - Rs. 2958.68 Crores). Total Value of Quoted Investments : 2009 - Rs. 2.64 Crores(2008 - Rs. 2.64 Crores).

Schedules to the Accounts
7. Investments (Contd.)
During the year, the following Current Investments were purchased and sold :
ITC Report and Accounts 2009 95
(1) 1,13,34,750 Units of AIG India Liquid Fund - Super Institutional Plan - Daily Dividend Reinvestment at cost of Rs. 1134.43 Crores
(2) 1,26,10,24,624 Units of Birla Cash Plus - Institutional Premium - Daily Dividend - Reinvestment at cost of Rs. 1263.48 Crores
(3) 35,33,83,214 Units of Birla Sun Life Savings Fund - Institutional Plan Daily Dividend at cost of Rs. 353.62 Crores
(4) 3,70,53,207 Units of Birla Sun Life Short Term Fund - Institutional Fortnightly Dividend Reinvestment at cost of Rs. 37.22 Crores
(5) 32,74,59,326 Units of Birla Sun Life Short Term Fund - Institutional Daily Dividend Reinvestment at cost of Rs. 327.64 Crores
(6) 2,00,00,000 Units of Birla Sunlife II Fund Institutional Quarterly Series 2 - Dividend - Pay at cost of Rs. 20.00 Crores
(7) 2,00,00,000 Units of Birla Sunlife II Fund Institutional Quarterly Series 3 - Dividend - Pay at cost of Rs. 20.00 Crores
(8) 1,50,00,000 Units of Birla Sunlife Quarterly Interval Series 6 - Dividend - Payout at cost of Rs. 15.00 Crores
(9) 1,00,00,000 Units of Birla Sunlife Quarterly Interval Series 7 - Dividend - Payout at cost of Rs. 10.00 Crores
(10) 2,50,00,000 Units of Birla Sunlife Quarterly Interval Fund Series 9 - Dividend - Payout at cost of Rs. 25.00 Crores
(11) 7,13,72,043 Units of Canara Robeco Floating Rate Short Term Daily Dividend Fund at cost of Rs. 73.23 Crores
(12) 2,00,00,000 Units of Canara Robeco FMP Series 3 Quarterly Plan 1 Institutional Dividend Fund at cost of Rs. 20.00 Crores
(13) 1,00,00,000 Units of Canara Robeco FMP Series 3 Quarterly Plan 2 Institutional Dividend Fund at cost of Rs. 10.00 Crores
(14) 1,94,78,918 Units of Canara Robeco Income Fund Dividend Reinvestment at cost of Rs. 31.15 Crores
(15) 2,99,86,506 Units of Canara Robeco Interval Monthly Institutional Dividend Fund at cost of Rs. 30.00 Crores
(16) 2,49,86,308 Units of Canara Robeco Interval Quarterly Institutional Dividend Fund at cost of Rs. 25.00 Crores
(17) 1,00,00,000 Units of Canara Robeco Interval Series 2 Quarterly Plan 2 Institutional Dividend Fund at cost of Rs. 10.00 Crores
(18) 12,12,90,378 Units of Canara Robeco Liquid Fund - Institutional Daily Dividend Reinvestment at cost of Rs. 121.79 Crores
(19) 60,20,30,357 Units of Canara Robeco Liquid Fund - Super Institutional Plan - Daily Dividend Reinvestment at cost of Rs. 604.50Crores
(20) 1,21,01,851 Units of Canara Robeco Treasury Advantage Fund Institutional Plan Daily Dividend at cost of Rs. 15.01 Crores
(21) 47,04,47,267 Units of Canara Robeco Treasury Advantage Fund Super Institutional Plan Daily Dividend Reinvestment at costof Rs. 583.69 Crores
(22) 3,67,57,987 Units of Chola Liquid Institutional Dividend Reinvestment Plan at cost of Rs. 36.94 Crores
(23) 81,03,57,997 Units of Deutsche Insta Cash Plus Fund Super Institutional Daily Dividend at cost of Rs. 811.98 Crores
(24) 6,53,44,095 Units of DSP Black Rock Bond Fund - Regular Plan - Monthly Dividend at cost of Rs. 74.51 Crores
(25) 1,00,77,017 Units of DSP Black Rock FMP 1M Series 3 Institutional Dividend at cost of Rs. 10.08 Crores
(26) 1,50,93,770 Units of DSP Black Rock FMP 1M Series 4 Institutional Dividend at cost of Rs. 15.09 Crores
(27) 1,01,79,798 Units of DSP Black Rock FMP 3M Series 10 Institutional Dividend at cost of Rs. 10.18 Crores
(28) 2,55,47,691 Units of DSP Black Rock FMP 3M Series 13 Institutional Dividend at cost of Rs. 25.55 Crores
(29) 2,55,63,985 Units of DSP Black Rock FMP 3M Series 14 Institutional Dividend at cost of Rs. 25.56 Crores
(30) 2,56,09,614 Units of DSP Black Rock FMP 3M Series 16 Institutional Dividend at cost of Rs. 25.61 Crores
(31) 46,52,851 Units of DSP Black Rock Liquidity Fund - Institutional - Daily Dividend at cost of Rs. 465.38 Crores
(32) 1,12,08,284 Units of DSP Black Rock Government Securities Fund - (Plan A) Monthly - Dividend Reinvestment at cost ofRs. 13.00 Crores
(33) 1,00,00,000 Units of DWS Fixed Term Fund - Series 57 Institutional Dividend at cost of Rs. 10.00 Crores
(34) 1,00,00,000 Units of DWS Quarterly Interval Fund - Series 1 Dividend Plan at cost of Rs. 10.00 Crores
(35) 32,61,14,527 Units of Fidelity Cash Fund - Super Institutional Daily Dividend Reinvestment at cost of Rs. 326.24 Crores
(36) 20,43,29,164 Units of Fidelity Ultra Short Term Debt Fund Super Institutional Plan Daily Dividend Reinvestment at cost ofRs. 204.38 Crores
(37) 2,50,00,000 Units of Fortis Flexible Short Term Plan - Series C - Dividend Payout at cost of Rs. 25.00 Crores
(38) 2,01,77,027 Units of Fortis Interval Fund Monthly Plan A - Dividend at cost of Rs. 20.18 Crores
(39) 2,00,00,000 Units of Fortis Interval Fund Quarterly Plan H - Dividend - Payout at cost of Rs. 20.00 Crores

Schedules to the Accounts
7. Investments (Contd.)
(40) 1,00,00,000 Units of Fortis Interval Fund - Quarterly Plan I - Quarterly Dividend - Reinvestment at cost of Rs. 10.00 Crores
(41) 1,50,00,000 Units of Fortis Interval Fund - Quarterly Plan L - Interval Dividend - Reinvestment at cost of Rs. 15.00 Crores
(42) 2,00,00,000 Units of Fortis Interval Fund - Series 2 - Quarterly Plan M - Interval Dividend at cost of Rs. 20.00 Crores
(43) 17,19,76,765 Units of Fortis Overnight Fund - Institutional Plus Plan Daily Dividend at cost of Rs. 172.03 Crores
(44) 7,90,78,951 Units of Fortis Short Term Income Fund Institutional Plus Daily Dividend Reinvestment at cost of Rs. 79.09 Crores
(45) 10,07,59,351 Units of HDFC Cash Management Fund Call Plan Daily Dividend Reinvestment at cost of Rs. 105.06 Crores
(46) 56,34,01,880 Units of HDFC Cash Management Fund - Saving Plan - Daily Dividend Reinvestment at cost of Rs. 599.26 Crores
(47) 18,53,81,873 Units of HDFC Cash Management Treasury Advantage Wholesale Plan Daily Dividend at cost of Rs. 185.97 Crores
(48) 17,31,06,944 Units of HDFC Floating Rate Income Fund STP Wholesale Daily Dividend Reinvestment at cost of Rs. 174.51 Crores
(49) 1,00,00,000 Units of HDFC FMP 90D June 2008 (VIII) 2 Wholesale Plan Dividend Pay at cost of Rs. 10.00 Crores
(50) 1,00,00,000 Units of HDFC FMP 90D July 2008 (VIII)(1) Wholesale Plan Dividend at cost of Rs. 10.00 Crores
(51) 2,00,00,000 Units of HDFC FMP 90D July 2008 (IX)(2) Wholesale Plan Dividend Payout at cost of Rs. 20.00 Crores
(52) 2,50,00,000 Units of HDFC FMP 90D September 2008 (VIII)(4) Wholesale Plan Dividend Pay at cost of Rs. 25.00 Crores
(53) 1,00,00,000 Units of HDFC FMP 90D November 2008 (X)(1) Wholesale Plan Dividend Pay at cost of Rs. 10.00 Crores
(54) 16,65,133 Units of HDFC Gilt Fund - Long Term Plan - Quarterly Dividend Reinvestment at cost of Rs. 2.00 Crores
(55) 6,63,78,287 Units of HDFC High Interest Fund - Quarterly Dividend - Reinvestment at cost of Rs. 80.02 Crores
(56) 2,00,00,000 Units of HDFC Quarterly Interval Fund Plan B Wholesale Dividend at cost of Rs. 20.00 Crores
(57) 38,74,69,306 Units of HSBC Cash Fund Institutional Plus Daily Dividend at cost of Rs. 387.69 Crores
(58) 1,53,02,655 Units of HSBC Fixed Term Series - 58 Institutional Dividend at cost of Rs. 15.30 Crores
(59) 2,04,43,382 Units of HSBC Fixed Term Series - 60 Institutional Dividend at cost of Rs. 20.44 Crores
(60) 2,04,90,983 Units of HSBC Fixed Term Series - 68 Institutional Dividend at cost of Rs. 20.49 Crores
(61) 5,20,22,565 Units of HSBC Floating Rate - Long Term - Institutional Daily Dividend Reinvestment at cost of Rs. 52.10 Crores
(62) 2,04,25,526 Units of HSBC Interval Fund - Plan 1 - Institutional Dividend Reinvestment at cost of Rs. 20.43 Crores
(63) 64,36,90,144 Units of HSBC Ultra Short Term Debt Fund Institutional Plus Daily Dividend at cost of Rs. 644.50 Crores
(64) 5,00,00,000 Units of ICICI Prudential FMP Series 44 - One Month Plan B Retail Dividend Payout at cost of Rs. 50.00 Crores
(65) 2,00,00,000 Units of ICICI Prudential FMP Series 44 - One Month Plan C Retail Dividend Payout at cost of Rs. 20.00 Crores
(66) 1,50,00,000 Units of ICICI Prudential Interval Fund I Quarterly Interval Plan Institutional Dividend Payout at cost of Rs. 15.00 Crores
(67) 6,18,14,741 Units of IDFC Dynamic Bond Fund - Plan B - Dividend at cost of Rs. 67.01 Crores
(68) 1,00,00,000 Units of IDFC Fixed Maturity Plan Quarterly Series 46 Dividend at cost of Rs. 10.00 Crores
(69) 2,00,00,000 Units of IDFC FMP Monthly Series 3 Dividend at cost of Rs. 20.00 Crores
(70) 1,50,00,000 Units of IDFC FMP Quarterly Series 32 Dividend at cost of Rs. 15.00 Crores
(71) 2,00,00,000 Units of IDFC FMP Quarterly Series 36 Dividend at cost of Rs. 20.00 Crores
(72) 2,00,00,000 Units of IDFC FMP Quarterly Series 39 Dividend at cost of Rs. 20.00 Crores
(73) 2,00,00,000 Units of IDFC FMP Quarterly Series 41 Dividend at cost of Rs. 20.00 Crores
(74) 1,00,00,000 Units of IDFC FMP Quarterly Series 44 Dividend at cost of Rs. 10.00 Crores
(75) 99,91,421 Units of IDFC Liquidity Manager - Daily Dividend at cost of Rs. 10.00 Crores
(76) 30,29,11,141 Units of IDFC Money Manager Fund Treasury Plan B Institutional Daily Dividend at cost of Rs. 305.04 Crores
(77) 1,99,63,716 Units of IDFC Quarterly Interval Fund Plan A Institutional Dividend at cost of Rs. 20.00 Crores
(78) 3,02,41,333 Units of IDFC Super Saver Income Fund - Investment Plan - Plan A Quarterly Dividend Reinvestment at cost ofRs. 35.87 Crores
(79) 1,28,33,84,526 Units of ING Liquid Fund Super Institutional - Daily Dividend at cost of Rs. 1,284.00 Crores
(80) 37,15,08,849 Units of ING Treasury Advantage Fund - Institutional Daily Dividend Option at cost of Rs. 371.63 Crores
ITC Report and Accounts 200996
Schedules to the Accounts
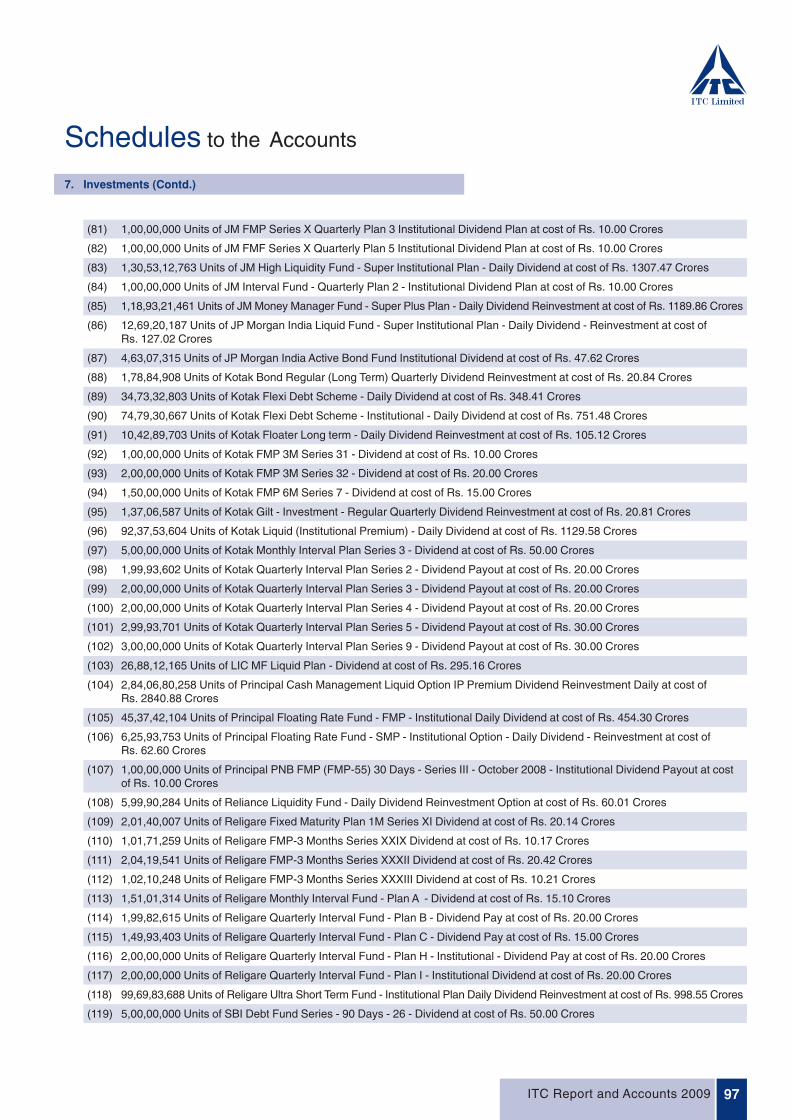
7. Investments (Contd.)
(81) 1,00,00,000 Units of JM FMP Series X Quarterly Plan 3 Institutional Dividend Plan at cost of Rs. 10.00 Crores
(82) 1,00,00,000 Units of JM FMF Series X Quarterly Plan 5 Institutional Dividend Plan at cost of Rs. 10.00 Crores
(83) 1,30,53,12,763 Units of JM High Liquidity Fund - Super Institutional Plan - Daily Dividend at cost of Rs. 1307.47 Crores
(84) 1,00,00,000 Units of JM Interval Fund - Quarterly Plan 2 - Institutional Dividend Plan at cost of Rs. 10.00 Crores
(85) 1,18,93,21,461 Units of JM Money Manager Fund - Super Plus Plan - Daily Dividend Reinvestment at cost of Rs. 1189.86 Crores
(86) 12,69,20,187 Units of JP Morgan India Liquid Fund - Super Institutional Plan - Daily Dividend - Reinvestment at cost ofRs. 127.02 Crores
(87) 4,63,07,315 Units of JP Morgan India Active Bond Fund Institutional Dividend at cost of Rs. 47.62 Crores
(88) 1,78,84,908 Units of Kotak Bond Regular (Long Term) Quarterly Dividend Reinvestment at cost of Rs. 20.84 Crores
(89) 34,73,32,803 Units of Kotak Flexi Debt Scheme - Daily Dividend at cost of Rs. 348.41 Crores
(90) 74,79,30,667 Units of Kotak Flexi Debt Scheme - Institutional - Daily Dividend at cost of Rs. 751.48 Crores
(91) 10,42,89,703 Units of Kotak Floater Long term - Daily Dividend Reinvestment at cost of Rs. 105.12 Crores
(92) 1,00,00,000 Units of Kotak FMP 3M Series 31 - Dividend at cost of Rs. 10.00 Crores
(93) 2,00,00,000 Units of Kotak FMP 3M Series 32 - Dividend at cost of Rs. 20.00 Crores
(94) 1,50,00,000 Units of Kotak FMP 6M Series 7 - Dividend at cost of Rs. 15.00 Crores
(95) 1,37,06,587 Units of Kotak Gilt - Investment - Regular Quarterly Dividend Reinvestment at cost of Rs. 20.81 Crores
(96) 92,37,53,604 Units of Kotak Liquid (Institutional Premium) - Daily Dividend at cost of Rs. 1129.58 Crores
(97) 5,00,00,000 Units of Kotak Monthly Interval Plan Series 3 - Dividend at cost of Rs. 50.00 Crores
(98) 1,99,93,602 Units of Kotak Quarterly Interval Plan Series 2 - Dividend Payout at cost of Rs. 20.00 Crores
(99) 2,00,00,000 Units of Kotak Quarterly Interval Plan Series 3 - Dividend Payout at cost of Rs. 20.00 Crores
(100) 2,00,00,000 Units of Kotak Quarterly Interval Plan Series 4 - Dividend Payout at cost of Rs. 20.00 Crores
(101) 2,99,93,701 Units of Kotak Quarterly Interval Plan Series 5 - Dividend Payout at cost of Rs. 30.00 Crores
(102) 3,00,00,000 Units of Kotak Quarterly Interval Plan Series 9 - Dividend Payout at cost of Rs. 30.00 Crores
(103) 26,88,12,165 Units of LIC MF Liquid Plan - Dividend at cost of Rs. 295.16 Crores
(104) 2,84,06,80,258 Units of Principal Cash Management Liquid Option IP Premium Dividend Reinvestment Daily at cost ofRs. 2840.88 Crores
(105) 45,37,42,104 Units of Principal Floating Rate Fund - FMP - Institutional Daily Dividend at cost of Rs. 454.30 Crores
(106) 6,25,93,753 Units of Principal Floating Rate Fund - SMP - Institutional Option - Daily Dividend - Reinvestment at cost ofRs. 62.60 Crores
(107) 1,00,00,000 Units of Principal PNB FMP (FMP-55) 30 Days - Series III - October 2008 - Institutional Dividend Payout at costof Rs. 10.00 Crores
(108) 5,99,90,284 Units of Reliance Liquidity Fund - Daily Dividend Reinvestment Option at cost of Rs. 60.01 Crores
(109) 2,01,40,007 Units of Religare Fixed Maturity Plan 1M Series XI Dividend at cost of Rs. 20.14 Crores
(110) 1,01,71,259 Units of Religare FMP-3 Months Series XXIX Dividend at cost of Rs. 10.17 Crores
(111) 2,04,19,541 Units of Religare FMP-3 Months Series XXXII Dividend at cost of Rs. 20.42 Crores
(112) 1,02,10,248 Units of Religare FMP-3 Months Series XXXIII Dividend at cost of Rs. 10.21 Crores
(113) 1,51,01,314 Units of Religare Monthly Interval Fund - Plan A - Dividend at cost of Rs. 15.10 Crores
(114) 1,99,82,615 Units of Religare Quarterly Interval Fund - Plan B - Dividend Pay at cost of Rs. 20.00 Crores
(115) 1,49,93,403 Units of Religare Quarterly Interval Fund - Plan C - Dividend Pay at cost of Rs. 15.00 Crores
(116) 2,00,00,000 Units of Religare Quarterly Interval Fund - Plan H - Institutional - Dividend Pay at cost of Rs. 20.00 Crores
(117) 2,00,00,000 Units of Religare Quarterly Interval Fund - Plan I - Institutional Dividend at cost of Rs. 20.00 Crores
(118) 99,69,83,688 Units of Religare Ultra Short Term Fund - Institutional Plan Daily Dividend Reinvestment at cost of Rs. 998.55 Crores
(119) 5,00,00,000 Units of SBI Debt Fund Series - 90 Days - 26 - Dividend at cost of Rs. 50.00 Crores
ITC Report and Accounts 2009 97
Schedules to the Accounts
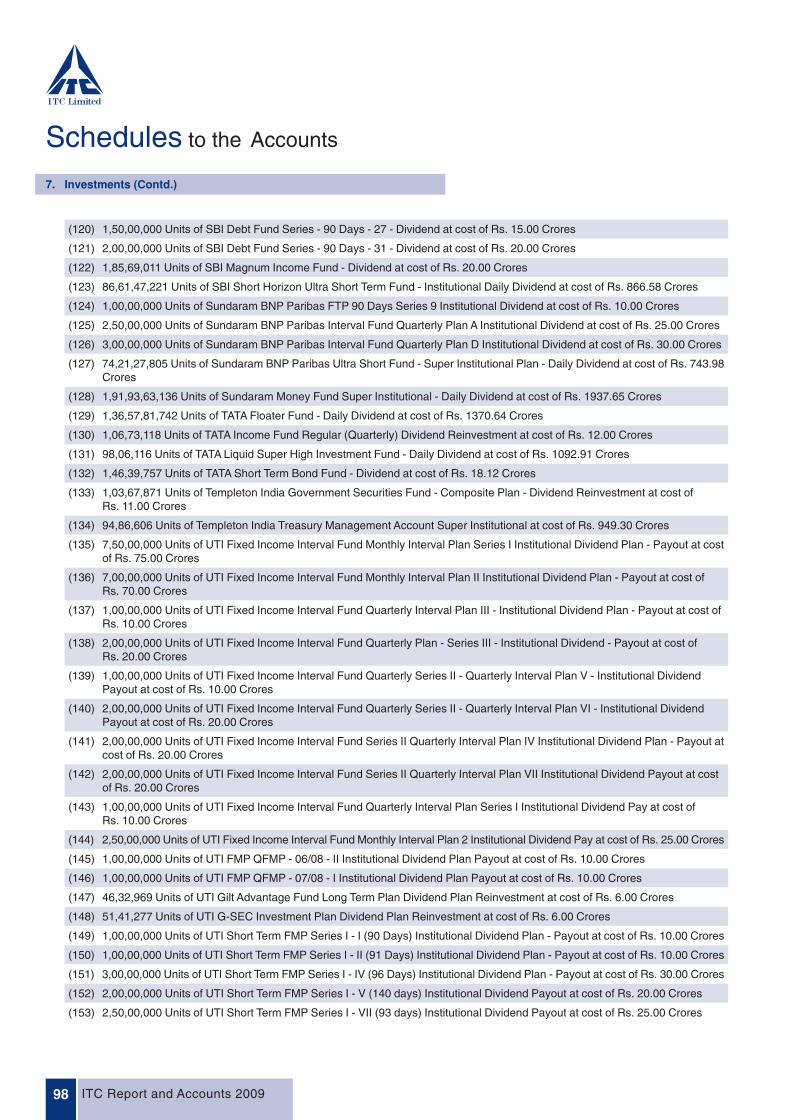
7. Investments (Contd.)
(120) 1,50,00,000 Units of SBI Debt Fund Series - 90 Days - 27 - Dividend at cost of Rs. 15.00 Crores
(121) 2,00,00,000 Units of SBI Debt Fund Series - 90 Days - 31 - Dividend at cost of Rs. 20.00 Crores
(122) 1,85,69,011 Units of SBI Magnum Income Fund - Dividend at cost of Rs. 20.00 Crores
(123) 86,61,47,221 Units of SBI Short Horizon Ultra Short Term Fund - Institutional Daily Dividend at cost of Rs. 866.58 Crores
(124) 1,00,00,000 Units of Sundaram BNP Paribas FTP 90 Days Series 9 Institutional Dividend at cost of Rs. 10.00 Crores
(125) 2,50,00,000 Units of Sundaram BNP Paribas Interval Fund Quarterly Plan A Institutional Dividend at cost of Rs. 25.00 Crores
(126) 3,00,00,000 Units of Sundaram BNP Paribas Interval Fund Quarterly Plan D Institutional Dividend at cost of Rs. 30.00 Crores
(127) 74,21,27,805 Units of Sundaram BNP Paribas Ultra Short Fund - Super Institutional Plan - Daily Dividend at cost of Rs. 743.98Crores
(128) 1,91,93,63,136 Units of Sundaram Money Fund Super Institutional - Daily Dividend at cost of Rs. 1937.65 Crores
(129) 1,36,57,81,742 Units of TATA Floater Fund - Daily Dividend at cost of Rs. 1370.64 Crores
(130) 1,06,73,118 Units of TATA Income Fund Regular (Quarterly) Dividend Reinvestment at cost of Rs. 12.00 Crores
(131) 98,06,116 Units of TATA Liquid Super High Investment Fund - Daily Dividend at cost of Rs. 1092.91 Crores
(132) 1,46,39,757 Units of TATA Short Term Bond Fund - Dividend at cost of Rs. 18.12 Crores
(133) 1,03,67,871 Units of Templeton India Government Securities Fund - Composite Plan - Dividend Reinvestment at cost ofRs. 11.00 Crores
(134) 94,86,606 Units of Templeton India Treasury Management Account Super Institutional at cost of Rs. 949.30 Crores
(135) 7,50,00,000 Units of UTI Fixed Income Interval Fund Monthly Interval Plan Series I Institutional Dividend Plan - Payout at costof Rs. 75.00 Crores
(136) 7,00,00,000 Units of UTI Fixed Income Interval Fund Monthly Interval Plan II Institutional Dividend Plan - Payout at cost ofRs. 70.00 Crores
(137) 1,00,00,000 Units of UTI Fixed Income Interval Fund Quarterly Interval Plan III - Institutional Dividend Plan - Payout at cost ofRs. 10.00 Crores
(138) 2,00,00,000 Units of UTI Fixed Income Interval Fund Quarterly Plan - Series III - Institutional Dividend - Payout at cost ofRs. 20.00 Crores
(139) 1,00,00,000 Units of UTI Fixed Income Interval Fund Quarterly Series II - Quarterly Interval Plan V - Institutional DividendPayout at cost of Rs. 10.00 Crores
(140) 2,00,00,000 Units of UTI Fixed Income Interval Fund Quarterly Series II - Quarterly Interval Plan VI - Institutional DividendPayout at cost of Rs. 20.00 Crores
(141) 2,00,00,000 Units of UTI Fixed Income Interval Fund Series II Quarterly Interval Plan IV Institutional Dividend Plan - Payout atcost of Rs. 20.00 Crores
(142) 2,00,00,000 Units of UTI Fixed Income Interval Fund Series II Quarterly Interval Plan VII Institutional Dividend Payout at costof Rs. 20.00 Crores
(143) 1,00,00,000 Units of UTI Fixed Income Interval Fund Quarterly Interval Plan Series I Institutional Dividend Pay at cost ofRs. 10.00 Crores
(144) 2,50,00,000 Units of UTI Fixed Income Interval Fund Monthly Interval Plan 2 Institutional Dividend Pay at cost of Rs. 25.00 Crores
(145) 1,00,00,000 Units of UTI FMP QFMP - 06/08 - II Institutional Dividend Plan Payout at cost of Rs. 10.00 Crores
(146) 1,00,00,000 Units of UTI FMP QFMP - 07/08 - I Institutional Dividend Plan Payout at cost of Rs. 10.00 Crores
(147) 46,32,969 Units of UTI Gilt Advantage Fund Long Term Plan Dividend Plan Reinvestment at cost of Rs. 6.00 Crores
(148) 51,41,277 Units of UTI G-SEC Investment Plan Dividend Plan Reinvestment at cost of Rs. 6.00 Crores
(149) 1,00,00,000 Units of UTI Short Term FMP Series I - I (90 Days) Institutional Dividend Plan - Payout at cost of Rs. 10.00 Crores
(150) 1,00,00,000 Units of UTI Short Term FMP Series I - II (91 Days) Institutional Dividend Plan - Payout at cost of Rs. 10.00 Crores
(151) 3,00,00,000 Units of UTI Short Term FMP Series I - IV (96 Days) Institutional Dividend Plan - Payout at cost of Rs. 30.00 Crores
(152) 2,00,00,000 Units of UTI Short Term FMP Series I - V (140 days) Institutional Dividend Payout at cost of Rs. 20.00 Crores
(153) 2,50,00,000 Units of UTI Short Term FMP Series I - VII (93 days) Institutional Dividend Payout at cost of Rs. 25.00 Crores
ITC Report and Accounts 200998

Schedules to the Accounts
With Scheduled Banks
On Current Accounts etc. 56.86 129.67
On Deposit Accounts 963.66 416.91
With Other Banks * … …
Cash and Cheques on hand 11.87 23.67
1032.39 570.25
Rs. 0.05 Crore (2008 - Rs. 0.05 Crore) on deposit in Karachi - Blocked Account considered doubtful, fully provided.
* Includes on Current Account Rs. 12,720/- (2008 - Rs. 12,720/-) with Post Office Savings Bank and maximum amount outstandingat any time during the year was Rs. 12,720/- (2008 - Rs. 12,720/-).
10. Cash and Bank Balances
ITC Report and Accounts 2009 99
As at As at31st March, 2009 31st March, 2008
(Rs. in Crores) (Rs. in Crores)
8. Inventories
Stores and Spare Parts 178.49 155.78
Raw Materials 2639.89 2743.70
Intermediates - Tissue Paper and Paper Board 49.50 50.65
Stock in Process 63.84 50.70
Finished Goods 1668.00 1049.69
4599.72 4050.52
(At lower of cost and net realisable value)
Over 6 months old
Good and Secured * 2.84 62.13
Good and Unsecured – From Subsidiaries 1.61 0.65
– From Others * 53.02 47.79
Doubtful and Unsecured – From Others 21.95 19.42
Other Debts
Good and Secured 9.04 7.75
Good and Unsecured – From Subsidiaries 11.47 12.61
– From Others 602.57 618.03
Doubtful and Unsecured – From Others 0.57 –
703.07 768.38
Less : Provision for Doubtful Debts 22.52 19.42
680.55 748.96
Less : Deposits from normal Trade Debtors - Contra 11.88 12.03
668.67 736.93
9. Sundry Debtors
* Includes amounts receivable on liquidation of legacy assets acquired as part and parcel of the schemes facilitating exit from the Financial Services and Edible Oil Businesses in 1997, Rs. Nil (2008 - Rs. 49.55 Crores).
Schedules to the Accounts
As at As at31st March, 2009 31st March, 2008
(Rs. in Crores) (Rs. in Crores)
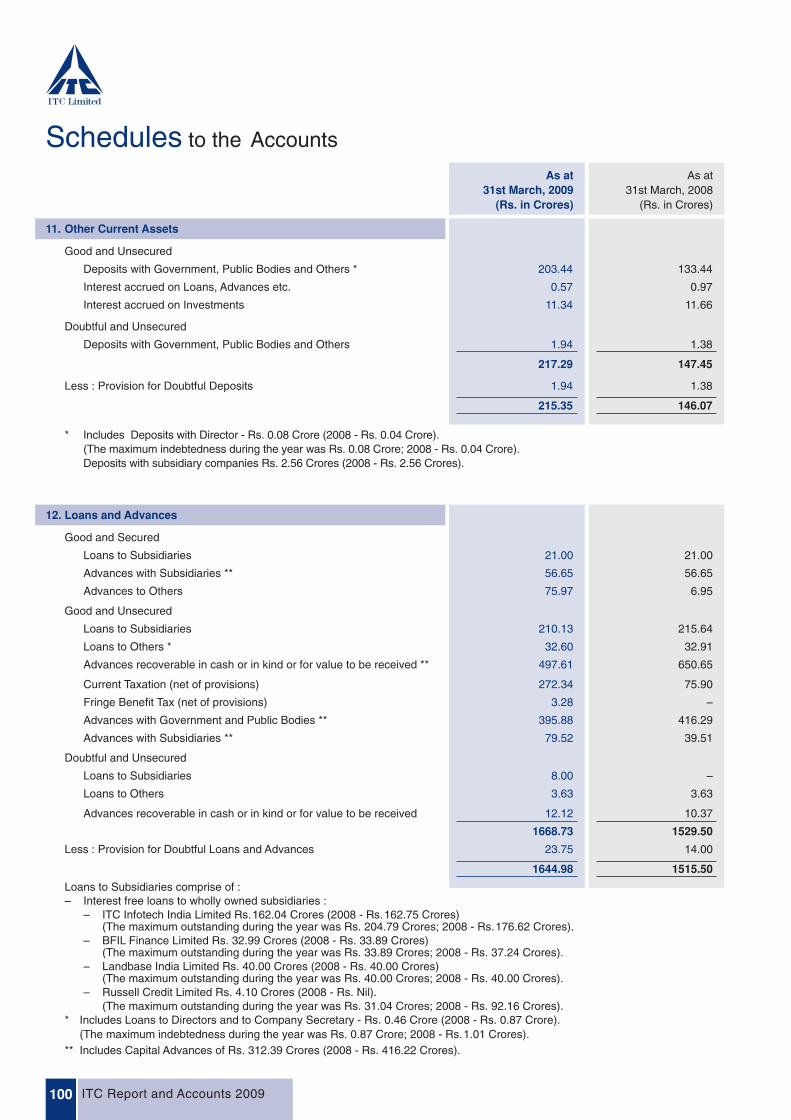
Good and Unsecured
Deposits with Government, Public Bodies and Others * 203.44 133.44
Interest accrued on Loans, Advances etc. 0.57 0.97
Interest accrued on Investments 11.34 11.66
Doubtful and Unsecured
Deposits with Government, Public Bodies and Others 1.94 1.38
217.29 147.45
Less : Provision for Doubtful Deposits 1.94 1.38
215.35 146.07
* Includes Deposits with Director - Rs. 0.08 Crore (2008 - Rs. 0.04 Crore).(The maximum indebtedness during the year was Rs. 0.08 Crore; 2008 - Rs. 0.04 Crore).Deposits with subsidiary companies Rs. 2.56 Crores (2008 - Rs. 2.56 Crores).
11. Other Current Assets
ITC Report and Accounts 2009100
Good and Secured
Loans to Subsidiaries 21.00 21.00
Advances with Subsidiaries ** 56.65 56.65
Advances to Others 75.97 6.95
Good and Unsecured
Loans to Subsidiaries 210.13 215.64
Loans to Others * 32.60 32.91
Advances recoverable in cash or in kind or for value to be received ** 497.61 650.65
Current Taxation (net of provisions) 272.34 75.90
Fringe Benefit Tax (net of provisions) 3.28 –
Advances with Government and Public Bodies ** 395.88 416.29
Advances with Subsidiaries ** 79.52 39.51
Doubtful and Unsecured
Loans to Subsidiaries 8.00 –
Loans to Others 3.63 3.63
Advances recoverable in cash or in kind or for value to be received 12.12 10.37
1668.73 1529.50
Less : Provision for Doubtful Loans and Advances 23.75 14.00
1644.98 1515.50
Loans to Subsidiaries comprise of : – Interest free loans to wholly owned subsidiaries :
– ITC Infotech India Limited Rs.162.04 Crores (2008 - Rs.162.75 Crores)(The maximum outstanding during the year was Rs. 204.79 Crores; 2008 - Rs.176.62 Crores).
– BFIL Finance Limited Rs. 32.99 Crores (2008 - Rs. 33.89 Crores)(The maximum outstanding during the year was Rs. 33.89 Crores; 2008 - Rs. 37.24 Crores).
– Landbase India Limited Rs. 40.00 Crores (2008 - Rs. 40.00 Crores)(The maximum outstanding during the year was Rs. 40.00 Crores; 2008 - Rs. 40.00 Crores).
– Russell Credit Limited Rs. 4.10 Crores (2008 - Rs. Nil).(The maximum outstanding during the year was Rs. 31.04 Crores; 2008 - Rs. 92.16 Crores).
* Includes Loans to Directors and to Company Secretary - Rs. 0.46 Crore (2008 - Rs. 0.87 Crore). (The maximum indebtedness during the year was Rs. 0.87 Crore; 2008 - Rs.1.01 Crores).
** Includes Capital Advances of Rs. 312.39 Crores (2008 - Rs. 416.22 Crores).
12. Loans and Advances
Schedules to the Accounts
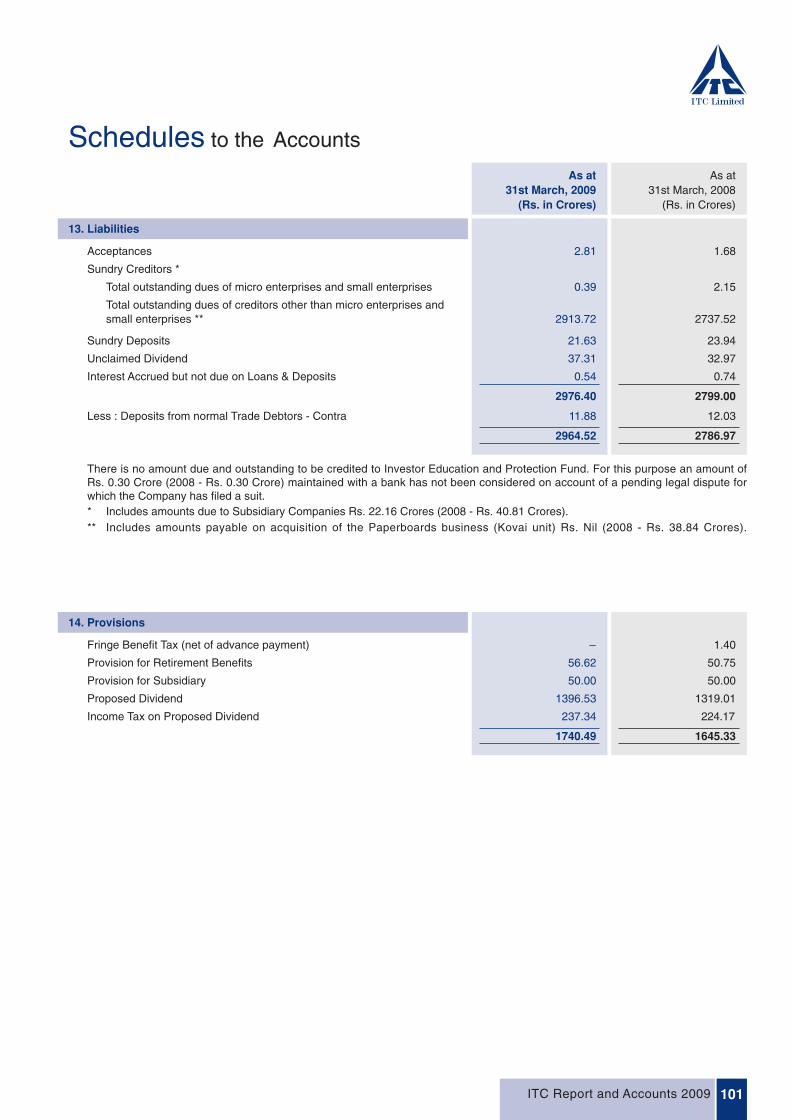
Fringe Benefit Tax (net of advance payment) – 1.40
Provision for Retirement Benefits 56.62 50.75
Provision for Subsidiary 50.00 50.00
Proposed Dividend 1396.53 1319.01
Income Tax on Proposed Dividend 237.34 224.17
1740.49 1645.33
14. Provisions
ITC Report and Accounts 2009 101
As at As at31st March, 2009 31st March, 2008
(Rs. in Crores) (Rs. in Crores)
Acceptances 2.81 1.68
Sundry Creditors *
Total outstanding dues of micro enterprises and small enterprises 0.39 2.15
Total outstanding dues of creditors other than micro enterprises andsmall enterprises ** 2913.72 2737.52
Sundry Deposits 21.63 23.94
Unclaimed Dividend 37.31 32.97
Interest Accrued but not due on Loans & Deposits 0.54 0.74
2976.40 2799.00
Less : Deposits from normal Trade Debtors - Contra 11.88 12.03
2964.52 2786.97
There is no amount due and outstanding to be credited to Investor Education and Protection Fund. For this purpose an amount ofRs. 0.30 Crore (2008 - Rs. 0.30 Crore) maintained with a bank has not been considered on account of a pending legal dispute forwhich the Company has filed a suit.* Includes amounts due to Subsidiary Companies Rs. 22.16 Crores (2008 - Rs. 40.81 Crores).** Includes amounts payable on acquisition of the Paperboards business (Kovai unit) Rs. Nil (2008 - Rs. 38.84 Crores).
13. Liabilities
Schedules to the Accounts
ITC Report and Accounts 2009102
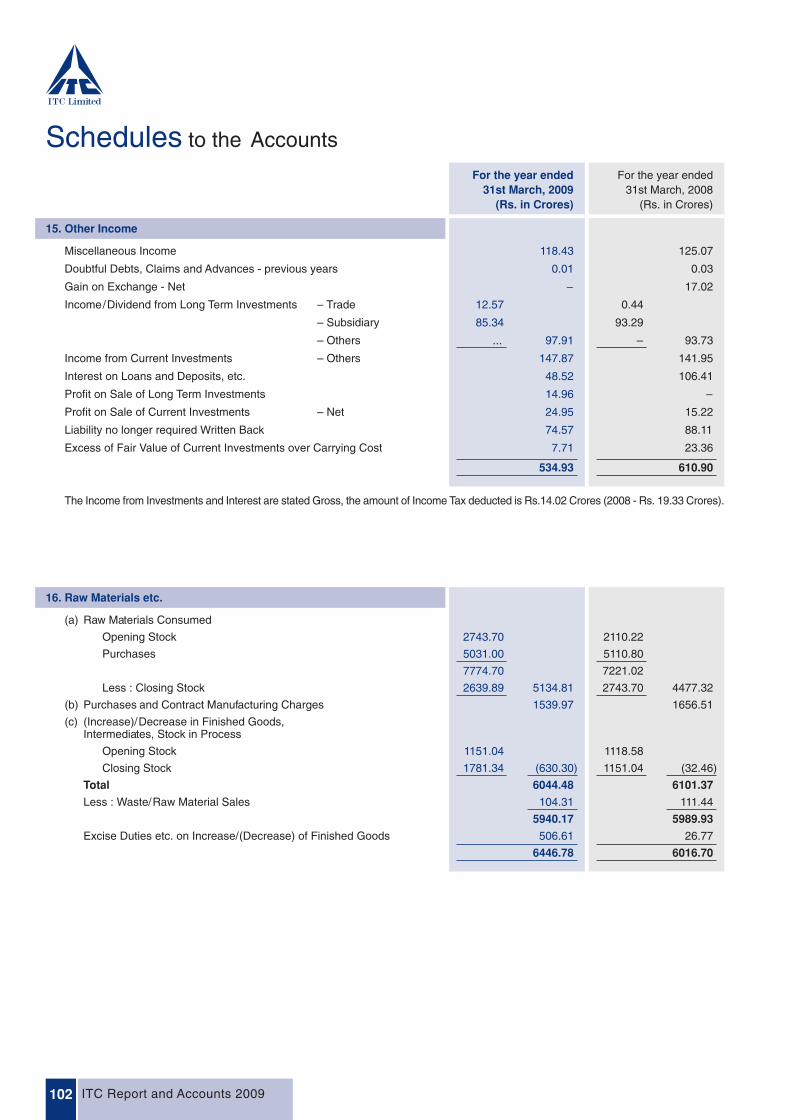
16. Raw Materials etc.
(a) Raw Materials Consumed
Opening Stock 2743.70 2110.22
Purchases 5031.00 5110.80
7774.70 7221.02
Less : Closing Stock 2639.89 5134.81 2743.70 4477.32
(b) Purchases and Contract Manufacturing Charges 1539.97 1656.51
(c) (Increase)/Decrease in Finished Goods,Intermediates, Stock in Process
Opening Stock 1151.04 1118.58
Closing Stock 1781.34 (630.30) 1151.04 (32.46)
Total 6044.48 6101.37
Less : Waste/Raw Material Sales 104.31 111.44
5940.17 5989.93
Excise Duties etc. on Increase/(Decrease) of Finished Goods 506.61 26.77
6446.78 6016.70
Miscellaneous Income 118.43 125.07
Doubtful Debts, Claims and Advances - previous years 0.01 0.03
Gain on Exchange - Net – 17.02
Income/Dividend from Long Term Investments – Trade 12.57 0.44
– Subsidiary 85.34 93.29
– Others ... 97.91 – 93.73
Income from Current Investments – Others 147.87 141.95
Interest on Loans and Deposits, etc. 48.52 106.41
Profit on Sale of Long Term Investments 14.96 –
Profit on Sale of Current Investments – Net 24.95 15.22
Liability no longer required Written Back 74.57 88.11
Excess of Fair Value of Current Investments over Carrying Cost 7.71 23.36
534.93 610.90
The Income from Investments and Interest are stated Gross, the amount of Income Tax deducted is Rs.14.02 Crores (2008 - Rs. 19.33 Crores).
15. Other Income
For the year ended For the year ended31st March, 2009 31st March, 2008
(Rs. in Crores) (Rs. in Crores)

Schedules to the Accounts
17. Manufacturing, Selling etc. Expenses
For the year ended For the year ended31st March, 2009 31st March, 2008
(Rs. in Crores) (Rs. in Crores)
ITC Report and Accounts 2009 103
Salaries / Wages and Bonus 733.57 610.24Contribution to Provident and Other Funds 69.64 50.41Workmen and Staff Welfare Expenses 100.16 84.35
903.37 745.00Less : Recoveries 12.49 890.88 11.68 733.32Power and Fuel 394.12 309.90Consumption of Stores and Spare Parts 189.19 173.96Rent 156.29 120.42Rates and Taxes 42.08 41.95Insurance 26.93 35.26Repairs
– Buildings 37.92 32.83– Machinery 87.04 73.52– Others 55.27 39.91
Outward Freight and Handling Charges 461.40 548.40Advertising / Sales Promotion 502.30 377.54Market Research 43.47 37.94Design and Product Development 65.68 26.07Hotel Reservation / Marketing Expenses 28.63 30.11Brokerage and Discount - Sales 7.57 4.75Commission to Selling Agents 25.04 25.91Doubtful and Bad Debts 6.20 6.01Doubtful and Bad Advances, Deposits etc. 9.01 0.70Bank and Credit Card Charges 19.27 20.52Information Technology Services 146.83 138.27Travelling and Conveyance 148.63 140.23Training and Development 16.54 12.99Legal Expenses 15.48 14.27Consultancy / Professional Fees 55.22 48.13Postage, Telephone etc. 26.52 26.42Printing and Stationery 9.25 8.78Loss on Exchange (Net) 23.26 –Interest etc. Paid – Term Loans, etc. 9.20 6.34
– Others 19.18 10.93Less : Interest Received on Trading Debts,
Deposits with Government Bodies etc. 10.06 18.32 12.66 4.61Fixed Assets and Stores Discarded - Net 21.94 18.92Miscellaneous Expenses 643.38 592.61
4173.66 3644.25Deduct : Transfers to Fixed Assets etc. Accounts 72.55 112.75
4101.11 3531.50Miscellaneous Expenses include :(1) Auditors' Remuneration and Expenses (excluding taxes)
Audit Fees 1.25 1.25Tax Audit Fees 0.38 0.38Fees for Limited Review 0.45 0.45Fees for Other Services 0.56 0.52Reimbursement of Expenses 0.04 0.17
(2) Cost Auditors’ Fee 0.04 0.04
Interest received on Trading Debts, Deposits with Govt. Bodies etc. is stated Gross, the amount of Income Tax deducted is Rs.0.88 Crore (2008 - Rs. 1.29 Crores).

Schedules to the Accounts
For the year ended For the year ended31st March, 2009 31st March, 2008
(Rs. in Crores) (Rs. in Crores)
Income Tax for the year :
Current Tax 1232.07 1374.30
Deferred Tax 307.12 82.70
Fringe Benefit Tax 25.94 23.97
1565.13 1480.97
Less : Adjustments related to previous years - Net
Current Tax 16.76 18.82
Deferred Tax (15.00) 10.48
Fringe Benefit Tax 1.22 –
2.98 29.30
1562.15 1451.67
18. Provision for Taxation
(i) Exchange difference in respect of forward exchange contracts to be recognised in the Profit and Loss Account in the subsequentaccounting period amounts to Rs. 0.26 Crore (2008 - Rs. 0.46 Crore).
(ii) (a) Claims against the Company not acknowledged as debts Rs. 261.36 Crores (2008 - Rs. 278.89 Crores). These comprise:
Excise Duty, Sales Taxes and other Indirect Taxes claims disputed by the Company relating to issues of applicability andclassification aggregating Rs. 205.41 Crores (2008 - Rs. 200.27 Crores).
Local Authority Taxes / Cess / Royalty on property, utilities, etc. claims disputed by the Company relating to issues ofapplicability and determination aggregating Rs. 38.98 Crores (2008 - Rs. 37.34 Crores).
Third party claims arising from disputes relating to contracts aggregating Rs. 14.05 Crores (2008 - Rs. 37.01 Crores).
Other matters Rs. 2.92 Crores (2008 - Rs. 4.27 Crores).
(b) Guarantees and Counter Guarantees outstanding
– Excise Rs. 4.24 Crores (2008 - Rs. 4.24 Crores).
– Others Rs. Nil (2008 - Rs. 5.00 Crores).
(c) Uncalled liability on shares partly paid Rs. 26.40 Crores (2008 - Rs. 26.40 Crores).
2009 2008(iii) Earnings per share
Earnings per share has been computed as under :
(a) Profit after Taxation (Rs. Crores) 3263.59 3120.10
(b) Weighted average number of Ordinary Shares outstanding 3,77,02,64,256 3,76,41,67,486
(c) Effect of potential Ordinary Shares on Employee Stock Optionsoutstanding 52,89,015 1,86,32,015
(d) Weighted average number of Ordinary Shares in computingdiluted earnings per share [(b)+ (c)] 3,77,55,53,271 3,78,27,99,501
(e) Earnings per share on profit after taxation(Face Value Re. 1.00 per share)
– Basic [(a)/(b)] Rs. 8.66 Rs. 8.29
– Diluted [(a)/(d)] Rs. 8.64 Rs. 8.25
(iv) The status on excise matters which is treated as an annexure to these accounts are as outlined in this year’s Report of the Directors& Management Discussion and Analysis under the Excise section. In the opinion of the Directors, the Company does not acceptany further liability.
19. Notes to the Accounts
ITC Report and Accounts 2009104
Schedules to the Accounts
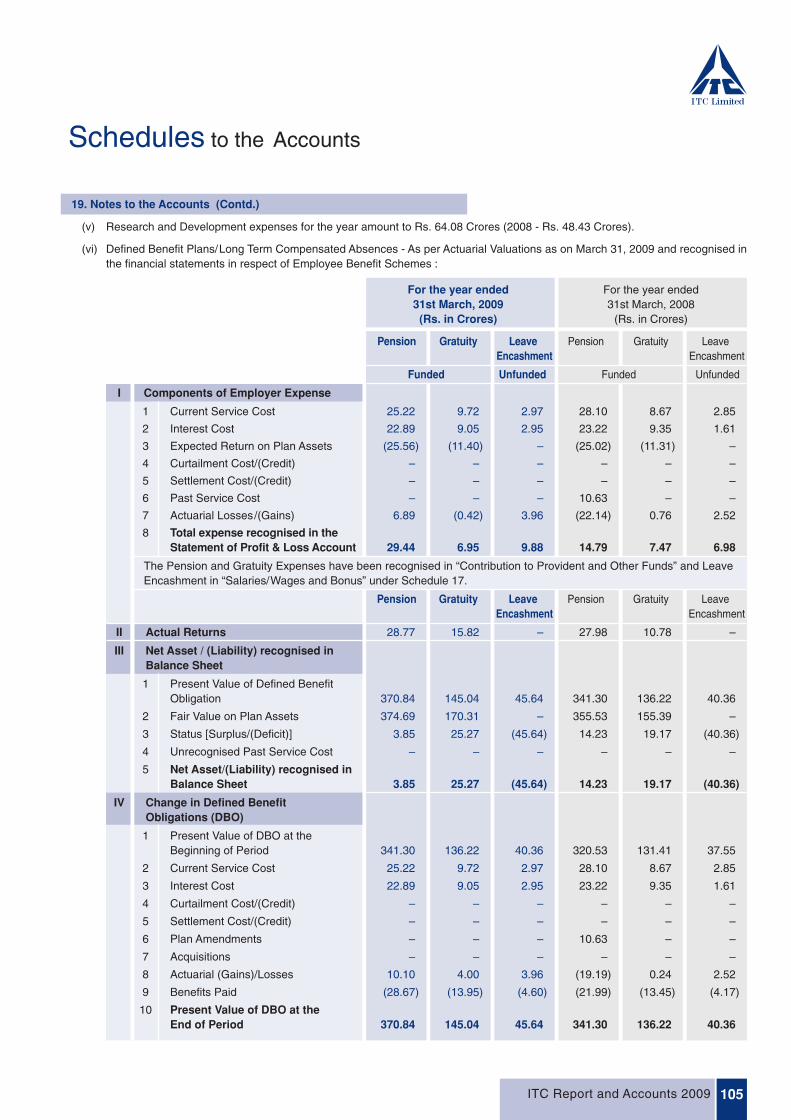
19. Notes to the Accounts (Contd.)
(v) Research and Development expenses for the year amount to Rs. 64.08 Crores (2008 - Rs. 48.43 Crores).
(vi) Defined Benefit Plans/Long Term Compensated Absences - As per Actuarial Valuations as on March 31, 2009 and recognised inthe financial statements in respect of Employee Benefit Schemes :
For the year ended For the year ended31st March, 2009 31st March, 2008
(Rs. in Crores) (Rs. in Crores)
Pension Gratuity Leave Pension Gratuity LeaveEncashment Encashment
Funded Unfunded Funded Unfunded
I Components of Employer Expense
1 Current Service Cost 25.22 9.72 2.97 28.10 8.67 2.85
2 Interest Cost 22.89 9.05 2.95 23.22 9.35 1.61
3 Expected Return on Plan Assets (25.56) (11.40) – (25.02) (11.31) –
4 Curtailment Cost/(Credit) – – – – – –
5 Settlement Cost/(Credit) – – – – – –
6 Past Service Cost – – – 10.63 – –
7 Actuarial Losses/(Gains) 6.89 (0.42) 3.96 (22.14) 0.76 2.52
8 Total expense recognised in theStatement of Profit & Loss Account 29.44 6.95 9.88 14.79 7.47 6.98
The Pension and Gratuity Expenses have been recognised in “Contribution to Provident and Other Funds” and LeaveEncashment in “Salaries/Wages and Bonus” under Schedule 17.
Pension Gratuity Leave Pension Gratuity LeaveEncashment Encashment
II Actual Returns 28.77 15.82 – 27.98 10.78 –
III Net Asset / (Liability) recognised inBalance Sheet
1 Present Value of Defined BenefitObligation 370.84 145.04 45.64 341.30 136.22 40.36
2 Fair Value on Plan Assets 374.69 170.31 – 355.53 155.39 –
3 Status [Surplus/(Deficit)] 3.85 25.27 (45.64) 14.23 19.17 (40.36)
4 Unrecognised Past Service Cost – – – – – –
5 Net Asset/(Liability) recognised inBalance Sheet 3.85 25.27 (45.64) 14.23 19.17 (40.36)
IV Change in Defined BenefitObligations (DBO)
1 Present Value of DBO at theBeginning of Period 341.30 136.22 40.36 320.53 131.41 37.55
2 Current Service Cost 25.22 9.72 2.97 28.10 8.67 2.85
3 Interest Cost 22.89 9.05 2.95 23.22 9.35 1.61
4 Curtailment Cost/(Credit) – – – – – –
5 Settlement Cost/(Credit) – – – – – –
6 Plan Amendments – – – 10.63 – –
7 Acquisitions – – – – – –
8 Actuarial (Gains)/Losses 10.10 4.00 3.96 (19.19) 0.24 2.52
9 Benefits Paid (28.67) (13.95) (4.60) (21.99) (13.45) (4.17)
10 Present Value of DBO at theEnd of Period 370.84 145.04 45.64 341.30 136.22 40.36
ITC Report and Accounts 2009 105

Schedules to the Accounts
19. Notes to the Accounts (Contd.)
For the year ended For the year ended31st March, 2009 31st March, 2008
(Rs. in Crores) (Rs. in Crores)
ITC Report and Accounts 2009106
Pension Gratuity Leave Pension Gratuity LeaveEncashment Encashment
V Change in Fair Value of Assets
1 Plan Assets at the Beginning of Period 355.53 155.39 – 311.77 146.08 –
2 Acquisition Adjustment – – – – – –
3 Expected Return on Plan Assets 25.56 11.40 – 25.02 11.31 –
4 Actuarial Gains/(Losses) 3.21 4.42 – 2.96 (0.53) –
5 Actual Company Contributions 19.06 13.05 – 37.77 11.98 –
6 Benefits Paid (28.67) (13.95) – (21.99) (13.45) –
7 Plan Assets at the End of Period 374.69 170.31 – 355.53 155.39 –
VI Actuarial Assumptions
1 Discount Rate (%) 7.00 7.00 7.00 7.50 7.50 7.50
2 Expected Return on Plan Assets (%) 7.00 7.00 – 7.50 7.50 –
The estimates of future salary increases, considered in actuarial valuations take account of inflation, seniority, promotion and other relevant factors such as supply and demand factors in the employment market.
VII Major Category of Plan Assetsas a % of the Total Plan Assets As at 31st March, 2009 As at 31st March, 2008
1 Government Securities/SpecialDeposit with RBI 32% 41%
2 High Quality Corporate Bonds 27% 22%
3 Insurance Companies 38% 29%
4 Mutual Funds 1% 6%
5 Cash and Cash Equivalents 2% 2%
VIII Basis used to determine the Expected Rate of Return on Plan Assets
The expected rate of return on plan assets is based on the current portfolio of assets, investment strategy and market scenario.In order to protect the capital and optimise returns within acceptable risk parameters, the plan assets are well diversified.
For the year ended For the year ended For the year ended31st March, 2009 31st March, 2008 31st March, 2007
(Rs. in Crores) (Rs. in Crores) (Rs. in Crores)
Pension Gratuity Leave Pension Gratuity Leave Pension Gratuity LeaveEncashment Encashment Encashment
IX Net Asset/(Liability) recognisedin Balance Sheet (includingexperience adjustment impact)
1 Present Value of DefinedBenefit Obligation 370.84 145.04 45.64 341.30 136.22 40.36 320.53 131.41 37.55
2 Fair Value on Plan Assets 374.69 170.31 – 355.53 155.39 – 311.77 146.08 –
3 Status [Surplus/(Deficit)] 3.85 25.27 (45.64) 14.23 19.17 (40.36) (8.76) 14.67 (37.55)
4 Experience Adjustment ofPlan Assets [Gain/(Loss)] 1.50 3.53 – 2.96 (0.53) – – – –
5 Experience Adjustment ofobligation [(Gain)/Loss] (18.42) (0.81) 2.96 (19.19) 0.24 2.52 – – –

Schedules to the Accounts
19. Notes to the Accounts (Contd.)
(x) Interests in Joint Ventures :
The Company’s interest, as a venturer, in jointly controlled entities (Incorporated Joint Ventures) is :
Name Country of Percentage of Percentage ofIncorporation Ownership Ownership
interests as at interests as at31st March, 2009 31st March, 2008
Maharaja Heritage Resorts Limited India 25% 50%
Sitel Operating Corporation India Limited India 34% 50% minus 1 share(Formerly CLI3L e-Services Limited)
The Company’s interest in these Joint Ventures is reported as Long Term Investments (Schedule -7) and stated at cost. However,the Company’s share of each of the assets, liabilities, income and expenses, etc. (each without elimination of the effect oftransactions between the Company and the Joint Venture) related to its interests in these Joint Ventures are :
As at As at31st March, 2009 31st March, 2008
(Rs. in Crores) (Rs. in Crores)
I ASSETS
1 Fixed Assets 1.58 4.65
2 Investments 10.18 17.03
3 Current Assets, Loans and Advancesa) Sundry Debtors 3.60 8.88b) Cash and Bank Balances 0.62 0.19c) Other Current Assets 0.54 1.89d) Loans and Advances 2.46 3.01
4 Deferred Tax - Net 0.02 0.04
II LIABILITIES
1 Secured Loans ... 0.01
2 Current Liabilities and Provisionsa) Liabilities 4.37 6.27b) Provisions 1.21 0.15
ITC Report and Accounts 2009 107
(vii) Micro and Medium scale business entities :
There are no Micro, Small and Medium Enterprises, to whom the Company owes dues, which are outstanding for more than45 days as at 31st March, 2009. This information as required to be disclosed under the Micro, Small and Medium EnterprisesDevelopment Act, 2006 has been determined to the extent such parties have been identified on the basis of information availablewith the Company.
(viii) The Company’s significant leasing arrangements are in respect of operating leases for premises (residential, office, stores, godownsetc.). These leasing arrangements which are not non-cancellable range between 11 months and 9 years generally, or longer, andare usually renewable by mutual consent on mutually agreeable terms. The aggregate lease rentals payable are charged as Rentunder Schedule 17.
(ix) The following donations were made to political parties during the year: Indian National Congress – Rs. 0.50 Crore(2008 - Rs. Nil), Bharatiya Janata Party – Rs. 0.50 Crore (2008 - Rs. Nil).
Schedules to the Accounts
19. Notes to the Accounts (Contd.)
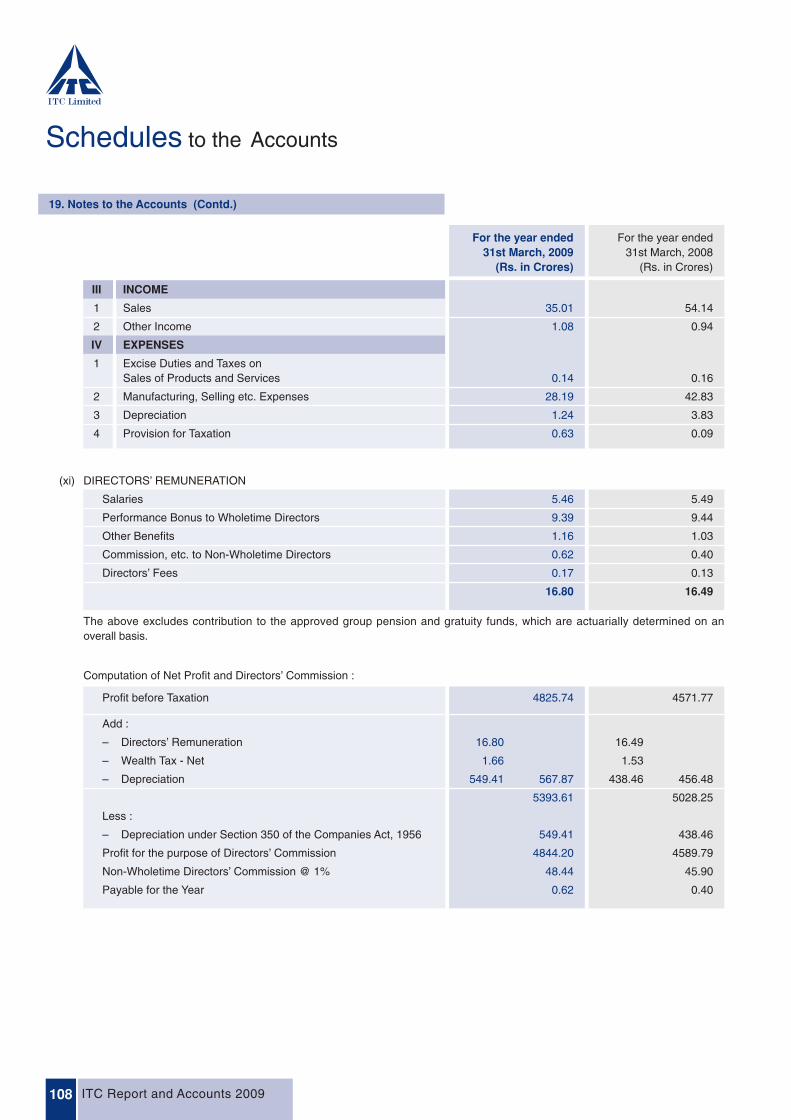
(xi) DIRECTORS’ REMUNERATION
Salaries 5.46 5.49
Performance Bonus to Wholetime Directors 9.39 9.44
Other Benefits 1.16 1.03
Commission, etc. to Non-Wholetime Directors 0.62 0.40
Directors’ Fees 0.17 0.13
16.80 16.49
The above excludes contribution to the approved group pension and gratuity funds, which are actuarially determined on anoverall basis.
Computation of Net Profit and Directors’ Commission :
Profit before Taxation 4825.74 4571.77
Add :
– Directors’ Remuneration 16.80 16.49
– Wealth Tax - Net 1.66 1.53
– Depreciation 549.41 567.87 438.46 456.48
5393.61 5028.25
Less :
– Depreciation under Section 350 of the Companies Act, 1956 549.41 438.46
Profit for the purpose of Directors’ Commission 4844.20 4589.79
Non-Wholetime Directors’ Commission @ 1% 48.44 45.90
Payable for the Year 0.62 0.40
ITC Report and Accounts 2009108
III INCOME
1 Sales 35.01 54.14
2 Other Income 1.08 0.94
IV EXPENSES
1 Excise Duties and Taxes onSales of Products and Services 0.14 0.16
2 Manufacturing, Selling etc. Expenses 28.19 42.83
3 Depreciation 1.24 3.83
4 Provision for Taxation 0.63 0.09
For the year ended For the year ended31st March, 2009 31st March, 2008
(Rs. in Crores) (Rs. in Crores)
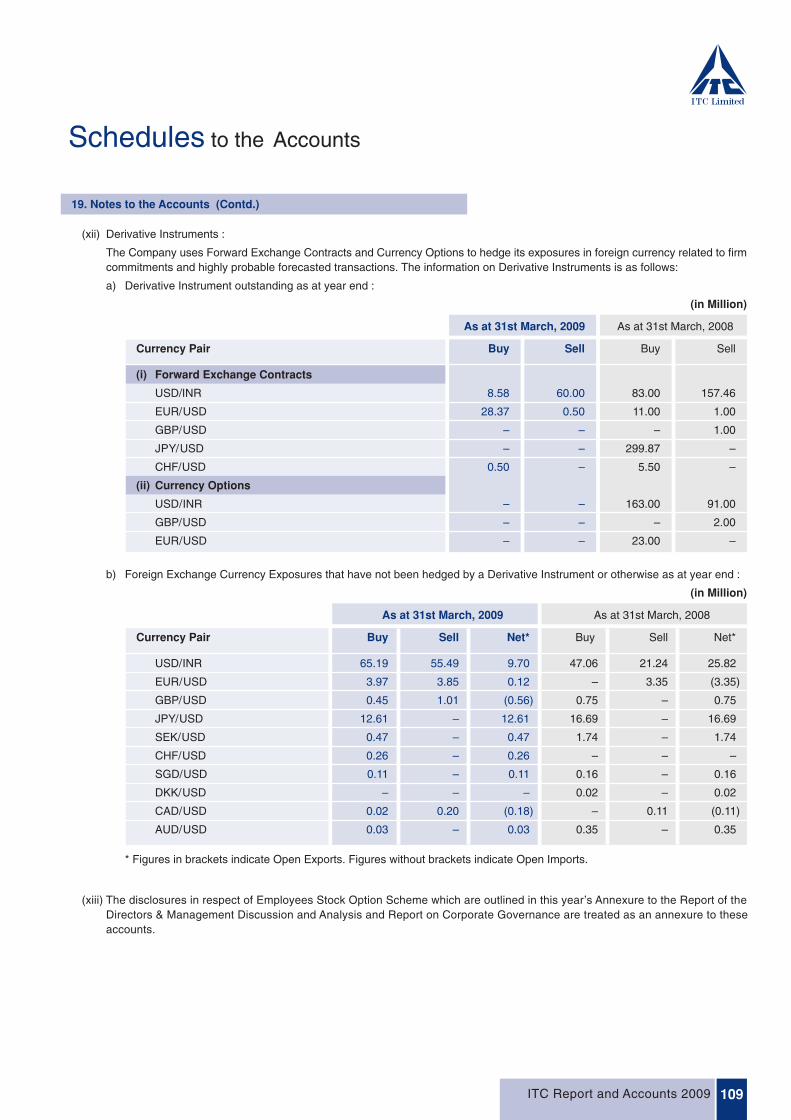
Schedules to the Accounts
19. Notes to the Accounts (Contd.)
(xii) Derivative Instruments :
The Company uses Forward Exchange Contracts and Currency Options to hedge its exposures in foreign currency related to firmcommitments and highly probable forecasted transactions. The information on Derivative Instruments is as follows:
a) Derivative Instrument outstanding as at year end :
(in Million)
As at 31st March, 2009 As at 31st March, 2008
Currency Pair Buy Sell Buy Sell
(i) Forward Exchange Contracts
USD/INR 8.58 60.00 83.00 157.46
EUR/USD 28.37 0.50 11.00 1.00
GBP/USD – – – 1.00
JPY/USD – – 299.87 –
CHF/USD 0.50 – 5.50 –
(ii) Currency Options
USD/INR – – 163.00 91.00
GBP/USD – – – 2.00
EUR/USD – – 23.00 –
b) Foreign Exchange Currency Exposures that have not been hedged by a Derivative Instrument or otherwise as at year end :
(in Million)
As at 31st March, 2009 As at 31st March, 2008
Currency Pair Buy Sell Net* Buy Sell Net*
USD/INR 65.19 55.49 9.70 47.06 21.24 25.82
EUR/USD 3.97 3.85 0.12 – 3.35 (3.35)
GBP/USD 0.45 1.01 (0.56) 0.75 – 0.75
JPY/USD 12.61 – 12.61 16.69 – 16.69
SEK/USD 0.47 – 0.47 1.74 – 1.74
CHF/USD 0.26 – 0.26 – – –
SGD/USD 0.11 – 0.11 0.16 – 0.16
DKK/USD – – – 0.02 – 0.02
CAD/USD 0.02 0.20 (0.18) – 0.11 (0.11)
AUD/USD 0.03 – 0.03 0.35 – 0.35
* Figures in brackets indicate Open Exports. Figures without brackets indicate Open Imports.
(xiii) The disclosures in respect of Employees Stock Option Scheme which are outlined in this year’s Annexure to the Report of theDirectors & Management Discussion and Analysis and Report on Corporate Governance are treated as an annexure to theseaccounts.
ITC Report and Accounts 2009 109
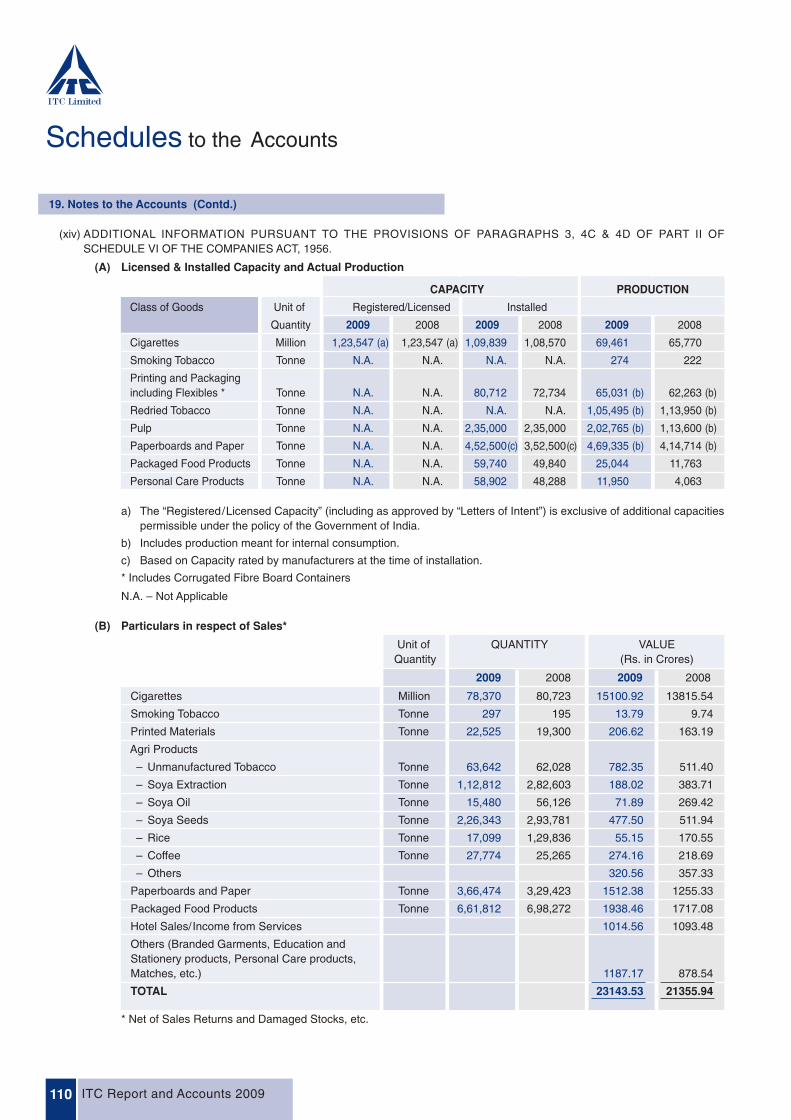
Schedules to the Accounts
19. Notes to the Accounts (Contd.)
ITC Report and Accounts 2009110
(xiv) ADDITIONAL INFORMATION PURSUANT TO THE PROVISIONS OF PARAGRAPHS 3, 4C & 4D OF PART II OFSCHEDULE VI OF THE COMPANIES ACT, 1956.
(A) Licensed & Installed Capacity and Actual Production
CAPACITY PRODUCTION
Class of Goods Unit of Registered/Licensed Installed
Quantity 2009 2008 2009 2008 2009 2008
Cigarettes Million 1,23,547 (a) 1,23,547 (a) 1,09,839 1,08,570 69,461 65,770
Smoking Tobacco Tonne N.A. N.A. N.A. N.A. 274 222
Printing and Packaging including Flexibles * Tonne N.A. N.A. 80,712 72,734 65,031 (b) 62,263 (b)
Redried Tobacco Tonne N.A. N.A. N.A. N.A. 1,05,495 (b) 1,13,950 (b)
Pulp Tonne N.A. N.A. 2,35,000 2,35,000 2,02,765 (b) 1,13,600 (b)
Paperboards and Paper Tonne N.A. N.A. 4,52,500(c) 3,52,500(c) 4,69,335 (b) 4,14,714 (b)
Packaged Food Products Tonne N.A. N.A. 59,740 49,840 25,044 11,763
Personal Care Products Tonne N.A. N.A. 58,902 48,288 11,950 4,063
a) The “Registered/Licensed Capacity” (including as approved by “Letters of Intent”) is exclusive of additional capacitiespermissible under the policy of the Government of India.
b) Includes production meant for internal consumption.
c) Based on Capacity rated by manufacturers at the time of installation.
* Includes Corrugated Fibre Board Containers
N.A. – Not Applicable
(B) Particulars in respect of Sales*
Unit of QUANTITY VALUEQuantity (Rs. in Crores)
2009 2008 2009 2008
Cigarettes Million 78,370 80,723 15100.92 13815.54
Smoking Tobacco Tonne 297 195 13.79 9.74
Printed Materials Tonne 22,525 19,300 206.62 163.19
Agri Products
– Unmanufactured Tobacco Tonne 63,642 62,028 782.35 511.40
– Soya Extraction Tonne 1,12,812 2,82,603 188.02 383.71
– Soya Oil Tonne 15,480 56,126 71.89 269.42
– Soya Seeds Tonne 2,26,343 2,93,781 477.50 511.94
– Rice Tonne 17,099 1,29,836 55.15 170.55
– Coffee Tonne 27,774 25,265 274.16 218.69
– Others 320.56 357.33
Paperboards and Paper Tonne 3,66,474 3,29,423 1512.38 1255.33
Packaged Food Products Tonne 6,61,812 6,98,272 1938.46 1717.08
Hotel Sales/ Income from Services 1014.56 1093.48
Others (Branded Garments, Education and Stationery products, Personal Care products, Matches, etc.) 1187.17 878.54
TOTAL 23143.53 21355.94
* Net of Sales Returns and Damaged Stocks, etc.
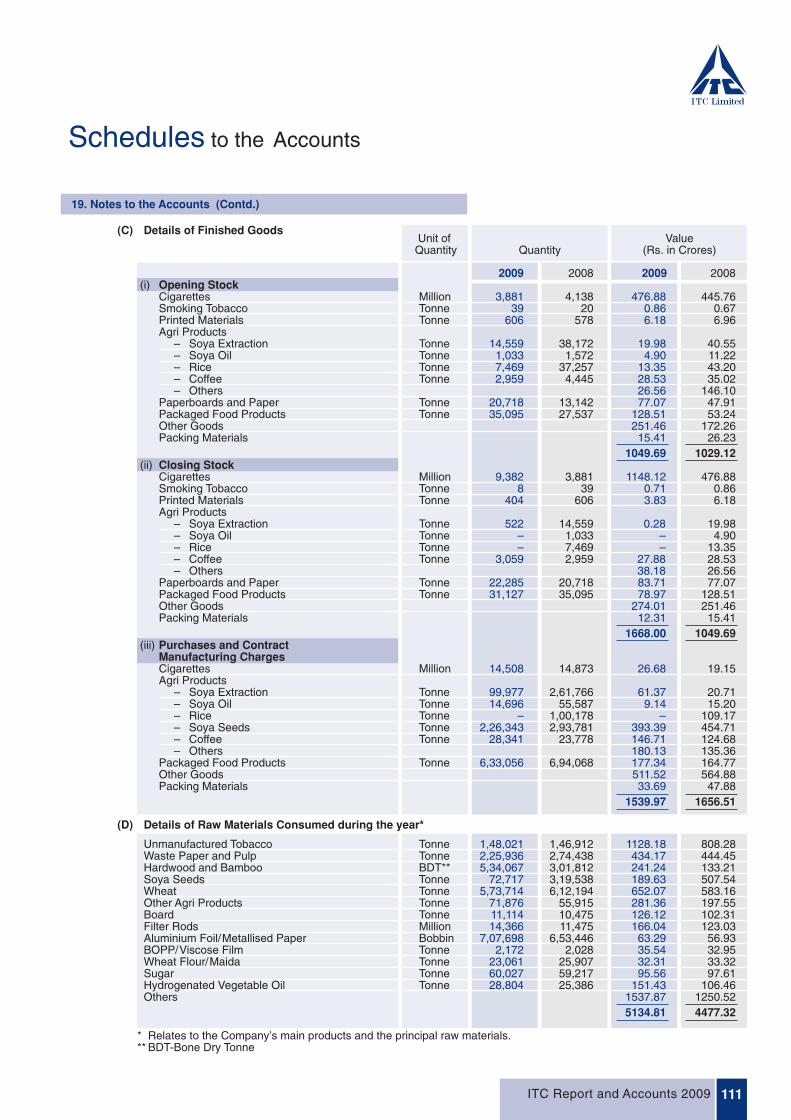
Schedules to the Accounts
19. Notes to the Accounts (Contd.)
(C) Details of Finished GoodsUnit of Value
Quantity Quantity (Rs. in Crores)
2009 2008 2009 2008(i) Opening Stock
Cigarettes Million 3,881 4,138 476.88 445.76Smoking Tobacco Tonne 39 20 0.86 0.67Printed Materials Tonne 606 578 6.18 6.96Agri Products
– Soya Extraction Tonne 14,559 38,172 19.98 40.55– Soya Oil Tonne 1,033 1,572 4.90 11.22– Rice Tonne 7,469 37,257 13.35 43.20– Coffee Tonne 2,959 4,445 28.53 35.02– Others 26.56 146.10
Paperboards and Paper Tonne 20,718 13,142 77.07 47.91Packaged Food Products Tonne 35,095 27,537 128.51 53.24Other Goods 251.46 172.26Packing Materials 15.41 26.23
1049.69 1029.12(ii) Closing Stock
Cigarettes Million 9,382 3,881 1148.12 476.88Smoking Tobacco Tonne 8 39 0.71 0.86Printed Materials Tonne 404 606 3.83 6.18Agri Products
– Soya Extraction Tonne 522 14,559 0.28 19.98– Soya Oil Tonne – 1,033 – 4.90– Rice Tonne – 7,469 – 13.35– Coffee Tonne 3,059 2,959 27.88 28.53– Others 38.18 26.56
Paperboards and Paper Tonne 22,285 20,718 83.71 77.07Packaged Food Products Tonne 31,127 35,095 78.97 128.51Other Goods 274.01 251.46Packing Materials 12.31 15.41
1668.00 1049.69(iii) Purchases and Contract
Manufacturing ChargesCigarettes Million 14,508 14,873 26.68 19.15Agri Products
– Soya Extraction Tonne 99,977 2,61,766 61.37 20.71– Soya Oil Tonne 14,696 55,587 9.14 15.20– Rice Tonne – 1,00,178 – 109.17– Soya Seeds Tonne 2,26,343 2,93,781 393.39 454.71– Coffee Tonne 28,341 23,778 146.71 124.68– Others 180.13 135.36
Packaged Food Products Tonne 6,33,056 6,94,068 177.34 164.77Other Goods 511.52 564.88Packing Materials 33.69 47.88
1539.97 1656.51
(D) Details of Raw Materials Consumed during the year*
Unmanufactured Tobacco Tonne 1,48,021 1,46,912 1128.18 808.28Waste Paper and Pulp Tonne 2,25,936 2,74,438 434.17 444.45Hardwood and Bamboo BDT** 5,34,067 3,01,812 241.24 133.21Soya Seeds Tonne 72,717 3,19,538 189.63 507.54Wheat Tonne 5,73,714 6,12,194 652.07 583.16Other Agri Products Tonne 71,876 55,915 281.36 197.55Board Tonne 11,114 10,475 126.12 102.31Filter Rods Million 14,366 11,475 166.04 123.03Aluminium Foil/Metallised Paper Bobbin 7,07,698 6,53,446 63.29 56.93BOPP/Viscose Film Tonne 2,172 2,028 35.54 32.95Wheat Flour/Maida Tonne 23,061 25,907 32.31 33.32Sugar Tonne 60,027 59,217 95.56 97.61Hydrogenated Vegetable Oil Tonne 28,804 25,386 151.43 106.46Others 1537.87 1250.52
5134.81 4477.32
* Relates to the Company’s main products and the principal raw materials.** BDT-Bone Dry Tonne
ITC Report and Accounts 2009 111

Schedules to the Accounts
19. Notes to the Accounts (Contd.)
(E) Value of Raw Materials, Spare Parts andComponents Consumed during the year Value
(Percentage) (Rs. in Crores)
2009 2008 2009 2008
Raw Materials
Imported 12.99 12.79 666.78 572.57Indigenous 87.01 87.21 4468.03 3904.75
100.00 100.00 5134.81 4477.32
Spare Parts and Components
Imported 25.78 26.52 48.77 46.13Indigenous 74.22 73.48 140.42 127.83
100.00 100.00 189.19 173.96
(I) Remittances in Foreign Currencies on account of Dividends
Financial On Account of No. of No. of (Rs. in Crores)Year Shares Non-Resident
held Shareholders
2008/2009 2007/2008 1,23,23,25,858 61 431.31
2007/2008 2006/2007 1,25,39,97,396 68 388.74
(G) Value of Imports during the year (C.I.F. Basis)
Raw Materials 717.91 516.40
Components and Spare Parts 65.72 71.26
Capital Goods 344.74 453.01
Other Goods (including imports under eligibleExport House Scheme) 15.56 10.43
1143.93 1051.10
(H) Expenditure in Foreign Currency during the year(on payment basis)
Professional Fees 43.10 31.20
Advertising/Sales Promotion 0.61 0.64
Export Promotion Expenses 3.90 8.78
Training 1.69 1.41
Hotel Reservation/Marketing Expenses 34.45 31.85
Licence Fees 1.22 0.85
Miscellaneous Expenditure 31.83 33.07
116.80 107.80
ITC Report and Accounts 2009112
(F) Earnings etc. in Foreign Exchange during the year(on realisation basis) 2009 2008
(Rs. in Crores) (Rs. in Crores)
Export of Goods (F.O.B.) 1699.54 1574.56
Dividend 4.64 –
Hotel Earnings 446.25 515.25
Other Earnings 75.28 78.60
2225.71 2168.41

Schedules to the Accounts
20. Segment Reporting
PRIMARY SEGMENT INFORMATION (BUSINESS SEGMENTS)
1. Segment RevenueFMCG - Cigarettes 15115.07 – 15115.07 13825.60 – 13825.60FMCG - Others 3010.00 4.04 3014.04 2508.25 2.80 2511.05FMCG - Total 18125.07 4.04 18129.11 16333.85 2.80 16336.65Hotels 1014.56 5.71 1020.27 1093.48 6.72 1100.20Agri Business 2284.44 1561.54 3845.98 2503.03 1365.41 3868.44Paperboards, Paper and Packaging 1719.46 1102.50 2821.96 1425.58 938.75 2364.33Segment Total 23143.53 2673.79 25817.32 21355.94 2313.68 23669.62Eliminations (2673.79) (2313.68)Total Revenue 23143.53 21355.94
2. Segment ResultsFMCG - Cigarettes 4183.77 3634.04FMCG - Others (483.45) (263.52)FMCG - Total 3700.32 3370.52Hotels 316.18 410.77Agri Business 256.18 129.19Paperboards, Paper and Packaging 508.63 453.14Segment Total 4781.31 4363.62Eliminations (102.12) (35.84)Consolidated Total 4679.19 4327.78Unallocated corporate expensesnet of unallocated income 177.06 132.07Profit before interest, etc. and taxation 4502.13 4195.71Interest etc. paid - Net 18.32 4.61Interest on loans and deposits, income from current and long terminvestments, profit and loss on sale of investments etc. 341.93 380.67Profit before taxation 4825.74 4571.77Provision for taxation 1562.15 1451.67Profit after taxation 3263.59 3120.10
3. Other InformationSegment Assets Segment Liabilities* Segment Assets Segment Liabilities*
FMCG - Cigarettes 4255.47 1178.92 3247.48 932.84FMCG - Others 2388.53 301.90 2141.17 314.51FMCG - Total 6644.00 1480.82 5388.65 1247.35Hotels 2368.83 179.94 2048.63 183.31Agri Business 1278.03 239.71 1771.14 302.17Paperboards, Paper and Packaging 4183.72 412.57 3690.15 425.97Segment Total 14474.58 2313.04 12898.57 2158.80Unallocated Corporate Assets/Liabilities 5300.13 3726.59 4638.62 3320.72Total 19774.71 6039.63 17537.19 5479.52
Capital Depreciation Non Cash Capital Depreciation Non CashExpenditure expenditure Expenditure expenditure
other than other thandepreciation depreciation
FMCG - Cigarettes 495.36 157.62 5.40 445.08 133.99 5.13FMCG - Others 181.58 66.49 0.94 308.79 42.17 0.53FMCG - Total 676.94 224.11 6.34 753.87 176.16 5.66Hotels 367.02 67.57 3.75 302.37 64.27 9.22Agri Business 36.81 38.94 0.26 114.29 38.49 4.75Paperboards, Paper and Packaging 578.78 192.31 14.82 886.32 135.69 2.26Segment Total 1659.55 522.93 25.17 2056.85 414.61 21.89
* Segment Liabilities of FMCG - Cigarettes is before considering provision of Rs. 575.43 Crores (2008 – Rs. 598.42 Crores) in respect ofdisputed State Taxes, the levy/collection of which has been stayed. These have been included under ‘Unallocated Corporate Liabilities’.
(Rs. in Crores)
2009 2008External Sales Inter Segment Total External Sales Inter Segment Total
Sales Sales
ITC Report and Accounts 2009 113
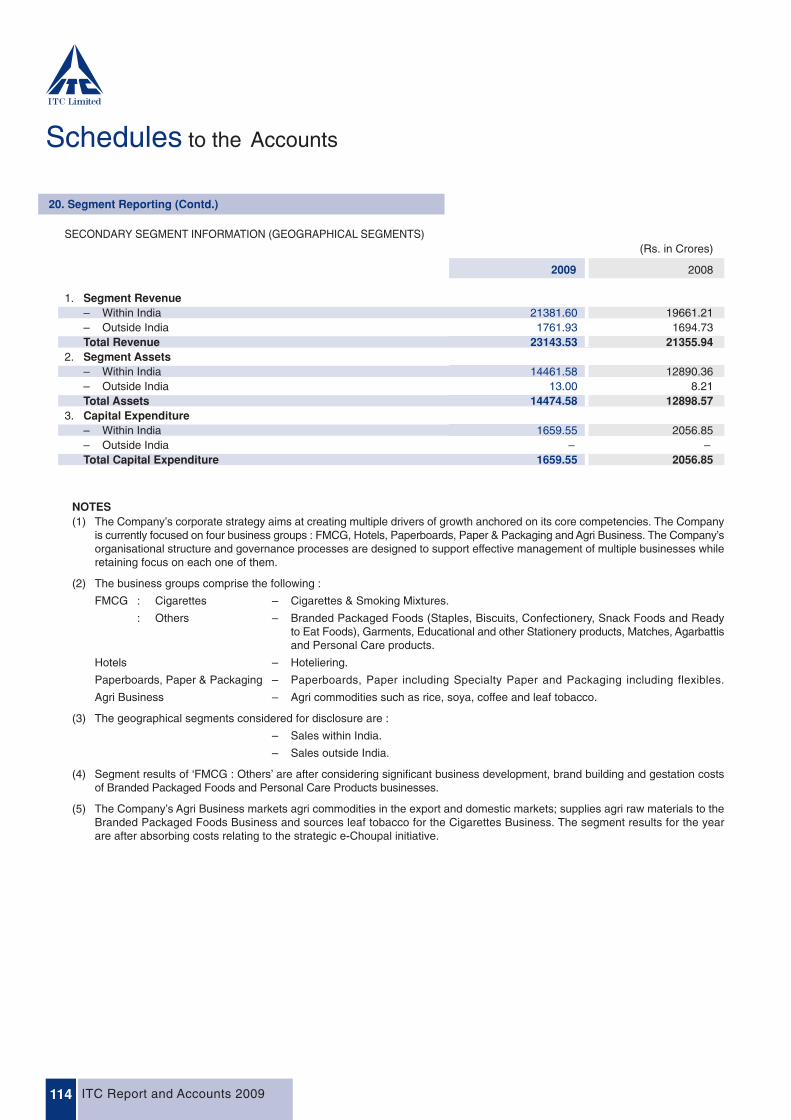
Schedules to the Accounts
20. Segment Reporting (Contd.)
SECONDARY SEGMENT INFORMATION (GEOGRAPHICAL SEGMENTS)(Rs. in Crores)
2009 2008
1. Segment Revenue– Within India 21381.60 19661.21– Outside India 1761.93 1694.73Total Revenue 23143.53 21355.94
2. Segment Assets– Within India 14461.58 12890.36– Outside India 13.00 8.21Total Assets 14474.58 12898.57
3. Capital Expenditure– Within India 1659.55 2056.85– Outside India – –Total Capital Expenditure 1659.55 2056.85
NOTES(1) The Company’s corporate strategy aims at creating multiple drivers of growth anchored on its core competencies. The Company
is currently focused on four business groups : FMCG, Hotels, Paperboards, Paper & Packaging and Agri Business. The Company’sorganisational structure and governance processes are designed to support effective management of multiple businesses whileretaining focus on each one of them.
(2) The business groups comprise the following :
FMCG : Cigarettes – Cigarettes & Smoking Mixtures.
: Others – Branded Packaged Foods (Staples, Biscuits, Confectionery, Snack Foods and Readyto Eat Foods), Garments, Educational and other Stationery products, Matches, Agarbattisand Personal Care products.
Hotels – Hoteliering.
Paperboards, Paper & Packaging – Paperboards, Paper including Specialty Paper and Packaging including flexibles.
Agri Business – Agri commodities such as rice, soya, coffee and leaf tobacco.
(3) The geographical segments considered for disclosure are :
– Sales within India.
– Sales outside India.
(4) Segment results of ‘FMCG : Others’ are after considering significant business development, brand building and gestation costsof Branded Packaged Foods and Personal Care Products businesses.
(5) The Company’s Agri Business markets agri commodities in the export and domestic markets; supplies agri raw materials to theBranded Packaged Foods Business and sources leaf tobacco for the Cigarettes Business. The segment results for the yearare after absorbing costs relating to the strategic e-Choupal initiative.
ITC Report and Accounts 2009114

Schedules to the Accounts
21. Related Party Disclosures
1. ENTERPRISES WHERE CONTROL EXISTS:
i) Subsidiaries :a) Srinivasa Resorts Limitedb) Fortune Park Hotels Limitedc) Bay Islands Hotels Limitedd) Russell Credit Limited and its subsidiaries
Greenacre Holdings LimitedWimco Limited and its subsidiaries
Pavan Poplar LimitedPrag Agro Farm Limited
Technico Pty Limited, Australia and its subsidiariesTechnico ISC Pty Limited, AustraliaTechnico Agri Sciences Limited (formerly known as Chambal Agritech Limited)Technico Technologies Inc., CanadaTechnico Asia Holdings Pty Limited, Australia and its subsidiary
Technico Horticultural (Kunming) Co. Limited, Chinae) ITC Infotech India Limited and its subsidiaries
ITC Infotech LimitedITC Infotech (USA), Inc. and its subsidiary
Pyxis Solutions, LLC (became subsidiary with effect from 11.08.2008)f) Wills Corporation Limitedg) Gold Flake Corporation Limitedh) Landbase India Limitedi) BFIL Finance Limited and its subsidiary
MRR Trading & Investment Company Limitedj) Surya Nepal Private Limitedk) King Maker Marketing, Inc.
The above list does not include:a) ITC Global Holdings Pte. Limited, Singapore (under liquidation)
Hup Hoon Traders Pte. Limited, SingaporeAOZT "Hup Hoon", MoscowHup Hoon Impex SRL, RomaniaFortune Tobacco Co. Limited, CyprusFortune Tobacco Company Inc.,USA and
b) BFIL Securities Limited (a subsidiary of BFIL Finance Ltd.) which is under voluntary winding up proceedings.
ii) Other entities under control of the Company:a) ITC Sangeet Research Academyb) ITC Education Trustc) ITC Rural Development Trust
2. OTHER RELATED PARTIES WITH WHOM THE COMPANY HAD TRANSACTIONS, etc.
i) Associates & Joint Ventures:Associatesa) Gujarat Hotels Limitedb) Russell Investments Limitedc) ATC Limited (formerly Asia Tobacco Company Limited)d) Classic Infrastructure & Development Limitede) International Travel House Limitedf) Divya Management Limitedg) Antrang Finance Limited
- being associates of the Company, andh) Tobacco Manufacturers (India) Limited, UK
of which the Company is an associate.
ITC Report and Accounts 2009 115

Schedules to the Accounts
21. Related Party Disclosures (contd.)
Joint Venturesa) Maharaja Heritage Resorts Limitedb) Sitel Operating Corporation India Limited (formerly CLI3L e-Services Limited)
Joint Ventures of the Company's subsidiariesa) ITC Filtrona Limited (a joint venture of Gold Flake Corporation Limited)
ii) a) Key Management Personnel:Y. C. Deveshwar Executive Chairman
A. Singh Executive Director
K. Vaidyanath Executive Director
S. S. H. Rehman Executive Director (retired w.e.f 20.03.2009)
A. Baijal Non-Executive Director
R. K. Kaul Non-Executive Director
S. H. Khan Non-Executive Director
S. B. Mathur Non-Executive Director
D. K. Mehrotra Non-Executive Director
H. G. Powell Non-Executive Director (w.e.f. 07.05.2008)
P. B. Ramanujam Non-Executive Director
A. Ruys Non-Executive Director (w.e.f. 20.01.2009)
B. Sen Non-Executive Director
B. Vijayaraghavan Non-Executive Director
J. P. Daly Non-Executive Director (retired w.e.f. 07.01.2009)
Ram S. Tarneja Non-Executive Director (retired w.e.f. 26.08.2008)
A. Nayak Permanent Invitee - Corporate Management Committee
R. Srinivasan Permanent Invitee - Corporate Management Committee
K. N. Grant Permanent Invitee - Corporate Management Committee (w.e.f. 13.11.2008)
N. Anand Permanent Invitee - Corporate Management Committee (w.e.f. 13.11.2008)
P. Chatterjee Permanent Invitee - Corporate Management Committee (w.e.f. 13.11.2008)
R. G. Jacob Special Invitee - Corporate Management Committee
b) Relative of Key Management Personnel:Mrs. B. Deveshwar (wife of Mr. Y. C. Deveshwar)
Mrs. T. Anand (wife of Mr. N. Anand)
iii) Employees' Benefit Plans where there is significant influence:a) IATC Provident Fund
b) IATC Staff X Provident Fund
c) ITC Management Staff Gratuity Fund
d) ITC Employees Gratuity Fund
e) ITC Gratuity Fund 'C'
f) ITC Pension Fund
g) ILTD Seasonal Employees Pension Fund
h) ITC Platinum Jubilee Pension Fund
i) Tribeni Tissues Limited Provident Fund
j) Tribeni Tissues Limited Gratuity Fund
k) ITC Bhadrachalam Paperboards Limited Management Staff Pension Fund
l) ITC Bhadrachalam Paperboards Limited Gratuity Fund 'A'
m) ITC Bhadrachalam Paperboards Limited Gratuity Fund 'B'
n) ITC Bhadrachalam Paperboards Limited Gratuity Fund 'C'
o) ITC Bhadrachalam Paperboards Limited Staff Provident Fund
ITC Report and Accounts 2009116
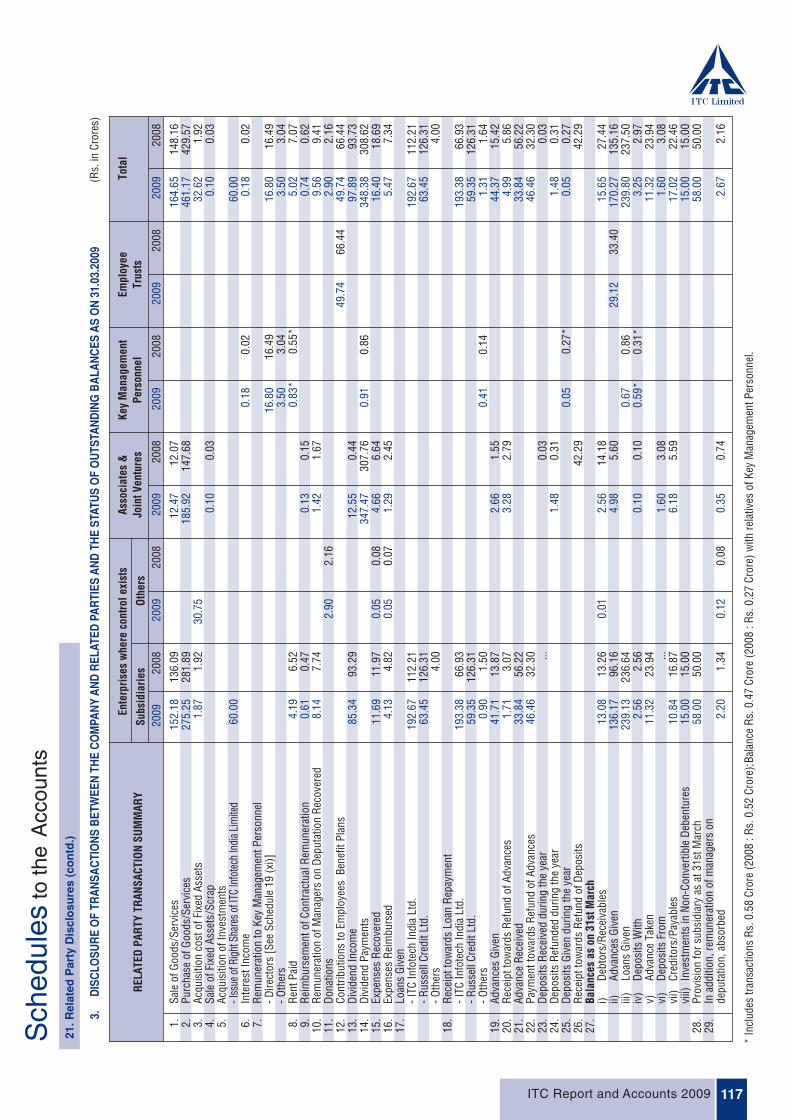
3.D
ISC
LOSU
RE
OF
TRA
NSA
CTI
ON
S B
ETW
EEN
TH
E C
OM
PAN
Y A
ND
REL
ATED
PA
RTI
ES A
ND
TH
E ST
ATU
S O
F O
UTS
TAN
DIN
G B
ALA
NC
ES A
S O
N 3
1.03
.200
9
Sch
edul
es to
the
Acc
ount
s21
.Rel
ated
Par
ty D
iscl
osu
res
(co
ntd
.)
(Rs.
in C
rore
s)
ITC Report and Accounts 2009 117
1.Sa
le o
f Goo
ds/S
ervi
ces
152.
1813
6.09
12.4
712
.07
164.
6514
8.16
2.Pu
rcha
se o
f Goo
ds/S
ervi
ces
275.
2528
1.89
185.
9214
7.68
461.
1742
9.57
3.Ac
quis
ition
cos
t of F
ixed
Ass
ets
1.87
1.92
30.7
532
.62
1.92
4.Sa
le o
f Fix
ed A
sset
s/Sc
rap
0.10
0.03
0.10
0.03
5.Ac
quis
ition
of I
nves
tmen
ts- I
ssue
of R
ight
Sha
res o
f ITC
Info
tech
Indi
a Lim
ited
60
.00
60.0
06.
Inte
rest
Inco
me
0.18
0.02
0.18
0.02
7.Re
mun
erat
ion
to K
ey M
anag
emen
t Per
sonn
el- D
irect
ors
[See
Sch
edul
e 19
(xi)]
16.8
016
.49
16.8
016
.49
- Oth
ers
3.50
3.04
3.50
3.04
8.Re
nt P
aid
4.19
6.52
0.83
*
0.55
*5.
027.
079.
Reim
burs
emen
t of C
ontra
ctua
l Rem
uner
atio
n0.
610.
470.
130.
150.
740.
6210
.Re
mun
erat
ion
of M
anag
ers
on D
eput
atio
n Re
cove
red
8.14
7.74
1.42
1.67
9.56
9.41
11.
Dona
tions
2.90
2.16
2.90
2.16
12.
Cont
ribut
ions
to E
mpl
oyee
s B
enef
it Pl
ans
49.7
466
.44
49.7
466
.44
13.
Divi
dend
Inco
me
85.3
493
.29
12.5
50.
4497
.89
93.7
314
.Di
vide
nd P
aym
ents
34
7.47
307.
760.
910.
8634
8.38
308.
6215
.Ex
pens
es R
ecov
ered
11.6
911
.97
0.05
0.08
4.66
6.64
16.4
018
.69
16.
Expe
nses
Rei
mbu
rsed
4.13
4.82
0.05
0.07
1.29
2.45
5.47
7.34
17.
Loan
s Gi
ven
- ITC
Info
tech
Indi
a Lt
d.19
2.67
112.
2119
2.67
112.
21- R
usse
ll Cr
edit
Ltd.
63.4
512
6.31
63.4
512
6.31
- Oth
ers
4.00
4.00
18.
Rece
ipt t
owar
ds L
oan
Repa
ymen
t- I
TC In
fote
ch In
dia
Ltd.
193.
3866
.93
193.
3866
.93
- Rus
sell
Cred
it Lt
d.59
.35
126.
3159
.35
126.
31- O
ther
s0.
901.
500.
410.
141.
311.
6419
.Ad
vanc
es G
iven
41.7
113
.87
2.66
1.55
44.3
715
.42
20.
Rece
ipt t
owar
ds R
efun
d of
Adv
ance
s1.
713.
073.
282.
794.
995.
8621
.Ad
vanc
e Re
ceiv
ed33
.84
56.2
233
.84
56.2
222
.Pa
ymen
t tow
ards
Ref
und
of A
dvan
ces
46.4
632
.30
46.4
632
.30
23.
Depo
sits
Rec
eive
d du
ring
the
year
...0.
030.
0324
.De
posi
ts R
efun
ded
durin
g th
e ye
ar1.
480.
311.
480.
3125
.De
posi
ts G
iven
dur
ing
the
year
0.05
0.27
*0.
050.
2726
.Re
ceip
t tow
ards
Ref
und
of D
epos
its42
.29
42.2
927
.Ba
lanc
es a
s on
31s
t Mar
chi)
Debt
ors/
Rece
ivab
les
13.0
813
.26
0.01
2.56
14.1
815
.65
27.4
4ii)
Adva
nces
Giv
en13
6.17
96.1
64.
985.
6029
.12
33.4
017
0.27
135.
16iii
)Lo
ans
Give
n23
9.13
236.
640.
670.
8623
9.80
237.
50iv
)De
posi
ts W
ith2.
562.
560.
100.
100.
59*
0.31
*3.
252.
97v)
Adva
nce
Take
n11
.32
23.9
411
.32
23.9
4vi
)De
posi
ts F
rom
...1.
603.
081.
603.
08vi
i)Cr
edito
rs/P
ayab
les
10.8
416
.87
6.18
5.59
17.0
222
.46
viii)
Inve
stm
ents
in N
on-C
onve
rtibl
e De
bent
ures
15.0
015
.00
15.0
015
.00
28.
Prov
isio
n fo
r sub
sidi
ary
as a
t 31s
t Mar
ch58
.00
50.0
058
.00
50.0
029
.In
add
ition
, rem
uner
atio
n of
man
ager
s on
depu
tatio
n, a
bsor
bed
2.20
1.34
0.12
0.08
0.35
0.74
2.67
2.16
2009
2008
2009
2008
2009
2008
2009
2008
2009
2008
2009
2008
Subs
idia
ries
Othe
rs
Ente
rpris
es w
here
con
trol e
xist
sAs
soci
ates
&Jo
int V
entu
res
Key
Man
agem
ent
Pers
onne
lEm
ploy
eeTr
usts
Tota
l
* In
clud
es tr
ansa
ctio
ns R
s. 0
.58
Cror
e (2
008
: Rs.
0.5
2 Cr
ore)
;Bal
ance
Rs.
0.4
7 Cr
ore
(200
8 : R
s. 0
.27
Cror
e) w
ith re
lativ
es o
f Key
Man
agem
ent P
erso
nnel
.
RELA
TED
PART
Y TR
ANSA
CTIO
N SU
MM
ARY

Schedules to the Accounts
22. Significant Accounting Policies
IT IS CORPORATE POLICY
ConventionTo prepare financial statements in accordance withapplicable Accounting Standards in India. A summary ofimportant accounting policies is set out below. The financialstatements have also been prepared in accordancewith relevant presentational requirements of theCompanies Act, 1956.
Basis of AccountingTo prepare financial statements in accordance with thehistorical cost convention modified by revaluation of certainFixed Assets as and when undertaken as detailed below.
Fixed AssetsTo state Fixed Assets at cost of acquisition inclusive ofinward freight, duties and taxes and incidental expensesrelated to acquisition. In respect of major projects involvingconstruction, related pre-operational expenses form partof the value of assets capitalised. Expenses capitalisedalso include applicable borrowing costs.
To capitalise software where it is expected to provide futureenduring economic benefits. Capitalisation costs includelicence fees and costs of implementation/system integrationservices. The costs are capitalised in the year in which therelevant software is implemented for use.
To charge off as a revenue expenditure all upgradation/enhancements unless they bring similar significant additionalbenefits.
DepreciationTo calculate depreciation on Fixed Assets and IntangibleAssets in a manner that amortises the cost of the assetsafter commissioning, over their estimated useful lives or,where specified, lives based on the rates specified inSchedule XIV to the Companies Act, 1956, whichever islower, by equal annual instalments. Leasehold propertiesare amortised over the period of the lease.
To amortise capitalised software costs over a period offive years.
Revaluation of AssetsAs and when Fixed Assets are revalued, to adjust theprovision for depreciation on such revalued Fixed Assets,where applicable, in order to make allowance for consequentadditional diminution in value on considerations of age,condition and unexpired useful life of such Fixed Assets;to transfer to Revaluation Reserve the difference between
the written up value of the Fixed Assets revalued anddepreciation adjustment and to charge Revaluation ReserveAccount with annual depreciation on that portion of thevalue which is written up.
InvestmentsTo state Current Investments at lower of cost and fair value;and Long Term Investments, including in Joint Venturesand Associates, at cost. Where applicable, provision ismade where there is a permanent fall in valuation ofLong Term Investments.
InventoriesTo state inventories including work-in-progress at lower ofcost and net realisable value. The cost is calculated onweighted average method. Cost comprises expenditureincurred in the normal course of business in bringing suchinventories to its location and includes, where applicable,appropriate overheads based on normal level of activity.Obsolete, slow moving and defective inventoriesare identified at the time of physical verification ofinventories and, where necessary, provision is madefor such inventories.
SalesTo state net sales after deducting taxes and duties frominvoiced value of goods and services rendered.
Investment IncomeTo account for Income from Investments on an accrualbasis, inclusive of related tax deducted at source.
Proposed DividendTo provide for Dividends (including income tax thereon) inthe books of account as proposed by the Directors, pendingapproval at the Annual General Meeting.
Employee BenefitsTo make regular monthly contributions to various ProvidentFunds which are in the nature of defined contributionscheme and such paid/payable amounts are chargedagainst revenue. To administer such Funds through dulyconstituted and approved independent trusts with theexception of Provident Fund and Family Pensioncontributions in respect of Unionised Staff which arestatutorily deposited with the Government.
To administer through duly constituted and approvedindependent trusts, various Gratuity and Pension Funds
ITC Report and Accounts 2009118
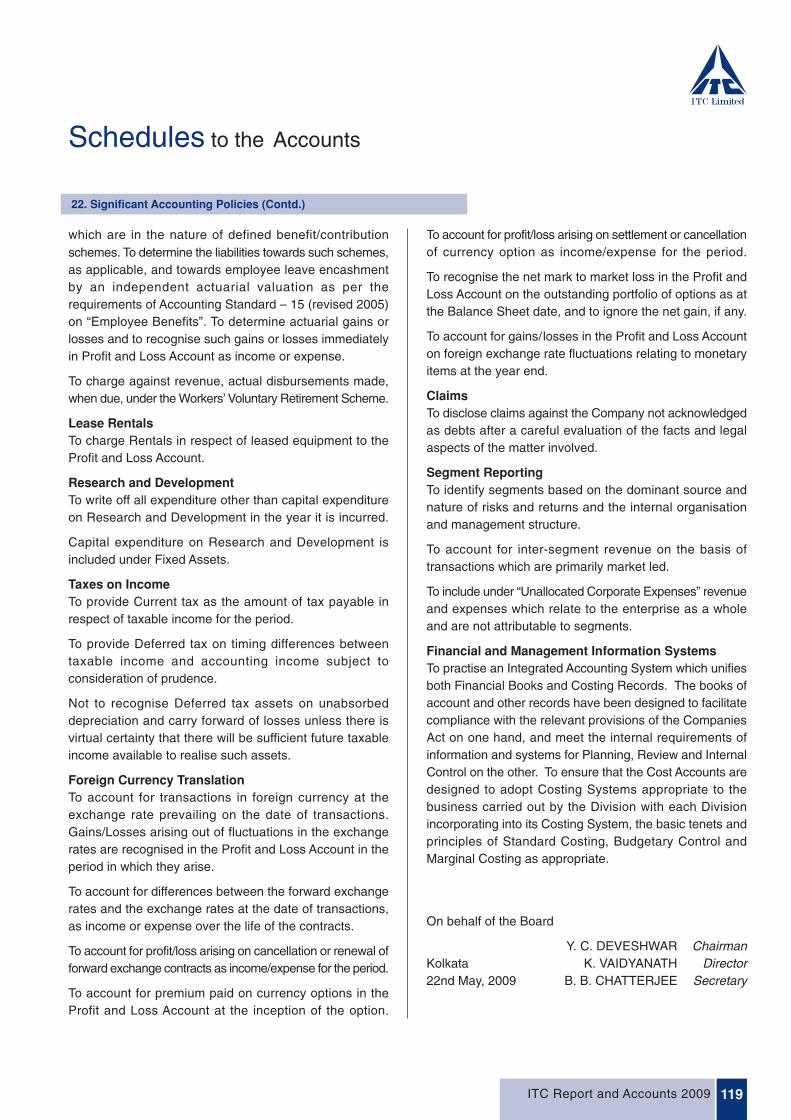
Schedules to the Accounts
22. Significant Accounting Policies (Contd.)
which are in the nature of defined benefit/contributionschemes. To determine the liabilities towards such schemes,as applicable, and towards employee leave encashmentby an independent actuarial valuation as per therequirements of Accounting Standard – 15 (revised 2005)on “Employee Benefits”. To determine actuarial gains orlosses and to recognise such gains or losses immediatelyin Profit and Loss Account as income or expense.
To charge against revenue, actual disbursements made,when due, under the Workers’ Voluntary Retirement Scheme.
Lease RentalsTo charge Rentals in respect of leased equipment to theProfit and Loss Account.
Research and DevelopmentTo write off all expenditure other than capital expenditureon Research and Development in the year it is incurred.
Capital expenditure on Research and Development isincluded under Fixed Assets.
Taxes on IncomeTo provide Current tax as the amount of tax payable inrespect of taxable income for the period.
To provide Deferred tax on timing differences betweentaxable income and accounting income subject toconsideration of prudence.
Not to recognise Deferred tax assets on unabsorbeddepreciation and carry forward of losses unless there isvirtual certainty that there will be sufficient future taxableincome available to realise such assets.
Foreign Currency TranslationTo account for transactions in foreign currency at theexchange rate prevailing on the date of transactions.Gains/Losses arising out of fluctuations in the exchangerates are recognised in the Profit and Loss Account in theperiod in which they arise.
To account for differences between the forward exchangerates and the exchange rates at the date of transactions,as income or expense over the life of the contracts.
To account for profit/loss arising on cancellation or renewal offorward exchange contracts as income/expense for the period.
To account for premium paid on currency options in theProfit and Loss Account at the inception of the option.
To account for profit/loss arising on settlement or cancellationof currency option as income/expense for the period.
To recognise the net mark to market loss in the Profit andLoss Account on the outstanding portfolio of options as atthe Balance Sheet date, and to ignore the net gain, if any.
To account for gains/losses in the Profit and Loss Accounton foreign exchange rate fluctuations relating to monetaryitems at the year end.
ClaimsTo disclose claims against the Company not acknowledgedas debts after a careful evaluation of the facts and legalaspects of the matter involved.
Segment ReportingTo identify segments based on the dominant source andnature of risks and returns and the internal organisationand management structure.
To account for inter-segment revenue on the basis oftransactions which are primarily market led.
To include under “Unallocated Corporate Expenses” revenueand expenses which relate to the enterprise as a wholeand are not attributable to segments.
Financial and Management Information SystemsTo practise an Integrated Accounting System which unifiesboth Financial Books and Costing Records. The books ofaccount and other records have been designed to facilitatecompliance with the relevant provisions of the CompaniesAct on one hand, and meet the internal requirements ofinformation and systems for Planning, Review and InternalControl on the other. To ensure that the Cost Accounts aredesigned to adopt Costing Systems appropriate to thebusiness carried out by the Division with each Divisionincorporating into its Costing System, the basic tenets andprinciples of Standard Costing, Budgetary Control andMarginal Costing as appropriate.
On behalf of the Board
Y. C. DEVESHWAR ChairmanKolkata K. VAIDYANATH Director22nd May, 2009 B. B. CHATTERJEE Secretary
ITC Report and Accounts 2009 119