01 62417 Lazard SAR covers - Prudential · PDF fileAnnual Report 1 Lazard FundsLazard...
40
Lazard Retirement Series Lazard Retirement Series Semi-Annual Report June 30, 2010 U.S. Equity Lazard Retirement U.S. Strategic Equity Portfolio Lazard Retirement U.S. Small-Mid Cap Equity Portfolio International Equity Lazard Retirement International Equity Portfolio Emerging Markets Lazard Retirement Emerging Markets Equity Portfolio
Transcript of 01 62417 Lazard SAR covers - Prudential · PDF fileAnnual Report 1 Lazard FundsLazard...

Lazard Retirement Series
Lazard Retirement Series Semi-Annual Report
June 30, 2010
U.S. Equity
Lazard Retirement U.S. Strategic Equity Portfolio
Lazard Retirement U.S. Small-Mid Cap Equity Portfolio
International Equity
Lazard Retirement International Equity Portfolio
Emerging Markets
Lazard Retirement Emerging Markets Equity
Portfolio


Annual Report 1
Lazard Funds Page HeadingLazard Retirement Series, Inc. Table of Contents
Semi-Annual Report 1
2 Investment Overviews
6 Performance Overviews
10 Information About Your Portfolio’s Expenses
11 Portfolio Holdings Presented by Sector
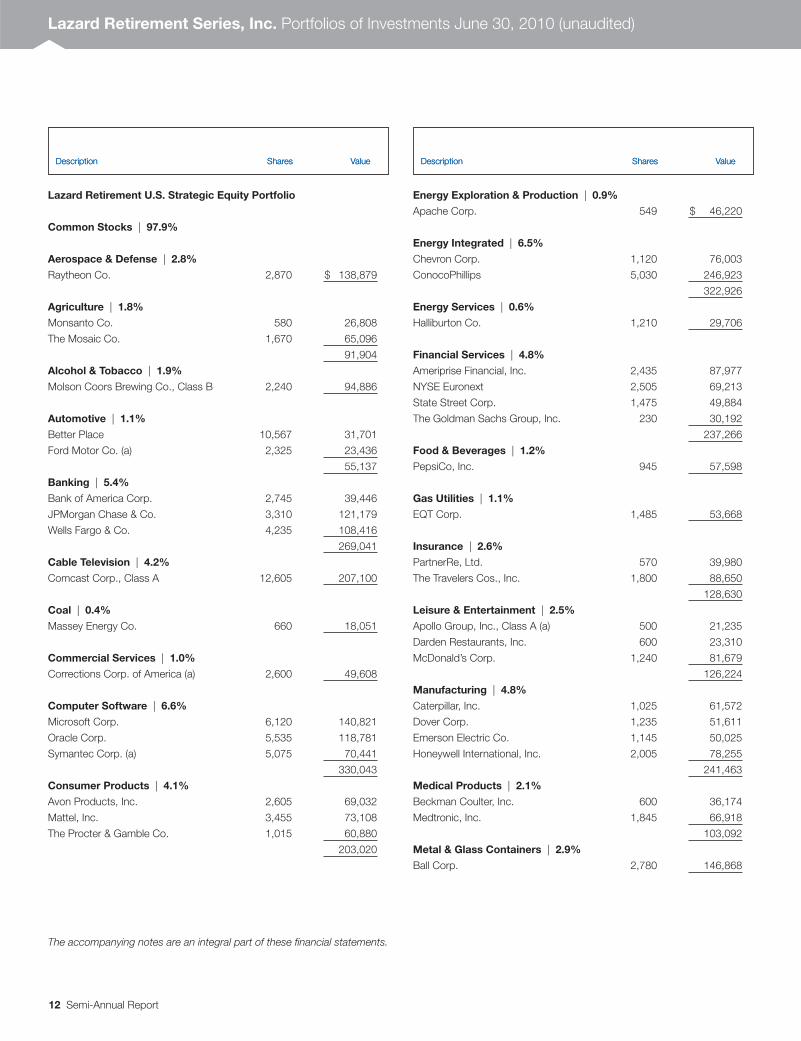
12 Portfolios of Investments
12 Lazard Retirement U.S. Strategic Equity Portfolio
14 Lazard Retirement U.S. Small-Mid Cap Equity Portfolio
16 Lazard Retirement International Equity Portfolio
18 Lazard Retirement Emerging Markets Equity Portfolio
20 Notes to Portfolios of Investments
22 Statements of Assets and Liabilities
23 Statements of Operations
24 Statements of Changes in Net Assets
26 Financial Highlights
29 Notes to Financial Statements
34 Board of Directors and Officers Information
36 Other Information
Shares of the Portfolios are currently offered only to separate accounts established by insurance companies to fund variable annuitycontracts and variable life insurance policies. Portfolio shares may also be offered to certain qualified pension and retirement plans and toaccounts permitting accumulation of assets on a tax-deferred basis.
Please consider a Portfolio’s investment objective, risks, charges and expenses carefully before investing. For more complete informationabout Lazard Retirement Series, Inc., you may obtain a prospectus or summary prospectus, by calling 800-823-6300, or online, atwww.LazardNet.com. Read the prospectus or each Portfolio’s summary prospectus carefully before you invest. The prospectus orsummary prospectus contain investment objective, risks, charges, expenses and other information about Portfolios of Lazard RetirementSeries, Inc., which may not be detailed in this report.
Distributed by Lazard Asset Management Securities LLC.
2 Semi-Annual Report
Lazard Retirement Series, Inc. Investment Overviews
U.S. Equities: Return to VolatilityVolatility returned to the markets over the six-monthperiod ended June 30, 2010, as investors became increas-ingly wary of a global recovery amid the ongoing sovereigndebt crisis in the Eurozone and concerns of a potential eco-nomic slowdown in China. Stocks rallied earlier in the yearon the back of strong corporate earnings announcements,but failed to maintain the positive momentum as the U.S.recovery appeared to have hit a soft patch with housing,consumer confidence, and retail sales data coming in belowexpectations. The recent job data also disappointedinvestors due to weaker-than-expected additions in the pri-vate sector, where a recovery is key to improvement in thehousing market and consumer spending. A series of recentevents, including ongoing financial reforms and the oil spillin the Gulf of Mexico, also hinted at more aggressive gov-ernment influence on business, which further dampenedinvestors’ sentiment.
By sector, the economically defensive consumer staples out-performed amid the volatile market. The financials sector alsoperformed well on the expectation that the impact of thefinancial reform legislation may not be as severe as previouslyexpected. Meanwhile, the energy sector underperformedamid concerns over the oil spill in the Gulf of Mexico. Theinformation technology sector was also weak due to concernsof a potential slowdown in the global recovery.
International Equities: Break in the RecoveryWorld equity markets were also volatile throughout the firsthalf of 2010, posting generally positive returns in the firstquarter, then falling sharply from mid-April to late May asEuropean sovereign debt fears intensified. Uncertainty overgrowth prospects in the United States and China alsoweighed on stocks. European markets—particularly thosewith strained governmental finances, such as Greece, Italy,and Spain—were weak, especially during the second quar-ter, as the large bailout package did little to calm investors’fears. Additionally, austerity measures by several Europeangovernments led to concerns that the economic recoverycould be held back.
Asian markets finished the first half of the year with mixedperformance, as investors were wary of an economic and realestate slowdown in China, as well as political tensions onthe Korean peninsula. Although Japan relatively outper-formed in both the first and second quarters, stocks in thecountry were hurt by concerns of a global economic slow-
down, and strong yen appreciation versus the U.S. dollar andeuro weighed on export-oriented Japanese companies.
The industrials sector outperformed for the first half of theyear, as did the consumer staples and consumer discre-tionary sectors, while the utilities sector underperformed.Materials companies, particularly commodity producers,lagged over concerns about weaker Chinese growth and theprospects of greater taxation, and the energy sector notablyunderperformed due to slowing demand and the oil spill inthe Gulf of Mexico. The financials sector also underper-formed due to regulatory concerns.
Emerging Markets Equities: Challenging First HalfFollowing an extraordinarily strong year in 2009, shares ofemerging markets stocks experienced some challenges inthe first half of 2010. Deepening concerns over a fiscal cri-sis in Greece and other European countries, as well as theanticipated effects on global economic activity, offsetexcellent fundamentals in the emerging markets. Chineseauthorities reintroduced a currency basket for the ren-minbi, elevating its value as well as the value of severalother Asian currencies. The Morgan Stanley Capital Inter-national (MSCI®) Emerging Markets (EM®) Index (the EM Index) declined by over 6% for the period, with Asiaoutperforming both the Latin American and Eastern European regions.
Brazilian equities declined due to concerns over weakergrowth that could impact commodity prices. Further, sharesof Petrobras, a large Brazilian oil company, were volatilebecause of issues surrounding the financing of its large pro-jected capital expenditures. Colombian equities performedparticularly well due to a more stable environment in thecountry. Despite a debilitating earthquake in Chile, equitiesin that country finished the first half of the year higher.
The majority of Asian emerging markets recorded positiveperformance in the first half of 2010. Both Indonesian andThai equities continued to perform well on robust eco-nomic results, despite the challenging political situation inThailand. Relatively weak performance in the informationtechnology sector held back Taiwanese and South Koreanshares over the first half of the year. South Korean shareswere also challenged by exacerbated tensions with NorthKorea. Additionally, expectations of slower global growthled to a sharp decline in the won. Chinese stocks declined,as investors became more concerned about global growth
Semi-Annual Report 3
and as Chinese authorities enacted further measures tomoderate bank lending to the property sector. Equities inthe Philippines rose impressively on signs of more robusteconomic activity.
Due in part to their proximity to Europe and its current eco-nomic problems, mixed performance was registered acrossthe Middle East and Africa. Hungarian equities fell sharply,as the government announced a tax on the financials sectoraimed at plugging its fiscal deficit. Polish shares alsodeclined over the period. Share prices fell in South Africaand Russia on worries about commodity prices. Turkishequities were the region’s relative bright spot, helped by sta-ble economic performance.
By sector, consumer staples, health care, telecom services,consumer discretionary, and utilities outperformed the EMIndex. The energy, materials, and information technologysectors were the weakest performers over the six monthsended June 30, 2010.
Lazard Retirement U.S. Strategic Equity PortfolioFor the six months ended June 30, 2010, the Lazard Retire-ment U.S. Strategic Equity Portfolio’s Service Shares posteda total return of -8.91%, as compared with the -6.65% returnfor the S&P 500® Index.
The Portfolio was helped by stock selection in the consumerdiscretionary sector. AutoZone, an auto parts retailer,reported sales growth well above expectations and furtherboosted per-share earnings by buying back 3% of its out-standing shares. Shares of Family Dollar Stores, a nationaldiscount retailer, also performed well, as the company’s tar-get consumers began to rebound. We subsequently exitedthe position in Family Dollar Stores during the period.
Stock selection in the energy sector was also a positive rela-tive contributor to the Portfolio’s returns, as ConocoPhillipsoutperformed due to continued signs of progress in itsrestructuring efforts and less exposure to deepwater activityin the Gulf of Mexico than its peers.
Conversely, stock selection in the consumer staples sectordetracted from performance over the period. Shares of Wal-green Co. lagged due to weak same-store sales anddisappointing cost controls within its selling, general, andadministrative expenses.
Stock selection in the information technology sector alsohurt returns. A lack of exposure to Apple detracted from rel-ative performance, as the company performed strongly onexpectations of positive sales trends of its various products.Shares of Symantec, one of the largest makers of securitysoftware, declined due to concerns over the integration of anauthentication business that the company announced itwould buy.
Stock selection in the health care sector detracted fromreturns as well. Shares of Pfizer lagged due to uncertaintysurrounding the overall impact of health care reform and con-cerns over the company’s spending plan for new initiatives.
Lazard Retirement U.S. Small-Mid Cap Equity PortfolioFor the six months ended June 30, 2010, the Lazard Retire-ment U.S. Small-Mid Cap Equity Portfolio’s Service Sharesposted a total return of -2.48%, as compared with the -1.69%return for the Russell 2500® Index.
Stock selection in the consumer staples sector helped thePortfolio’s relative returns during this period, mainly due tomergers and acquisitions activity. Bare Escentuals, amakeup manufacturer, received a takeover bid in January2010, and American Italian Pasta, one of the largest produc-ers of dry pasta in North America, received a takeover offerin June. Following this news, we exited both positions dur-ing the period.
Stock selection in the materials sector also helped relativeperformance, as several companies in the paper productsindustry enjoyed strong pricing power as the economyimproved. Rock-Tenn, a paper and packaging manufacturer,performed well following a better-than-expected earningsreport. Following the March 2010 purchase of shares ofSchweitzer-Mauduit International, a manufacturer of spe-cialty papers for the tobacco industry, the company rosebased on strong first-quarter earnings.
Conversely, stock selection in the health care sectordetracted from returns over the period. Shares of XenoPort,a biotechnology company, fell sharply during the period, asone of its deeper-stage pipeline drugs was surprisinglyrejected. This failure broke our investment thesis for thecompany, and we eliminated the stock from the Portfolio.Medicis Pharmaceutical, Warner Chilcott, and Talecris Bio-therapeutics also fell on company-specific issues. Medicis

4 Semi-Annual Report
Pharmaceutical and Talecris Biotherapeutics were sold fromthe Portfolio during the period as well.
Stock selection in the industrials sector also hurt returns.Positions in A123 Systems and Ener1, lithium ion batterycompanies, fell considerably over the period due to increas-ing competition in the industry. We subsequently eliminatedboth positions from the Portfolio. Hill International, a con-struction consulting company, dropped significantly in May,as the company posted lower-than-expected earnings causedby the cancellation of several projects due to weak marketconditions. We also exited the position in Hill Internationalduring the period.
In the financials sector, both Waddell & Reed Financial andPiper Jaffray detracted from performance. Waddell & Reeddropped significantly due to concerns about flows into itsasset management unit, while Piper Jaffray declined follow-ing a disappointing earnings announcement. We exited theposition in Piper Jaffray during the period.
Lazard Retirement International Equity PortfolioFor the six months ended June 30, 2010, the Lazard Retire-ment International Equity Portfolio’s Service Shares posteda total return of -12.70%, as compared with the -13.23%return for MSCI Europe, Australasia and Far East (EAFE®) Index.
The Portfolio’s relative outperformance over the past sixmonths was driven mostly by stock selection, as holdings inthe telecom services and the information technology sectorsadded to returns. Within telecom services, the Portfolio ben-efited from Rogers Communications, which performed welldue to an improving earnings outlook, and TELUS, which,despite lower first-quarter earnings, performed well due toencouraging growth in its wireless and data services rev-enues. We exited the position in TELUS during the periodas its share price approached our valuation expectations.
Stock selection in information technology also helped rela-tive returns. Yahoo! Japan performed well as a result ofincreased online advertising spending, and positions inAmadeus IT and in Keyence also helped the Portfolio.
Exposure to emerging markets also added to returns, as didstock selection in the energy sector, as the Portfolio bene-fited by minimizing losses with the early sale of a position inBP following the oil spill.
Conversely, stock selection in industrials and materials nega-tively impacted the Portfolio, as both sectors were hurt bythe perceived slowdown in the global recovery and by reces-sionary fears, prompting investors to rotate into sectors thatare perceived as more defensive. In the industrials sector,Italian infrastructure group Atlantia was hurt by potentialfiscal reforms by the Italian government.
The materials sector was also affected by the proposed Aus-tralian windfall tax on mining companies, which led majorcompanies in the industry to halt project development. Alsowithin the sector, Potash Corp. of Saskatchewan declinedamid worries regarding oversupply, price pressure on potash,and potentially weaker demand.
Lazard Retirement Emerging Markets Equity PortfolioFor the six months ended June 30, 2010, the Lazard Retire-ment Emerging Markets Equity Portfolio’s Service Sharesposted a total return of -3.43%, while Investor Shares posteda total return of -3.29%, as compared with the -6.17% returnfor the EM Index.
Over the period, the Portfolio was helped by a position inSouza Cruz, a Brazilian tobacco company, which outper-formed on the expectation that its volumes and marginswould remain stable. Shares of Turkiye Is Bankasi (orIsbank), a Turkish bank, rose after it announced strong earn-ings results in April. Punjab National Bank also performedwell after reporting good earnings, and on the expectationthat the bank’s strong low-cost deposit franchise and highreserve coverage will allow it to continue generating highreturns in a rising interest rate environment. Stock selectionin the financials sector, as well as within Brazil and SouthAfrica, helped returns over the past six months.
Conversely, a position in Hon Hai Precision Industry, a lead-ing provider of contract electronics manufacturing services,declined due to concerns about the impact of wage inflationin China. Shares of Shougang Concord International Enter-prises fell due to concerns regarding increasing input costs,while First Quantum Minerals, a mining company that oper-ates within Africa, declined on the back of falling copperprices and heightened political risk. Stock selection in thetelecom services sector and in China also detracted fromreturns over the period.
Annual Report 5
Notes to Investment Overviews:
All returns reflect reinvestment of all dividends and distributions, if any. Certain expenses of the Portfolios may have been waived or reimbursed by theFund’s Investment Manager, Lazard Asset Management LLC (the “Investment Manager”), or Administrator, State Street Bank and Trust Company (“StateStreet”); without such waiver/reimbursement of expenses, the Portfolios’ returns would have been lower. Performance information does not reflect the feesand charges imposed by participating insurance companies at the separate account level, and such charges will have the effect of reducing performance.Past performance is not indicative, or a guarantee, of future results.
The performance data of the indices and other market data have been prepared from sources and data that the Investment Manager believes to be reli-able, but no representation is made as to their accuracy. These indices are unmanaged, have no fees or costs and are not available for investment.
The views of the Investment Manager and the securities described in this report are as of June 30, 2010; these views and portfolio holdings may havechanged subsequent to this date. Nothing herein should be construed as a recommendation to buy, sell, or hold a particular security. There is no assur-ance that the securities discussed herein will remain in each Portfolio at the time you receive this report, or that securities sold will not have beenrepurchased. The specific securities discussed may, in aggregate, represent only a small percentage of each Portfolio’s holdings. It should not be assumedthat securities identified and discussed were, or will be, profitable, or that the investment decisions made in the future will be profitable, or equal the invest-ment performance of the securities discussed herein.
The views and opinions expressed are provided for general information only, and do not constitute specific tax, legal, or investment advice to, or recom-mendations for, any person. There can be no guarantee as to the accuracy of the outlooks for markets, sectors and securities as discussed herein. Youshould read the Fund’s prospectus or each Portfolio’s summary prospectus for a more detailed discussion of each Portfolio’s investment objective, strate-gies, risks and fees.
Semi-Annual Report 5
6 Semi-Annual Report
Lazard Retirement Series, Inc. Performance Overviews (unaudited)
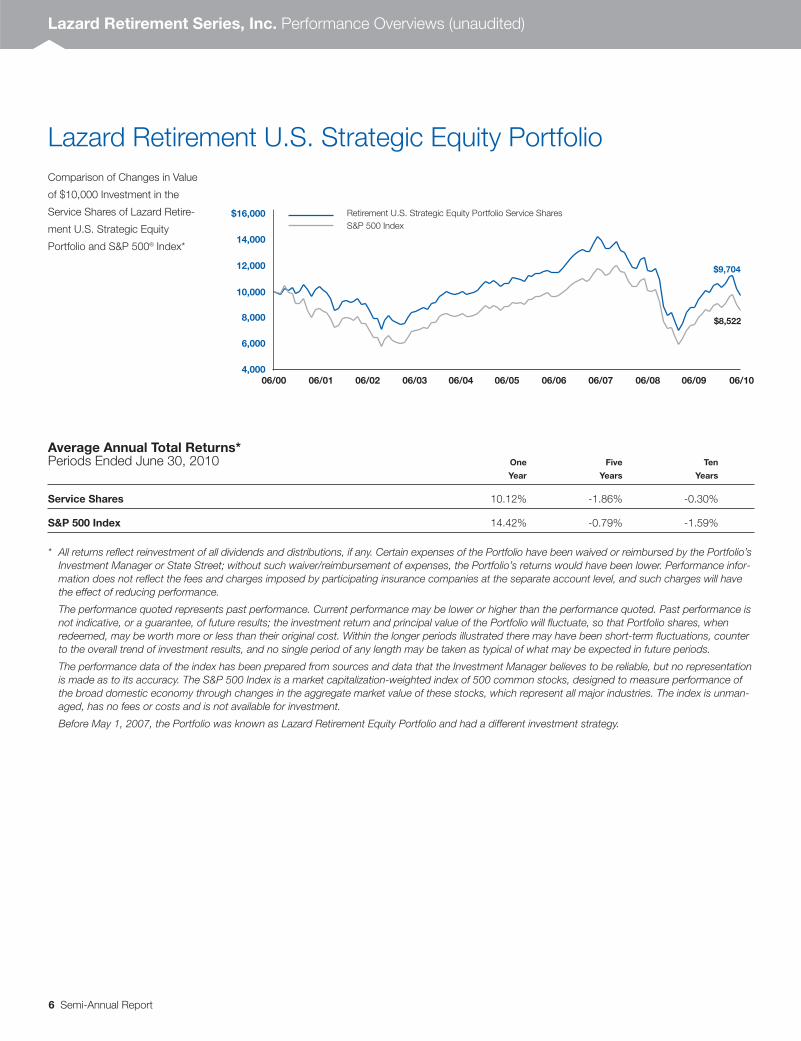
Lazard Retirement U.S. Strategic Equity PortfolioComparison of Changes in Value
of $10,000 Investment in the
Service Shares of Lazard Retire-
ment U.S. Strategic Equity
Portfolio and S&P 500® Index*
Average Annual Total Returns*Periods Ended June 30, 2010 One Five Ten
Year Years Years
Service Shares 10.12% -1.86% -0.30%
S&P 500 Index 14.42% -0.79% -1.59%
* All returns reflect reinvestment of all dividends and distributions, if any. Certain expenses of the Portfolio have been waived or reimbursed by the Portfolio’sInvestment Manager or State Street; without such waiver/reimbursement of expenses, the Portfolio’s returns would have been lower. Performance infor-mation does not reflect the fees and charges imposed by participating insurance companies at the separate account level, and such charges will havethe effect of reducing performance.
The performance quoted represents past performance. Current performance may be lower or higher than the performance quoted. Past performance isnot indicative, or a guarantee, of future results; the investment return and principal value of the Portfolio will fluctuate, so that Portfolio shares, whenredeemed, may be worth more or less than their original cost. Within the longer periods illustrated there may have been short-term fluctuations, counterto the overall trend of investment results, and no single period of any length may be taken as typical of what may be expected in future periods.
The performance data of the index has been prepared from sources and data that the Investment Manager believes to be reliable, but no representationis made as to its accuracy. The S&P 500 Index is a market capitalization-weighted index of 500 common stocks, designed to measure performance ofthe broad domestic economy through changes in the aggregate market value of these stocks, which represent all major industries. The index is unman-aged, has no fees or costs and is not available for investment.
Before May 1, 2007, the Portfolio was known as Lazard Retirement Equity Portfolio and had a different investment strategy.
Retirement U.S. Strategic Equity Portfolio Service SharesS&P 500 Index
4,000
6,000
8,000
10,000
12,000
14,000
$16,000
$8,522
$9,704
06/05 06/06 06/07 06/08 06/1006/0906/00 06/01 06/02 06/03 06/04

Semi-Annual Report 7
Lazard Retirement U.S. Small-Mid Cap Equity PortfolioComparison of Changes in Value
of $10,000 Investment in the
Service Shares of Lazard Retire-
ment U.S. Small-Mid Cap Equity
Portfolio, Russell 2500® Index
and Russell 2000/2500 Linked
Index*
Average Annual Total Returns*Periods Ended June 30, 2010 One Five Ten
Year Years Years
Service Shares 29.49% 1.20% 6.05%
Russell 2500 Index 24.03% 0.98% 4.15%
Russell 2000/2500 Linked Index 24.03% 0.72% 3.18%
* All returns reflect reinvestment of all dividends and distributions, if any. Certain expenses of the Portfolio have been waived or reimbursed by the Portfolio’sInvestment Manager or State Street; without such waiver/reimbursement of expenses, the Portfolio’s returns would have been lower. Performance infor-mation does not reflect the fees and charges imposed by participating insurance companies at the separate account level, and such charges will havethe effect of reducing performance.
The performance quoted represents past performance. Current performance may be lower or higher than the performance quoted. Past performance isnot indicative, or a guarantee, of future results; the investment return and principal value of the Portfolio will fluctuate, so that Portfolio shares, whenredeemed, may be worth more or less than their original cost. Within the longer periods illustrated there may have been short-term fluctuations, counterto the overall trend of investment results, and no single period of any length may be taken as typical of what may be expected in future periods.
The performance data of the indices have been prepared from sources and data that the Investment Manager believes to be reliable, but no representa-tion is made as to their accuracy. The Russell 2500 Index is comprised of the 2,500 smallest U.S. companies included in the Russell 3000® Index (whichconsists of the 3,000 largest U.S. companies by capitalization). The Russell 2000/2500 Linked Index is an index created by the Portfolio’s InvestmentManager, which links the performance of the Russell 2000® Index for all periods prior to June 1, 2009 and the Russell 2500 Index for all periods there-after. The Russell 2000 Index is comprised of the 2,000 smallest U.S. companies included in the Russell 3000 Index. The indices are unmanaged, haveno fees or costs and are not available for investment.
The Portfolio was previously known as Lazard Retirement U.S. Small Cap Equity Portfolio. As of June 1, 2009, the Portfolio changed its name to LazardU.S. Small-Mid Cap Equity Portfolio and changed its investment strategy to invest in equity securities of small-mid cap U.S. companies.
Retirement U.S. Small-Mid Cap Equity Portfolio Service SharesRussell 2500 IndexRussell 2000/2500 Linked Index
5,000
10,000
15,000
20,000
$25,000
$15,028$13,678
$17,988
06/05 06/06 06/07 06/08 06/1006/0906/00 06/01 06/02 06/03 06/04

8 Semi-Annual Report
Lazard Retirement International Equity PortfolioComparison of Changes in Value
of $10,000 Investment in the
Service Shares of Lazard Retire-
ment International Equity
Portfolio and Morgan Stanley
Capital International (MSCI®)
Europe, Australasia and Far East
(EAFE®) Index*
Average Annual Total Returns*Periods Ended June 30, 2010 One Five Ten
Year Years Years
Service Shares 4.76% 0.59% -0.57%
MSCI EAFE Index 5.92% 0.88% 0.15%
* All returns reflect reinvestment of all dividends and distributions, if any. Certain expenses of the Portfolio have been waived or reimbursed by the Portfolio’sInvestment Manager or State Street; without such waiver/reimbursement of expenses, the Portfolio’s returns would have been lower. Performance infor-mation does not reflect the fees and charges imposed by participating insurance companies at the separate account level, and such charges will havethe effect of reducing performance.
The performance quoted represents past performance. Current performance may be lower or higher than the performance quoted. Past performance isnot indicative, or a guarantee, of future results; the investment return and principal value of the Portfolio will fluctuate, so that Portfolio shares, whenredeemed, may be worth more or less than their original cost. Within the longer periods illustrated there may have been short-term fluctuations, counterto the overall trend of investment results, and no single period of any length may be taken as typical of what may be expected in future periods.
The performance data of the index has been prepared from sources and data that the Investment Manager believes to be reliable, but no representationis made as to its accuracy. The MSCI EAFE Index is a broadly diversified international index comprised of equity securities of approximately 1,000 com-panies located outside the United States. The index is unmanaged, has no fees or costs and is not available for investment.
Retirement International Equity Portfolio Service SharesMSCI EAFE Index
5,000
10,000
15,000
$20,000
$10,164
$9,440
06/05 06/06 06/07 06/08 06/1006/0906/00 06/01 06/02 06/03 06/04

Semi-Annual Report 9
Lazard Retirement Emerging Markets Equity PortfolioComparison of Changes in Value
of $10,000 Investment in the
Service Shares of Lazard Retire-
ment Emerging Markets Equity
Portfolio and MSCI Emerging
Markets (EM®) Index*
Average Annual Total Returns*Periods Ended June 30, 2010 Service Shares Investor Shares
One Five Ten One Since
Year Years Years Year Inception†
Retirement Emerging Markets Equity Portfolio** 24.98% 13.54% 11.54% 25.26% 5.53%
MSCI EM Index 23.15% 12.73% 10.02% 23.15% 4.02%
* All returns reflect reinvestment of all dividends and distributions, if any. Certain expenses of the Portfolio have been waived or reimbursed by the Portfolio’sInvestment Manager or State Street; without such waiver/reimbursement of expenses, the Portfolio’s returns would have been lower. Performance infor-mation does not reflect the fees and charges imposed by participating insurance companies at the separate account level, and such charges will havethe effect of reducing performance.
The performance quoted represents past performance. Current performance may be lower or higher than the performance quoted. Past performance isnot indicative, or a guarantee, of future results; the investment return and principal value of the Portfolio will fluctuate, so that Portfolio shares, whenredeemed, may be worth more or less than their original cost. Within the longer periods illustrated there may have been short-term fluctuations, counterto the overall trend of investment results, and no single period of any length may be taken as typical of what may be expected in future periods.
The performance data of the index has been prepared from sources and data that the Investment Manager believes to be reliable, but no representa-tion is made as to its accuracy. The MSCI EM Index is comprised of emerging market securities in countries open to non-local investors. The index isunmanaged, has no fees or costs and is not available for investment.
** The performance of Service Shares may be greater than or less than the performance of Investor Shares, based on the differences in fees borne byshareholders investing in different classes.
† The inception date for Investor Shares was May 1, 2006.
Retirement Emerging Markets Equity Portfolio Service SharesMSCI EM Index
0
10,000
20,000
30,000
$40,000
$25,977
$29,794
06/05 06/06 06/07 06/08 06/1006/0906/00 06/01 06/02 06/03 06/04
10 Semi-Annual Report
Lazard Retirement Series, Inc. Information About Your Portfolio’s Expenses (unaudited)
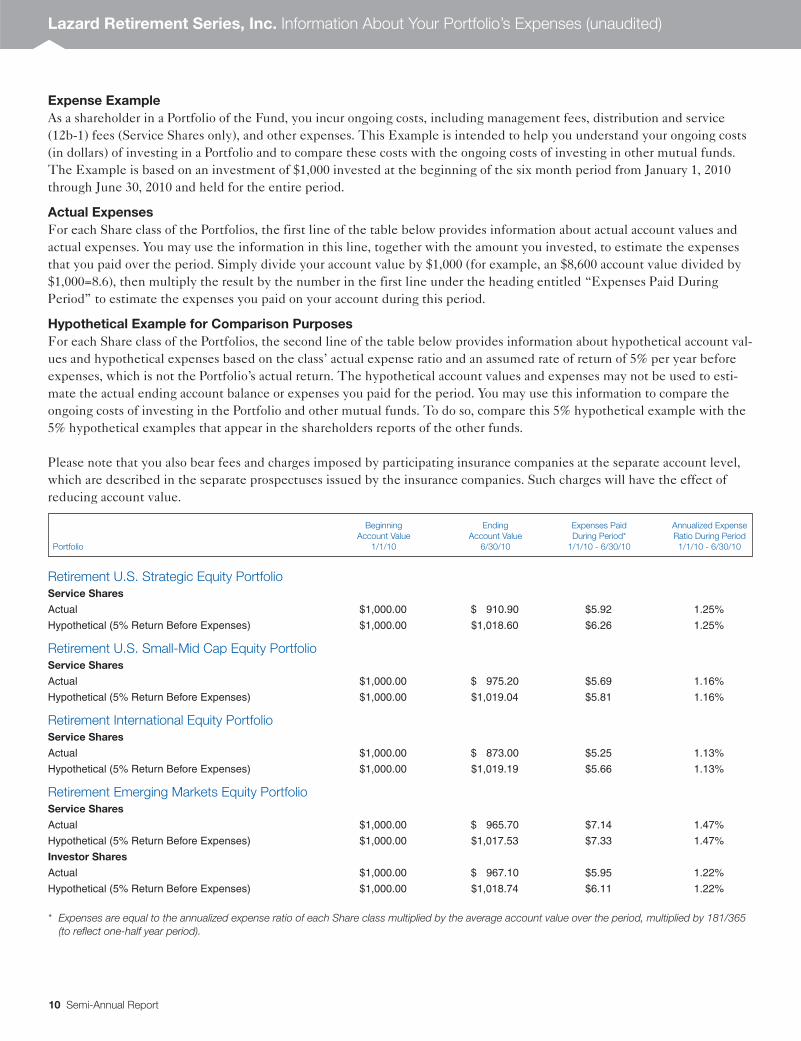
Expense ExampleAs a shareholder in a Portfolio of the Fund, you incur ongoing costs, including management fees, distribution and service(12b-1) fees (Service Shares only), and other expenses. This Example is intended to help you understand your ongoing costs(in dollars) of investing in a Portfolio and to compare these costs with the ongoing costs of investing in other mutual funds.The Example is based on an investment of $1,000 invested at the beginning of the six month period from January 1, 2010through June 30, 2010 and held for the entire period.
Actual ExpensesFor each Share class of the Portfolios, the first line of the table below provides information about actual account values andactual expenses. You may use the information in this line, together with the amount you invested, to estimate the expensesthat you paid over the period. Simply divide your account value by $1,000 (for example, an $8,600 account value divided by$1,000=8.6), then multiply the result by the number in the first line under the heading entitled “Expenses Paid DuringPeriod” to estimate the expenses you paid on your account during this period.
Hypothetical Example for Comparison PurposesFor each Share class of the Portfolios, the second line of the table below provides information about hypothetical account val-ues and hypothetical expenses based on the class’ actual expense ratio and an assumed rate of return of 5% per year beforeexpenses, which is not the Portfolio’s actual return. The hypothetical account values and expenses may not be used to esti-mate the actual ending account balance or expenses you paid for the period. You may use this information to compare theongoing costs of investing in the Portfolio and other mutual funds. To do so, compare this 5% hypothetical example with the5% hypothetical examples that appear in the shareholders reports of the other funds.
Please note that you also bear fees and charges imposed by participating insurance companies at the separate account level,which are described in the separate prospectuses issued by the insurance companies. Such charges will have the effect ofreducing account value.
Retirement U.S. Strategic Equity PortfolioService Shares
Actual $1,000.00 $ 910.90 $5.92 1.25%
Hypothetical (5% Return Before Expenses) $1,000.00 $1,018.60 $6.26 1.25%
Retirement U.S. Small-Mid Cap Equity PortfolioService Shares
Actual $1,000.00 $ 975.20 $5.69 1.16%
Hypothetical (5% Return Before Expenses) $1,000.00 $1,019.04 $5.81 1.16%
Retirement International Equity PortfolioService Shares
Actual $1,000.00 $ 873.00 $5.25 1.13%
Hypothetical (5% Return Before Expenses) $1,000.00 $1,019.19 $5.66 1.13%
Retirement Emerging Markets Equity PortfolioService Shares
Actual $1,000.00 $ 965.70 $7.14 1.47%
Hypothetical (5% Return Before Expenses) $1,000.00 $1,017.53 $7.33 1.47%
Investor Shares
Actual $1,000.00 $ 967.10 $5.95 1.22%
Hypothetical (5% Return Before Expenses) $1,000.00 $1,018.74 $6.11 1.22%
* Expenses are equal to the annualized expense ratio of each Share class multiplied by the average account value over the period, multiplied by 181/365(to reflect one-half year period).
Beginning Ending Expenses Paid Annualized ExpenseAccount Value Account Value During Period* Ratio During Period
Portfolio 1/1/10 6/30/10 1/1/10 - 6/30/10 1/1/10 - 6/30/10
Semi-Annual Report 11
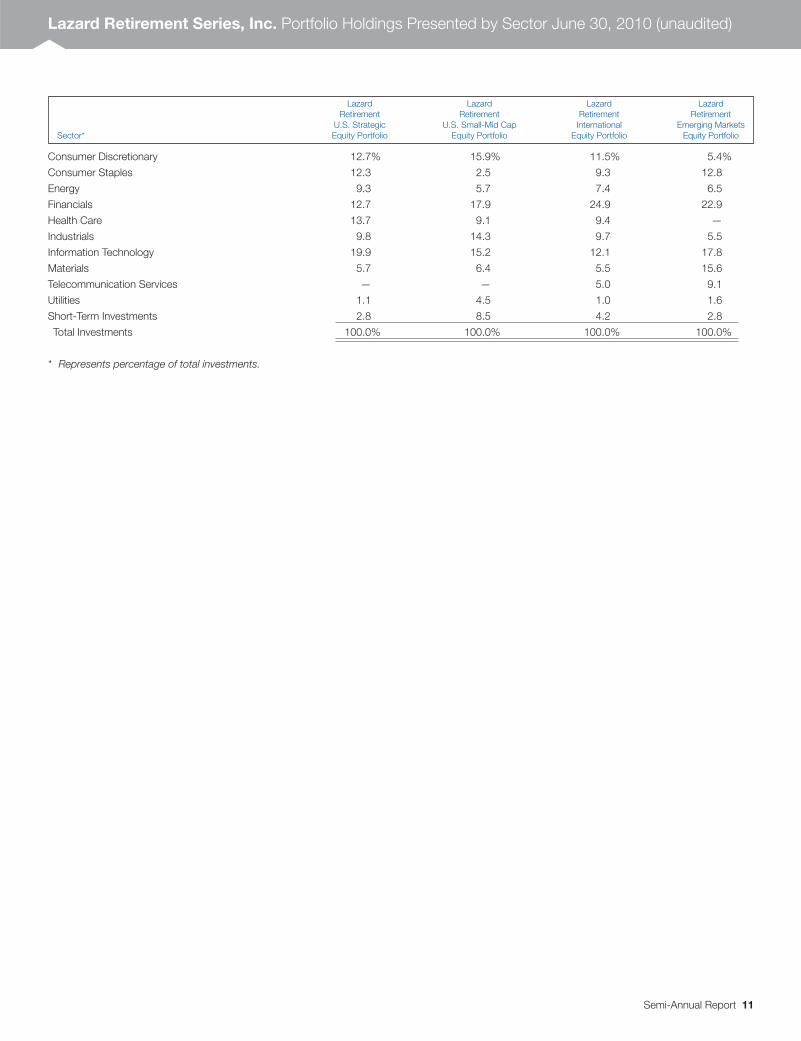
Lazard Retirement Series, Inc. Portfolio Holdings Presented by Sector June 30, 2010 (unaudited)
Lazard Lazard Lazard LazardRetirement Retirement Retirement Retirement
U.S. Strategic U.S. Small-Mid Cap International Emerging MarketsSector* Equity Portfolio Equity Portfolio Equity Portfolio Equity Portfolio
Consumer Discretionary 12.7% 15.9% 11.5% 5.4%
Consumer Staples 12.3 2.5 9.3 12.8
Energy 9.3 5.7 7.4 6.5
Financials 12.7 17.9 24.9 22.9
Health Care 13.7 9.1 9.4 —
Industrials 9.8 14.3 9.7 5.5
Information Technology 19.9 15.2 12.1 17.8
Materials 5.7 6.4 5.5 15.6
Telecommunication Services — — 5.0 9.1
Utilities 1.1 4.5 1.0 1.6
Short-Term Investments 2.8 8.5 4.2 2.8
Total Investments 100.0% 100.0% 100.0% 100.0%
* Represents percentage of total investments.
12 Semi-Annual Report
Description Shares Value Description Shares Value
The accompanying notes are an integral part of these financial statements.
Description Shares Value Description Shares Value
Lazard Retirement U.S. Strategic Equity Portfolio
Common Stocks | 97.9%
Aerospace & Defense | 2.8%
Raytheon Co. 2,870 $ 138,879
Agriculture | 1.8%
Monsanto Co. 580 26,808
The Mosaic Co. 1,670 65,096
91,904
Alcohol & Tobacco | 1.9%
Molson Coors Brewing Co., Class B 2,240 94,886
Automotive | 1.1%
Better Place 10,567 31,701
Ford Motor Co. (a) 2,325 23,436
55,137
Banking | 5.4%
Bank of America Corp. 2,745 39,446
JPMorgan Chase & Co. 3,310 121,179
Wells Fargo & Co. 4,235 108,416
269,041
Cable Television | 4.2%
Comcast Corp., Class A 12,605 207,100
Coal | 0.4%
Massey Energy Co. 660 18,051
Commercial Services | 1.0%
Corrections Corp. of America (a) 2,600 49,608
Computer Software | 6.6%
Microsoft Corp. 6,120 140,821
Oracle Corp. 5,535 118,781
Symantec Corp. (a) 5,075 70,441
330,043
Consumer Products | 4.1%
Avon Products, Inc. 2,605 69,032
Mattel, Inc. 3,455 73,108
The Procter & Gamble Co. 1,015 60,880
203,020
Energy Exploration & Production | 0.9%
Apache Corp. 549 $ 46,220
Energy Integrated | 6.5%
Chevron Corp. 1,120 76,003
ConocoPhillips 5,030 246,923
322,926
Energy Services | 0.6%
Halliburton Co. 1,210 29,706
Financial Services | 4.8%
Ameriprise Financial, Inc. 2,435 87,977
NYSE Euronext 2,505 69,213
State Street Corp. 1,475 49,884
The Goldman Sachs Group, Inc. 230 30,192
237,266
Food & Beverages | 1.2%
PepsiCo, Inc. 945 57,598
Gas Utilities | 1.1%
EQT Corp. 1,485 53,668
Insurance | 2.6%
PartnerRe, Ltd. 570 39,980
The Travelers Cos., Inc. 1,800 88,650
128,630
Leisure & Entertainment | 2.5%
Apollo Group, Inc., Class A (a) 500 21,235
Darden Restaurants, Inc. 600 23,310
McDonald’s Corp. 1,240 81,679
126,224
Manufacturing | 4.8%
Caterpillar, Inc. 1,025 61,572
Dover Corp. 1,235 51,611
Emerson Electric Co. 1,145 50,025
Honeywell International, Inc. 2,005 78,255
241,463
Medical Products | 2.1%
Beckman Coulter, Inc. 600 36,174
Medtronic, Inc. 1,845 66,918
103,092
Metal & Glass Containers | 2.9%
Ball Corp. 2,780 146,868
Lazard Retirement Series, Inc. Portfolios of Investments June 30, 2010 (unaudited)
Semi-Annual Report 13
Description Shares Value Description Shares Value
The accompanying notes are an integral part of these financial statements.
Description Shares Value Description Shares Value
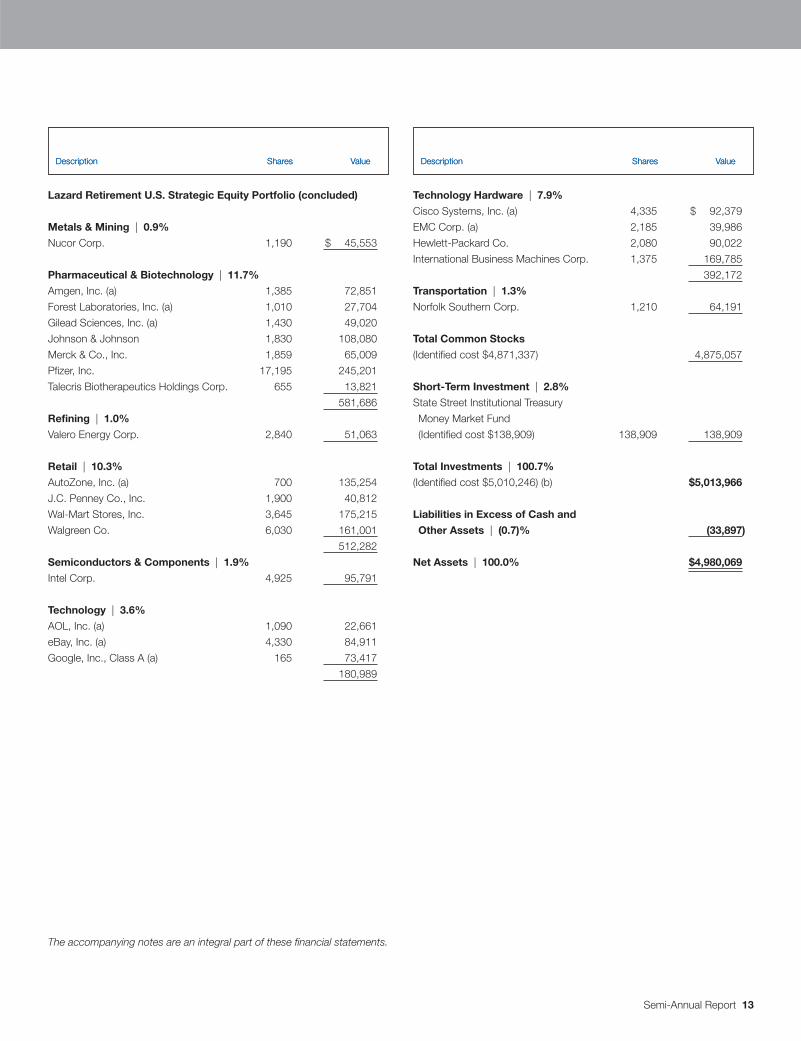
Lazard Retirement U.S. Strategic Equity Portfolio (concluded)
Metals & Mining | 0.9%
Nucor Corp. 1,190 $ 45,553
Pharmaceutical & Biotechnology | 11.7%
Amgen, Inc. (a) 1,385 72,851
Forest Laboratories, Inc. (a) 1,010 27,704
Gilead Sciences, Inc. (a) 1,430 49,020
Johnson & Johnson 1,830 108,080
Merck & Co., Inc. 1,859 65,009
Pfizer, Inc. 17,195 245,201
Talecris Biotherapeutics Holdings Corp. 655 13,821
581,686
Refining | 1.0%
Valero Energy Corp. 2,840 51,063
Retail | 10.3%
AutoZone, Inc. (a) 700 135,254
J.C. Penney Co., Inc. 1,900 40,812
Wal-Mart Stores, Inc. 3,645 175,215
Walgreen Co. 6,030 161,001
512,282
Semiconductors & Components | 1.9%
Intel Corp. 4,925 95,791
Technology | 3.6%
AOL, Inc. (a) 1,090 22,661
eBay, Inc. (a) 4,330 84,911
Google, Inc., Class A (a) 165 73,417
180,989
Technology Hardware | 7.9%
Cisco Systems, Inc. (a) 4,335 $ 92,379
EMC Corp. (a) 2,185 39,986
Hewlett-Packard Co. 2,080 90,022
International Business Machines Corp. 1,375 169,785
392,172
Transportation | 1.3%
Norfolk Southern Corp. 1,210 64,191
Total Common Stocks
(Identified cost $4,871,337) 4,875,057
Short-Term Investment | 2.8%
State Street Institutional Treasury
Money Market Fund
(Identified cost $138,909) 138,909 138,909
Total Investments | 100.7%
(Identified cost $5,010,246) (b) $5,013,966
Liabilities in Excess of Cash and
Other Assets | (0.7)% (33,897)
Net Assets | 100.0% $4,980,069
14 Semi-Annual Report
Description Shares Value Description Shares Value
The accompanying notes are an integral part of these financial statements.
Description Shares Value Description Shares Value
The accompanying notes are an integral part of these financial statements.
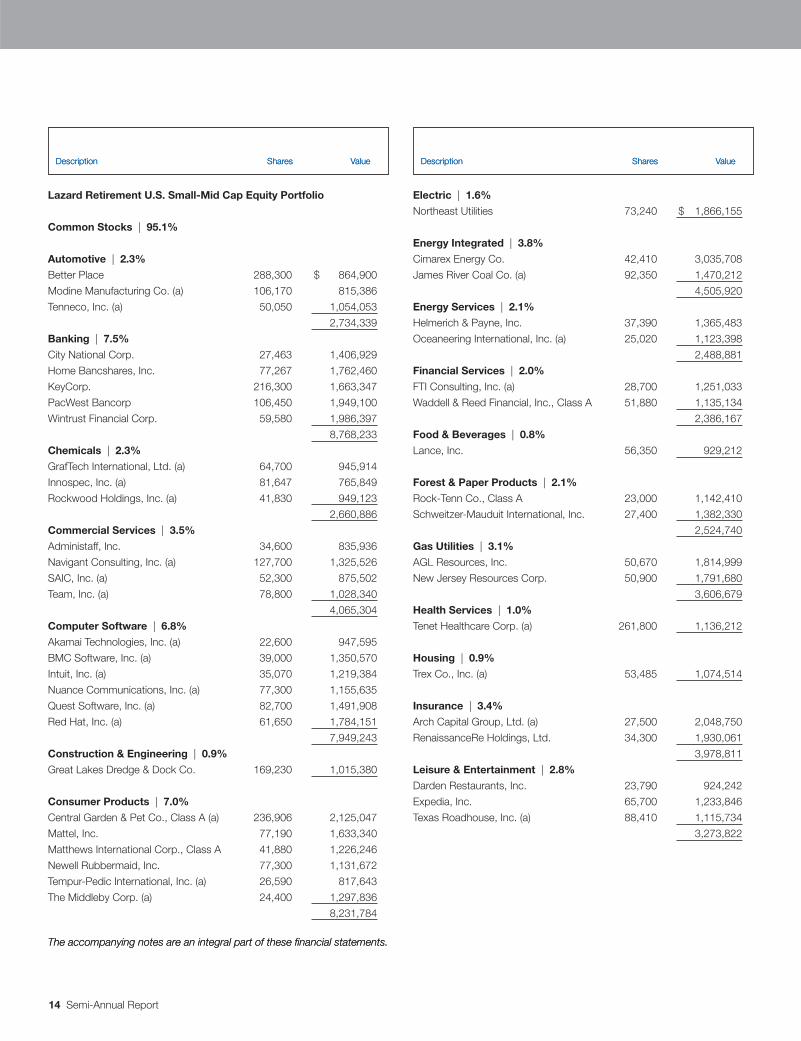
Lazard Retirement U.S. Small-Mid Cap Equity Portfolio
Common Stocks | 95.1%
Automotive | 2.3%
Better Place 288,300 $ 864,900
Modine Manufacturing Co. (a) 106,170 815,386
Tenneco, Inc. (a) 50,050 1,054,053
2,734,339
Banking | 7.5%
City National Corp. 27,463 1,406,929
Home Bancshares, Inc. 77,267 1,762,460
KeyCorp. 216,300 1,663,347
PacWest Bancorp 106,450 1,949,100
Wintrust Financial Corp. 59,580 1,986,397
8,768,233
Chemicals | 2.3%
GrafTech International, Ltd. (a) 64,700 945,914
Innospec, Inc. (a) 81,647 765,849
Rockwood Holdings, Inc. (a) 41,830 949,123
2,660,886
Commercial Services | 3.5%
Administaff, Inc. 34,600 835,936
Navigant Consulting, Inc. (a) 127,700 1,325,526
SAIC, Inc. (a) 52,300 875,502
Team, Inc. (a) 78,800 1,028,340
4,065,304
Computer Software | 6.8%
Akamai Technologies, Inc. (a) 22,600 947,595
BMC Software, Inc. (a) 39,000 1,350,570
Intuit, Inc. (a) 35,070 1,219,384
Nuance Communications, Inc. (a) 77,300 1,155,635
Quest Software, Inc. (a) 82,700 1,491,908
Red Hat, Inc. (a) 61,650 1,784,151
7,949,243
Construction & Engineering | 0.9%
Great Lakes Dredge & Dock Co. 169,230 1,015,380
Consumer Products | 7.0%
Central Garden & Pet Co., Class A (a) 236,906 2,125,047
Mattel, Inc. 77,190 1,633,340
Matthews International Corp., Class A 41,880 1,226,246
Newell Rubbermaid, Inc. 77,300 1,131,672
Tempur-Pedic International, Inc. (a) 26,590 817,643
The Middleby Corp. (a) 24,400 1,297,836
8,231,784
Electric | 1.6%
Northeast Utilities 73,240 $ 1,866,155
Energy Integrated | 3.8%
Cimarex Energy Co. 42,410 3,035,708
James River Coal Co. (a) 92,350 1,470,212
4,505,920
Energy Services | 2.1%
Helmerich & Payne, Inc. 37,390 1,365,483
Oceaneering International, Inc. (a) 25,020 1,123,398
2,488,881
Financial Services | 2.0%
FTI Consulting, Inc. (a) 28,700 1,251,033
Waddell & Reed Financial, Inc., Class A 51,880 1,135,134
2,386,167
Food & Beverages | 0.8%
Lance, Inc. 56,350 929,212
Forest & Paper Products | 2.1%
Rock-Tenn Co., Class A 23,000 1,142,410
Schweitzer-Mauduit International, Inc. 27,400 1,382,330
2,524,740
Gas Utilities | 3.1%
AGL Resources, Inc. 50,670 1,814,999
New Jersey Resources Corp. 50,900 1,791,680
3,606,679
Health Services | 1.0%
Tenet Healthcare Corp. (a) 261,800 1,136,212
Housing | 0.9%
Trex Co., Inc. (a) 53,485 1,074,514
Insurance | 3.4%
Arch Capital Group, Ltd. (a) 27,500 2,048,750
RenaissanceRe Holdings, Ltd. 34,300 1,930,061
3,978,811
Leisure & Entertainment | 2.8%
Darden Restaurants, Inc. 23,790 924,242
Expedia, Inc. 65,700 1,233,846
Texas Roadhouse, Inc. (a) 88,410 1,115,734
3,273,822

Semi-Annual Report 15
Description Shares Value Description Shares Value
The accompanying notes are an integral part of these financial statements.
Description Shares Value Description Shares Value
The accompanying notes are an integral part of these financial statements.
Lazard Retirement U.S. Small-Mid Cap Equity Portfolio (concluded)
Manufacturing | 7.7%
Altra Holdings, Inc. (a) 78,830 $ 1,026,366
BE Aerospace, Inc. (a) 57,800 1,469,854
Bucyrus International, Inc. 18,600 882,570
DXP Enterprises, Inc. (a) 65,901 1,031,351
FLIR Systems, Inc. (a) 52,540 1,528,388
Generac Holdings, Inc. 82,773 1,159,650
Gibraltar Industries, Inc. (a) 100,450 1,014,545
Regal-Beloit Corp. 16,160 901,405
9,014,129
Medical Products | 6.8%
Beckman Coulter, Inc. 20,400 1,229,916
CareFusion Corp. (a) 78,040 1,771,508
Haemonetics Corp. (a) 24,240 1,297,325
Hospira, Inc. (a) 38,970 2,238,826
Life Technologies Corp. (a) 31,600 1,493,100
8,030,675
Metal & Glass Containers | 2.0%
Ball Corp. 24,470 1,292,750
Owens-Illinois, Inc. (a) 41,010 1,084,715
2,377,465
Metals & Mining | 1.0%
Schnitzer Steel Industries, Inc., Class A 29,230 1,145,816
Pharmaceutical & Biotechnology | 1.7%
Warner Chilcott PLC, Class A (a) 85,330 1,949,790
Real Estate | 6.8%
Digital Realty Trust, Inc. REIT 20,600 1,188,208
Extra Space Storage, Inc. REIT 84,500 1,174,550
Kilroy Realty Corp. REIT 59,550 1,770,422
The Macerich Co. REIT 46,322 1,728,737
UDR, Inc. REIT 109,800 2,100,474
7,962,391
Retail | 7.2%
American Eagle Outfitters, Inc. 103,820 $ 1,219,885
Family Dollar Stores, Inc. 40,970 1,544,159
Iconix Brand Group, Inc. (a) 103,520 1,487,582
Kirkland’s, Inc. (a) 59,652 1,006,628
Liz Claiborne, Inc. (a) 151,430 639,035
The Gymboree Corp. (a) 35,210 1,503,819
Williams-Sonoma, Inc. 44,200 1,097,044
8,498,152
Semiconductors & Components | 3.3%
CPI International, Inc. (a) 62,245 970,400
Micron Technology, Inc. (a) 81,900 695,331
ON Semiconductor Corp. (a) 219,100 1,397,858
Supertex, Inc. (a) 33,350 822,411
3,886,000
Technology | 1.6%
SS&C Technologies Holdings, Inc. 119,100 1,909,173
Technology Hardware | 0.7%
Polycom, Inc. (a) 28,600 851,994
Transportation | 2.4%
Echo Global Logistics, Inc. 128,863 1,573,417
UTI Worldwide, Inc. 99,726 1,234,608
2,808,025
Total Common Stocks
(Identified cost $108,389,137) 111,629,892
Short-Term Investment | 8.9%
State Street Institutional Treasury
Money Market Fund
(Identified cost $10,412,693) 10,412,693 10,412,693
Total Investments | 104.0%
(Identified cost $118,801,830) (b) $122,042,585
Liabilities in Excess of Cash and
Other Assets | (4.0)% (4,690,831)
Net Assets | 100.0% $117,351,754
16 Semi-Annual Report
Description Shares Value Description Shares Value
The accompanying notes are an integral part of these financial statements.
Description Shares Value
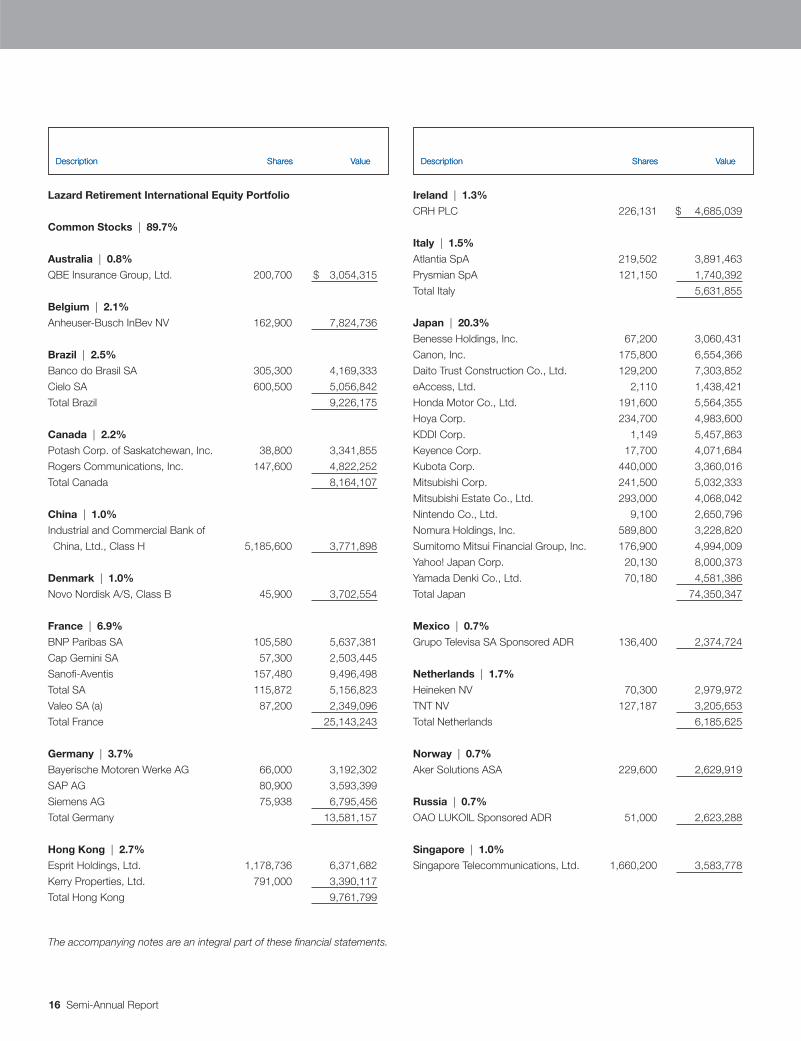
Lazard Retirement International Equity Portfolio
Common Stocks | 89.7%
Australia | 0.8%
QBE Insurance Group, Ltd. 200,700 $ 3,054,315
Belgium | 2.1%
Anheuser-Busch InBev NV 162,900 7,824,736
Brazil | 2.5%
Banco do Brasil SA 305,300 4,169,333
Cielo SA 600,500 5,056,842
Total Brazil 9,226,175
Canada | 2.2%
Potash Corp. of Saskatchewan, Inc. 38,800 3,341,855
Rogers Communications, Inc. 147,600 4,822,252
Total Canada 8,164,107
China | 1.0%
Industrial and Commercial Bank of
China, Ltd., Class H 5,185,600 3,771,898
Denmark | 1.0%
Novo Nordisk A/S, Class B 45,900 3,702,554
France | 6.9%
BNP Paribas SA 105,580 5,637,381
Cap Gemini SA 57,300 2,503,445
Sanofi-Aventis 157,480 9,496,498
Total SA 115,872 5,156,823
Valeo SA (a) 87,200 2,349,096
Total France 25,143,243
Germany | 3.7%
Bayerische Motoren Werke AG 66,000 3,192,302
SAP AG 80,900 3,593,399
Siemens AG 75,938 6,795,456
Total Germany 13,581,157
Hong Kong | 2.7%
Esprit Holdings, Ltd. 1,178,736 6,371,682
Kerry Properties, Ltd. 791,000 3,390,117
Total Hong Kong 9,761,799
Ireland | 1.3%
CRH PLC 226,131 $ 4,685,039
Italy | 1.5%
Atlantia SpA 219,502 3,891,463
Prysmian SpA 121,150 1,740,392
Total Italy 5,631,855
Japan | 20.3%
Benesse Holdings, Inc. 67,200 3,060,431
Canon, Inc. 175,800 6,554,366
Daito Trust Construction Co., Ltd. 129,200 7,303,852
eAccess, Ltd. 2,110 1,438,421
Honda Motor Co., Ltd. 191,600 5,564,355
Hoya Corp. 234,700 4,983,600
KDDI Corp. 1,149 5,457,863
Keyence Corp. 17,700 4,071,684
Kubota Corp. 440,000 3,360,016
Mitsubishi Corp. 241,500 5,032,333
Mitsubishi Estate Co., Ltd. 293,000 4,068,042
Nintendo Co., Ltd. 9,100 2,650,796
Nomura Holdings, Inc. 589,800 3,228,820
Sumitomo Mitsui Financial Group, Inc. 176,900 4,994,009
Yahoo! Japan Corp. 20,130 8,000,373
Yamada Denki Co., Ltd. 70,180 4,581,386
Total Japan 74,350,347
Mexico | 0.7%
Grupo Televisa SA Sponsored ADR 136,400 2,374,724
Netherlands | 1.7%
Heineken NV 70,300 2,979,972
TNT NV 127,187 3,205,653
Total Netherlands 6,185,625
Norway | 0.7%
Aker Solutions ASA 229,600 2,629,919
Russia | 0.7%
OAO LUKOIL Sponsored ADR 51,000 2,623,288
Singapore | 1.0%
Singapore Telecommunications, Ltd. 1,660,200 3,583,778
Description Shares Value
Semi-Annual Report 17
Description Shares Value Description Shares Value
The accompanying notes are an integral part of these financial statements.
Description Shares Value Description Shares Value
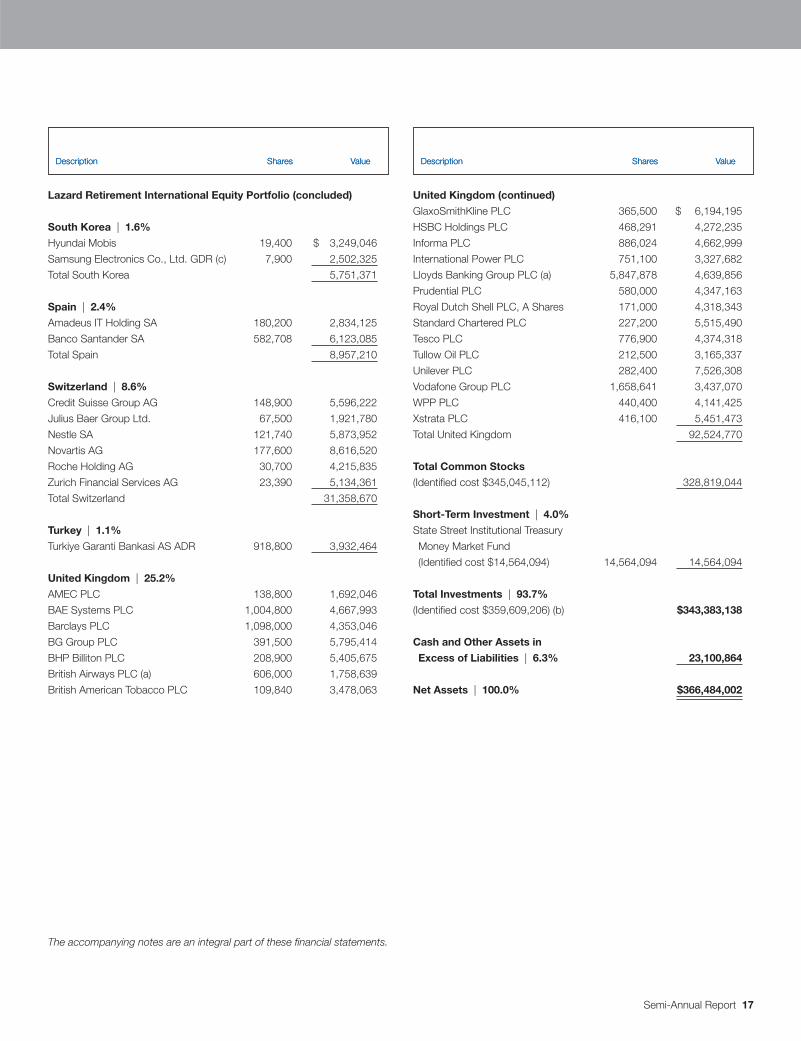
Lazard Retirement International Equity Portfolio (concluded)
South Korea | 1.6%
Hyundai Mobis 19,400 $ 3,249,046
Samsung Electronics Co., Ltd. GDR (c) 7,900 2,502,325
Total South Korea 5,751,371
Spain | 2.4%
Amadeus IT Holding SA 180,200 2,834,125
Banco Santander SA 582,708 6,123,085
Total Spain 8,957,210
Switzerland | 8.6%
Credit Suisse Group AG 148,900 5,596,222
Julius Baer Group Ltd. 67,500 1,921,780
Nestle SA 121,740 5,873,952
Novartis AG 177,600 8,616,520
Roche Holding AG 30,700 4,215,835
Zurich Financial Services AG 23,390 5,134,361
Total Switzerland 31,358,670
Turkey | 1.1%
Turkiye Garanti Bankasi AS ADR 918,800 3,932,464
United Kingdom | 25.2%
AMEC PLC 138,800 1,692,046
BAE Systems PLC 1,004,800 4,667,993
Barclays PLC 1,098,000 4,353,046
BG Group PLC 391,500 5,795,414
BHP Billiton PLC 208,900 5,405,675
British Airways PLC (a) 606,000 1,758,639
British American Tobacco PLC 109,840 3,478,063
United Kingdom (continued)
GlaxoSmithKline PLC 365,500 $ 6,194,195
HSBC Holdings PLC 468,291 4,272,235
Informa PLC 886,024 4,662,999
International Power PLC 751,100 3,327,682
Lloyds Banking Group PLC (a) 5,847,878 4,639,856
Prudential PLC 580,000 4,347,163
Royal Dutch Shell PLC, A Shares 171,000 4,318,343
Standard Chartered PLC 227,200 5,515,490
Tesco PLC 776,900 4,374,318
Tullow Oil PLC 212,500 3,165,337
Unilever PLC 282,400 7,526,308
Vodafone Group PLC 1,658,641 3,437,070
WPP PLC 440,400 4,141,425
Xstrata PLC 416,100 5,451,473
Total United Kingdom 92,524,770
Total Common Stocks
(Identified cost $345,045,112) 328,819,044
Short-Term Investment | 4.0%
State Street Institutional Treasury
Money Market Fund
(Identified cost $14,564,094) 14,564,094 14,564,094
Total Investments | 93.7%
(Identified cost $359,609,206) (b) $343,383,138
Cash and Other Assets in
Excess of Liabilities | 6.3% 23,100,864
Net Assets | 100.0% $366,484,002
18 Semi-Annual Report
Description Shares Value Description Shares Value
The accompanying notes are an integral part of these financial statements.
Description Shares Value Description Shares Value
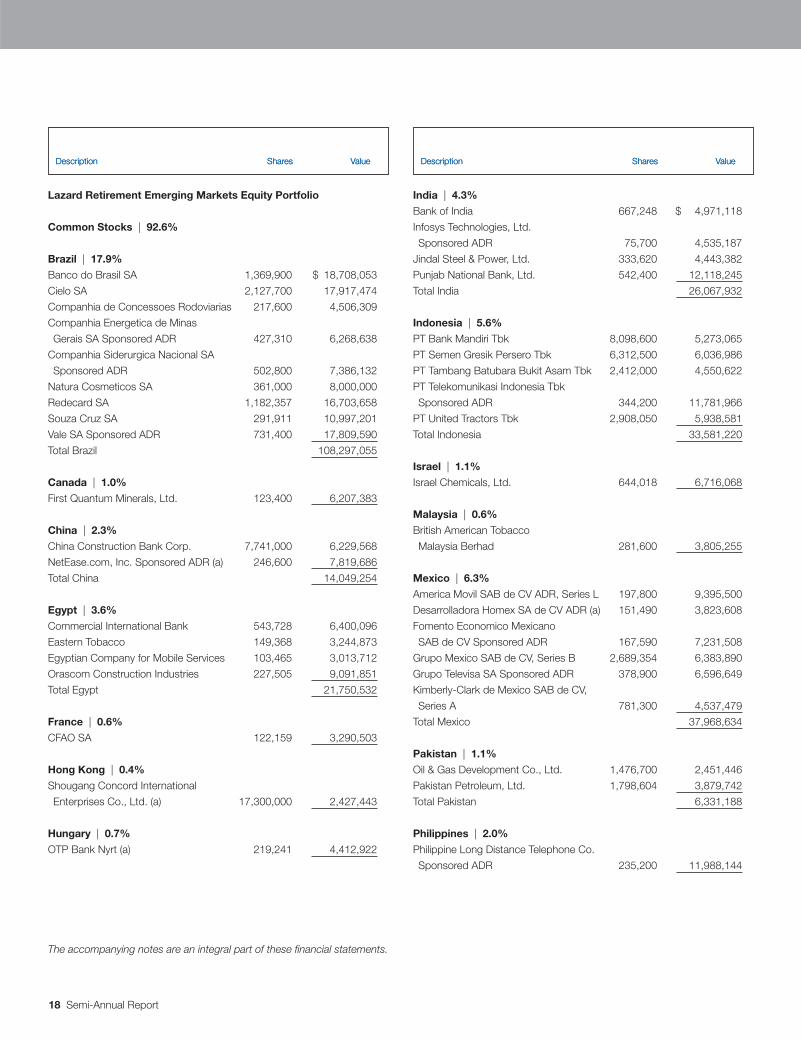
Lazard Retirement Emerging Markets Equity Portfolio
Common Stocks | 92.6%
Brazil | 17.9%
Banco do Brasil SA 1,369,900 $ 18,708,053
Cielo SA 2,127,700 17,917,474
Companhia de Concessoes Rodoviarias 217,600 4,506,309
Companhia Energetica de Minas
Gerais SA Sponsored ADR 427,310 6,268,638
Companhia Siderurgica Nacional SA
Sponsored ADR 502,800 7,386,132
Natura Cosmeticos SA 361,000 8,000,000
Redecard SA 1,182,357 16,703,658
Souza Cruz SA 291,911 10,997,201
Vale SA Sponsored ADR 731,400 17,809,590
Total Brazil 108,297,055
Canada | 1.0%
First Quantum Minerals, Ltd. 123,400 6,207,383
China | 2.3%
China Construction Bank Corp. 7,741,000 6,229,568
NetEase.com, Inc. Sponsored ADR (a) 246,600 7,819,686
Total China 14,049,254
Egypt | 3.6%
Commercial International Bank 543,728 6,400,096
Eastern Tobacco 149,368 3,244,873
Egyptian Company for Mobile Services 103,465 3,013,712
Orascom Construction Industries 227,505 9,091,851
Total Egypt 21,750,532
France | 0.6%
CFAO SA 122,159 3,290,503
Hong Kong | 0.4%
Shougang Concord International
Enterprises Co., Ltd. (a) 17,300,000 2,427,443
Hungary | 0.7%
OTP Bank Nyrt (a) 219,241 4,412,922
India | 4.3%
Bank of India 667,248 $ 4,971,118
Infosys Technologies, Ltd.
Sponsored ADR 75,700 4,535,187
Jindal Steel & Power, Ltd. 333,620 4,443,382
Punjab National Bank, Ltd. 542,400 12,118,245
Total India 26,067,932
Indonesia | 5.6%
PT Bank Mandiri Tbk 8,098,600 5,273,065
PT Semen Gresik Persero Tbk 6,312,500 6,036,986
PT Tambang Batubara Bukit Asam Tbk 2,412,000 4,550,622
PT Telekomunikasi Indonesia Tbk
Sponsored ADR 344,200 11,781,966
PT United Tractors Tbk 2,908,050 5,938,581
Total Indonesia 33,581,220
Israel | 1.1%
Israel Chemicals, Ltd. 644,018 6,716,068
Malaysia | 0.6%
British American Tobacco
Malaysia Berhad 281,600 3,805,255
Mexico | 6.3%
America Movil SAB de CV ADR, Series L 197,800 9,395,500
Desarrolladora Homex SA de CV ADR (a) 151,490 3,823,608
Fomento Economico Mexicano
SAB de CV Sponsored ADR 167,590 7,231,508
Grupo Mexico SAB de CV, Series B 2,689,354 6,383,890
Grupo Televisa SA Sponsored ADR 378,900 6,596,649
Kimberly-Clark de Mexico SAB de CV,
Series A 781,300 4,537,479
Total Mexico 37,968,634
Pakistan | 1.1%
Oil & Gas Development Co., Ltd. 1,476,700 2,451,446
Pakistan Petroleum, Ltd. 1,798,604 3,879,742
Total Pakistan 6,331,188
Philippines | 2.0%
Philippine Long Distance Telephone Co.
Sponsored ADR 235,200 11,988,144
Semi-Annual Report 19
Description Shares Value Description Shares Value
The accompanying notes are an integral part of these financial statements.
Description Shares Value Description Shares Value
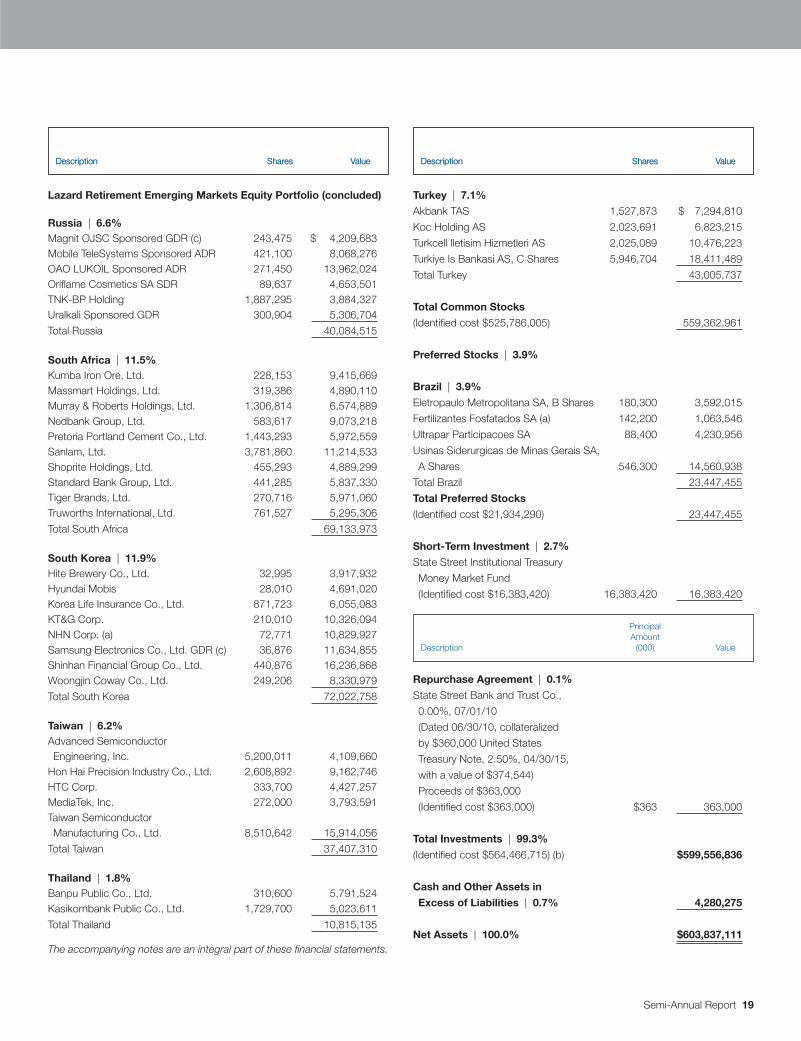
Lazard Retirement Emerging Markets Equity Portfolio (concluded)
Russia | 6.6%Magnit OJSC Sponsored GDR (c) 243,475 $ 4,209,683Mobile TeleSystems Sponsored ADR 421,100 8,068,276OAO LUKOIL Sponsored ADR 271,450 13,962,024Oriflame Cosmetics SA SDR 89,637 4,653,501TNK-BP Holding 1,887,295 3,884,327Uralkali Sponsored GDR 300,904 5,306,704
Total Russia 40,084,515
South Africa | 11.5%Kumba Iron Ore, Ltd. 228,153 9,415,669Massmart Holdings, Ltd. 319,386 4,890,110Murray & Roberts Holdings, Ltd. 1,306,814 6,574,889Nedbank Group, Ltd. 583,617 9,073,218Pretoria Portland Cement Co., Ltd. 1,443,293 5,972,559Sanlam, Ltd. 3,781,860 11,214,533Shoprite Holdings, Ltd. 455,293 4,889,299Standard Bank Group, Ltd. 441,285 5,837,330Tiger Brands, Ltd. 270,716 5,971,060Truworths International, Ltd. 761,527 5,295,306
Total South Africa 69,133,973
South Korea | 11.9%Hite Brewery Co., Ltd. 32,995 3,917,932Hyundai Mobis 28,010 4,691,020Korea Life Insurance Co., Ltd. 871,723 6,055,083KT&G Corp. 210,010 10,326,094NHN Corp. (a) 72,771 10,829,927Samsung Electronics Co., Ltd. GDR (c) 36,876 11,634,855Shinhan Financial Group Co., Ltd. 440,876 16,236,868Woongjin Coway Co., Ltd. 249,206 8,330,979
Total South Korea 72,022,758
Taiwan | 6.2%Advanced Semiconductor Engineering, Inc. 5,200,011 4,109,660
Hon Hai Precision Industry Co., Ltd. 2,608,892 9,162,746HTC Corp. 333,700 4,427,257MediaTek, Inc. 272,000 3,793,591Taiwan Semiconductor Manufacturing Co., Ltd. 8,510,642 15,914,056
Total Taiwan 37,407,310
Thailand | 1.8%Banpu Public Co., Ltd. 310,600 5,791,524Kasikornbank Public Co., Ltd. 1,729,700 5,023,611
Total Thailand 10,815,135
Turkey | 7.1%
Akbank TAS 1,527,873 $ 7,294,810
Koc Holding AS 2,023,691 6,823,215
Turkcell Iletisim Hizmetleri AS 2,025,089 10,476,223
Turkiye Is Bankasi AS, C Shares 5,946,704 18,411,489
Total Turkey 43,005,737
Total Common Stocks
(Identified cost $525,786,005) 559,362,961
Preferred Stocks | 3.9%
Brazil | 3.9%
Eletropaulo Metropolitana SA, B Shares 180,300 3,592,015
Fertilizantes Fosfatados SA (a) 142,200 1,063,546
Ultrapar Participacoes SA 88,400 4,230,956
Usinas Siderurgicas de Minas Gerais SA,
A Shares 546,300 14,560,938
Total Brazil 23,447,455
Total Preferred Stocks
(Identified cost $21,934,290) 23,447,455
Short-Term Investment | 2.7%
State Street Institutional Treasury
Money Market Fund
(Identified cost $16,383,420) 16,383,420 16,383,420
Repurchase Agreement | 0.1%
State Street Bank and Trust Co.,
0.00%, 07/01/10
(Dated 06/30/10, collateralized
by $360,000 United States
Treasury Note, 2.50%, 04/30/15,
with a value of $374,544)
Proceeds of $363,000
(Identified cost $363,000) $363 363,000
Total Investments | 99.3%
(Identified cost $564,466,715) (b) $599,556,836
Cash and Other Assets in
Excess of Liabilities | 0.7% 4,280,275
Net Assets | 100.0% $603,837,111
PrincipalAmount
Description (000) Value
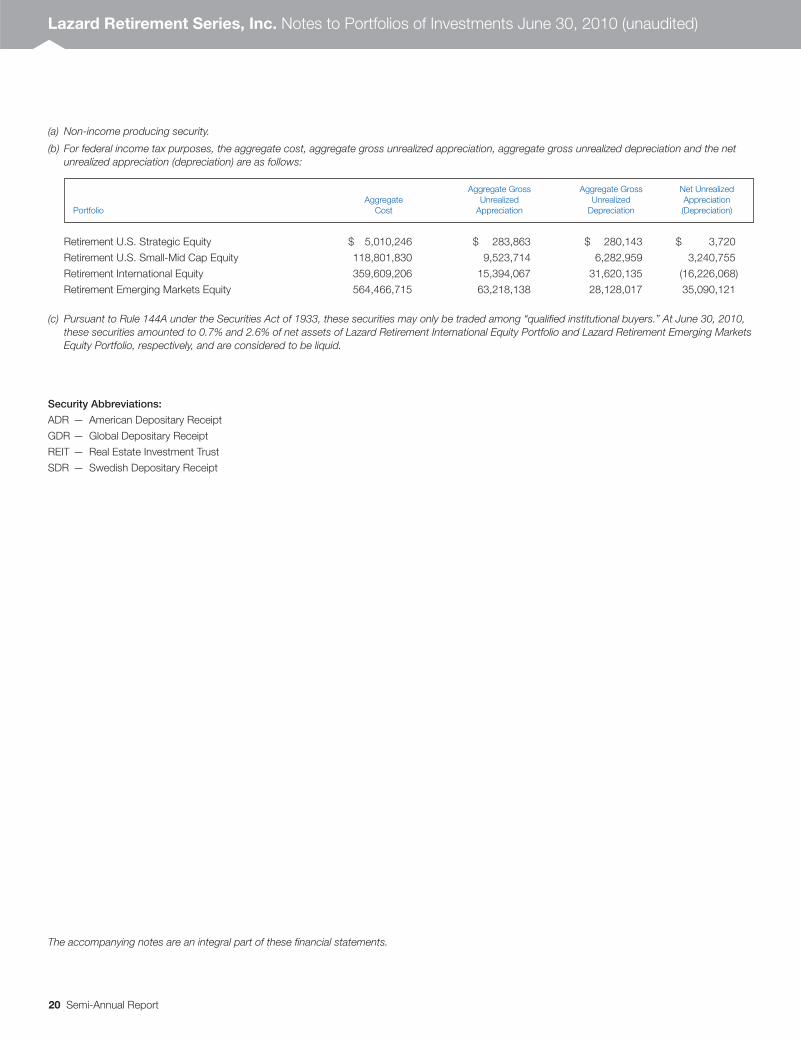
(a) Non-income producing security.
(b) For federal income tax purposes, the aggregate cost, aggregate gross unrealized appreciation, aggregate gross unrealized depreciation and the netunrealized appreciation (depreciation) are as follows:
Retirement U.S. Strategic Equity $ 5,010,246 $ 283,863 $ 280,143 $ 3,720
Retirement U.S. Small-Mid Cap Equity 118,801,830 9,523,714 6,282,959 3,240,755
Retirement International Equity 359,609,206 15,394,067 31,620,135 (16,226,068)
Retirement Emerging Markets Equity 564,466,715 63,218,138 28,128,017 35,090,121
(c) Pursuant to Rule 144A under the Securities Act of 1933, these securities may only be traded among “qualified institutional buyers.” At June 30, 2010,these securities amounted to 0.7% and 2.6% of net assets of Lazard Retirement International Equity Portfolio and Lazard Retirement Emerging MarketsEquity Portfolio, respectively, and are considered to be liquid.
Security Abbreviations:
ADR — American Depositary Receipt
GDR — Global Depositary Receipt
REIT — Real Estate Investment Trust
SDR — Swedish Depositary Receipt
20 Semi-Annual Report
The accompanying notes are an integral part of these financial statements.
Lazard Retirement Series, Inc. Notes to Portfolios of Investments June 30, 2010 (unaudited)
Aggregate Gross Aggregate Gross Net UnrealizedAggregate Unrealized Unrealized Appreciation
Portfolio Cost Appreciation Depreciation (Depreciation)

Semi-Annual Report 21
The accompanying notes are an integral part of these financial statements.
Portfolio holdings by industry (as percentage of net assets), for those Portfolios previously presented by country:
Agriculture 0.9% 2.2%Alcohol & Tobacco 3.9 5.3Automotive 3.0 —Banking 13.7 17.2Building Materials — 1.0Commercial Services 4.7 3.5Computer Software 1.0 3.1Construction & Engineering 0.5 2.6Consumer Products 0.7 3.5Diversified — 1.1Electric 0.9 1.6Energy Exploration & Production 0.9 1.0Energy Integrated 4.9 4.7Energy Services 0.7 —Financial Services 2.1 7.3Food & Beverages 3.7 2.2Forest & Paper Products — 0.7Gas Utilities — 0.7Housing 3.3 1.6Insurance 3.4 1.0Leisure & Entertainment 2.7 1.1Manufacturing 6.5 2.2Metals & Mining 3.0 11.0Pharmaceutical & Biotechnology 8.8 —Real Estate 2.0 —Retail 4.2 3.2Semiconductors & Components 3.8 5.9Technology 2.9 0.7Technology Hardware — 2.3Telecommunications 5.1 9.1
Transportation 2.4 0.7Subtotal 89.7 96.5
Short-Term Investments 4.0 2.7
Repurchase Agreement — 0.1
Total Investments 93.7% 99.3%
Lazard LazardRetirement Retirement
International Emerging MarketsIndustry Equity Portfolio Equity Portfolio
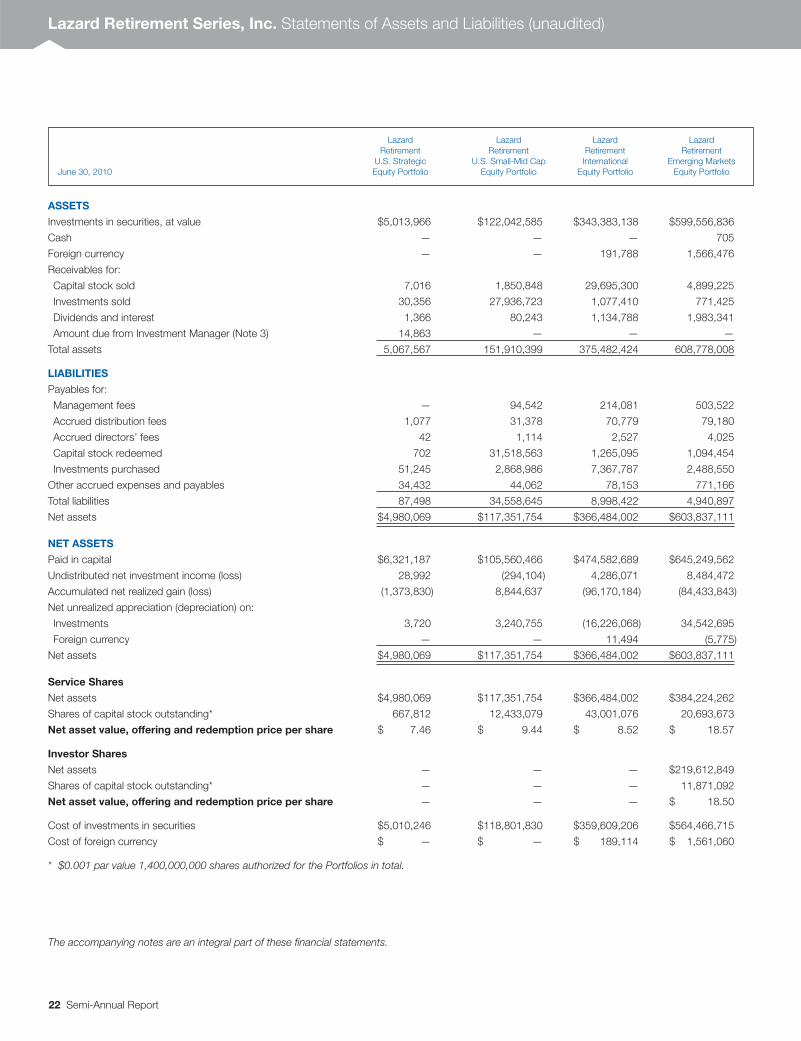
Lazard Retirement Series, Inc. Statements of Assets and Liabilities (unaudited)
22 Semi-Annual Report
Lazard Lazard Lazard LazardRetirement Retirement Retirement Retirement
U.S. Strategic U.S. Small-Mid Cap International Emerging MarketsJune 30, 2010 Equity Portfolio Equity Portfolio Equity Portfolio Equity Portfolio
ASSETS
Investments in securities, at value $5,013,966 $122,042,585 $343,383,138 $599,556,836
Cash — — — 705
Foreign currency — — 191,788 1,566,476
Receivables for:
Capital stock sold 7,016 1,850,848 29,695,300 4,899,225
Investments sold 30,356 27,936,723 1,077,410 771,425
Dividends and interest 1,366 80,243 1,134,788 1,983,341
Amount due from Investment Manager (Note 3) 14,863 — — —
Total assets 5,067,567 151,910,399 375,482,424 608,778,008
LIABILITIES
Payables for:
Management fees — 94,542 214,081 503,522
Accrued distribution fees 1,077 31,378 70,779 79,180
Accrued directors’ fees 42 1,114 2,527 4,025
Capital stock redeemed 702 31,518,563 1,265,095 1,094,454
Investments purchased 51,245 2,868,986 7,367,787 2,488,550
Other accrued expenses and payables 34,432 44,062 78,153 771,166
Total liabilities 87,498 34,558,645 8,998,422 4,940,897
Net assets $4,980,069 $117,351,754 $366,484,002 $603,837,111
NET ASSETS
Paid in capital $6,321,187 $105,560,466 $474,582,689 $645,249,562
Undistributed net investment income (loss) 28,992 (294,104) 4,286,071 8,484,472
Accumulated net realized gain (loss) (1,373,830) 8,844,637 (96,170,184) (84,433,843)
Net unrealized appreciation (depreciation) on:
Investments 3,720 3,240,755 (16,226,068) 34,542,695
Foreign currency — — 11,494 (5,775)
Net assets $4,980,069 $117,351,754 $366,484,002 $603,837,111
Service Shares
Net assets $4,980,069 $117,351,754 $366,484,002 $384,224,262
Shares of capital stock outstanding* 667,812 12,433,079 43,001,076 20,693,673
Net asset value, offering and redemption price per share $ 7.46 $ 9.44 $ 8.52 $ 18.57
Investor Shares
Net assets — — — $219,612,849
Shares of capital stock outstanding* — — — 11,871,092
Net asset value, offering and redemption price per share — — — $ 18.50
Cost of investments in securities $5,010,246 $118,801,830 $359,609,206 $564,466,715
Cost of foreign currency $ — $ — $ 189,114 $ 1,561,060
* $0.001 par value 1,400,000,000 shares authorized for the Portfolios in total.
The accompanying notes are an integral part of these financial statements.
Semi-Annual Report 23
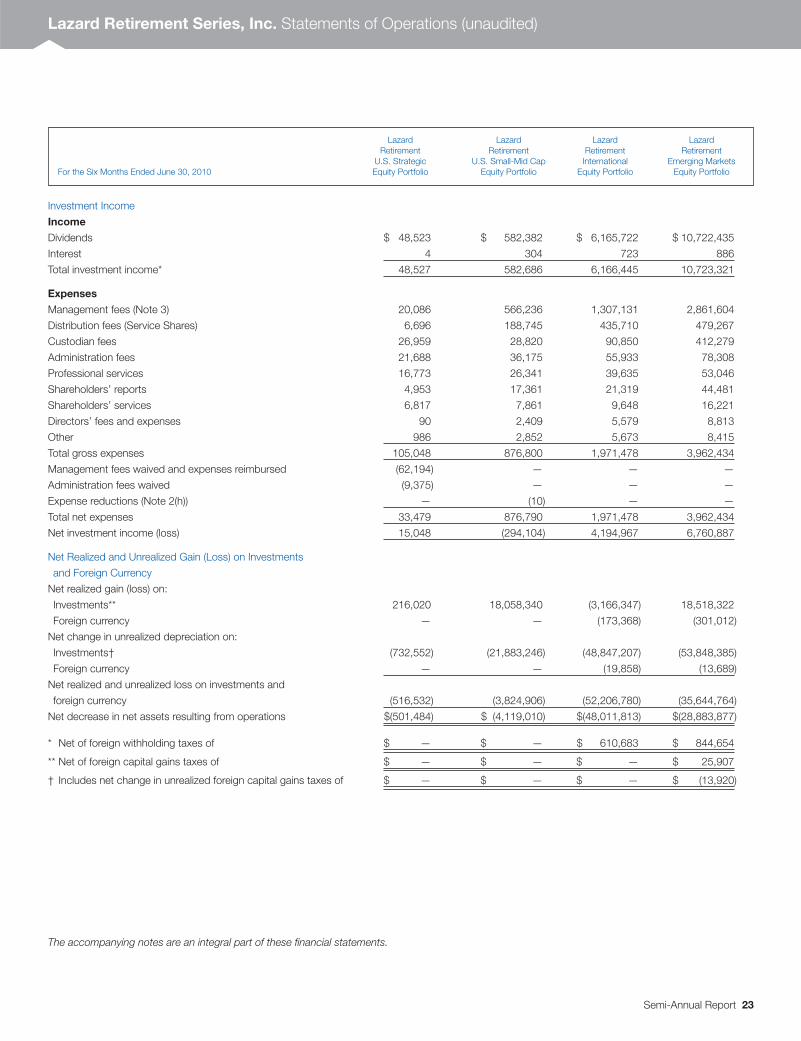
Lazard Retirement Series, Inc. Statements of Operations (unaudited)
The accompanying notes are an integral part of these financial statements.
Lazard Lazard Lazard LazardRetirement Retirement Retirement Retirement
U.S. Strategic U.S. Small-Mid Cap International Emerging MarketsFor the Six Months Ended June 30, 2010 Equity Portfolio Equity Portfolio Equity Portfolio Equity Portfolio
Investment Income
Income
Dividends $ 48,523 $ 582,382 $ 6,165,722 $ 10,722,435
Interest 4 304 723 886
Total investment income* 48,527 582,686 6,166,445 10,723,321
Expenses
Management fees (Note 3) 20,086 566,236 1,307,131 2,861,604
Distribution fees (Service Shares) 6,696 188,745 435,710 479,267
Custodian fees 26,959 28,820 90,850 412,279
Administration fees 21,688 36,175 55,933 78,308
Professional services 16,773 26,341 39,635 53,046
Shareholders’ reports 4,953 17,361 21,319 44,481
Shareholders’ services 6,817 7,861 9,648 16,221
Directors’ fees and expenses 90 2,409 5,579 8,813
Other 986 2,852 5,673 8,415
Total gross expenses 105,048 876,800 1,971,478 3,962,434
Management fees waived and expenses reimbursed (62,194) — — —
Administration fees waived (9,375) — — —
Expense reductions (Note 2(h)) — (10) — —
Total net expenses 33,479 876,790 1,971,478 3,962,434
Net investment income (loss) 15,048 (294,104) 4,194,967 6,760,887
Net Realized and Unrealized Gain (Loss) on Investments
and Foreign Currency
Net realized gain (loss) on:
Investments** 216,020 18,058,340 (3,166,347) 18,518,322
Foreign currency — — (173,368) (301,012)
Net change in unrealized depreciation on:
Investments† (732,552) (21,883,246) (48,847,207) (53,848,385)
Foreign currency — — (19,858) (13,689)
Net realized and unrealized loss on investments and
foreign currency (516,532) (3,824,906) (52,206,780) (35,644,764)
Net decrease in net assets resulting from operations $(501,484) $ (4,119,010) $(48,011,813) $(28,883,877)
* Net of foreign withholding taxes of $ — $ — $ 610,683 $ 844,654
** Net of foreign capital gains taxes of $ — $ — $ — $ 25,907
† Includes net change in unrealized foreign capital gains taxes of $ — $ — $ — $ (13,920)
24 Semi-Annual Report
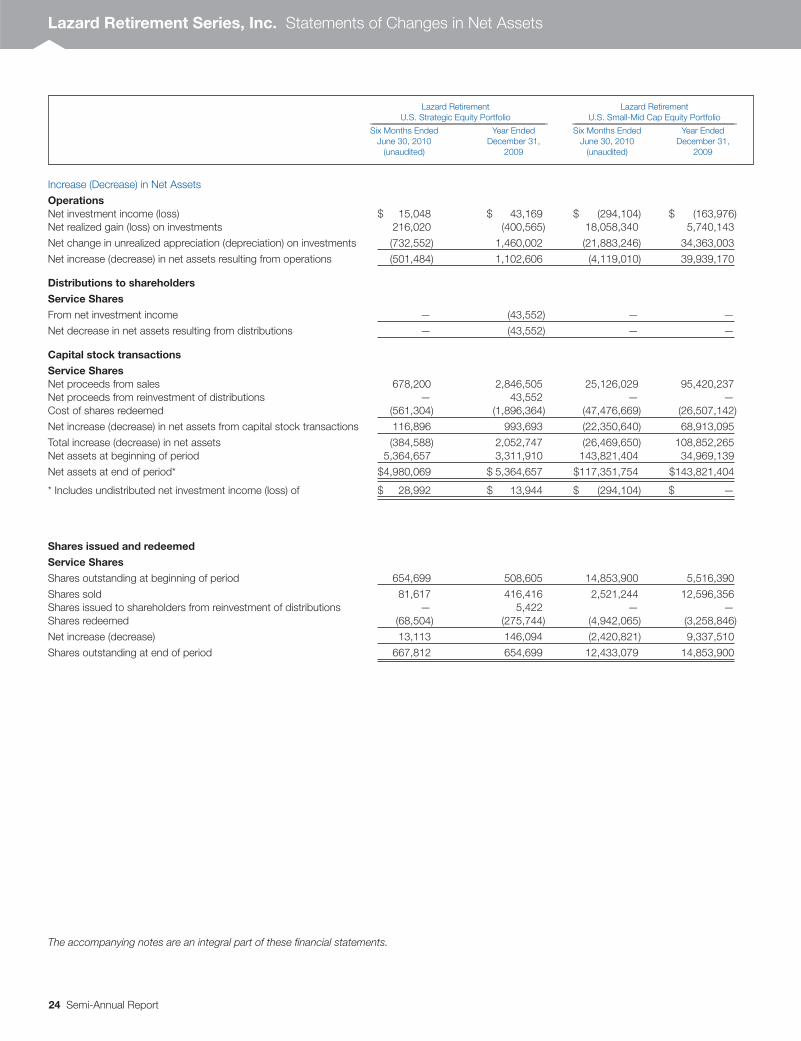
Lazard Retirement Lazard RetirementU.S. Strategic Equity Portfolio U.S. Small-Mid Cap Equity Portfolio__________________________________________________________________ _____________________________________________________________
Six Months Ended Year Ended Six Months Ended Year EndedJune 30, 2010 December 31, June 30, 2010 December 31,
(unaudited) 2009 (unaudited) 2009
Increase (Decrease) in Net Assets
OperationsNet investment income (loss) $ 15,048 $ 43,169 $ (294,104) $ (163,976)Net realized gain (loss) on investments 216,020 (400,565) 18,058,340 5,740,143
Net change in unrealized appreciation (depreciation) on investments (732,552) 1,460,002 (21,883,246) 34,363,003
Net increase (decrease) in net assets resulting from operations (501,484) 1,102,606 (4,119,010) 39,939,170
Distributions to shareholders
Service Shares
From net investment income — (43,552) — —
Net decrease in net assets resulting from distributions — (43,552) — —
Capital stock transactions
Service SharesNet proceeds from sales 678,200 2,846,505 25,126,029 95,420,237Net proceeds from reinvestment of distributions — 43,552 — —Cost of shares redeemed (561,304) (1,896,364) (47,476,669) (26,507,142)
Net increase (decrease) in net assets from capital stock transactions 116,896 993,693 (22,350,640) 68,913,095
Total increase (decrease) in net assets (384,588) 2,052,747 (26,469,650) 108,852,265Net assets at beginning of period 5,364,657 3,311,910 143,821,404 34,969,139
Net assets at end of period* $4,980,069 $ 5,364,657 $117,351,754 $143,821,404
* Includes undistributed net investment income (loss) of $ 28,992 $ 13,944 $ (294,104) $ —
Shares issued and redeemed
Service Shares
Shares outstanding at beginning of period 654,699 508,605 14,853,900 5,516,390
Shares sold 81,617 416,416 2,521,244 12,596,356Shares issued to shareholders from reinvestment of distributions — 5,422 — —Shares redeemed (68,504) (275,744) (4,942,065) (3,258,846)
Net increase (decrease) 13,113 146,094 (2,420,821) 9,337,510
Shares outstanding at end of period 667,812 654,699 12,433,079 14,853,900
The accompanying notes are an integral part of these financial statements.
Lazard Retirement Series, Inc. Statements of Changes in Net Assets
Semi-Annual Report 25
The accompanying notes are an integral part of these financial statements.
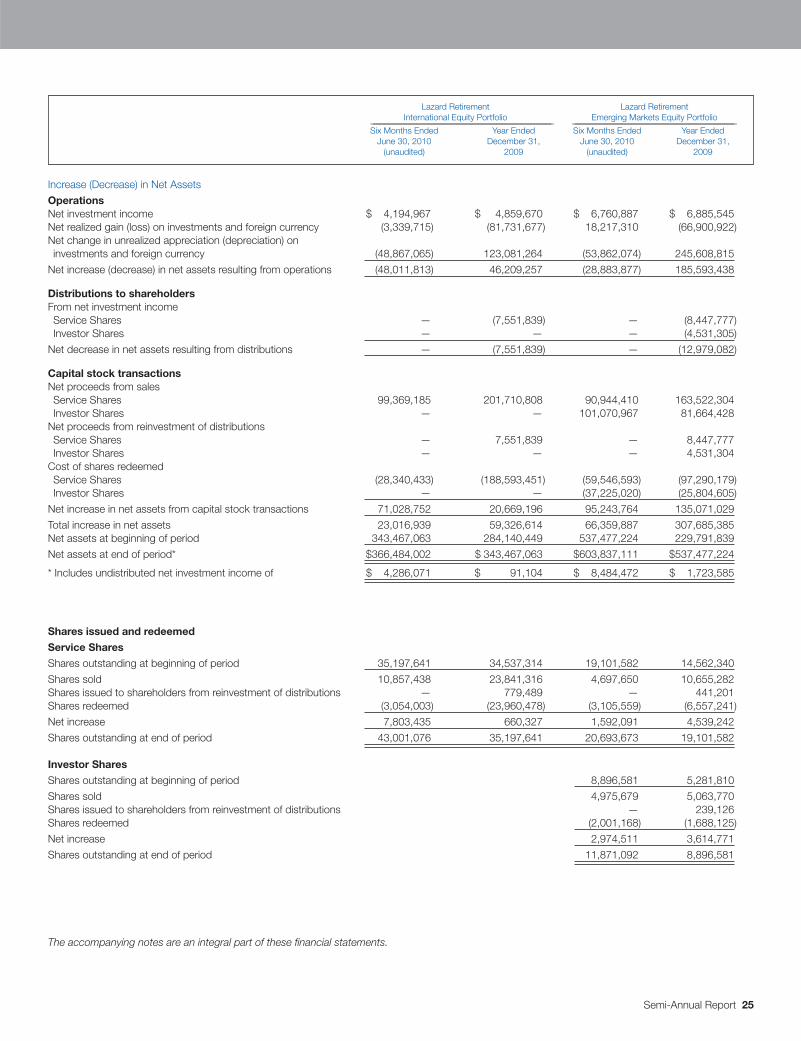
Increase (Decrease) in Net Assets
OperationsNet investment income $ 4,194,967 $ 4,859,670 $ 6,760,887 $ 6,885,545Net realized gain (loss) on investments and foreign currency (3,339,715) (81,731,677) 18,217,310 (66,900,922)Net change in unrealized appreciation (depreciation) on investments and foreign currency (48,867,065) 123,081,264 (53,862,074) 245,608,815
Net increase (decrease) in net assets resulting from operations (48,011,813) 46,209,257 (28,883,877) 185,593,438
Distributions to shareholdersFrom net investment incomeService Shares — (7,551,839) — (8,447,777)Investor Shares — — — (4,531,305)
Net decrease in net assets resulting from distributions — (7,551,839) — (12,979,082)
Capital stock transactionsNet proceeds from salesService Shares 99,369,185 201,710,808 90,944,410 163,522,304Investor Shares — — 101,070,967 81,664,428
Net proceeds from reinvestment of distributionsService Shares — 7,551,839 — 8,447,777Investor Shares — — — 4,531,304
Cost of shares redeemedService Shares (28,340,433) (188,593,451) (59,546,593) (97,290,179)Investor Shares — — (37,225,020) (25,804,605)
Net increase in net assets from capital stock transactions 71,028,752 20,669,196 95,243,764 135,071,029
Total increase in net assets 23,016,939 59,326,614 66,359,887 307,685,385Net assets at beginning of period 343,467,063 284,140,449 537,477,224 229,791,839
Net assets at end of period* $366,484,002 $ 343,467,063 $603,837,111 $537,477,224
* Includes undistributed net investment income of $ 4,286,071 $ 91,104 $ 8,484,472 $ 1,723,585
Shares issued and redeemed
Service Shares
Shares outstanding at beginning of period 35,197,641 34,537,314 19,101,582 14,562,340
Shares sold 10,857,438 23,841,316 4,697,650 10,655,282Shares issued to shareholders from reinvestment of distributions — 779,489 — 441,201Shares redeemed (3,054,003) (23,960,478) (3,105,559) (6,557,241)
Net increase 7,803,435 660,327 1,592,091 4,539,242
Shares outstanding at end of period 43,001,076 35,197,641 20,693,673 19,101,582
Investor Shares
Shares outstanding at beginning of period 8,896,581 5,281,810
Shares sold 4,975,679 5,063,770Shares issued to shareholders from reinvestment of distributions — 239,126Shares redeemed (2,001,168) (1,688,125)
Net increase 2,974,511 3,614,771
Shares outstanding at end of period 11,871,092 8,896,581
Lazard Retirement Lazard RetirementInternational Equity Portfolio Emerging Markets Equity Portfolio____________________________________________________________________ _____________________________________________________________
Six Months Ended Year Ended Six Months Ended Year EndedJune 30, 2010 December 31, June 30, 2010 December 31,
(unaudited) 2009 (unaudited) 2009

26 Semi-Annual Report
Service SharesNet asset value, beginning of period $ 8.19 $ 6.51 $ 10.17 $ 12.86 $ 11.02 $ 10.74Income (loss) from investment operations:Net investment income 0.02 0.06 0.10 0.07 0.09 0.08Net realized and unrealized gain (loss) (0.75) 1.69 (3.69) (0.14) 1.83 0.28
Total from investment operations (0.73) 1.75 (3.59) (0.07) 1.92 0.36Less distributions from:Net investment income — (0.07) (0.07) (0.15) (0.08) (0.08)Net realized gains — — — (2.47) — —
Total distributions — (0.07) (0.07) (2.62) (0.08) (0.08)
Net asset value, end of period $ 7.46 $ 8.19 $ 6.51 $ 10.17 $ 12.86 $ 11.02
Total Return (a) –8.91% 26.84% –35.28% –0.95% 17.48% 3.38%
Ratios and Supplemental Data:Net assets, end of period (in thousands) $ 4,980 $ 5,365 $ 3,312 $ 4,959 $ 5,078 $ 4,311Ratios to average net assets:Net expenses (b) 1.25% 1.25% 1.25% 1.25% 1.25% 1.25%Gross expenses (b) 3.92% 4.67% 4.88% 4.21% 4.45% 3.57%Net investment income (b) 0.56% 1.03% 1.27% 0.62% 0.68% 0.59%
Portfolio turnover rate 33% 79% 86% 101% 102% 75%
Service SharesNet asset value, beginning of period $ 9.68 $ 6.34 $ 9.98 $ 17.31 $ 16.31 $ 16.90Income (loss) from investment operations:Net investment loss (0.02) (0.01) (0.01) (0.02) (0.06) (0.04)Net realized and unrealized gain (loss) (0.22) 3.35 (3.63) (0.87) 2.49 0.69
Total from investment operations (0.24) 3.34 (3.64) (0.89) 2.43 0.65Less distributions from:Net realized gains — — — (6.44) (1.43) (1.24)
Total distributions — — — (6.44) (1.43) (1.24)
Net asset value, end of period $ 9.44 $ 9.68 $ 6.34 $ 9.98 $ 17.31 $ 16.31
Total Return (a) –2.48% 52.68% –36.47% –7.20% 16.07% 3.99%
Ratios and Supplemental Data:Net assets, end of period (in thousands) $117,352 $143,821 $34,969 $62,772 $82,514 $136,970Ratios to average net assets:Net expenses (b) 1.16% 1.25% 1.25% 1.25% 1.18% 1.22%Gross expenses (b) 1.16% 1.31% 1.41% 1.33% 1.18% 1.22%Net investment loss (b) –0.39% –0.21% –0.11% –0.17% –0.22% –0.26%
Portfolio turnover rate 78% 171% 139% 102% 87% 93%
† Unaudited.(a) Total returns reflect reinvestment of all dividends and distributions, if any. Certain expenses of the Portfolio have been waived or reimbursed by the
Portfolio’s Investment Manager or State Street; without such waiver/reimbursement of expenses, the Portfolio’s returns would have been lower. Perfor-mance information does not reflect the fees and charges imposed by participating insurance companies at the separate account level, and suchcharges will have the effect of reducing performance. A period of less than one year is not annualized.
(b) Annualized for a period of less than one year.
Six MonthsYear EndedSelected data for a share of capital Ended ______________________________________________________________________________________________________________________________
stock outstanding throughout each period 6/30/10† 12/31/09 12/31/08 12/31/07 12/31/06 12/31/05
LAZARD RETIREMENT U.S. STRATEGIC EQUITY PORTFOLIO
Six MonthsYear EndedSelected data for a share of capital Ended ______________________________________________________________________________________________________________________________
stock outstanding throughout each period 6/30/10† 12/31/09 12/31/08 12/31/07 12/31/06 12/31/05
LAZARD RETIREMENT U.S. SMALL-MID CAP EQUITY PORTFOLIO
Lazard Retirement Series, Inc. Financial Highlights
The accompanying notes are an integral part of these financial statements.

The accompanying notes are an integral part of these financial statements.
Service SharesNet asset value, beginning of period $ 9.76 $ 8.23 $ 13.35 $ 14.89 $ 12.83 $ 11.88Income (loss) from investment operations:Net investment income 0.10 0.16 0.21 0.19 0.21 0.15Net realized and unrealized gain (loss) (1.34) 1.60 (5.15) 1.24 2.61 1.08
Total from investment operations (1.24) 1.76 (4.94) 1.43 2.82 1.23Less distributions from:Net investment income — (0.23) (0.14) (0.37) (0.15) (0.11)Net realized gains — — (0.04) (2.60) (0.61) (0.17)
Total distributions — (0.23) (0.18) (2.97) (0.76) (0.28)
Net asset value, end of period $ 8.52 $ 9.76 $ 8.23 $ 13.35 $ 14.89 $ 12.83
Total Return (a) –12.70% 21.46% –37.02% 10.78% 22.53% 10.65%
Ratios and Supplemental Data:Net assets, end of period (in thousands) $366,484 $343,467 $284,140 $391,465 $308,693 $266,437Ratios to average net assets:Net expenses (b) 1.13% 1.17% 1.17% 1.18% 1.19% 1.21%Gross expenses (b) 1.13% 1.17% 1.17% 1.18% 1.19% 1.21%Net investment income (b) 2.41% 1.89% 2.15% 1.60% 1.51% 1.45%
Portfolio turnover rate 23% 104% 43% 48% 75% 54%
† Unaudited.(a) Total returns reflect reinvestment of all dividends and distributions, if any. Performance information does not reflect the fees and charges imposed by
participating insurance companies at the separate account level, and such charges will have the effect of reducing performance. A period of less thanone year is not annualized.
(b) Annualized for a period of less than one year.
Six MonthsYear EndedSelected data for a share of capital Ended ______________________________________________________________________________________________________________________________
stock outstanding throughout each period 6/30/10† 12/31/09 12/31/08 12/31/07 12/31/06 12/31/05
LAZARD RETIREMENT INTERNATIONAL EQUITY PORTFOLIO
Semi-Annual Report 27
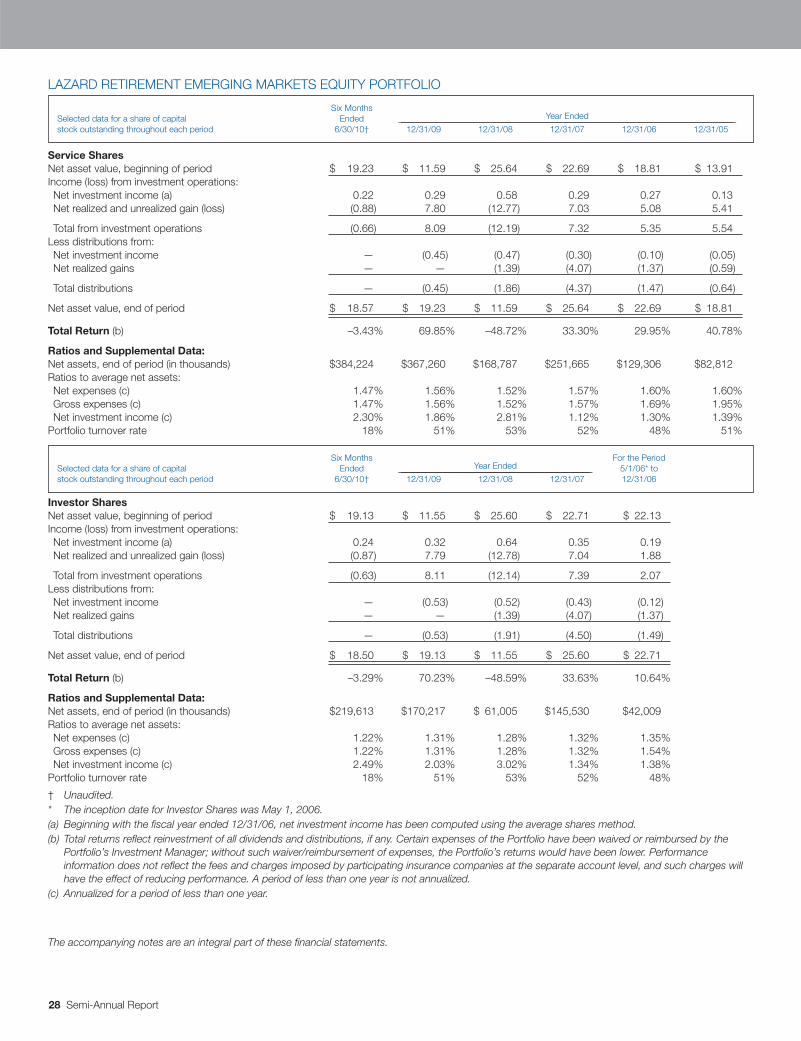
28 Semi-Annual Report
Service SharesNet asset value, beginning of period $ 19.23 $ 11.59 $ 25.64 $ 22.69 $ 18.81 $ 13.91Income (loss) from investment operations:Net investment income (a) 0.22 0.29 0.58 0.29 0.27 0.13Net realized and unrealized gain (loss) (0.88) 7.80 (12.77) 7.03 5.08 5.41
Total from investment operations (0.66) 8.09 (12.19) 7.32 5.35 5.54Less distributions from:Net investment income — (0.45) (0.47) (0.30) (0.10) (0.05)Net realized gains — — (1.39) (4.07) (1.37) (0.59)
Total distributions — (0.45) (1.86) (4.37) (1.47) (0.64)
Net asset value, end of period $ 18.57 $ 19.23 $ 11.59 $ 25.64 $ 22.69 $ 18.81
Total Return (b) –3.43% 69.85% –48.72% 33.30% 29.95% 40.78%
Ratios and Supplemental Data:Net assets, end of period (in thousands) $384,224 $367,260 $168,787 $251,665 $129,306 $82,812Ratios to average net assets:Net expenses (c) 1.47% 1.56% 1.52% 1.57% 1.60% 1.60%Gross expenses (c) 1.47% 1.56% 1.52% 1.57% 1.69% 1.95%Net investment income (c) 2.30% 1.86% 2.81% 1.12% 1.30% 1.39%
Portfolio turnover rate 18% 51% 53% 52% 48% 51%
Investor SharesNet asset value, beginning of period $ 19.13 $ 11.55 $ 25.60 $ 22.71 $ 22.13Income (loss) from investment operations:Net investment income (a) 0.24 0.32 0.64 0.35 0.19Net realized and unrealized gain (loss) (0.87) 7.79 (12.78) 7.04 1.88
Total from investment operations (0.63) 8.11 (12.14) 7.39 2.07Less distributions from:Net investment income — (0.53) (0.52) (0.43) (0.12)Net realized gains — — (1.39) (4.07) (1.37)
Total distributions — (0.53) (1.91) (4.50) (1.49)
Net asset value, end of period $ 18.50 $ 19.13 $ 11.55 $ 25.60 $ 22.71
Total Return (b) –3.29% 70.23% –48.59% 33.63% 10.64%
Ratios and Supplemental Data:Net assets, end of period (in thousands) $219,613 $170,217 $ 61,005 $145,530 $42,009Ratios to average net assets:Net expenses (c) 1.22% 1.31% 1.28% 1.32% 1.35%Gross expenses (c) 1.22% 1.31% 1.28% 1.32% 1.54%Net investment income (c) 2.49% 2.03% 3.02% 1.34% 1.38%
Portfolio turnover rate 18% 51% 53% 52% 48%
† Unaudited.* The inception date for Investor Shares was May 1, 2006.(a) Beginning with the fiscal year ended 12/31/06, net investment income has been computed using the average shares method.(b) Total returns reflect reinvestment of all dividends and distributions, if any. Certain expenses of the Portfolio have been waived or reimbursed by the
Portfolio’s Investment Manager; without such waiver/reimbursement of expenses, the Portfolio’s returns would have been lower. Performanceinformation does not reflect the fees and charges imposed by participating insurance companies at the separate account level, and such charges willhave the effect of reducing performance. A period of less than one year is not annualized.
(c) Annualized for a period of less than one year.
Six MonthsYear EndedSelected data for a share of capital Ended ______________________________________________________________________________________________________________________________
stock outstanding throughout each period 6/30/10† 12/31/09 12/31/08 12/31/07 12/31/06 12/31/05
LAZARD RETIREMENT EMERGING MARKETS EQUITY PORTFOLIO
Six MonthsYear Ended
For the PeriodSelected data for a share of capital Ended ________________________________________________________________________ 5/1/06* tostock outstanding throughout each period 6/30/10† 12/31/09 12/31/08 12/31/07 12/31/06
The accompanying notes are an integral part of these financial statements.

Semi-Annual Report 29
Lazard Retirement Series, Inc. Notes to Financial Statements June 30, 2010 (unaudited)
1. OrganizationLazard Retirement Series, Inc. (the “Fund”) was incorpo-rated in Maryland on February 13, 1997 and is registeredunder the Investment Company Act of 1940, as amended(the “Act”), as an open-end management investment com-pany. The Fund is comprised of eleven no-load portfolios(each referred to as a “Portfolio”), which are currentlyoffered only to separate accounts established by insurancecompanies to fund variable annuity contracts and variablelife insurance policies. Portfolio shares may also be offeredto certain qualified pension and retirement plans andaccounts permitting accumulation of assets on a tax-deferredbasis. Effective January 31, 2006, the Fund designated itsexisting class of shares as Service Shares and commencedoffering Investor Shares. Investor Shares and Service Sharesare identical, except as to the services offered to andexpenses borne by each class of shares. Currently, only thefollowing four Portfolios, each of which is “diversified”, asdefined in the Act, are offered: Lazard Retirement U.S.Strategic Equity Portfolio (“U.S. Strategic Equity Portfo-lio”), Lazard Retirement U.S. Small-Mid Cap EquityPortfolio (“U.S. Small-Mid Cap Equity Portfolio”), LazardRetirement International Equity Portfolio (“InternationalEquity Portfolio”) and Lazard Retirement Emerging Mar-kets Equity Portfolio (“Emerging Markets EquityPortfolio”). Each of the other seven Portfolios had not com-menced operations as of June 30, 2010.
2. Significant Accounting PoliciesThe accompanying financial statements are presented inconformity with accounting principles generally accepted inthe United States of America (“GAAP”). The following is asummary of significant accounting policies:
(a) Valuation of Investments—Market values for securitieslisted on the New York Stock Exchange (“NYSE”),NASDAQ national market or other U.S. exchanges or mar-kets are generally based on the last reported sales price onthe principal exchange or market on which the security istraded, generally as of the close of regular trading on theNYSE (normally 4:00 p.m. Eastern time) on each valuationdate; securities not traded on the valuation date are valuedat the closing bid price. The Fund values NASDAQ-tradedsecurities at the NASDAQ Official Closing Price, which maynot be the last reported sales price in certain instances. Anysecurities not listed, for which current over-the-counter mar-ket quotations or bids are readily available, are valued at the
last quoted bid price or, if available, the mean of two suchprices. Except as described below, securities listed on for-eign exchanges are valued at the last reported sales price;securities listed on foreign exchanges that are not traded onthe valuation date are valued at the last quoted bid price.
If a significant event materially affecting the value of securi-ties occurs between the close of the exchange or market onwhich the security is principally traded and the time when aPortfolio’s net asset value is calculated, or when current mar-ket quotations otherwise are determined not to be readilyavailable or reliable, such securities will be valued at theirfair values as determined by, or in accordance with proce-dures approved by, the Board of Directors (the “Board”).The Valuation Committee of the Investment Manager mayevaluate a variety of factors to determine the fair value ofsecurities for which current market quotations are deter-mined not to be readily available or reliable. These factorsinclude, but are not limited to, the type of security, the valueof comparable securities, observations from financial institu-tions and relevant news events. Input from the InvestmentManager’s analysts will also be considered. The fair value offoreign securities may be determined with the assistance of apricing service, using correlations between the movement ofprices of such securities and indices of domestic securitiesand other appropriate indicators, such as closing marketprices of relevant ADRs or futures contracts. The effect ofusing fair value pricing is that the net asset value of a Portfo-lio will reflect the affected securities’ values as determinedin the judgment of the Board, or its designee, instead ofbeing determined by the market. Using a fair value pricingmethodology to price securities may result in a value that isdifferent than the most recent closing price of a security andfrom the prices used by other investment companies to cal-culate their portfolios’ net asset values.
(b) Portfolio Securities Transactions and Investment Income—Portfolio securities transactions are accounted for on tradedate. Realized gain (loss) on sales of investments arerecorded on a specific identification basis. Dividend incomeis recorded on the ex-dividend date and interest income isaccrued daily.
The Portfolios may be subject to taxes imposed by foreigncountries in which they invest. Such taxes are generallybased upon income earned or capital gains, realized or unre-alized. The Portfolios accrue and apply such taxes to net
30 Semi-Annual Report
investment income, net realized gains and net unrealizedgains concurrent with the recognition of income or capitalgains (realized and unrealized) from the applicable portfoliosecurities.
(c) Repurchase Agreements—In connection with transactions inrepurchase agreements, the Fund’s custodian takes posses-sion of the underlying collateral securities, the fair value ofwhich, at all times, is required to be at least equal to theprincipal amount, plus accrued interest, of the repurchasetransaction. If the seller defaults, and the fair value of thecollateral declines, realization of the collateral by a Portfoliomay be delayed or limited.
(d) Foreign Currency Translation—The accounting records ofthe Portfolios are maintained in U.S. dollars. Portfolio secu-rities and other assets and liabilities denominated in aforeign currency are translated daily into U.S. dollars at theprevailing rates of exchange. Purchases and sales of securi-ties, income receipts and expense payments are translatedinto U.S. dollars at the prevailing exchange rates on therespective transaction dates.
The Portfolios do not isolate the portion of operationsresulting from changes in foreign exchange rates on invest-ments from the fluctuations arising from changes in theirmarket prices. Such fluctuations are included in net realizedand unrealized gain (loss) on investments. Net realized gain(loss) on foreign currency transactions represents net foreigncurrency gain (loss) from disposition of foreign currencies,currency gain (loss) realized between the trade and settle-ment dates on securities transactions, and the differencebetween the amount of dividends, interest and foreign with-holding taxes recorded on a Portfolio’s accounting recordsand the U.S. dollar equivalent amounts actually received orpaid. Net change in unrealized appreciation (depreciation)on foreign currency reflects the impact of changes inexchange rates on the value of assets and liabilities, otherthan investments in securities, during the period.
(e) Federal Income Taxes—The Fund’s policy is to continue tohave each Portfolio qualify as a regulated investment com-pany under Subchapter M of the Internal Revenue Codeand to distribute all of its taxable income, including any netrealized capital gains, to shareholders. Therefore, no federalincome tax provision is required.
At December 31, 2009, the Portfolios had available, for fed-eral income tax purposes, unused realized capital losseswhich can be used to offset future realized capital gains asfollows:
U.S. Strategic Equity $ 772,175 $ 683,170
U.S. Small-Mid Cap Equity 8,812,791 —
International Equity 6,022,728 71,571,550
Emerging Markets Equity — 88,402,544
Under current tax law, certain capital and net foreign cur-rency losses realized after October 31 within the taxableyear may be deferred and treated as occurring on the firstday of the following tax year. For the tax year endedDecember 31, 2009, International Equity Portfolio electedto defer net capital losses of $163,079 arising betweenNovember 1, 2009 and December 31, 2009.
Management has analyzed the Fund’s tax positions, and hasconcluded that no liability for unrecognized tax benefitsshould be recorded related to uncertain tax positions takenon returns filed for open tax years (2006-2008), or expectedto be taken in the Fund’s 2009 or 2010 tax returns.
(f) Dividends and Distributions—Each Portfolio intends todeclare and to pay dividends annually from net investmentincome. During any particular year, net realized gains frominvestment transactions in excess of available capital losscarryforwards would be taxable to the Portfolio, if not dis-tributed. The Portfolios intend to declare and distributethese amounts, at least annually, to shareholders; however,to avoid taxation, a second distribution may be required.
Income dividends and capital gains distributions are deter-mined in accordance with federal income tax regulationswhich may differ from GAAP. These book/tax differences,which may result in distribution reclassifications, are prima-rily due to differing treatments of foreign currencytransactions, wash sales and distributions from real estateinvestment trusts. The book/tax differences relating toshareholder distributions may result in reclassificationsamong certain capital accounts.
(g) Allocation of Expenses—Expenses not directly chargeableto a specific Portfolio are allocated among the Portfolios pri-marily on the basis of relative net assets. A Portfolio accruesdistribution and service (12b-1) fees to its Service Shares.
Portfolio Expiring 2016 Expiring 2017

Semi-Annual Report 31
Each Portfolio’s income, expenses (other than class specificexpenses) and realized and unrealized gains and losses areallocated proportionally each day between the classes basedupon the relative net assets of each class.
(h) Expense Reductions—Portfolios leaving excess cash indemand deposit accounts may receive credits which areavailable to offset custody expenses. The Statements ofOperations report gross custody expenses, and report theamount of such credits separately as an expense reduction.
(i) Estimates—The preparation of financial statements inconformity with GAAP requires the Fund to make estimatesand assumptions that affect the reported amounts of assetsand liabilities and disclosure of contingent assets and liabili-ties at the date of the financial statements and the reportedamounts of increases and decreases in net assets from opera-tions during the reporting period. Actual results could differfrom those estimates.
3. Investment Management, Administration and Distribution AgreementsThe Fund, on behalf of the Portfolios, has entered into aninvestment management agreement (the “ManagementAgreement”) with the Investment Manager. Pursuant to theManagement Agreement, the Investment Manager regularlyprovides each Portfolio with investment research, advice andsupervision and furnishes continuously an investment pro-gram for each Portfolio consistent with its investmentobjective and policies, including the purchase, retention anddisposition of securities. For its services provided to theFund, the Investment Manager earns a management fee,accrued daily and payable by each Portfolio monthly, at theannual rate set forth below as a percentage of its averagedaily net assets:
U.S. Strategic Equity 0.75%
U.S. Small-Mid Cap Equity 0.75
International Equity 0.75
Emerging Markets Equity 1.00
The Investment Manager has voluntarily agreed to reduceits fees and, if necessary, reimburse the Portfolios if annual-ized operating expenses exceed the following percentages ofaverage daily net assets for the respective Shares:
U.S. Strategic Equity 1.25% N/A
U.S. Small-Mid Cap Equity 1.25 N/A
International Equity 1.25 N/A
Emerging Markets Equity 1.60 1.35%
During the period ended June 30, 2010, the InvestmentManager waived its management fee and reimbursed theU.S. Strategic Equity Portfolio $62,194 for other expenses.
The Fund has entered into an administration agreementwith State Street to provide certain administrative services.Each Portfolio bears the cost of such services at a fixedannual rate of $42,500, plus 0.02% of average daily net assetsup to $1 billion and 0.01% of average daily net assets over $1billion. State Street has agreed to waive $18,750 of its feeannually for the U.S. Strategic Equity Portfolio until thePortfolio’s net assets reach $25 million.
The Fund has a distribution agreement with Lazard AssetManagement Securities LLC (the “Distributor”), a wholly-owned subsidiary of the Investment Manager, to serve asthe distributor for shares of each Portfolio. The Distributorbears the cost of printing and mailing prospectuses to poten-tial investors and certain expenses in connection with theoffering of Portfolio shares.
Under a Distribution and Servicing Plan, in accordance withRule 12b-1 under the Act, each Portfolio pays a monthly feeto the Distributor, at an annual rate of 0.25% of the averagedaily net assets of its Service Shares, for distribution andservicing of accounts. The Distributor may make paymentsto participating insurance companies, certain financial insti-tutions, securities dealers and other industry professionalsfor providing these services.
4. Directors’ CompensationCertain Directors of the Fund are officers of the InvestmentManager. The Fund pays each Director who is not an affili-ated person of the Investment Manager or any of its affiliatesan annual aggregate fee of $60,000 ($80,000 effective July 1,2010), plus $4,000 ($5,000 effective July 1, 2010) per meet-ing attended in person ($1,500 per meeting, includingspecial Board or committee meetings, attended by telephone)for the Fund, The Lazard Funds, Inc., Lazard Global TotalReturn and Income Fund, Inc. and Lazard World Dividend& Income Fund, Inc. (collectively, with the Fund, the
Portfolio Service Shares Investor Shares
Portfolio Annual Rate
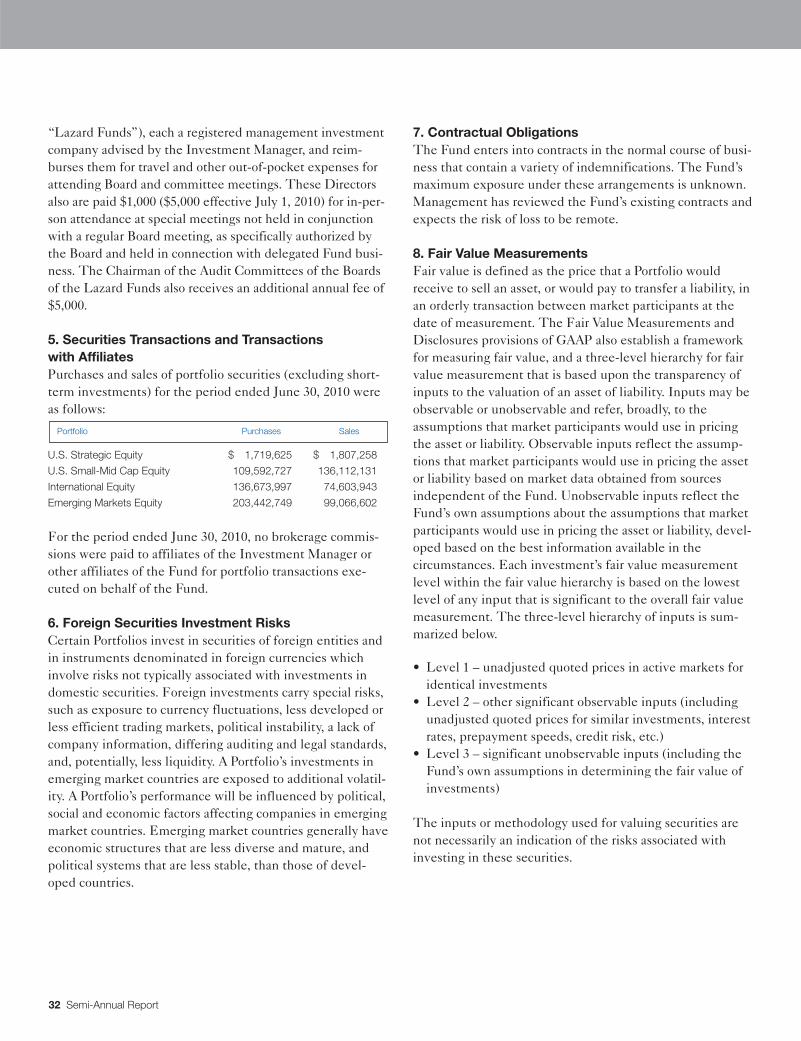
32 Semi-Annual Report
“Lazard Funds”), each a registered management investmentcompany advised by the Investment Manager, and reim-burses them for travel and other out-of-pocket expenses forattending Board and committee meetings. These Directorsalso are paid $1,000 ($5,000 effective July 1, 2010) for in-per-son attendance at special meetings not held in conjunctionwith a regular Board meeting, as specifically authorized bythe Board and held in connection with delegated Fund busi-ness. The Chairman of the Audit Committees of the Boardsof the Lazard Funds also receives an additional annual fee of$5,000.
5. Securities Transactions and Transactions with AffiliatesPurchases and sales of portfolio securities (excluding short-term investments) for the period ended June 30, 2010 wereas follows:
U.S. Strategic Equity $ 1,719,625 $ 1,807,258
U.S. Small-Mid Cap Equity 109,592,727 136,112,131
International Equity 136,673,997 74,603,943
Emerging Markets Equity 203,442,749 99,066,602
For the period ended June 30, 2010, no brokerage commis-sions were paid to affiliates of the Investment Manager orother affiliates of the Fund for portfolio transactions exe-cuted on behalf of the Fund.
6. Foreign Securities Investment RisksCertain Portfolios invest in securities of foreign entities andin instruments denominated in foreign currencies whichinvolve risks not typically associated with investments indomestic securities. Foreign investments carry special risks,such as exposure to currency fluctuations, less developed orless efficient trading markets, political instability, a lack ofcompany information, differing auditing and legal standards,and, potentially, less liquidity. A Portfolio’s investments inemerging market countries are exposed to additional volatil-ity. A Portfolio’s performance will be influenced by political,social and economic factors affecting companies in emergingmarket countries. Emerging market countries generally haveeconomic structures that are less diverse and mature, andpolitical systems that are less stable, than those of devel-oped countries.
7. Contractual ObligationsThe Fund enters into contracts in the normal course of busi-ness that contain a variety of indemnifications. The Fund’smaximum exposure under these arrangements is unknown.Management has reviewed the Fund’s existing contracts andexpects the risk of loss to be remote.
8. Fair Value MeasurementsFair value is defined as the price that a Portfolio wouldreceive to sell an asset, or would pay to transfer a liability, inan orderly transaction between market participants at thedate of measurement. The Fair Value Measurements andDisclosures provisions of GAAP also establish a frameworkfor measuring fair value, and a three-level hierarchy for fairvalue measurement that is based upon the transparency ofinputs to the valuation of an asset of liability. Inputs may beobservable or unobservable and refer, broadly, to theassumptions that market participants would use in pricingthe asset or liability. Observable inputs reflect the assump-tions that market participants would use in pricing the assetor liability based on market data obtained from sourcesindependent of the Fund. Unobservable inputs reflect theFund’s own assumptions about the assumptions that marketparticipants would use in pricing the asset or liability, devel-oped based on the best information available in thecircumstances. Each investment’s fair value measurementlevel within the fair value hierarchy is based on the lowestlevel of any input that is significant to the overall fair valuemeasurement. The three-level hierarchy of inputs is sum-marized below.
• Level 1 – unadjusted quoted prices in active markets foridentical investments
• Level 2 – other significant observable inputs (includingunadjusted quoted prices for similar investments, interestrates, prepayment speeds, credit risk, etc.)
• Level 3 – significant unobservable inputs (including theFund’s own assumptions in determining the fair value ofinvestments)
The inputs or methodology used for valuing securities arenot necessarily an indication of the risks associated withinvesting in these securities.
Portfolio Purchases Sales
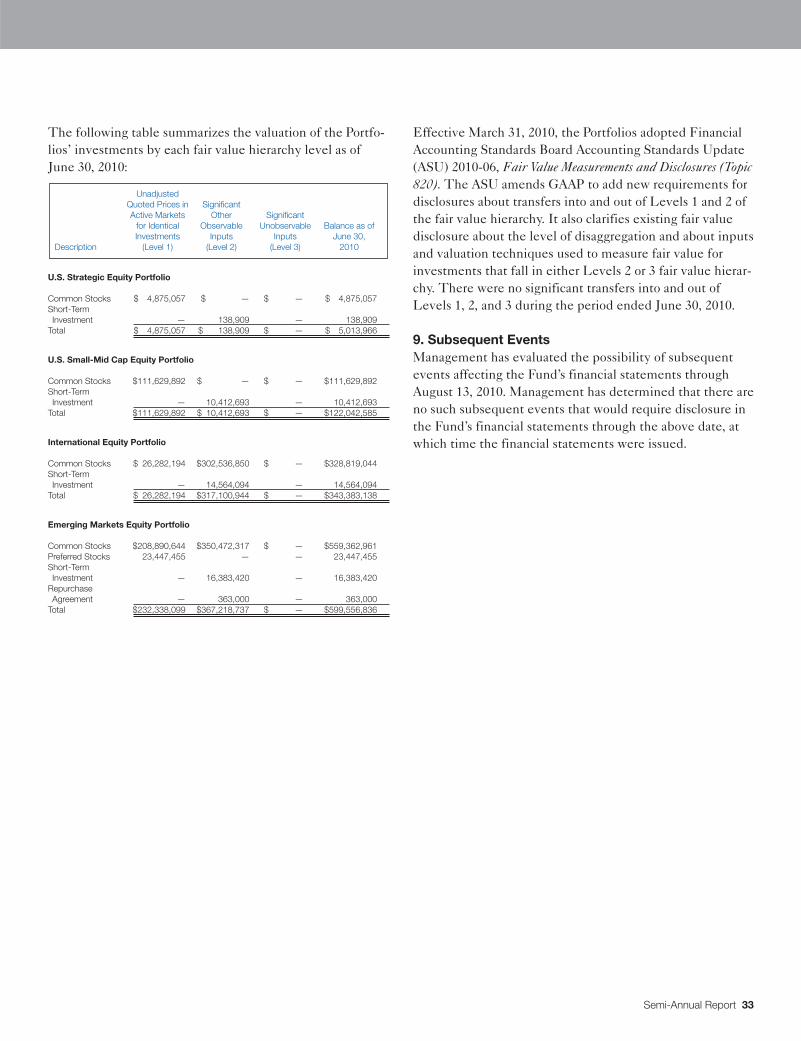
Semi-Annual Report 33
The following table summarizes the valuation of the Portfo-lios’ investments by each fair value hierarchy level as ofJune 30, 2010:
U.S. Strategic Equity Portfolio
Common Stocks $ 4,875,057 $ — $ — $ 4,875,057Short-Term Investment — 138,909 — 138,909
Total $ 4,875,057 $ 138,909 $ — $ 5,013,966
U.S. Small-Mid Cap Equity Portfolio
Common Stocks $111,629,892 $ — $ — $111,629,892Short-Term Investment — 10,412,693 — 10,412,693
Total $111,629,892 $ 10,412,693 $ — $122,042,585
International Equity Portfolio
Common Stocks $ 26,282,194 $302,536,850 $ — $328,819,044Short-Term Investment — 14,564,094 — 14,564,094
Total $ 26,282,194 $317,100,944 $ — $343,383,138
Emerging Markets Equity Portfolio
Common Stocks $208,890,644 $350,472,317 $ — $559,362,961Preferred Stocks 23,447,455 — — 23,447,455Short-Term Investment — 16,383,420 — 16,383,420
Repurchase Agreement — 363,000 — 363,000
Total $232,338,099 $367,218,737 $ — $599,556,836
Effective March 31, 2010, the Portfolios adopted FinancialAccounting Standards Board Accounting Standards Update(ASU) 2010-06, Fair Value Measurements and Disclosures (Topic820). The ASU amends GAAP to add new requirements fordisclosures about transfers into and out of Levels 1 and 2 ofthe fair value hierarchy. It also clarifies existing fair valuedisclosure about the level of disaggregation and about inputsand valuation techniques used to measure fair value forinvestments that fall in either Levels 2 or 3 fair value hierar-chy. There were no significant transfers into and out ofLevels 1, 2, and 3 during the period ended June 30, 2010.
9. Subsequent EventsManagement has evaluated the possibility of subsequentevents affecting the Fund’s financial statements throughAugust 13, 2010. Management has determined that there areno such subsequent events that would require disclosure inthe Fund’s financial statements through the above date, atwhich time the financial statements were issued.
UnadjustedQuoted Prices in SignificantActive Markets Other Significant
for Identical Observable Unobservable Balance as ofInvestments Inputs Inputs June 30,
Description (Level 1) (Level 2) (Level 3) 2010

34 Semi-Annual Report
Lazard Retirement Series, Inc. Board of Directors and Officers Information (unaudited)
Non-Interested Directors:Kenneth S. Davidson (65) Director President, Davidson Capital Management Corporation;
(April 1997) Partner, Aquiline Holdings LLC; Trustee, The JuilliardSchool; Chairman of the Board, Bridgehampton ChamberMusic Festival; Trustee, American Friends of the NationalGallery, London
Nancy A. Eckl (47) Director Former Vice President, Trust Investments, American Beacon (May 2007) Advisors, Inc. (“American Beacon”) and Vice President of
certain funds advised by American Beacon; Trustee, CollegeRetirement Equities Fund (eight accounts); Trustee, TIAA-CREF Funds (47 funds) and TIAA-CREF Life Funds (10funds), and Member of the Management Committee of TIAASeparate Account VA-1
Lester Z. Lieberman (80) Director Private Investor; Chairman, Healthcare Foundation of New (April 1997) Jersey; Director, Cives Steel Co.; Director, Northside Power
Transmission Co.; Advisory Trustee, New Jersey MedicalSchool; Director, Public Health Research Institute; TrusteeEmeritus, Clarkson University; Council of Trustees, NewJersey Performing Arts Center
Leon M. Pollack (69) Director Former Managing Director, Donaldson, Lufkin & Jenrette; (August 2006) Trustee, Adelphi University
Richard Reiss, Jr. (66) Director Chairman, Georgica Advisors LLC, an investment manager; (April 1997) Director, O’Charley’s, Inc., a restaurant chain
Robert M. Solmson (62) Director President, Fairwood Capital, LLC, a private investment (September 2004) corporation engaged primarily in real estate and hotel invest-
ments; Director, Colonial Williamsburg Co.; Former ChiefExecutive Officer and Chairman, RFS Hotel Investors, Inc.;Former Director, Morgan Keegan & Co., Inc.; Former Direc-tor, Independent Bank, Memphis
Interested Directors(3):Charles L. Carroll (49) Chief Executive Officer, Deputy Chairman and Head of Global Marketing of the
President and Director Investment Manager(June 2004)
Ashish Bhutani (50) Director Chief Executive Officer of the Investment Manager; Vice (July 2005) Chairman of Lazard Ltd (since January 2010)
(1) The address of each Director is Lazard Asset Management LLC, 30 Rockefeller Plaza, New York, New York 10112-6300.(2) Each Director also serves as a Director for each of the Lazard Funds (comprised of 20 investment portfolios). Each Director serves an indefinite term,
until his or her successor is elected, and each Director serves in the same capacity for the other Lazard Funds. All of the Independent Directors, exceptMr. Lieberman, are also board members of Lazard Alternative Strategies Fund, L.L.C., a privately-offered fund registered under the Act and advised byan affiliate of the Investment Manager.
(3) Messrs. Bhutani and Carroll are “interested persons” (as defined in the Act) of the Fund because of their positions with the Investment Manager.
The Fund’s Statement of Additional Information contains further information about the Directors and is available without charge by calling 800-823-6300.
Name (Age) Position(s) with the Fund Principal Occupation(s) During Past 5 YearsAddress(1) (Since) and Term(2) and Other Directorships Held(2)

Officers(3):Nathan A. Paul (37) Vice President Managing Director and General Counsel of the Investment
and Secretary Manager(April 2002)
Stephen St. Clair (51) Treasurer Vice President of the Investment Manager(May 2003)
Brian D. Simon (48) Chief Compliance Officer Director (since January 2006) and Chief Compliance Officer(January 2009) and (since January 2009); and previously Senior Vice President Assistant Secretary (2002 to 2005) of the Investment Manager(November 2002)
Tamar Goldstein (35) Assistant Secretary Vice President (since March 2009) and previously Counsel (February 2009) (October 2006 to February 2009) of the Investment Manager;
Associate at Schulte Roth & Zabel LLP, a law firm, from May2004 to October 2006
Cesar A. Trelles (35) Assistant Treasurer Fund Administration Manager of the Investment Manager(December 2004)
(1) The address of each officer is Lazard Asset Management LLC, 30 Rockefeller Plaza, New York, New York 10112-6300.(2) Each officer serves for an indefinite term, until his or her successor is elected and qualifies or until his or her earlier resignation or removal. Each officer
serves in the same capacity for the other Lazard Funds.(3) In addition to Charles L. Carroll, President, whose information is included in the Interested Directors section.
Name (Age) Position(s) with the FundAddress(1) (Since) and Term(2) Principal Occupation(s) During Past 5 Years
Semi-Annual Report 35
36 Semi-Annual Report
Lazard Retirement Series, Inc. Other Information (unaudited)
Proxy VotingA description of the policies and procedures used to deter-mine how proxies relating to Fund portfolio securities arevoted is available (1) without charge, upon request, by call-ing (800) 823-6300 or (2) on the Securities and ExchangeCommission (the “SEC”) website at http://www.sec.gov.
The Fund’s proxy voting record for the most recent 12-monthperiod ended June 30 is available (1) without charge, uponrequest, by calling (800) 823-6300 or (2) on the SEC’s websiteat http://www.sec.gov. Information as of June 30 each year willgenerally be available by the following August 31.
Form N-QThe Fund files a complete schedule of each Portfolio’s hold-ings for the first and third quarters of its fiscal year with theSEC on Form N-Q. The Fund’s Forms N-Q are available onthe SEC’s website at http://www.sec.gov and may bereviewed and copied at the SEC’s Public Reference Roomin Washington, D.C. Information on the operation of theSEC’s Public Reference Room may be obtained by calling1-800-SEC-0330.
Lazard Retirement Series, Inc.30 Rockefeller PlazaNew York, New York 10112-6300Telephone: 800-823-6300http://www.LazardNet.com
Investment ManagerLazard Asset Management LLC30 Rockefeller PlazaNew York, New York 10112-6300Telephone: 800-823-6300
DistributorLazard Asset Management Securities LLC30 Rockefeller PlazaNew York, New York 10112-6300
CustodianState Street Bank and Trust CompanyOne Lincoln StreetBoston, Massachusetts 02111
Transfer Agent and Dividend Disbursing AgentBoston Financial Data Services, Inc.P.O. Box 8514Boston, Massachusetts 02266-8514Telephone: 800-986-3455
Independent Registered Public Accounting FirmAnchin, Block & Anchin LLP1375 BroadwayNew York, New York 10018http://www.anchin.com
Legal CounselStroock & Stroock & Lavan LLP180 Maiden LaneNew York, New York 10038-4982http://www.stroock.com

Lazard Retirement Series
Lazard Asset Management LLC30 Rockefeller PlazaNew York, NY 10112-6300800-823-6300
www.LazardNet.com
© 2010 Lazard Asset Management LLC
6/10 LZDPS010
Performance information as of the most recent month end is available online at www.LazardNet.com.