006508 - Guardian Life Insurance Company of America following text is derived from A.M. Best's...
33
006508 - Guardian Life Insurance Company of America Report Revision Date: 06/07/2017 Rating and Commentary 1 Best's Credit Rating: 06/07/2017 Rating Rationale: 06/07/2017 Report Commentary: 07/06/2016 Financial 2 Time Period: 2nd Quarter - 2017 Last Updated: 10/17/2017 Status: Quality Cross Checked General Information 3 Corporate Structure: 04/26/2017 States Licensed: 10/23/2001 Officers and Directors: 06/01/2017 Best's Credit Rating Methodology Disclaimer Best's Rating Guide Additional Online Resources Related News Archived AMB Credit Reports Rating Activity and Announcements Corporate Changes & Retirements Company Overview AMB Country Risk Reports - United States 1 The Rating and Commentary dates outline the most recent updates to the company's Best's Credit Rating, Rating Rationale, and Report Commentary for key rating and business changes. Report Commentary may include significant changes to the Business Profile, Risk Management, Operating Performance, Balance Sheet Strength, or Reinsurance sections of the report. 2 The Financial dates reflect the current status of the financial tables and charts found within the AMB Credit Report, including whether the data was loaded "As Received" or had been run through A.M. Best "Quality Cross Checks". 3 The General Information dates cover key changes made to Corporate Structure, States Licensed, or Officers and Directors. Page 1 of 33 Print Date: October 23, 2017
Transcript of 006508 - Guardian Life Insurance Company of America following text is derived from A.M. Best's...
006508 - Guardian Life Insurance Company ofAmerica
Report Revision Date: 06/07/2017
Rating and Commentary 1
Best's Credit Rating: 06/07/2017
Rating Rationale: 06/07/2017
Report Commentary: 07/06/2016
Financial 2
Time Period: 2nd Quarter - 2017
Last Updated: 10/17/2017
Status:Quality Cross Checked
General Information 3
Corporate Structure: 04/26/2017
States Licensed: 10/23/2001
Officers and Directors: 06/01/2017
Best's Credit Rating Methodology Disclaimer Best's Rating Guide
Additional Online Resources
Related News Archived AMB Credit Reports
Rating Activity and Announcements Corporate Changes & Retirements
Company Overview AMB Country Risk Reports - United States
1 The Rating and Commentary dates outline the most recent updates to the company's Best's Credit Rating, Rating Rationale, and Report Commentary for key rating andbusiness changes. Report Commentary may include significant changes to the Business Profile, Risk Management, Operating Performance, Balance Sheet Strength, or Reinsurancesections of the report.2 The Financial dates reflect the current status of the financial tables and charts found within the AMB Credit Report, including whether the data was loaded "As Received" orhad been run through A.M. Best "Quality Cross Checks".3 The General Information dates cover key changes made to Corporate Structure, States Licensed, or Officers and Directors.
Page 1 of 33 Print Date: October 23, 2017
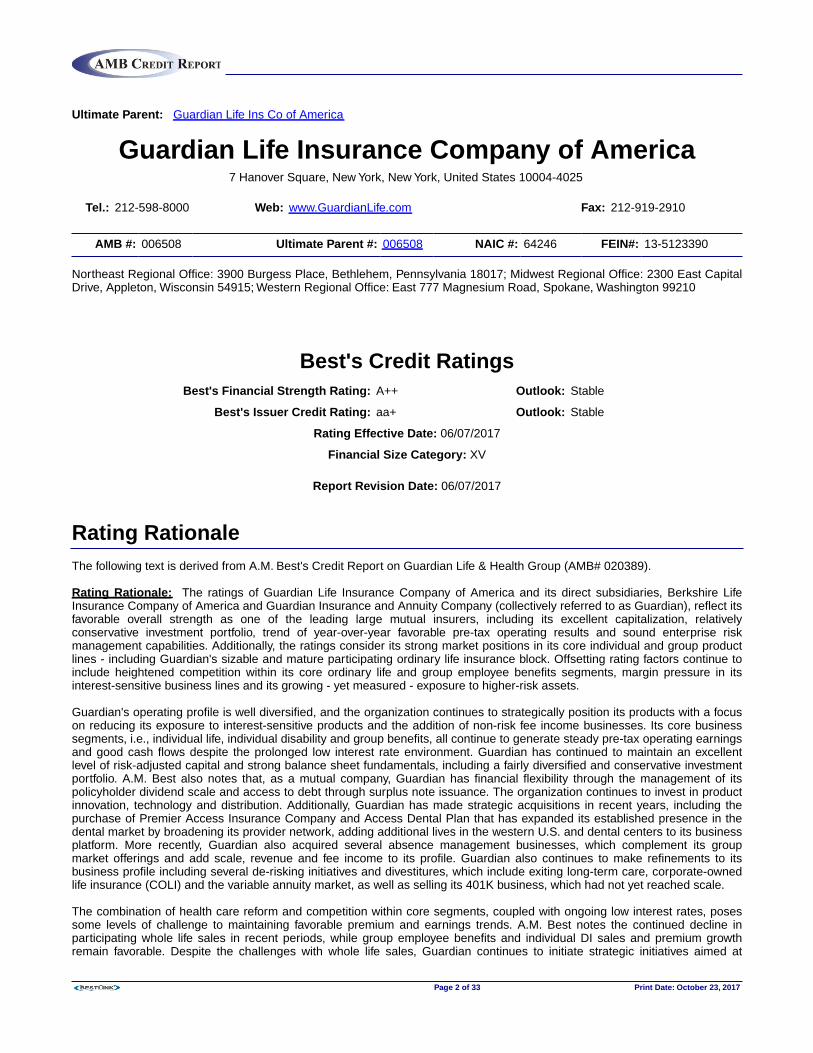
Ultimate Parent: Guardian Life Ins Co of America
Guardian Life Insurance Company of America7 Hanover Square, New York, New York, United States 10004-4025
Tel.: 212-598-8000 Web: www.GuardianLife.com Fax: 212-919-2910
AMB #: 006508 Ultimate Parent #: 006508 NAIC #: 64246 FEIN#: 13-5123390
Northeast Regional Office: 3900 Burgess Place, Bethlehem, Pennsylvania 18017; Midwest Regional Office: 2300 East CapitalDrive, Appleton, Wisconsin 54915; Western Regional Office: East 777 Magnesium Road, Spokane, Washington 99210
Best's Credit RatingsBest's Financial Strength Rating: A++ Outlook: Stable
Best's Issuer Credit Rating: aa+ Outlook: Stable
Rating Effective Date: 06/07/2017
Financial Size Category: XV
Report Revision Date: 06/07/2017
Rating RationaleThe following text is derived from A.M. Best's Credit Report on Guardian Life & Health Group (AMB# 020389).
Rating Rationale: The ratings of Guardian Life Insurance Company of America and its direct subsidiaries, Berkshire LifeInsurance Company of America and Guardian Insurance and Annuity Company (collectively referred to as Guardian), reflect itsfavorable overall strength as one of the leading large mutual insurers, including its excellent capitalization, relativelyconservative investment portfolio, trend of year-over-year favorable pre-tax operating results and sound enterprise riskmanagement capabilities. Additionally, the ratings consider its strong market positions in its core individual and group productlines - including Guardian's sizable and mature participating ordinary life insurance block. Offsetting rating factors continue toinclude heightened competition within its core ordinary life and group employee benefits segments, margin pressure in itsinterest-sensitive business lines and its growing - yet measured - exposure to higher-risk assets.
Guardian's operating profile is well diversified, and the organization continues to strategically position its products with a focuson reducing its exposure to interest-sensitive products and the addition of non-risk fee income businesses. Its core businesssegments, i.e., individual life, individual disability and group benefits, all continue to generate steady pre-tax operating earningsand good cash flows despite the prolonged low interest rate environment. Guardian has continued to maintain an excellentlevel of risk-adjusted capital and strong balance sheet fundamentals, including a fairly diversified and conservative investmentportfolio. A.M. Best also notes that, as a mutual company, Guardian has financial flexibility through the management of itspolicyholder dividend scale and access to debt through surplus note issuance. The organization continues to invest in productinnovation, technology and distribution. Additionally, Guardian has made strategic acquisitions in recent years, including thepurchase of Premier Access Insurance Company and Access Dental Plan that has expanded its established presence in thedental market by broadening its provider network, adding additional lives in the western U.S. and dental centers to its businessplatform. More recently, Guardian also acquired several absence management businesses, which complement its groupmarket offerings and add scale, revenue and fee income to its profile. Guardian also continues to make refinements to itsbusiness profile including several de-risking initiatives and divestitures, which include exiting long-term care, corporate-ownedlife insurance (COLI) and the variable annuity market, as well as selling its 401K business, which had not yet reached scale.
The combination of health care reform and competition within core segments, coupled with ongoing low interest rates, posessome levels of challenge to maintaining favorable premium and earnings trends. A.M. Best notes the continued decline inparticipating whole life sales in recent periods, while group employee benefits and individual DI sales and premium growthremain favorable. Despite the challenges with whole life sales, Guardian continues to initiate strategic initiatives aimed at
Page 2 of 33 Print Date: October 23, 2017
Rating Rationale (Continued...)supporting and growing its group dental, group life and disability business segments. Guardian had previously been impactedby the need to continue to invest in its retirement solutions business to reach critical mass and contribute meaningfully toconsolidated results. However, due to lack of scale the decision was ultimately made to exit this business via divestiture in2016. The company maintains a large block of variable and interest-sensitive life and annuity business, and the continued lowinterest rate environment is impacting these spread-based businesses and continuing to pressure Guardian's margins. Finally,A.M. Best notes that while Guardian's portfolio is mostly conservative and well diversified, the organization maintain a modestexposure to alternative higher-risk assets, including joint venture partnerships, high-yield bonds and real estate-linked assetsrelative to capital and surplus. Overall credit risk within the commercial real estate sector has been reduced and comparesfavorably to mutual peers.
A negative rating action could occur if Guardian were to experience a material decline in risk-adjusted capitalization, asustained decline in new business growth in its core individual and group insurance lines of business, and/or if operatingearnings deteriorate due to increased morbidity or mortality.
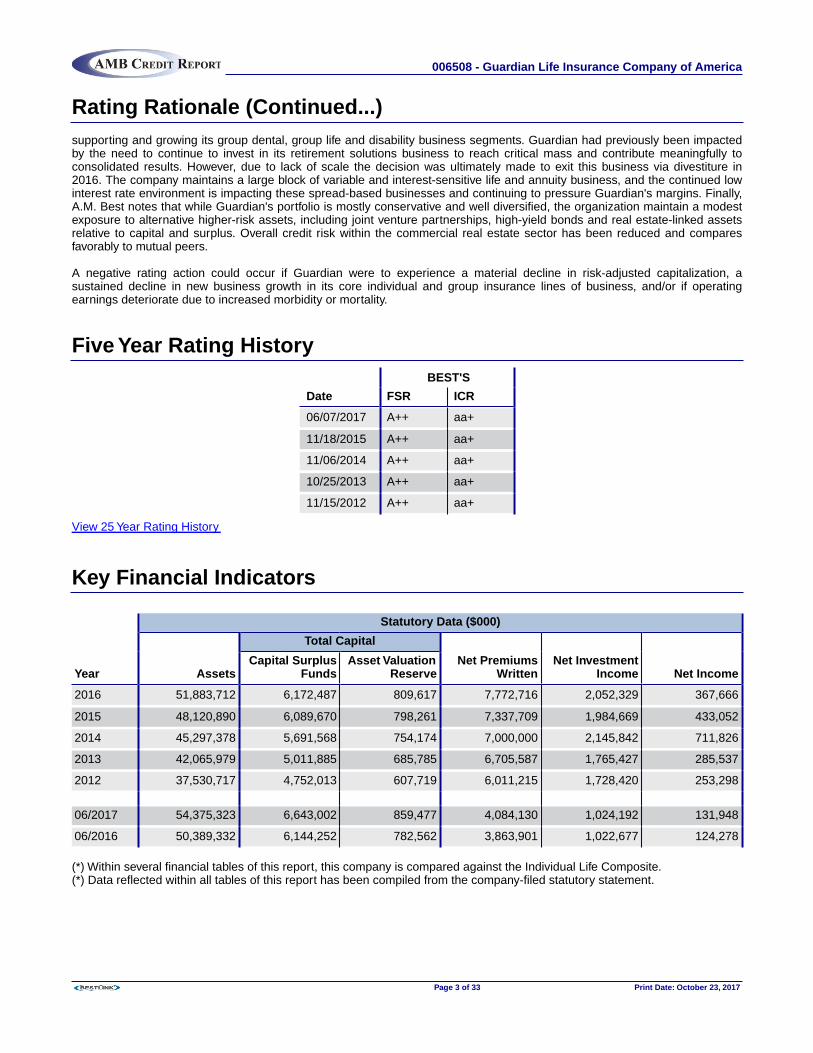
Five Year Rating HistoryBEST'S
Date FSR ICR
06/07/2017 A++ aa+
11/18/2015 A++ aa+
11/06/2014 A++ aa+
10/25/2013 A++ aa+
11/15/2012 A++ aa+
View 25 Year Rating History
Key Financial Indicators
Statutory Data ($000)
Total Capital
Year AssetsCapital Surplus
FundsAsset Valuation
ReserveNet Premiums
WrittenNet Investment
Income Net Income
2016 51,883,712 6,172,487 809,617 7,772,716 2,052,329 367,666
2015 48,120,890 6,089,670 798,261 7,337,709 1,984,669 433,052
2014 45,297,378 5,691,568 754,174 7,000,000 2,145,842 711,826
2013 42,065,979 5,011,885 685,785 6,705,587 1,765,427 285,537
2012 37,530,717 4,752,013 607,719 6,011,215 1,728,420 253,298
06/2017 54,375,323 6,643,002 859,477 4,084,130 1,024,192 131,948
06/2016 50,389,332 6,144,252 782,562 3,863,901 1,022,677 124,278
(*) Within several financial tables of this report, this company is compared against the Individual Life Composite.(*) Data reflected within all tables of this report has been compiled from the company-filed statutory statement.
006508 - Guardian Life Insurance Company of America
Page 3 of 33 Print Date: October 23, 2017
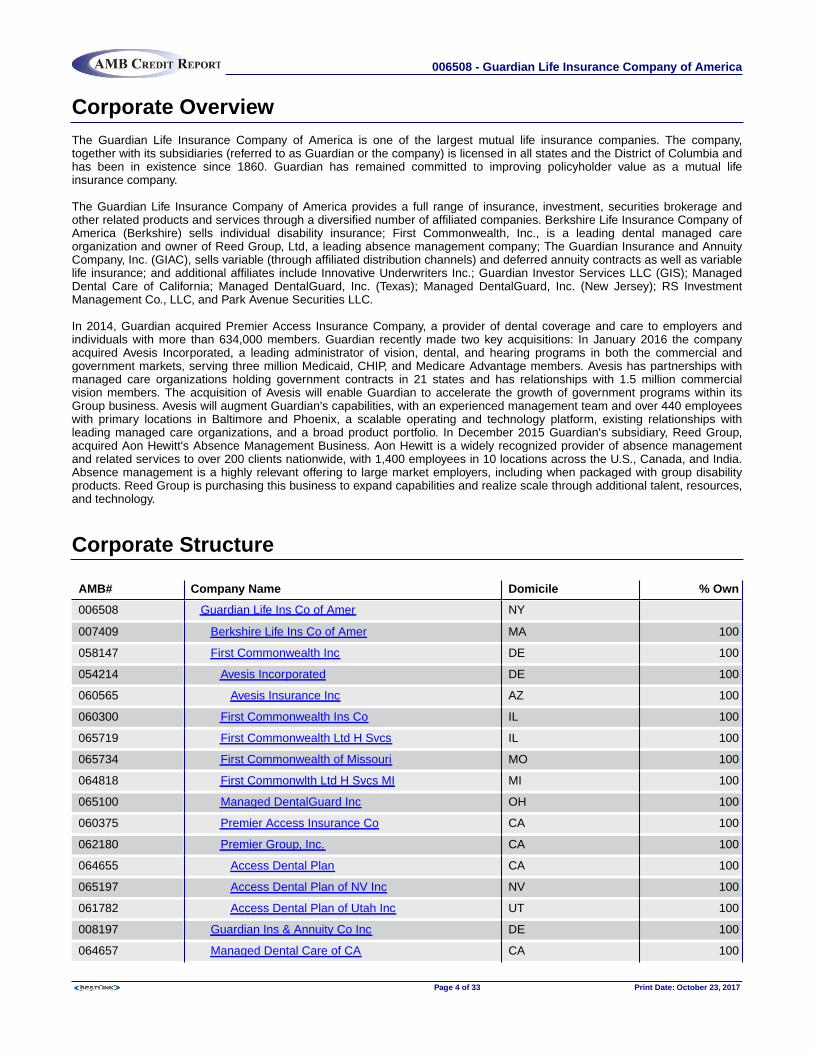
Corporate OverviewThe Guardian Life Insurance Company of America is one of the largest mutual life insurance companies. The company,together with its subsidiaries (referred to as Guardian or the company) is licensed in all states and the District of Columbia andhas been in existence since 1860. Guardian has remained committed to improving policyholder value as a mutual lifeinsurance company.
The Guardian Life Insurance Company of America provides a full range of insurance, investment, securities brokerage andother related products and services through a diversified number of affiliated companies. Berkshire Life Insurance Company ofAmerica (Berkshire) sells individual disability insurance; First Commonwealth, Inc., is a leading dental managed careorganization and owner of Reed Group, Ltd, a leading absence management company; The Guardian Insurance and AnnuityCompany, Inc. (GIAC), sells variable (through affiliated distribution channels) and deferred annuity contracts as well as variablelife insurance; and additional affiliates include Innovative Underwriters Inc.; Guardian Investor Services LLC (GIS); ManagedDental Care of California; Managed DentalGuard, Inc. (Texas); Managed DentalGuard, Inc. (New Jersey); RS InvestmentManagement Co., LLC, and Park Avenue Securities LLC.
In 2014, Guardian acquired Premier Access Insurance Company, a provider of dental coverage and care to employers andindividuals with more than 634,000 members. Guardian recently made two key acquisitions: In January 2016 the companyacquired Avesis Incorporated, a leading administrator of vision, dental, and hearing programs in both the commercial andgovernment markets, serving three million Medicaid, CHIP, and Medicare Advantage members. Avesis has partnerships withmanaged care organizations holding government contracts in 21 states and has relationships with 1.5 million commercialvision members. The acquisition of Avesis will enable Guardian to accelerate the growth of government programs within itsGroup business. Avesis will augment Guardian's capabilities, with an experienced management team and over 440 employeeswith primary locations in Baltimore and Phoenix, a scalable operating and technology platform, existing relationships withleading managed care organizations, and a broad product portfolio. In December 2015 Guardian's subsidiary, Reed Group,acquired Aon Hewitt's Absence Management Business. Aon Hewitt is a widely recognized provider of absence managementand related services to over 200 clients nationwide, with 1,400 employees in 10 locations across the U.S., Canada, and India.Absence management is a highly relevant offering to large market employers, including when packaged with group disabilityproducts. Reed Group is purchasing this business to expand capabilities and realize scale through additional talent, resources,and technology.
Corporate Structure
AMB# Company Name Domicile % Own
006508 Guardian Life Ins Co of Amer NY
007409 Berkshire Life Ins Co of Amer MA 100
058147 First Commonwealth Inc DE 100
054214 Avesis Incorporated DE 100
060565 Avesis Insurance Inc AZ 100
060300 First Commonwealth Ins Co IL 100
065719 First Commonwealth Ltd H Svcs IL 100
065734 First Commonwealth of Missouri MO 100
064818 First Commonwlth Ltd H Svcs MI MI 100
065100 Managed DentalGuard Inc OH 100
060375 Premier Access Insurance Co CA 100
062180 Premier Group, Inc. CA 100
064655 Access Dental Plan CA 100
065197 Access Dental Plan of NV Inc NV 100
061782 Access Dental Plan of Utah Inc UT 100
008197 Guardian Ins & Annuity Co Inc DE 100
064657 Managed Dental Care of CA CA 100
006508 - Guardian Life Insurance Company of America
Page 4 of 33 Print Date: October 23, 2017
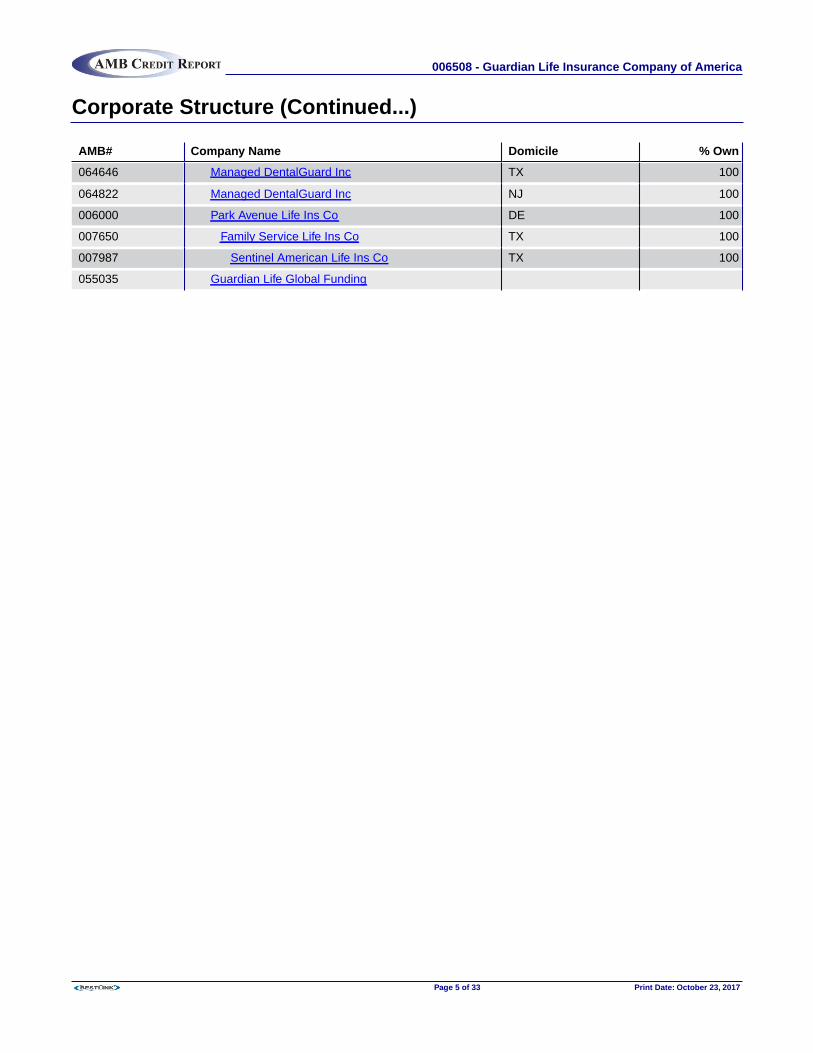
Corporate Structure (Continued...)
AMB# Company Name Domicile % Own
064646 Managed DentalGuard Inc TX 100
064822 Managed DentalGuard Inc NJ 100
006000 Park Avenue Life Ins Co DE 100
007650 Family Service Life Ins Co TX 100
007987 Sentinel American Life Ins Co TX 100
055035 Guardian Life Global Funding
006508 - Guardian Life Insurance Company of America
Page 5 of 33 Print Date: October 23, 2017
Business ProfileThe following text is derived from A.M. Best's Credit Report on Guardian Life & Health Group (AMB# 020389).
Guardian Life Group, (Guardian) through its subsidiaries, provides a full range of products and financial services to customersthroughout the United States. Its wide array of product offerings enables its client base to diversify its portfolio throughinsurance, investment, securities brokerage and other pertinent financial products and services. More specifically, productsand services include individual insurance (individual participating whole life, individual disability, multi-life), group life and healthinsurance, retirement solutions (annuities, 401(k), mutual funds), and other related products and services specifically targetingpension, retirement related investments and administration, asset management and securities brokerage. Guardian targets thesmall business owner, upper-income life insurance and disability income market and the employee benefits market. Thecompany's strategy for growth is focused on distribution, including the ongoing expansion and improvement of its careeragency system supplemented by growth in the independent agent and broker channels, and further development and supportof its worksite channel. Its distribution management team focuses on agent recruitment through turnkey solutions for start-upagencies and sales manager development through a portfolio of training programs and technology driven tools. Guardian'semployee benefits portfolio is distributed by the company's group representatives, who work both directly with clients andthrough brokers. Prior to 2012, its agency distribution was segregated from its core profit centers. In 2012, managementimplemented an organizational alignment and distribution was integrated into its respective profit centers. This alignmentprovides for fluent collaboration between the design and delivery of products and service to support its distribution whiledriving higher productivity, which is evident in the company's sales results.
Guardian recently made two key acquisitions: In January 2016, the company acquired Avesis Incorporated, a leadingadministrator of vision, dental, and hearing programs in both the commercial and government markets, serving three millionMedicaid, CHIP, and Medicare Advantage members. Avesis has partnerships with managed care organizations holdinggovernment contracts in 21 states and has relationships with 1.5 million commercial vision members. The acquisition of Avesiswill enable Guardian to accelerate the growth of government programs within its Group business. Avesis will augmentGuardian's capabilities, with an experienced management team and over 440 employees with primary locations in Baltimoreand Phoenix, a scalable operating and technology platform, existing relationships with leading managed care organizations,and a broad product portfolio. In December 2015, Guardian's subsidiary, Reed Group, acquired Aon Hewitt's AbsenceManagement Business. Aon Hewitt is a widely recognized provider of absence management and related services to over 200clients nationwide, with 1,400 employees in 10 locations across the U.S., Canada, and India. Absence management is a highlyrelevant offering to large market employers, including when packaged with group disability products. Reed Group is purchasingthis business to expand capabilities and realize scale through additional talent, resources, and technology.
Guardian's financial results are reported through its two primary businesses -- Individual Markets, which provides products andservices to individuals primarily through their general agency distribution channel, and Group and Worksite Markets whichprovides products and services through employers and other groups. Individual business includes life and disability (excludingCOLI and BOLI), Retirement Solutions (annuities and 401(k)) and RS Investments (a San Francisco-based investmentmanagement firm). RS is a mutual fund company specializing in growth and value mutual funds and institutional accounts, andoperates as an independent subsidiary of Guardian Investor Services, LLC. Park Avenue Securities (PAS), a broker-dealeraffiliate of Guardian Insurance and Annuity Company (GIAC), offers the RS funds, proprietary and non-proprietary variableannuity and variable life products, equity securities, investment advisory programs, and non-proprietary mutual funds. On7/1/16 Guardian announced its intent to sell the 401(k) business to Ameritas. This is part of Guardian's ongoing plan to focusefforts on businesses where they have core competencies and scale while evolving to a more customer- and market-segment-focused organization. The transaction is pending regulatory approval.
Both the insurance and investment products are marketed through the company's career agency force consisting of over 3,000field representatives. Guardian's career sales force has grown through actively recruiting general agents, regional directorsand sales managers, as well as through excellent agent retention. These efforts have helped contribute to the group's wholelife sales growth. The company continues to revamp its career training program with a focus on recruiting and successionplanning for key agencies to assure continued growth while maintaining talent within its distribution. This stability in the salesforce provides a competitive advantage in the upper-income market. The sales organization's strength and stability, as well asits focus on the upper-income market, are evidenced by the fact that Guardian's average case size, premium persistency,average face amount and average premium per policy are significantly higher than its peer group.
Within the individual risk segment, Guardian focuses its marketing efforts on the upper-income small business owner andprofessional life insurance and disability income market. Its broad product portfolio includes traditional participating whole life,universal life, level premium term, and pension trust products. To counteract the low interest rate environment within itsindividual risk segment, the company has de-risked its interest sensitive business lines (UL and Executive Benefits - BOLI),has exited its Executive Benefits - COLI and long-term care business lines and is limiting sales of variable annuity business tointernal distribution within the Retirement Solutions segment.
006508 - Guardian Life Insurance Company of America
Page 6 of 33 Print Date: October 23, 2017
Business Profile (Continued...)Traditional whole life insurance, Guardian's core product, represents the majority of ordinary life premium production for thegroup with individual term and universal life providing diversification benefits to its Individual Life profit center. Guardian's agentrecruiting and training initiatives, new and enhanced products, improved customer and producer support, and complementarydistribution outlets should also provide opportunities in the group's core market. A key initiative for the agency force is TheLiving Balance Sheet which provides a personal financial web site for each client with daily aggregation of financial informationfrom over 10,000 financial institutions. This real-time system provides a full financial overview for both the agent and the client.While A.M. Best views the success of the company's strategic initiatives positively, it believes the industry is highly competitive,and Guardian may be challenged to continue its growth trends in the individual marketplace. Guardian's response to achallenging environment includes profit center growth initiatives, product innovation, cost reductions, increased governmentrelations initiatives and new initiatives in Group Dental, Life and Disability businesses to mitigate the impact of health carereform. During 2013, Guardian introduced an accelerated death benefit rider for long term care (LTC) to its whole life productwhich allows the policyholder to accelerate a portion of the policy's death benefit if he or she becomes chronically ill and needsLTC services.
Another subsidiary of the group, Berkshire Life Insurance Company of America (Berkshire), offers individual disabilityinsurance (DI). The combined life insurance line is managed by Guardian, and the combined DI business is managed byBerkshire. The combined organization is now a leading writer of non-cancelable individual disability insurance in the country.DI products are sold primarily through the group's core field representative force, independent agents and outside brokers.Recent growth initiatives include expanding distribution capabilities through the use of wholesalers to attract brokers andexecutive benefit plan specialists. With the consolidation of this line through Berkshire, efforts to improve operatingfundamentals such as pricing, underwriting, and claims management have resulted in improved loss ratios, which havebecome more stable, and earnings continue to improve. The disability line strengthens Guardian's product offerings, and thecompany has placed DI specialists in agency offices to enhance sales efforts. Expanding upon its DI expertise and to provideadditional products to its representatives, Berkshire introduced a multi-life DI product for employees of small and medium-sizedbusinesses.
Guardian's group insurance segment focuses on the employee benefits market (generally employers less than 5,000employees). The company's balanced product portfolio includes dental (PPO and DHMO), vision, disability, life, critical illness,cancer, accident and stop loss coverage sold through the broker market, managed by over 250 group sales representatives in52 locations nationwide. In light of health care reform, Guardian has recently announced that it has developed a suite of dentalbenefit products which will be offered on 48 small business health (SHOP) exchanges which are being formed for companieswith 50 or less employees. Guardian participates in state and private exchanges with exchange certified dental programs, butthe longer term impact of health care reform remains uncertain at this time. The company previously marketed group medicalinsurance. The company began its exit from this market in 2000. In 2012, the company completed its exit from group medicalinsurance with a portion going to an unaffiliated insurer. The group medical line represented a declining percentage ofcompany-wide premiums and the company will be focusing primarily on its group non-medical business. Future growthinitiatives for the group segment include targeted customer growth, channel and worksite expansion and improving operationaland technology efficiencies to support its growth strategy.
While the dental line provides product and earnings diversification for Guardian, external factors, broker consolidations andcompetitive pricing and bundling are impacting the industry and resulting in premium declines for First Commonwealth. In late2012, Guardian's First Commonwealth subsidiary acquired 100% interest in Reed Group, Ltd. (Reed). Reed is a leadingprovider of absence management services and software to employers. In April 2014, Guardian acquired Premier AccessInsurance Company and its affiliates (Premier Access). Premier Access, based in Sacramento, California, is a provider ofdental coverage and care to employers and individuals with more than 634,000 members. The acquisition is expected tostrengthen Guardian's existing Dental Health Maintenance Organization (DHMO) network in several states including California,Utah, Nevada and Arizona. It also extends Guardian's reach into the state-run Medicaid and Children's Health InsuranceProgram (CHIP) markets which are expected to grow significantly due to expanded eligibility under the Affordable Care Act(ACA). Guardian also gained a presence on six individual state exchanges, complementing its existing offering on 48 of thesmall business health (SHOP) exchanges.
Guardian's key to transitioning from a medical focus to a multiple non-medical product marketing approach has been trainingand enhanced administrative support provided to the organization's group sales representatives. New product introductions,technological investments, and upgraded training and support of the company's group sales representatives should continue toprovide a platform for growth. The group sales representatives now offer employers complete benefits packages includingdental, vision, life and disability. The company's worksite marketing endeavors to work closely with independent brokers to sellvoluntary group term life, dental, and disability to employees of existing group clients. Worksite marketing now representsapproximately a third of total non-medical product sales. A.M. Best views favorably management's focus on a multi-productstrategy utilizing a combination of managed care arrangements, HSAs, its proprietary PPO and DHMO dental offering, and itsportfolio of non-medical products. In 2013, Guardian introduced a medical stop-loss product for companies who self-fund theiremployee medical coverage.
006508 - Guardian Life Insurance Company of America
Page 7 of 33 Print Date: October 23, 2017
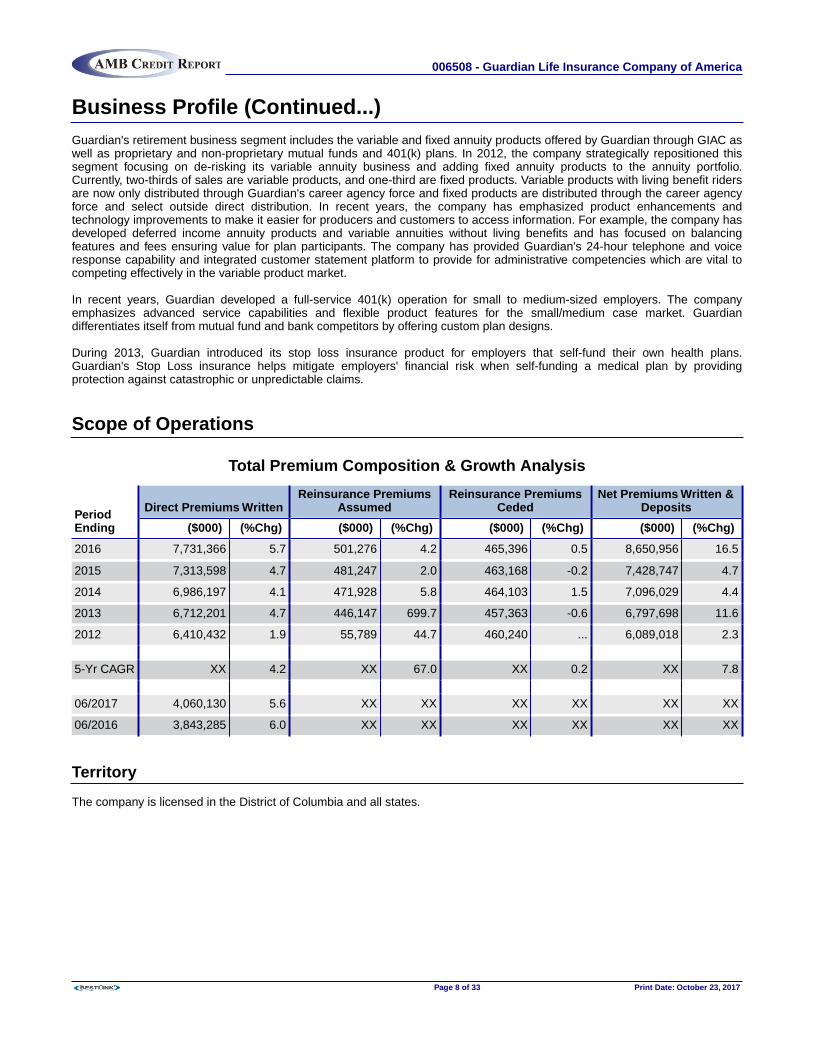
Business Profile (Continued...)Guardian's retirement business segment includes the variable and fixed annuity products offered by Guardian through GIAC aswell as proprietary and non-proprietary mutual funds and 401(k) plans. In 2012, the company strategically repositioned thissegment focusing on de-risking its variable annuity business and adding fixed annuity products to the annuity portfolio.Currently, two-thirds of sales are variable products, and one-third are fixed products. Variable products with living benefit ridersare now only distributed through Guardian's career agency force and fixed products are distributed through the career agencyforce and select outside direct distribution. In recent years, the company has emphasized product enhancements andtechnology improvements to make it easier for producers and customers to access information. For example, the company hasdeveloped deferred income annuity products and variable annuities without living benefits and has focused on balancingfeatures and fees ensuring value for plan participants. The company has provided Guardian's 24-hour telephone and voiceresponse capability and integrated customer statement platform to provide for administrative competencies which are vital tocompeting effectively in the variable product market.
In recent years, Guardian developed a full-service 401(k) operation for small to medium-sized employers. The companyemphasizes advanced service capabilities and flexible product features for the small/medium case market. Guardiandifferentiates itself from mutual fund and bank competitors by offering custom plan designs.
During 2013, Guardian introduced its stop loss insurance product for employers that self-fund their own health plans.Guardian's Stop Loss insurance helps mitigate employers' financial risk when self-funding a medical plan by providingprotection against catastrophic or unpredictable claims.
Scope of Operations
Total Premium Composition & Growth Analysis
PeriodEnding
Direct Premiums WrittenReinsurance Premiums
AssumedReinsurance Premiums
CededNet Premiums Written &
Deposits
($000) (%Chg) ($000) (%Chg) ($000) (%Chg) ($000) (%Chg)
2016 7,731,366 5.7 501,276 4.2 465,396 0.5 8,650,956 16.5
2015 7,313,598 4.7 481,247 2.0 463,168 -0.2 7,428,747 4.7
2014 6,986,197 4.1 471,928 5.8 464,103 1.5 7,096,029 4.4
2013 6,712,201 4.7 446,147 699.7 457,363 -0.6 6,797,698 11.6
2012 6,410,432 1.9 55,789 44.7 460,240 ... 6,089,018 2.3
5-Yr CAGR XX 4.2 XX 67.0 XX 0.2 XX 7.8
06/2017 4,060,130 5.6 XX XX XX XX XX XX
06/2016 3,843,285 6.0 XX XX XX XX XX XX
Territory
The company is licensed in the District of Columbia and all states.
006508 - Guardian Life Insurance Company of America
Page 8 of 33 Print Date: October 23, 2017

Business Trends
2016 By-Line Business ($000)
Product Line
Direct PremiumsWritten
ReinsurancePremiums Assumed
ReinsurancePremiums Ceded Net Premiums Written
($000) (%) ($000) (%) ($000) (%) ($000) (%)
Ordinary life 4,053,621 52.4 35,913 7.2 265,616 57.1 3,829,389 49.3
Group life 542,215 7.0 1,170 0.2 269 0.1 543,116 7.0
Individual annuities 16,396 0.2 ... ... ... ... 16,396 0.2
Individual A&H 196,516 2.5 464,172 92.6 189,305 40.7 471,383 6.1
Group A&H 2,922,619 37.8 21 ... 10,206 2.2 2,912,433 37.5
Total 7,731,366 100.0 501,276 100.0 465,396 100.0 7,772,716 100.0
2016 Top Product Lines of Business (Net Premiums Written)
49.3%
7.0%0.2%
6.1%
37.5%
Ordinary life Individual annuities Group A&H
Group life Individual A&H
5 Years of Net Premiums Written ($000)
0
1,500,000
3,000,000
4,500,000
6,000,000
7,500,000
2012
2013
2014
2015
2016
6,011,215
6,705,5877,000,000
7,337,7097,772,716
By-Line Reserves ($000)
Product Line 2016 2015 2014 2013 2012
Ordinary life 34,874,038 32,718,188 30,799,892 28,860,779 26,948,126
Group life 547,734 568,600 560,277 542,998 531,147
Supplementary contracts 20,417 23,467 26,587 30,307 32,551
Individual annuities 217,691 225,876 222,231 229,236 235,996
Group annuities 19,072 21,060 25,043 26,925 25,251
Deposit type contracts 1,209,718 406,752 401,466 389,554 384,723
Individual A&H 2,543,832 2,419,260 2,248,850 2,113,837 32,960
Group A&H 1,169,402 1,079,568 1,000,514 909,911 850,514
Total 40,601,905 37,462,770 35,284,860 33,103,545 29,041,267
006508 - Guardian Life Insurance Company of America
Page 9 of 33 Print Date: October 23, 2017

Business Trends (Continued...)
Life Policies Statistics
Year
Ordinary Policies Group Policies Group Certificates
Issued In Force Issued In Force Issued In Force
2016 42,438 976,237 7,185 46,916 453,793 2,914,676
2015 43,371 973,086 6,780 45,146 413,814 2,753,294
2014 45,224 1,122,532 6,861 43,648 421,040 2,603,980
2013 48,192 1,136,973 7,742 42,145 464,126 2,450,473
2012 47,268 1,155,954 6,883 39,579 517,247 2,231,056
Life Insurance In Force ($000)
Year
Whole Life &Endowment &
Additions Term Credit Group IndustrialTotal Insurance
In Force
2016 201,764,706 152,874,094 ... 236,177,629 ... 590,816,429
2015 196,006,313 140,090,486 ... 219,374,574 ... 555,471,373
2014 191,175,664 128,259,861 ... 199,623,255 ... 519,058,780
2013 185,345,325 116,927,888 ... 180,787,142 ... 483,060,355
2012 177,486,182 106,042,619 ... 160,460,257 ... 443,989,058
New Life Business Issued
Year
Whole Life &Endowment& Additions Term Credit Group Industrial
TotalInsurance
Issued
Non-Particpt.
(%)Particpt.
(%)
2016 11,881,314 21,719,321 ... 40,005,277 ... 73,605,912 ... 100.0
2015 11,679,401 20,530,270 ... 34,084,595 ... 66,294,266 ... 100.0
2014 12,055,217 20,005,557 ... 34,727,487 ... 66,788,261 ... 100.0
2013 13,744,701 19,753,847 ... 34,909,511 ... 68,408,059 ... 100.0
2012 13,236,192 17,594,553 ... 34,400,221 ... 65,230,967 ... 100.0
006508 - Guardian Life Insurance Company of America
Page 10 of 33 Print Date: October 23, 2017
Business Trends (Continued...)
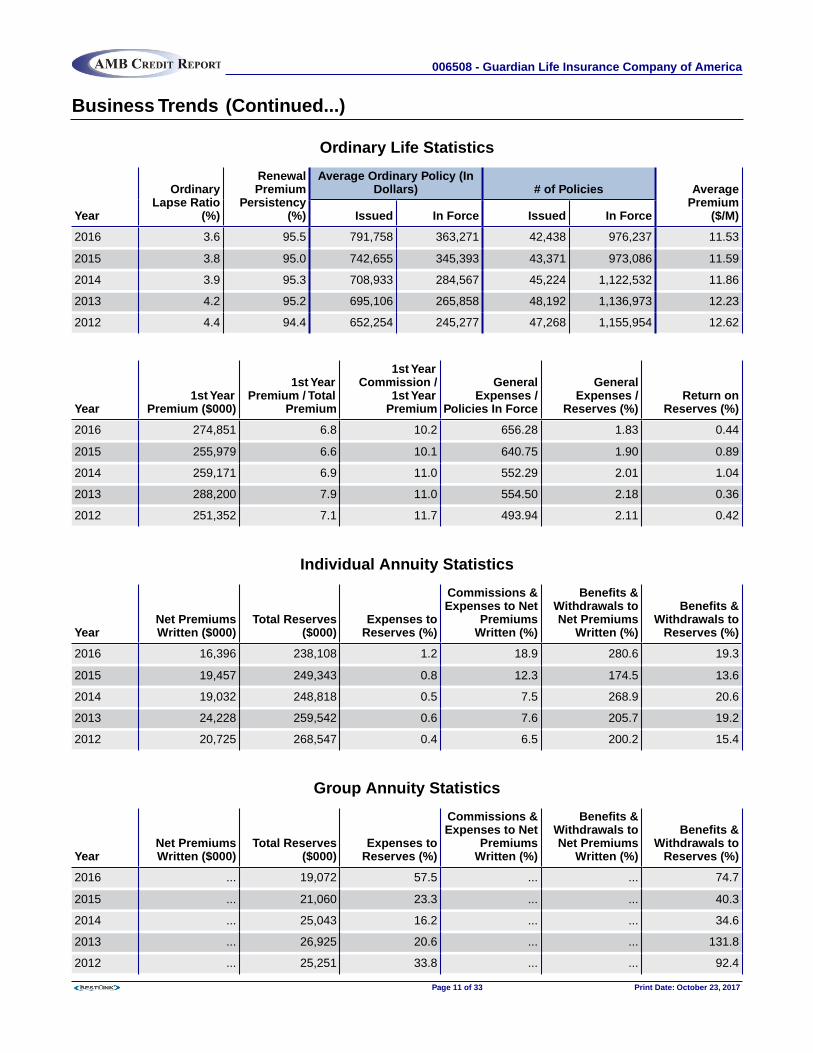
Ordinary Life Statistics
Year
OrdinaryLapse Ratio
(%)
RenewalPremium
Persistency(%)
Average Ordinary Policy (InDollars) # of Policies Average
Premium($/M)Issued In Force Issued In Force
2016 3.6 95.5 791,758 363,271 42,438 976,237 11.53
2015 3.8 95.0 742,655 345,393 43,371 973,086 11.59
2014 3.9 95.3 708,933 284,567 45,224 1,122,532 11.86
2013 4.2 95.2 695,106 265,858 48,192 1,136,973 12.23
2012 4.4 94.4 652,254 245,277 47,268 1,155,954 12.62
Year1st Year
Premium ($000)
1st YearPremium / Total
Premium
1st YearCommission /
1st YearPremium
GeneralExpenses /
Policies In Force
GeneralExpenses /
Reserves (%)Return on
Reserves (%)
2016 274,851 6.8 10.2 656.28 1.83 0.44
2015 255,979 6.6 10.1 640.75 1.90 0.89
2014 259,171 6.9 11.0 552.29 2.01 1.04
2013 288,200 7.9 11.0 554.50 2.18 0.36
2012 251,352 7.1 11.7 493.94 2.11 0.42
Individual Annuity Statistics
YearNet PremiumsWritten ($000)
Total Reserves($000)
Expenses toReserves (%)
Commissions &Expenses to Net
PremiumsWritten (%)
Benefits &Withdrawals toNet Premiums
Written (%)
Benefits &Withdrawals to
Reserves (%)
2016 16,396 238,108 1.2 18.9 280.6 19.3
2015 19,457 249,343 0.8 12.3 174.5 13.6
2014 19,032 248,818 0.5 7.5 268.9 20.6
2013 24,228 259,542 0.6 7.6 205.7 19.2
2012 20,725 268,547 0.4 6.5 200.2 15.4
Group Annuity Statistics
YearNet PremiumsWritten ($000)
Total Reserves($000)
Expenses toReserves (%)
Commissions &Expenses to Net
PremiumsWritten (%)
Benefits &Withdrawals toNet Premiums
Written (%)
Benefits &Withdrawals to
Reserves (%)
2016 ... 19,072 57.5 ... ... 74.7
2015 ... 21,060 23.3 ... ... 40.3
2014 ... 25,043 16.2 ... ... 34.6
2013 ... 26,925 20.6 ... ... 131.8
2012 ... 25,251 33.8 ... ... 92.4
006508 - Guardian Life Insurance Company of America
Page 11 of 33 Print Date: October 23, 2017
Business Trends (Continued...)
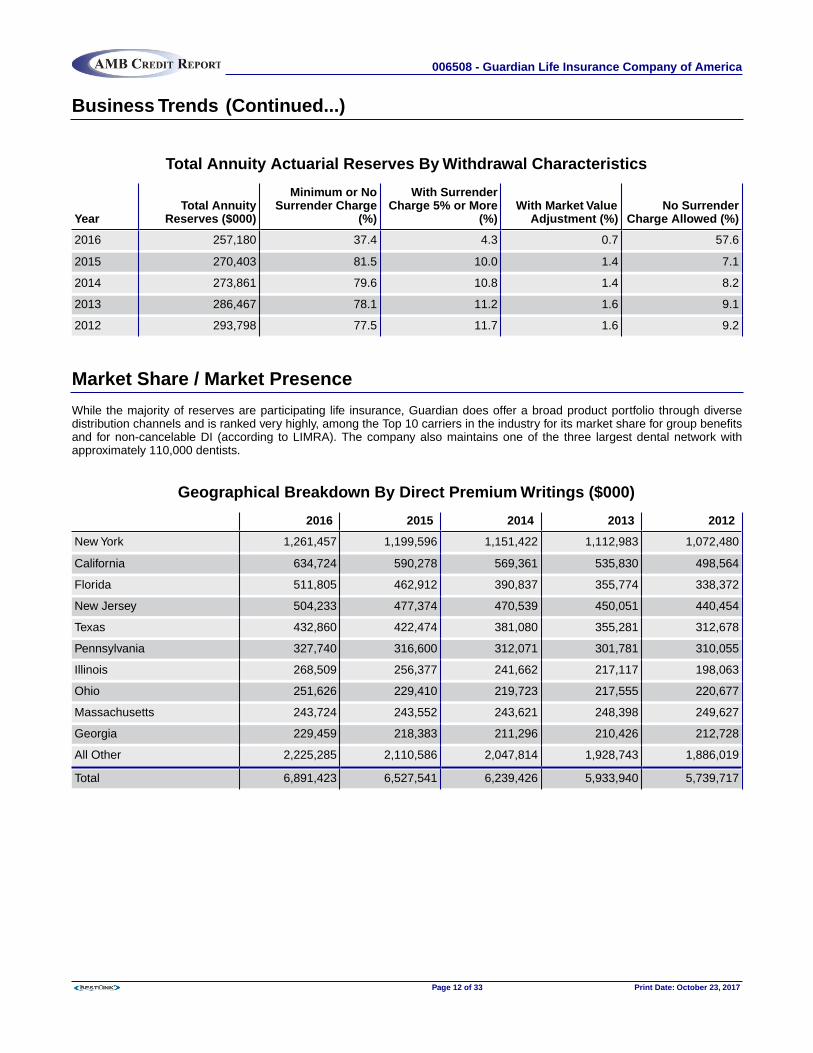
Total Annuity Actuarial Reserves By Withdrawal Characteristics
YearTotal Annuity
Reserves ($000)
Minimum or NoSurrender Charge
(%)
With SurrenderCharge 5% or More
(%)With Market Value
Adjustment (%)No Surrender
Charge Allowed (%)
2016 257,180 37.4 4.3 0.7 57.6
2015 270,403 81.5 10.0 1.4 7.1
2014 273,861 79.6 10.8 1.4 8.2
2013 286,467 78.1 11.2 1.6 9.1
2012 293,798 77.5 11.7 1.6 9.2
Market Share / Market Presence
While the majority of reserves are participating life insurance, Guardian does offer a broad product portfolio through diversedistribution channels and is ranked very highly, among the Top 10 carriers in the industry for its market share for group benefitsand for non-cancelable DI (according to LIMRA). The company also maintains one of the three largest dental network withapproximately 110,000 dentists.
Geographical Breakdown By Direct Premium Writings ($000)
2016 2015 2014 2013 2012
New York 1,261,457 1,199,596 1,151,422 1,112,983 1,072,480
California 634,724 590,278 569,361 535,830 498,564
Florida 511,805 462,912 390,837 355,774 338,372
New Jersey 504,233 477,374 470,539 450,051 440,454
Texas 432,860 422,474 381,080 355,281 312,678
Pennsylvania 327,740 316,600 312,071 301,781 310,055
Illinois 268,509 256,377 241,662 217,117 198,063
Ohio 251,626 229,410 219,723 217,555 220,677
Massachusetts 243,724 243,552 243,621 248,398 249,627
Georgia 229,459 218,383 211,296 210,426 212,728
All Other 2,225,285 2,110,586 2,047,814 1,928,743 1,886,019
Total 6,891,423 6,527,541 6,239,426 5,933,940 5,739,717
006508 - Guardian Life Insurance Company of America
Page 12 of 33 Print Date: October 23, 2017
Risk ManagementThe following text is derived from A.M. Best's Credit Report on Guardian Life & Health Group (AMB# 020389).
Guardian has a formal and disciplined structure to monitor and manage risk. Enterprise Risk Management (ERM) objectivesare to manage and aggregate risk on an enterprise-wide level, ensure robust risk management processes, and instill a riskmanagement culture throughout the organization. By accomplishing these objectives, Guardian's ERM efforts allow the entityto maintain excellent financial strength, favorable capitalization and provide its customers with products that optimize thebalance between financial risk and return for both policyholders and the enterprise.
Guardian operationalizes its enterprise risk management through various Committees all of which report to the Corporate RiskManagement Committee (CRMC). Committee's reporting to the CRMC includes Investment Risk, Compliance, Operational,Product and Business Unit/Distribution. The CRMC consists of CEO, CFO, COO and other senior executives and is chaired bythe Chief Risk Officer. The Chief Actuary functions as the Chief Risk Officer of the Company. Each Committee has a charterdefining its mission and how it operates.
The Board of Directors has ultimate responsibility to monitor enterprise risks and management's plans to manage those risks,and the Board and each of its principal Committees have written charters containing explicit statements of their responsibilitiesfor monitoring enterprise risks and the Company's plans to manage those risks. Specifically, the Audit and Risk Committee isresponsible for monitoring all risks and their related management plans not explicitly covered by other Board committees. TheInvestment Committee monitors all investment risks and the Product and Distribution Committee monitors product pricingrisks, reviews the annual policyholder dividend pay-out and all reinsurance policies.
The Company has defined and quantified its ERM practices through a Guardian Corporate Risk Appetite statement which isupdated on an annual basis. This statement is enterprise wide, developed in conjunction with the planning process, and isreviewed and approved at both the Corporate Risk Committee as well as the Board of Directors. It reflects all material risksincluding interest rate, equity market, credit, business and operational. Once the enterprise wide "risk budget" is determined itis then allocated to each profit center which in turn develops its own cascading risk appetite statement to ensure consistencyand compliance with the overall enterprise risk budget. The risk appetite statement includes quantitative risk tolerances whichmandate minimum RBC ratios, earnings requirements, and place constraints on earnings volatility and capital volatility. Inaddition, a number of qualitative tolerances are formulated to address operational, business, regulatory and reputational risks.The Company uses various tools to understand and evaluate risks including stress testing and economic capital modeling.Economic capital modeling is performed for all business segments utilizing a set of integrated scenarios which identify allmaterial business risks using a conditional tail expectation ratio of 99% (i.e. required capital is computed based on theoutcomes of the worst 1% scenarios). Finally, in addition to economic capital, the company has completed a review of its OwnRisk and Solvency Assessment (ORSA) which will be required by the NAIC in the future.
006508 - Guardian Life Insurance Company of America
Page 13 of 33 Print Date: October 23, 2017
Operating PerformanceThe following text is derived from A.M. Best's Credit Report on Guardian Life & Health Group (AMB# 020389).
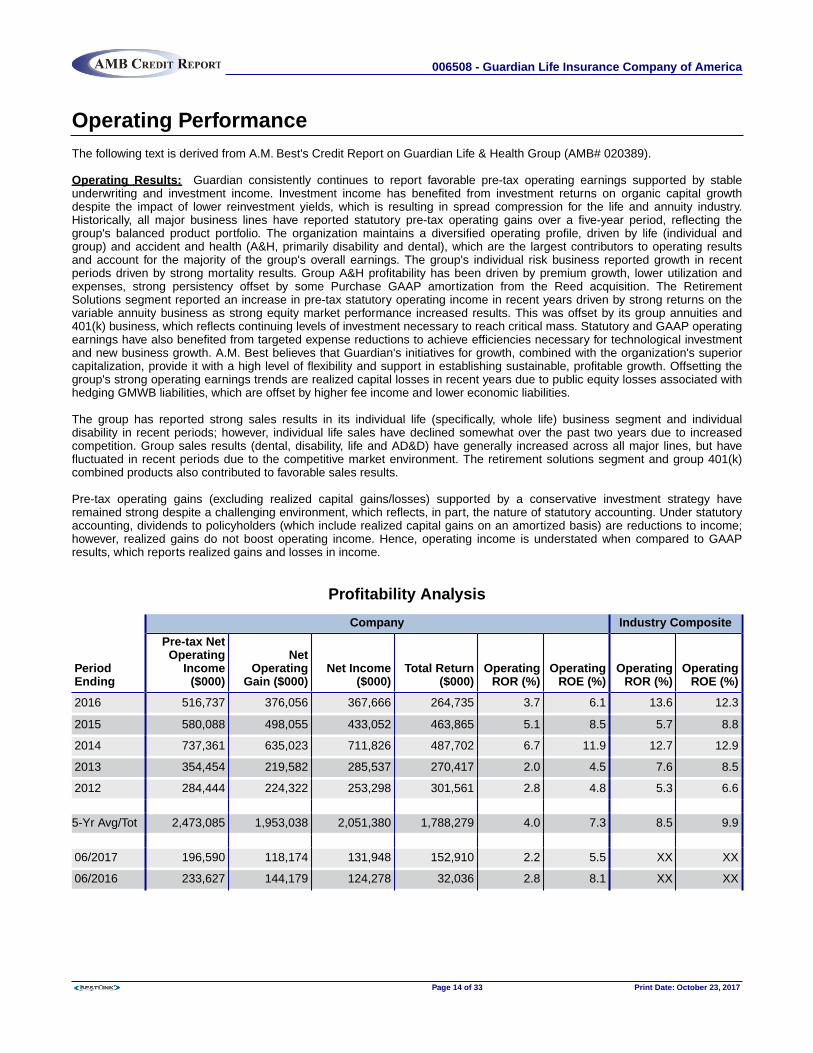
Operating Results: Guardian consistently continues to report favorable pre-tax operating earnings supported by stableunderwriting and investment income. Investment income has benefited from investment returns on organic capital growthdespite the impact of lower reinvestment yields, which is resulting in spread compression for the life and annuity industry.Historically, all major business lines have reported statutory pre-tax operating gains over a five-year period, reflecting thegroup's balanced product portfolio. The organization maintains a diversified operating profile, driven by life (individual andgroup) and accident and health (A&H, primarily disability and dental), which are the largest contributors to operating resultsand account for the majority of the group's overall earnings. The group's individual risk business reported growth in recentperiods driven by strong mortality results. Group A&H profitability has been driven by premium growth, lower utilization andexpenses, strong persistency offset by some Purchase GAAP amortization from the Reed acquisition. The RetirementSolutions segment reported an increase in pre-tax statutory operating income in recent years driven by strong returns on thevariable annuity business as strong equity market performance increased results. This was offset by its group annuities and401(k) business, which reflects continuing levels of investment necessary to reach critical mass. Statutory and GAAP operatingearnings have also benefited from targeted expense reductions to achieve efficiencies necessary for technological investmentand new business growth. A.M. Best believes that Guardian's initiatives for growth, combined with the organization's superiorcapitalization, provide it with a high level of flexibility and support in establishing sustainable, profitable growth. Offsetting thegroup's strong operating earnings trends are realized capital losses in recent years due to public equity losses associated withhedging GMWB liabilities, which are offset by higher fee income and lower economic liabilities.
The group has reported strong sales results in its individual life (specifically, whole life) business segment and individualdisability in recent periods; however, individual life sales have declined somewhat over the past two years due to increasedcompetition. Group sales results (dental, disability, life and AD&D) have generally increased across all major lines, but havefluctuated in recent periods due to the competitive market environment. The retirement solutions segment and group 401(k)combined products also contributed to favorable sales results.
Pre-tax operating gains (excluding realized capital gains/losses) supported by a conservative investment strategy haveremained strong despite a challenging environment, which reflects, in part, the nature of statutory accounting. Under statutoryaccounting, dividends to policyholders (which include realized capital gains on an amortized basis) are reductions to income;however, realized gains do not boost operating income. Hence, operating income is understated when compared to GAAPresults, which reports realized gains and losses in income.
Profitability Analysis
PeriodEnding
Company Industry Composite
Pre-tax NetOperating
Income($000)
NetOperating
Gain ($000)Net Income
($000)Total Return
($000)Operating
ROR (%)Operating
ROE (%)Operating
ROR (%)Operating
ROE (%)
2016 516,737 376,056 367,666 264,735 3.7 6.1 13.6 12.3
2015 580,088 498,055 433,052 463,865 5.1 8.5 5.7 8.8
2014 737,361 635,023 711,826 487,702 6.7 11.9 12.7 12.9
2013 354,454 219,582 285,537 270,417 2.0 4.5 7.6 8.5
2012 284,444 224,322 253,298 301,561 2.8 4.8 5.3 6.6
5-Yr Avg/Tot 2,473,085 1,953,038 2,051,380 1,788,279 4.0 7.3 8.5 9.9
06/2017 196,590 118,174 131,948 152,910 2.2 5.5 XX XX
06/2016 233,627 144,179 124,278 32,036 2.8 8.1 XX XX
006508 - Guardian Life Insurance Company of America
Page 14 of 33 Print Date: October 23, 2017
Operating Performance (Continued...)
Operating ROR Comparison with Industry Composite
0.0
3.0
6.0
9.0
12.0
15.0
2012 2013 2014 2015 2016
2.82.0
6.75.1
3.7
5.3
7.6
12.7
5.7
13.6
- Company Operating ROR - Industry Composite Operating ROR
* Industry Composite - Individual Life Composite
Operating ROE Comparison with Industry Composite
0.0
3.0
6.0
9.0
12.0
15.0
2012 2013 2014 2015 2016
4.8 4.5
11.9
8.5
6.1
6.6
8.5
12.9
8.8
12.3
- Company Operating ROE - Industry Composite Operating ROE
* Industry Composite - Individual Life Composite
Underwriting Results
Profitability Tests (%)
Year
Benefits Paidto NPW &Deposits
Commissions& Expenses
to NPW &Deposits
NOG to TotalAssets
NOG to TotalRevenues
OperatingReturn on
Equity Net YieldPre-tax Invest
Total Return
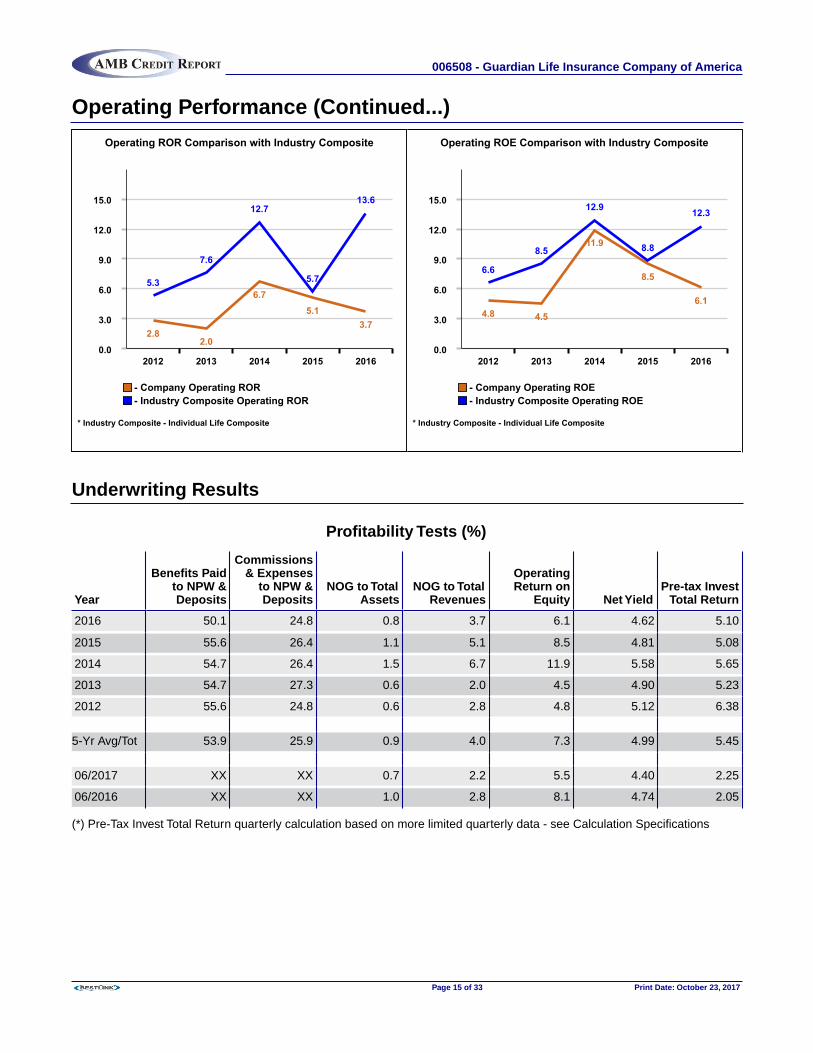
2016 50.1 24.8 0.8 3.7 6.1 4.62 5.10
2015 55.6 26.4 1.1 5.1 8.5 4.81 5.08
2014 54.7 26.4 1.5 6.7 11.9 5.58 5.65
2013 54.7 27.3 0.6 2.0 4.5 4.90 5.23
2012 55.6 24.8 0.6 2.8 4.8 5.12 6.38
5-Yr Avg/Tot 53.9 25.9 0.9 4.0 7.3 4.99 5.45
06/2017 XX XX 0.7 2.2 5.5 4.40 2.25
06/2016 XX XX 1.0 2.8 8.1 4.74 2.05
(*) Pre-Tax Invest Total Return quarterly calculation based on more limited quarterly data - see Calculation Specifications
006508 - Guardian Life Insurance Company of America
Page 15 of 33 Print Date: October 23, 2017
Underwriting Results (Continued...)
Net Operating Gain
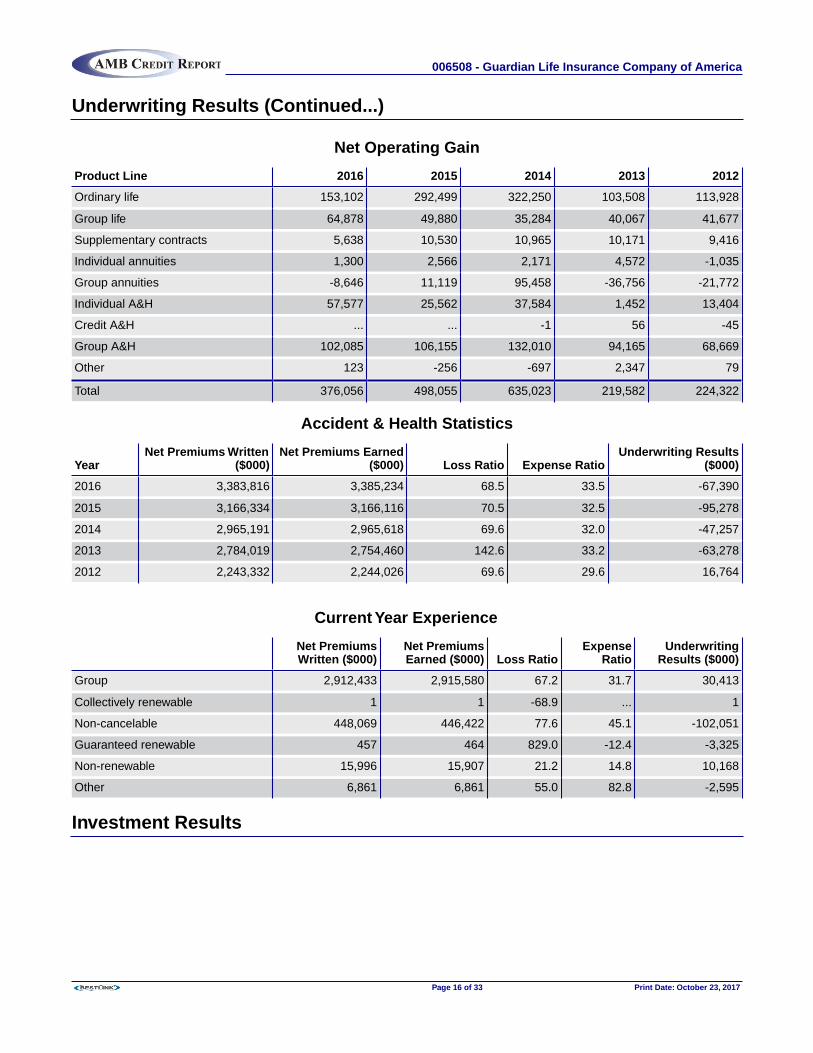
Product Line 2016 2015 2014 2013 2012
Ordinary life 153,102 292,499 322,250 103,508 113,928
Group life 64,878 49,880 35,284 40,067 41,677
Supplementary contracts 5,638 10,530 10,965 10,171 9,416
Individual annuities 1,300 2,566 2,171 4,572 -1,035
Group annuities -8,646 11,119 95,458 -36,756 -21,772
Individual A&H 57,577 25,562 37,584 1,452 13,404
Credit A&H ... ... -1 56 -45
Group A&H 102,085 106,155 132,010 94,165 68,669
Other 123 -256 -697 2,347 79
Total 376,056 498,055 635,023 219,582 224,322
Accident & Health Statistics
YearNet Premiums Written
($000)Net Premiums Earned
($000) Loss Ratio Expense RatioUnderwriting Results
($000)
2016 3,383,816 3,385,234 68.5 33.5 -67,390
2015 3,166,334 3,166,116 70.5 32.5 -95,278
2014 2,965,191 2,965,618 69.6 32.0 -47,257
2013 2,784,019 2,754,460 142.6 33.2 -63,278
2012 2,243,332 2,244,026 69.6 29.6 16,764
Current Year Experience
Net PremiumsWritten ($000)
Net PremiumsEarned ($000) Loss Ratio
ExpenseRatio
UnderwritingResults ($000)
Group 2,912,433 2,915,580 67.2 31.7 30,413
Collectively renewable 1 1 -68.9 ... 1
Non-cancelable 448,069 446,422 77.6 45.1 -102,051
Guaranteed renewable 457 464 829.0 -12.4 -3,325
Non-renewable 15,996 15,907 21.2 14.8 10,168
Other 6,861 6,861 55.0 82.8 -2,595
Investment Results
006508 - Guardian Life Insurance Company of America
Page 16 of 33 Print Date: October 23, 2017

Investment Results (Continued...)Investment Gains
Year
CompanyIndustry
Composite
Net Invest.Income ($000)
RealizedCapital Gains
($000)
UnrealizedCapital Gains
($000)
Invest.IncomeGrowth
(%)
Invest.Yield
(%)
Return onInvested
Assets(%)
Pre-taxInvestTotal
Return(%)
Invest.IncomeGrowth
(%)
Invest.Yield
(%)
2016 2,052,329 -8,390 -102,932 3.4 4.6 5.1 5.10 1.5 4.9
2015 1,984,669 -65,003 30,813 -7.5 4.8 4.8 5.08 -11.2 5.0
2014 2,145,842 76,803 -224,125 21.5 5.6 6.2 5.65 15.5 5.9
2013 1,765,427 65,955 -15,121 2.1 4.9 5.2 5.23 3.9 5.2
2012 1,728,420 28,976 48,264 0.8 5.1 6.0 6.38 -6.7 5.0
5-Yr Avg/Tot 9,676,687 98,341 -263,100 3.6 5.0 5.4 5.45 0.2 5.2
06/2017 1,024,192 13,773 20,963 0.1 4.4 4.5 2.25 XX XX
06/2016 1,022,677 -19,901 -92,242 6.8 4.7 4.2 2.05 XX XX
(*) Pre-Tax Invest Total Return quarterly calculation based on more limited quarterly data - see Calculation Specifications
Investment Income Growth vs Industry
-15.0
-7.5
0.0
7.5
15.0
22.5
2012 2013 2014 2015 2016
0.8
2.1
21.5
-7.5
3.4
-6.7
3.9
15.5
-11.2
1.5
- Company Investment Income Growth (%) - Industry Composite Investment Income Growth (%)
* Industry Composite - Individual Life Composite
Investment Yield vs Industry
0.0
1.3
2.6
3.9
5.2
6.5
2012 2013 2014 2015 2016
5.1
4.9
5.6
4.8 4.65.0
5.25.9
5.0 4.9
- Company Investment Yield (%) - Industry Composite Investment Yield (%)
* Industry Composite - Individual Life Composite
006508 - Guardian Life Insurance Company of America
Page 17 of 33 Print Date: October 23, 2017
Balance Sheet Strength
Capitalization
The following text is derived from A.M. Best's Credit Report on Guardian Life & Health Group (AMB# 020389).
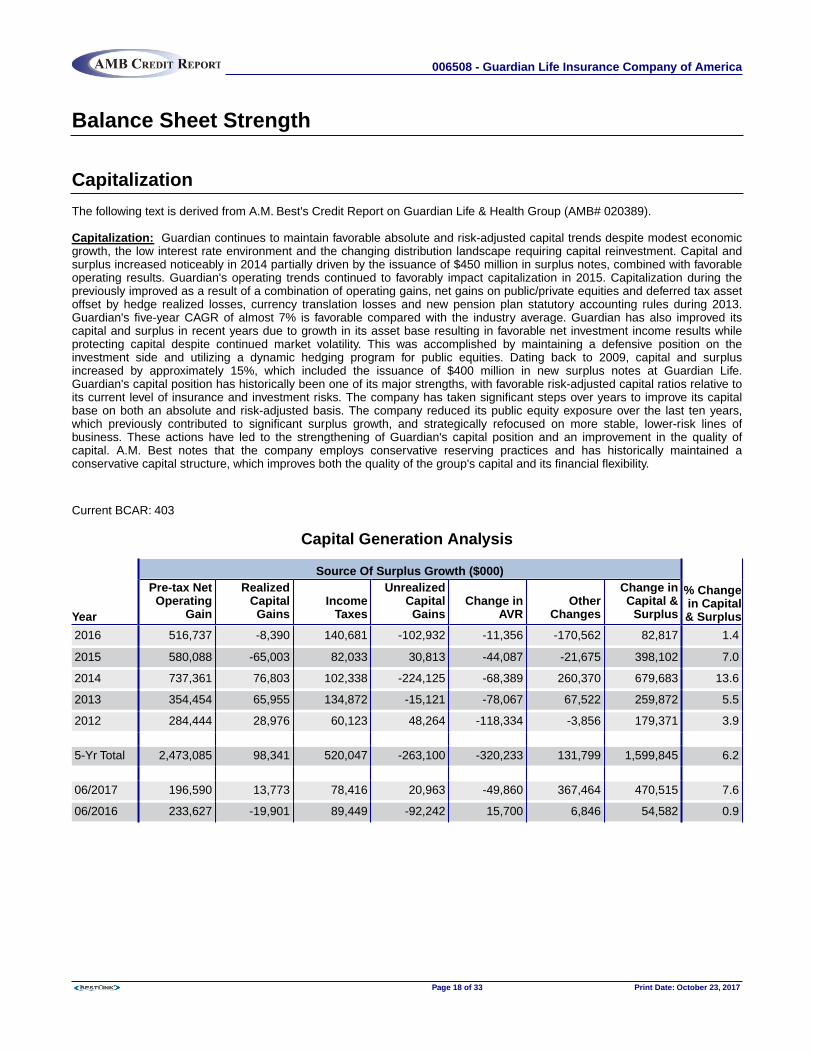
Capitalization: Guardian continues to maintain favorable absolute and risk-adjusted capital trends despite modest economicgrowth, the low interest rate environment and the changing distribution landscape requiring capital reinvestment. Capital andsurplus increased noticeably in 2014 partially driven by the issuance of $450 million in surplus notes, combined with favorableoperating results. Guardian's operating trends continued to favorably impact capitalization in 2015. Capitalization during thepreviously improved as a result of a combination of operating gains, net gains on public/private equities and deferred tax assetoffset by hedge realized losses, currency translation losses and new pension plan statutory accounting rules during 2013.Guardian's five-year CAGR of almost 7% is favorable compared with the industry average. Guardian has also improved itscapital and surplus in recent years due to growth in its asset base resulting in favorable net investment income results whileprotecting capital despite continued market volatility. This was accomplished by maintaining a defensive position on theinvestment side and utilizing a dynamic hedging program for public equities. Dating back to 2009, capital and surplusincreased by approximately 15%, which included the issuance of $400 million in new surplus notes at Guardian Life.Guardian's capital position has historically been one of its major strengths, with favorable risk-adjusted capital ratios relative toits current level of insurance and investment risks. The company has taken significant steps over years to improve its capitalbase on both an absolute and risk-adjusted basis. The company reduced its public equity exposure over the last ten years,which previously contributed to significant surplus growth, and strategically refocused on more stable, lower-risk lines ofbusiness. These actions have led to the strengthening of Guardian's capital position and an improvement in the quality ofcapital. A.M. Best notes that the company employs conservative reserving practices and has historically maintained aconservative capital structure, which improves both the quality of the group's capital and its financial flexibility.
Current BCAR: 403
Capital Generation Analysis
Year
Source Of Surplus Growth ($000)
% Changein Capital& Surplus
Pre-tax NetOperating
Gain
RealizedCapitalGains
IncomeTaxes
UnrealizedCapitalGains
Change inAVR
OtherChanges
Change inCapital &
Surplus
2016 516,737 -8,390 140,681 -102,932 -11,356 -170,562 82,817 1.4
2015 580,088 -65,003 82,033 30,813 -44,087 -21,675 398,102 7.0
2014 737,361 76,803 102,338 -224,125 -68,389 260,370 679,683 13.6
2013 354,454 65,955 134,872 -15,121 -78,067 67,522 259,872 5.5
2012 284,444 28,976 60,123 48,264 -118,334 -3,856 179,371 3.9
5-Yr Total 2,473,085 98,341 520,047 -263,100 -320,233 131,799 1,599,845 6.2
06/2017 196,590 13,773 78,416 20,963 -49,860 367,464 470,515 7.6
06/2016 233,627 -19,901 89,449 -92,242 15,700 6,846 54,582 0.9
006508 - Guardian Life Insurance Company of America
Page 18 of 33 Print Date: October 23, 2017
Capitalization (Continued...)
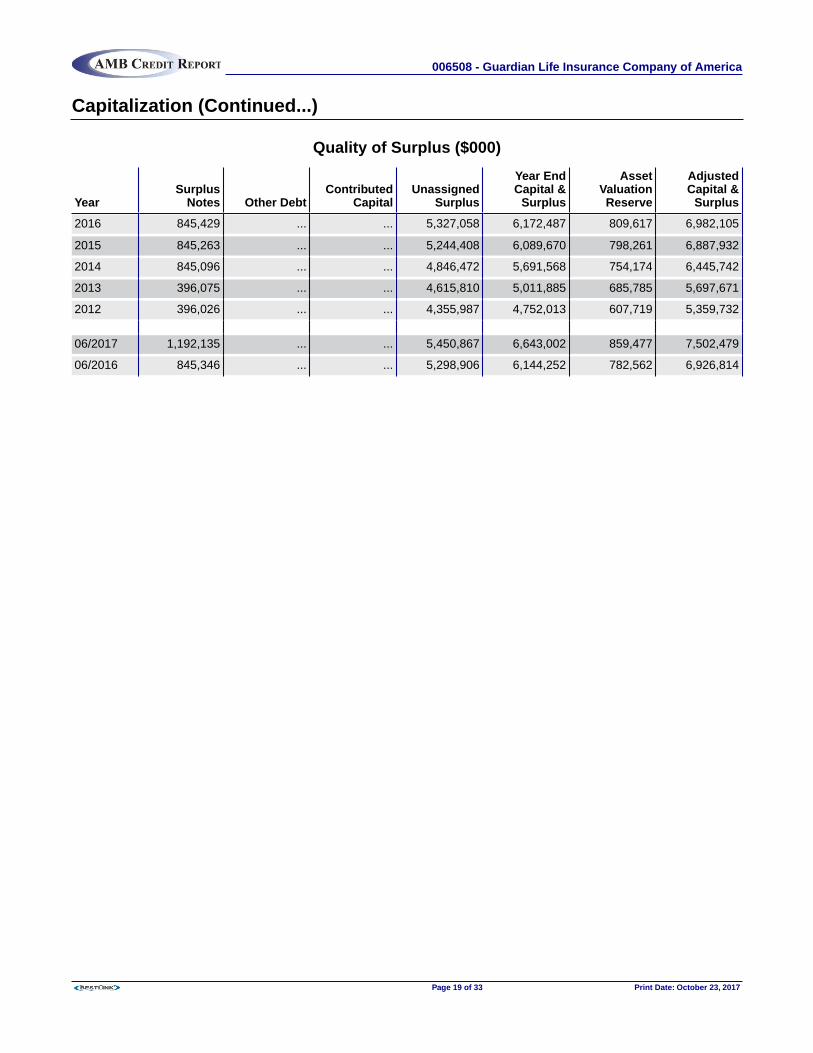
Quality of Surplus ($000)
YearSurplus
Notes Other DebtContributed
CapitalUnassigned
Surplus
Year EndCapital &
Surplus
AssetValuationReserve
AdjustedCapital &
Surplus
2016 845,429 ... ... 5,327,058 6,172,487 809,617 6,982,105
2015 845,263 ... ... 5,244,408 6,089,670 798,261 6,887,932
2014 845,096 ... ... 4,846,472 5,691,568 754,174 6,445,742
2013 396,075 ... ... 4,615,810 5,011,885 685,785 5,697,671
2012 396,026 ... ... 4,355,987 4,752,013 607,719 5,359,732
06/2017 1,192,135 ... ... 5,450,867 6,643,002 859,477 7,502,479
06/2016 845,346 ... ... 5,298,906 6,144,252 782,562 6,926,814
006508 - Guardian Life Insurance Company of America
Page 19 of 33 Print Date: October 23, 2017
Underwriting Leverage
Leverage Analysis
Year
Company Industry Composite
Capital & Surplusto Liabilities (%)
SurplusRelief (%)
NPW & Deposits toTotal Capital
Change in NPW &Deposits (%)
Capital & Surplusto Liabilities (%)
SurplusRelief (%)
2016 15.5 1.4 1.2 16.5 17.9 2.9
2015 16.7 1.5 1.1 4.7 17.4 2.9
2014 16.6 1.8 1.1 4.4 17.6 1.8
2013 15.7 2.2 1.2 11.6 17.8 2.9
2012 16.7 2.4 1.1 2.3 17.7 3.1
06/2017 16.0 0.7 XX XX XX XX
06/2016 15.9 0.7 XX XX XX XX
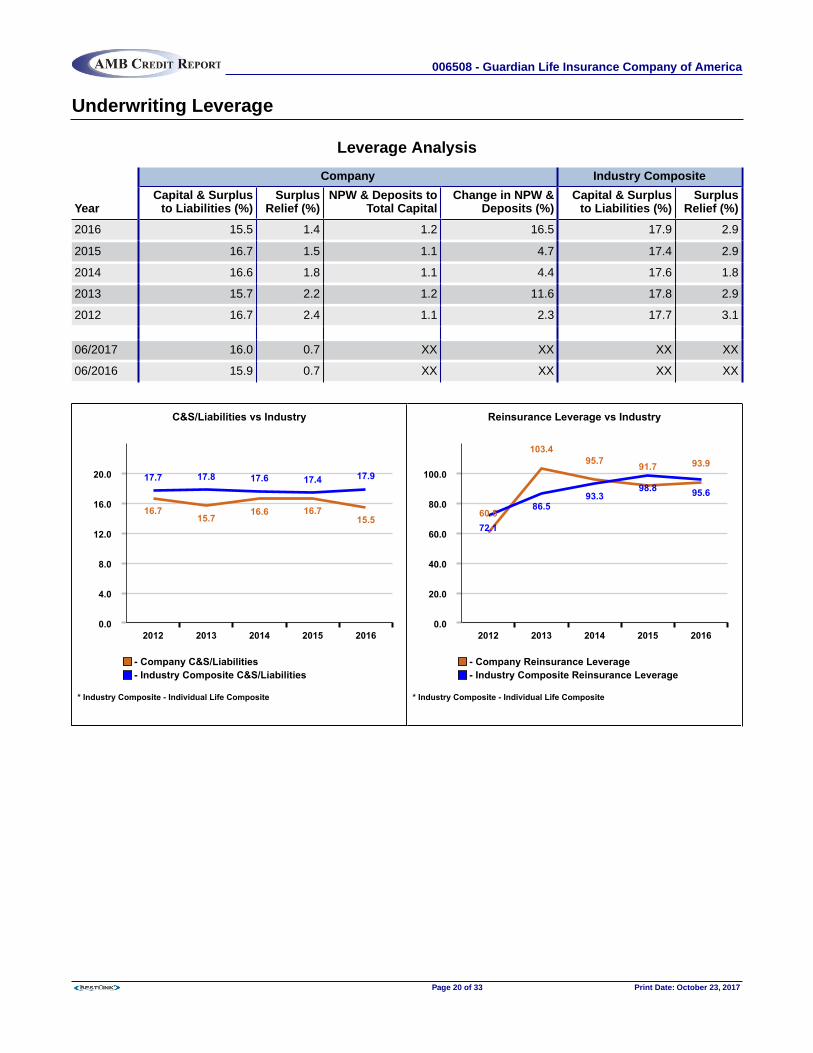
C&S/Liabilities vs Industry
0.0
4.0
8.0
12.0
16.0
20.0
2012 2013 2014 2015 2016
16.715.7
16.6 16.715.5
17.7 17.8 17.6 17.4 17.9
- Company C&S/Liabilities - Industry Composite C&S/Liabilities
* Industry Composite - Individual Life Composite
Reinsurance Leverage vs Industry
0.0
20.0
40.0
60.0
80.0
100.0
2012 2013 2014 2015 2016
60.5
103.495.7 91.7 93.9
72.1
86.593.3
98.8 95.6
- Company Reinsurance Leverage - Industry Composite Reinsurance Leverage
* Industry Composite - Individual Life Composite
006508 - Guardian Life Insurance Company of America
Page 20 of 33 Print Date: October 23, 2017

Underwriting Leverage (Continued...)
Ceded Reinsurance Analysis
Year
Company Industry Composite
Face AmountReinsurance
Ceded
AffiliatedReinsuranceRecoverable
/ Capital &Surplus
UnaffiliatedReinsuranceRecoverable
/ Capital &Surplus
TotalReinsuranceRecoverable
/ Capital &Surplus
SurplusRelief
ReinsuranceLeverage
TotalReinsuranceRecoverable
/ Capital &Surplus
ReinsuranceLeverage
2016 149,453,849 0.7 0.8 1.5 1.4 93.9 2.9 95.6
2015 139,157,222 0.6 0.6 1.2 1.5 91.7 2.9 98.8
2014 130,039,866 0.6 1.1 1.7 1.8 95.7 2.9 93.3
2013 120,505,357 0.7 1.2 1.8 2.2 103.4 2.7 86.5
2012 114,093,169 0.6 1.2 1.8 2.4 60.5 2.8 72.1
Liquidity
The following text is derived from A.M. Best's Credit Report on Guardian Life & Health Group (AMB# 020389).
Liquidity: According to the A.M. Best Liquidity model for U.S. Life Insurers, Guardian maintains a high level of liquiditysuitable for its diversified risk profile. Both its short-term (30 days) and longer term (six to 12 months) ratios which measurescash needs positions under stressed scenarios exceed 100%. A ratio that exceeds 100% indicates that a higher comfort levelexists that a company's exposure to liquidity risk is acceptable. This high degree of liquidity also enables Guardian to meetunexpected needs for cash without the untimely sale of investments, which could result in realized gains/losses due to marketvolatility. Guardian's quick and current liquidity ratio's measures the proportion of liabilities covered by cash and investmentsthat can be converted quickly to cash are within expectations and are comparable to industry composites. Guardian's non-investment grade fixed-income securities, mortgage and real estate, and affiliated investments relative to capital areconsidered favorable when compared to the total industry and mutual company composites.
Liquidity Analysis
Year
Company Industry Composite
OperatingCash Flow
($000)Quick
LiquidityCurrent
Liquidity
Non-Investment
GradeBonds /Capital
Delinq &ForeclosedMortgage /
Capital
Mortgage& Real
Estate toCapital
AffiliatedInvestment
to CapitalQuick
LiquidityCurrent
Liquidity
2016 2,706,781 37.0 80.8 33.1 ... 55.1 27.5 45.7 81.8
2015 2,585,843 36.6 79.3 29.5 ... 55.4 23.9 45.0 80.8
2014 2,561,836 36.9 79.3 32.8 ... 49.6 27.2 45.4 80.8
2013 2,126,844 37.4 78.2 34.6 ... 52.4 29.8 46.4 81.7
2012 2,040,746 39.5 81.7 33.9 ... 60.2 29.2 48.3 82.4
06/2017 1,149,523 XX 81.5 28.6 ... 53.7 24.5 XX XX
06/2016 1,245,464 XX 80.3 38.4 ... 54.6 27.3 XX XX
006508 - Guardian Life Insurance Company of America
Page 21 of 33 Print Date: October 23, 2017
Liquidity (Continued...)
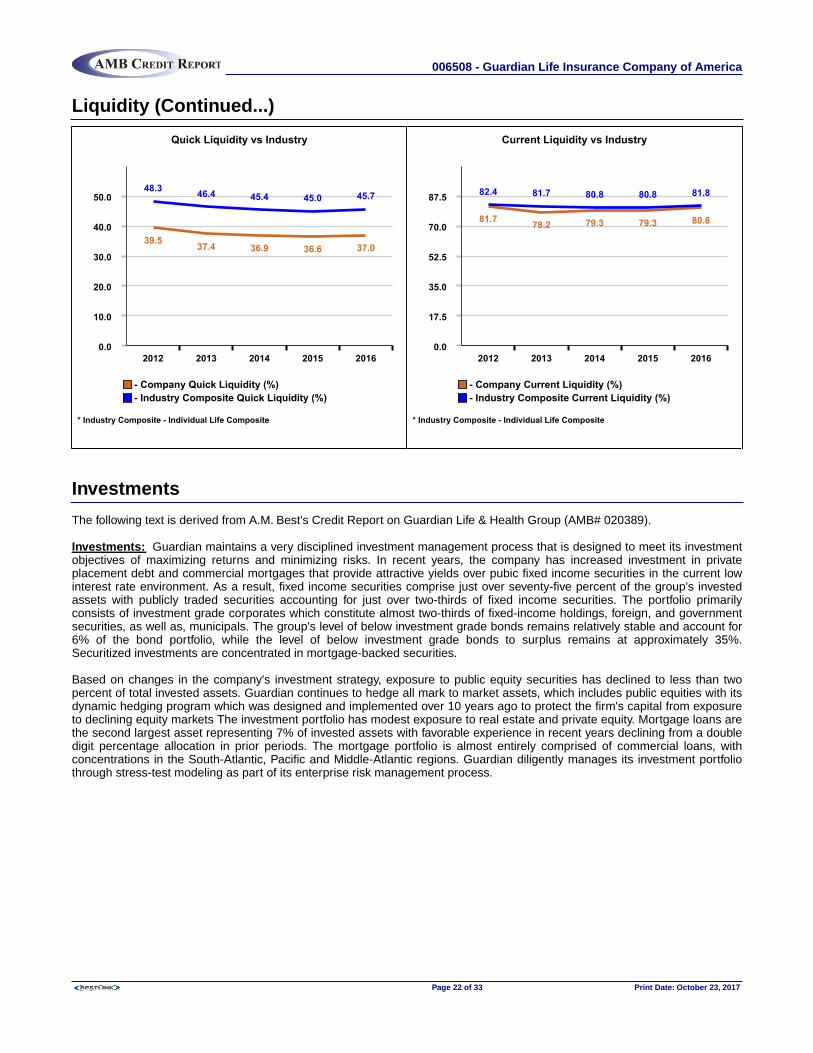
Quick Liquidity vs Industry
0.0
10.0
20.0
30.0
40.0
50.0
2012 2013 2014 2015 2016
39.5 37.4 36.9 36.6 37.0
48.3 46.4 45.4 45.0 45.7
- Company Quick Liquidity (%) - Industry Composite Quick Liquidity (%)
* Industry Composite - Individual Life Composite
Current Liquidity vs Industry
0.0
17.5
35.0
52.5
70.0
87.5
2012 2013 2014 2015 2016
81.7 78.2 79.3 79.3 80.8
82.4 81.7 80.8 80.8 81.8
- Company Current Liquidity (%) - Industry Composite Current Liquidity (%)
* Industry Composite - Individual Life Composite
Investments
The following text is derived from A.M. Best's Credit Report on Guardian Life & Health Group (AMB# 020389).
Investments: Guardian maintains a very disciplined investment management process that is designed to meet its investmentobjectives of maximizing returns and minimizing risks. In recent years, the company has increased investment in privateplacement debt and commercial mortgages that provide attractive yields over pubic fixed income securities in the current lowinterest rate environment. As a result, fixed income securities comprise just over seventy-five percent of the group's investedassets with publicly traded securities accounting for just over two-thirds of fixed income securities. The portfolio primarilyconsists of investment grade corporates which constitute almost two-thirds of fixed-income holdings, foreign, and governmentsecurities, as well as, municipals. The group's level of below investment grade bonds remains relatively stable and account for6% of the bond portfolio, while the level of below investment grade bonds to surplus remains at approximately 35%.Securitized investments are concentrated in mortgage-backed securities.
Based on changes in the company's investment strategy, exposure to public equity securities has declined to less than twopercent of total invested assets. Guardian continues to hedge all mark to market assets, which includes public equities with itsdynamic hedging program which was designed and implemented over 10 years ago to protect the firm's capital from exposureto declining equity markets The investment portfolio has modest exposure to real estate and private equity. Mortgage loans arethe second largest asset representing 7% of invested assets with favorable experience in recent years declining from a doubledigit percentage allocation in prior periods. The mortgage portfolio is almost entirely comprised of commercial loans, withconcentrations in the South-Atlantic, Pacific and Middle-Atlantic regions. Guardian diligently manages its investment portfoliothrough stress-test modeling as part of its enterprise risk management process.
006508 - Guardian Life Insurance Company of America
Page 22 of 33 Print Date: October 23, 2017

Investments (Continued...)
Investment Yields (%)
Year Net Yield Bonds Stocks MortgagesCash &
Short Term
Real Estate InvestmentExpense
RatioGross Net
2016 4.62 4.60 1.43 4.94 0.53 18.14 2.90 8.67
2015 4.81 4.82 2.80 4.93 0.35 25.69 4.42 8.70
2014 5.58 4.93 21.20 5.62 0.21 16.82 5.25 5.76
2013 4.90 4.98 1.62 6.46 0.38 17.18 4.93 5.88
2012 5.12 5.28 1.50 6.23 0.60 17.58 5.68 5.74
Investments - Bond Portfolio
2016 Distribution By Maturity
Years YearsAverageMaturity0-1 1-5 5-10 10-20 20+
Government 1.6 1.6 0.5 0.2 2.3 11.3
Government Agencies ... 0.3 1.2 1.7 4.8 19.4
Industrial & Miscellaneous 1.7 16.0 30.8 10.1 26.6 12.9
Affiliated 0.4 ... ... ... ... 0.5
Hybrid Securities ... ... ... ... 0.1 19.9
Total 3.8 17.9 32.5 12.0 33.8 13.3
006508 - Guardian Life Insurance Company of America
Page 23 of 33 Print Date: October 23, 2017

Investments - Bond Portfolio (Continued...)
Bond Distribution By Issuer Type
2016 2015 2014 2013 2012
Bonds ($000) 35,447,351 31,715,928 29,652,862 27,379,870 25,186,382
US Government 4.5 5.2 4.4 5.2 4.5
Foreign Government 0.1 0.5 1.8 1.4 1.8
State, Municipal & Special Revenue - US 8.2 8.9 9.2 10.8 13.6
Industrial & Miscellaneous - US 87.2 85.4 84.6 82.6 80.2
2016 Bond Distribution By Issuer Type
4.5%
0.1%
8.2%
87.2%
US Government Foreign Government State, Municipal & Special Revenue - US Industrial & Miscellaneous - US
Bond Percent Private vs Public
2016 2015 2014 2013 2012
Private Issues 34.2 34.2 33.1 31.4 29.9
Public Issues 65.8 65.8 66.9 68.6 70.1
Bond Quality
2016 2015 2014 2013 2012
Class 1 52.2 52.2 49.2 48.2 49.5
Class 2 41.4 41.6 43.9 44.7 43.4
Class 3 3.3 3.1 3.5 3.1 3.4
Class 4 2.8 2.7 3.1 3.6 3.3
Class 5 0.3 0.4 0.3 0.3 0.4
006508 - Guardian Life Insurance Company of America
Page 24 of 33 Print Date: October 23, 2017
Investments - Equity Portfolio
2016 2015 2014 2013 2012
Total Stocks ($000) 1,522,149 1,622,748 1,649,261 1,649,650 1,986,047
Unaffiliated Common 28.8 30.2 31.8 33.5 43.3
Affiliated Common 68.6 59.5 61.0 62.0 50.8
Unaffiliated Preferred 2.7 10.3 7.2 4.5 5.9
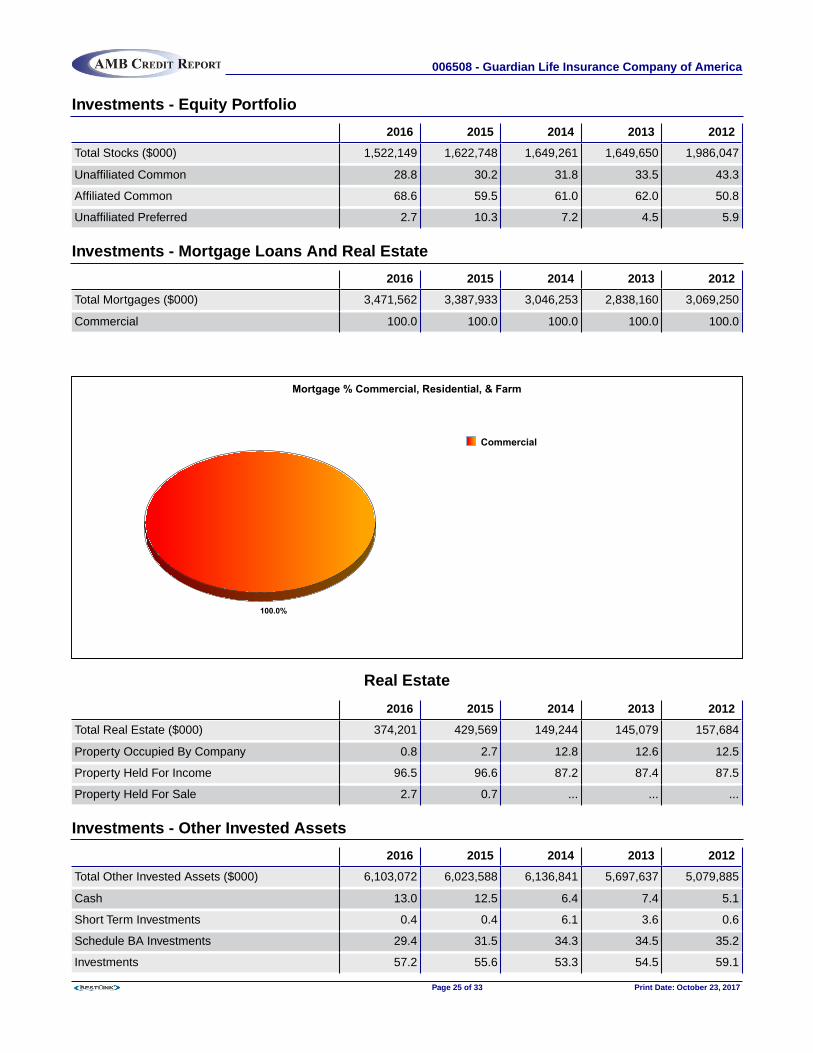
Investments - Mortgage Loans And Real Estate
2016 2015 2014 2013 2012
Total Mortgages ($000) 3,471,562 3,387,933 3,046,253 2,838,160 3,069,250
Commercial 100.0 100.0 100.0 100.0 100.0
Mortgage % Commercial, Residential, & Farm
100.0%
Commercial
Real Estate
2016 2015 2014 2013 2012
Total Real Estate ($000) 374,201 429,569 149,244 145,079 157,684
Property Occupied By Company 0.8 2.7 12.8 12.6 12.5
Property Held For Income 96.5 96.6 87.2 87.4 87.5
Property Held For Sale 2.7 0.7 ... ... ...
Investments - Other Invested Assets
2016 2015 2014 2013 2012
Total Other Invested Assets ($000) 6,103,072 6,023,588 6,136,841 5,697,637 5,079,885
Cash 13.0 12.5 6.4 7.4 5.1
Short Term Investments 0.4 0.4 6.1 3.6 0.6
Schedule BA Investments 29.4 31.5 34.3 34.5 35.2
Investments 57.2 55.6 53.3 54.5 59.1
006508 - Guardian Life Insurance Company of America
Page 25 of 33 Print Date: October 23, 2017

History
Date Incorporated: 04/10/1860 Date Commenced: 07/16/1860 Domicile: NY
Originally incorporated as Germania Life Insurance Company, the present title was adopted in 1918. The company was fullymutualized during 1945.
Mergers: Berkshire Life Insurance Company, Massachusetts, 2001.
RS Investments (65% stake) 2006
Officers And Directors
OfficersPresident and CEO: Deanna M. MulliganEVP and CFO: Marc CostantiniEVP and Chief Investment Officer: Thomas G. SorellEVP and General Counsel: Tracy L. RichEVP: Michael N. Ferik (Individual Markets)SVP and CFO: Michael B. Cefole (Group and WorksiteMarkets)
SVP and Secretary: Harris OlinerSVP, Chief Actuary and Chief Risk Officer: MichaelSlipowitzSVP and Controller: John H. FlanniganSVP and Chief Human Resource Officer: Jay E.Rosenblum
DirectorsJohn J. BrennanLloyd E. CampbellRichard E. CavanaghNancy E. CooperDeborah L. Duncan
William C. FredaChristopher T. JennyDeanna M. MulliganStephen J. SqueriDonald C. Waite III
Regulatory
An examination of the financial condition was made as of December 31, 2008, by the insurance department of New York. The2016 annual independent audit of the company was conducted by PricewaterhouseCoopers, LLP. The annual statement ofactuarial opinion is provided by Michael Slipowitz, FSA, CERA, MAAA, Senior Vice President, Corporate Chief Actuary & ChiefRisk Officer.
Reserve Basis: (Current ordinary business): 2001 CSO 3.5%; Commissioners Reserve Valuation Method for most plans.(Current group business): 1960 CSG 4 1/2%; One year term valuation.
Reinsurance
The following text is derived from A.M. Best's Credit Report on Guardian Life & Health Group (AMB# 020389).
The company limits its exposure to loss by maintaining ceding agreements with several major reinsurers under various types oftreaties. Maximum net retention on any one life is $15 million for ordinary life and $1 million for group life.
006508 - Guardian Life Insurance Company of America
Page 26 of 33 Print Date: October 23, 2017

Balance Sheet ($000)
Admitted Assets YE 2016 YE 2015
Bonds 35,447,351 31,715,928
Preferred Stocks 40,487 166,835
Common Stocks 1,481,662 1,455,913
Mortgage Loans 3,471,562 3,387,933
Real Estate 374,201 429,569
Contract Loans 3,405,118 3,337,426
Cash & short-term Investments 821,843 778,064
Other Invested Assets 1,793,047 1,896,606
Funds held by reinsurance companies 2,478,728 2,377,467
Premiums & Consideration Due 1,057,513 1,020,721
Investment income due & accrued 384,281 366,715
Other Assets 1,127,921 1,187,713
Total Assets 51,883,712 48,120,890
Liabilities & Surplus YE 2016 YE 2015
+ Net Policy Reserves 39,392,187 37,056,018
Liabilities for deposit type contracts 1,209,718 406,752
Policy Claims 783,716 708,466
Dividend Reserve ... ...
Interest maintenance reserve 463,529 373,157
Commissions, taxes and expenses 1,172,846 917,394
Asset Valuation Reserve 809,617 798,261
Contingency Reserve ... ...
Other Liabilities 1,879,612 1,771,172
Total Liabilities 45,711,225 42,031,220
YE 2016: + Analysis of reserves; Life $34,093,413; annuities $236,763; supplementary contracts with life contingencies$20,417; accidental death benefits $5,291; disability active lives $129,587; disability disabled lives $344,893; miscellaneousreserves $848,587; accident & health $3,713,234.
YE 2015: + Analysis of reserves; Life $31,986,720; annuities $246,936; supplementary contracts with life contingencies$23,467; accidental death benefits $5,402; disability active lives $122,612; disability disabled lives $364,837; miscellaneousreserves $807,216; accident & health $3,498,828.
Capital & Surplus YE 2016 YE 2015
Surplus Notes 845,429 845,263
Contingency Reserve 3,007 3,007
Unassigned Surplus 5,323,051 5,205,498
Special Reserve 1,000 1,000
Other Surplus ... 34,903
Total Liabilities & Surplus 51,883,712 48,120,890
006508 - Guardian Life Insurance Company of America
Page 27 of 33 Print Date: October 23, 2017
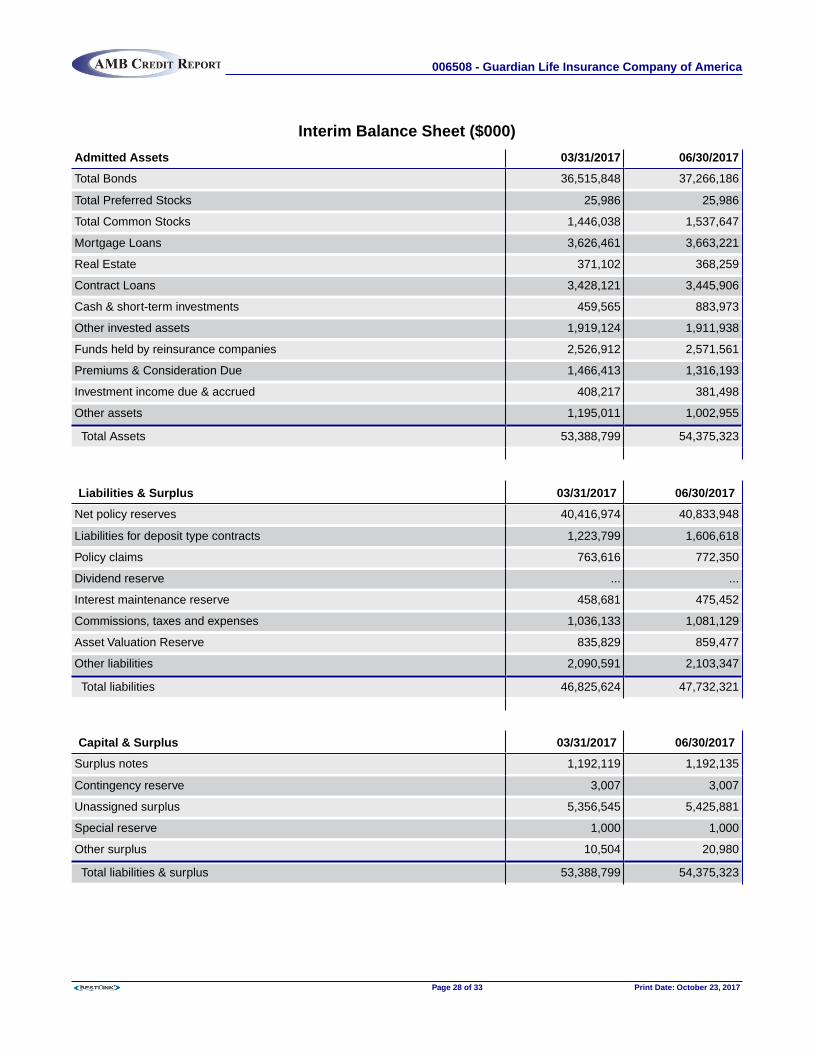
Interim Balance Sheet ($000)
Admitted Assets 03/31/2017 06/30/2017
Total Bonds 36,515,848 37,266,186
Total Preferred Stocks 25,986 25,986
Total Common Stocks 1,446,038 1,537,647
Mortgage Loans 3,626,461 3,663,221
Real Estate 371,102 368,259
Contract Loans 3,428,121 3,445,906
Cash & short-term investments 459,565 883,973
Other invested assets 1,919,124 1,911,938
Funds held by reinsurance companies 2,526,912 2,571,561
Premiums & Consideration Due 1,466,413 1,316,193
Investment income due & accrued 408,217 381,498
Other assets 1,195,011 1,002,955
Total Assets 53,388,799 54,375,323
Liabilities & Surplus 03/31/2017 06/30/2017
Net policy reserves 40,416,974 40,833,948
Liabilities for deposit type contracts 1,223,799 1,606,618
Policy claims 763,616 772,350
Dividend reserve ... ...
Interest maintenance reserve 458,681 475,452
Commissions, taxes and expenses 1,036,133 1,081,129
Asset Valuation Reserve 835,829 859,477
Other liabilities 2,090,591 2,103,347
Total liabilities 46,825,624 47,732,321
Capital & Surplus 03/31/2017 06/30/2017
Surplus notes 1,192,119 1,192,135
Contingency reserve 3,007 3,007
Unassigned surplus 5,356,545 5,425,881
Special reserve 1,000 1,000
Other surplus 10,504 20,980
Total liabilities & surplus 53,388,799 54,375,323
006508 - Guardian Life Insurance Company of America
Page 28 of 33 Print Date: October 23, 2017

Summary Of 2016 Operations ($000)
Income 2016 Disbursements 2016
Premiums: Death benefits 1,022,009
Ordinary life premiums 3,829,389 Claims incurred (PC) ...
Individual annuities premiums 16,396 Matured endowments 1,628
Credit life premiums ... Annuity & old age benefits 5,670
Group life premiums 543,116 Disability & Accident & Health benefits 22,267
Group annuities premiums ... Coupons, annual endowments & similarbenefits
...
Accident & Health group premiums 2,912,433 Surrender benefits 1,140,509
Accident & Health credit premiums ... Group conversion 1,418
Accident & Health other premiums 471,383 Accident & Health benefits 2,101,617
Industrial life premiums ... Interest on contract or deposit-type funds 32,896
Miscellaneous premiums ... Payments on supplemental contracts 2,451
Premiums & annuity considerations ... Accumulated coupon payments ...
Fraternal premiums ... Total benefits recodes 125
Aviation reinsurance premiums ... Increase in life reserves 2,121,762
Deposit type funds ... Increase in accident & health reserves 206,141
Employee benefits plan premiums ... Increase in liabilities for premium depositfunds
...
Deposit administration funds ... Change in reserves ...
Other premiums ... Reserve adjustment on reinsuranceassumed
3,465
Reinsurance premiums ... Other reserves ...
Total net premiums 7,772,716 Claim adjustment (PC only) ...
Supplementary contracts 2,376 Administrative expenses (PC only) ...
Coupon accum interest ... Commissions on premiums & annuityconsiderations
501,390
Net investment income 2,052,329 Commissions & expenses on reinsuranceassumed
214,024
Amortization of Interest MaintenanceReserve
121,995 Other commissions & expenses 5
Net operating gain from separate accounts ... Reinsurance expenses ...
Commissions & expense allowance on reinceded
86,222 Interest expenses 18,629
Reserve adjustment on reinsurance ceded ... Insurance taxes, licenses & fees 236,791
Reinsurance income 58,829 General insurance expenses 1,257,372
Other income 150,554 Net transfer to separate accounts ...
Difference between net earned & net written(PC only)
... Other expenses 764
Management and/or service fees 1,251 Miscellaneous operating expenses ...
Other disbursements ...
Total operating income 10,246,272 Total disbursements 8,890,932
006508 - Guardian Life Insurance Company of America
Page 29 of 33 Print Date: October 23, 2017
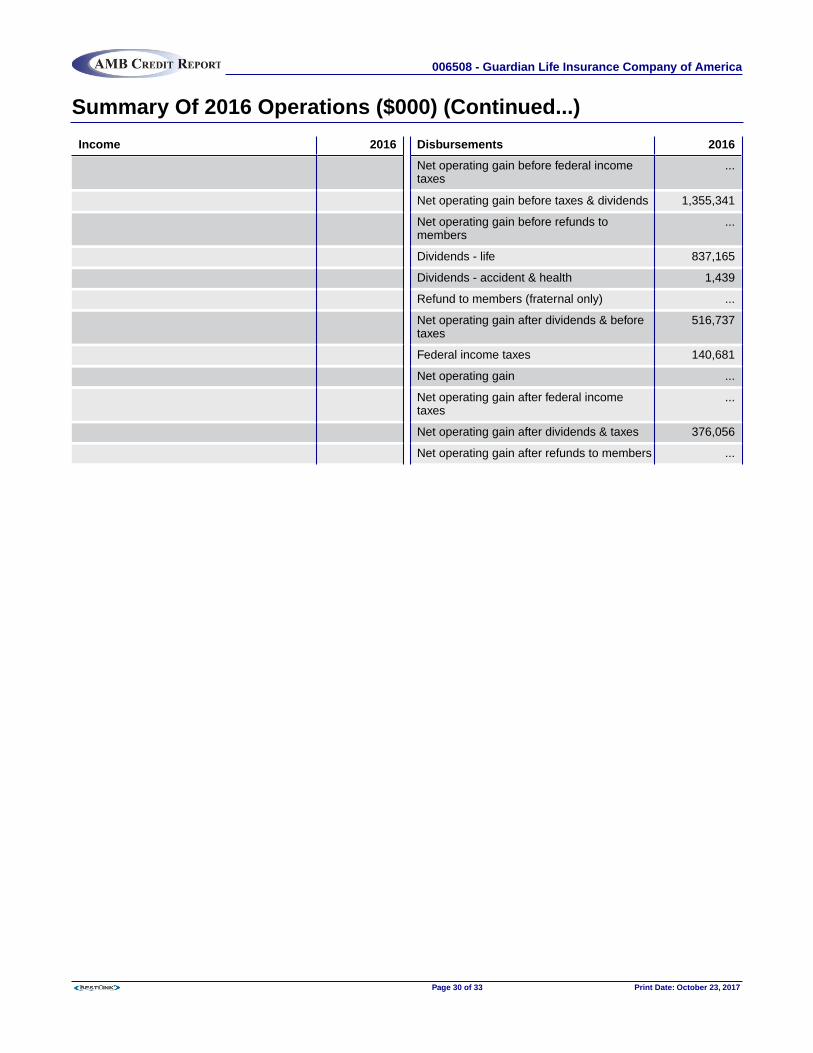
Summary Of 2016 Operations ($000) (Continued...)
Income 2016 Disbursements 2016
Net operating gain before federal incometaxes
...
Net operating gain before taxes & dividends 1,355,341
Net operating gain before refunds tomembers
...
Dividends - life 837,165
Dividends - accident & health 1,439
Refund to members (fraternal only) ...
Net operating gain after dividends & beforetaxes
516,737
Federal income taxes 140,681
Net operating gain ...
Net operating gain after federal incometaxes
...
Net operating gain after dividends & taxes 376,056
Net operating gain after refunds to members ...
006508 - Guardian Life Insurance Company of America
Page 30 of 33 Print Date: October 23, 2017
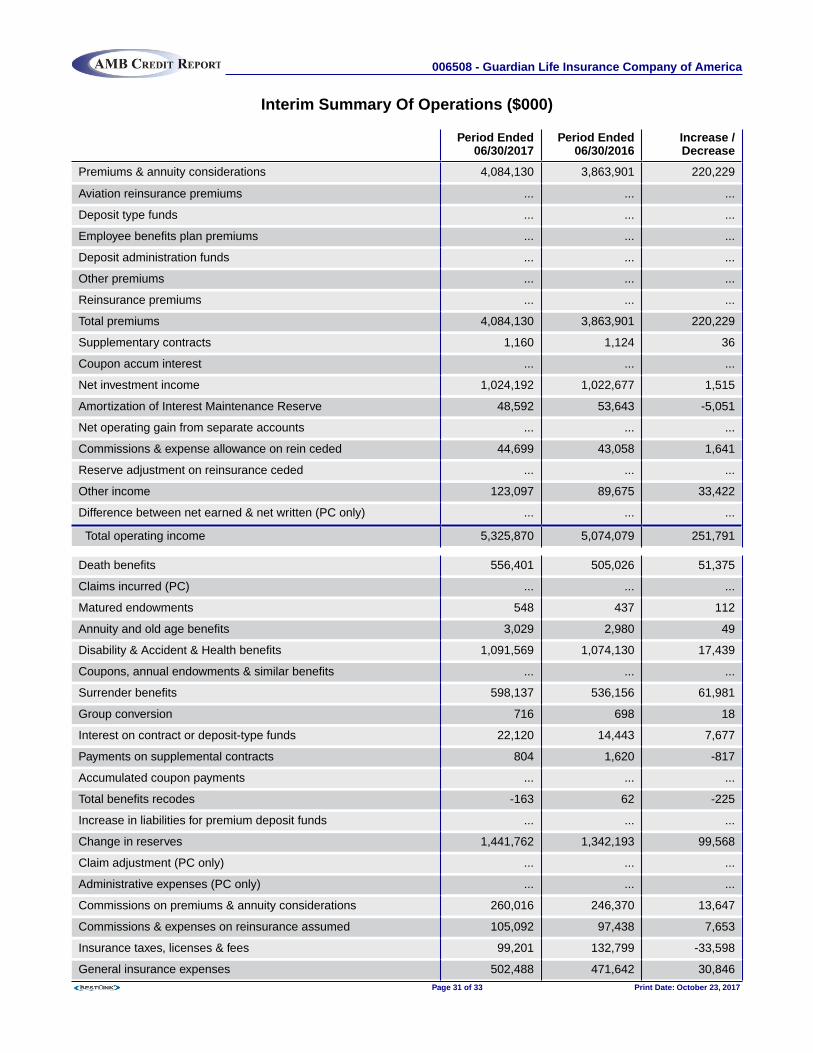
Interim Summary Of Operations ($000)
Period Ended06/30/2017
Period Ended06/30/2016
Increase /Decrease
Premiums & annuity considerations 4,084,130 3,863,901 220,229
Aviation reinsurance premiums ... ... ...
Deposit type funds ... ... ...
Employee benefits plan premiums ... ... ...
Deposit administration funds ... ... ...
Other premiums ... ... ...
Reinsurance premiums ... ... ...
Total premiums 4,084,130 3,863,901 220,229
Supplementary contracts 1,160 1,124 36
Coupon accum interest ... ... ...
Net investment income 1,024,192 1,022,677 1,515
Amortization of Interest Maintenance Reserve 48,592 53,643 -5,051
Net operating gain from separate accounts ... ... ...
Commissions & expense allowance on rein ceded 44,699 43,058 1,641
Reserve adjustment on reinsurance ceded ... ... ...
Other income 123,097 89,675 33,422
Difference between net earned & net written (PC only) ... ... ...
Total operating income 5,325,870 5,074,079 251,791
Death benefits 556,401 505,026 51,375
Claims incurred (PC) ... ... ...
Matured endowments 548 437 112
Annuity and old age benefits 3,029 2,980 49
Disability & Accident & Health benefits 1,091,569 1,074,130 17,439
Coupons, annual endowments & similar benefits ... ... ...
Surrender benefits 598,137 536,156 61,981
Group conversion 716 698 18
Interest on contract or deposit-type funds 22,120 14,443 7,677
Payments on supplemental contracts 804 1,620 -817
Accumulated coupon payments ... ... ...
Total benefits recodes -163 62 -225
Increase in liabilities for premium deposit funds ... ... ...
Change in reserves 1,441,762 1,342,193 99,568
Claim adjustment (PC only) ... ... ...
Administrative expenses (PC only) ... ... ...
Commissions on premiums & annuity considerations 260,016 246,370 13,647
Commissions & expenses on reinsurance assumed 105,092 97,438 7,653
Insurance taxes, licenses & fees 99,201 132,799 -33,598
General insurance expenses 502,488 471,642 30,846
006508 - Guardian Life Insurance Company of America
Page 31 of 33 Print Date: October 23, 2017
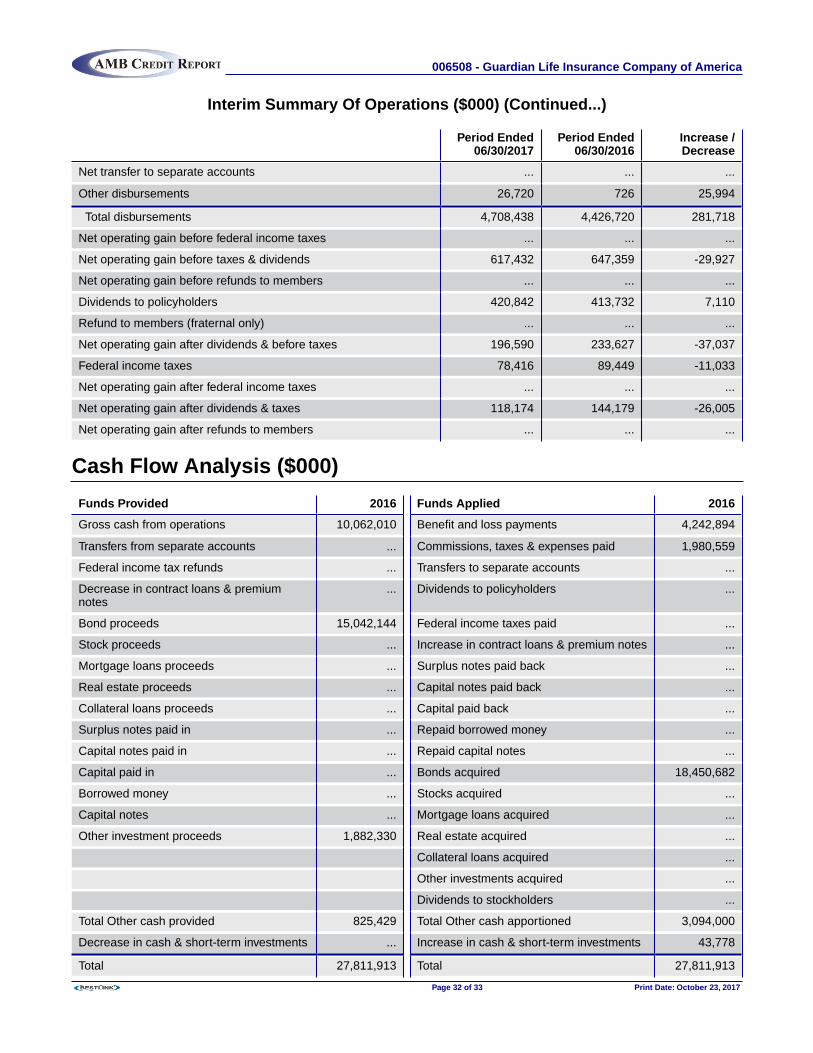
Interim Summary Of Operations ($000) (Continued...)
Period Ended06/30/2017
Period Ended06/30/2016
Increase /Decrease
Net transfer to separate accounts ... ... ...
Other disbursements 26,720 726 25,994
Total disbursements 4,708,438 4,426,720 281,718
Net operating gain before federal income taxes ... ... ...
Net operating gain before taxes & dividends 617,432 647,359 -29,927
Net operating gain before refunds to members ... ... ...
Dividends to policyholders 420,842 413,732 7,110
Refund to members (fraternal only) ... ... ...
Net operating gain after dividends & before taxes 196,590 233,627 -37,037
Federal income taxes 78,416 89,449 -11,033
Net operating gain after federal income taxes ... ... ...
Net operating gain after dividends & taxes 118,174 144,179 -26,005
Net operating gain after refunds to members ... ... ...
Cash Flow Analysis ($000)
Funds Provided 2016 Funds Applied 2016
Gross cash from operations 10,062,010 Benefit and loss payments 4,242,894
Transfers from separate accounts ... Commissions, taxes & expenses paid 1,980,559
Federal income tax refunds ... Transfers to separate accounts ...
Decrease in contract loans & premiumnotes
... Dividends to policyholders ...
Bond proceeds 15,042,144 Federal income taxes paid ...
Stock proceeds ... Increase in contract loans & premium notes ...
Mortgage loans proceeds ... Surplus notes paid back ...
Real estate proceeds ... Capital notes paid back ...
Collateral loans proceeds ... Capital paid back ...
Surplus notes paid in ... Repaid borrowed money ...
Capital notes paid in ... Repaid capital notes ...
Capital paid in ... Bonds acquired 18,450,682
Borrowed money ... Stocks acquired ...
Capital notes ... Mortgage loans acquired ...
Other investment proceeds 1,882,330 Real estate acquired ...
Collateral loans acquired ...
Other investments acquired ...
Dividends to stockholders ...
Total Other cash provided 825,429 Total Other cash apportioned 3,094,000
Decrease in cash & short-term investments ... Increase in cash & short-term investments 43,778
Total 27,811,913 Total 27,811,913
006508 - Guardian Life Insurance Company of America
Page 32 of 33 Print Date: October 23, 2017

A Best's Financial Strength Rating opinion addresses the relative ability of an insurer to meet its ongoing insurance obligations. The ratings are not assigned to specific insurance policies orcontracts and do not address any other risk, including, but not limited to, an insurer's claims-payment policies or procedures; the ability of the insurer to dispute or deny claims payment ongrounds of misrepresentation or fraud; or any specific liability contractually borne by the policy or contract holder. A Financial Strength Rating is not a recommendation to purchase, hold orterminate any insurance policy, contract or any other financial obligation issued by an insurer, nor does it address the suitability of any particular policy or contract for a specific purpose orpurchaser.
A Best's Issue/Issuer Credit Rating is an opinion regarding the relative future credit risk of an entity, a credit commitment or a debt or debt-like security.
Credit risk is the risk that an entity may not meet its contractual, financial obligations as they come due. These credit ratings do not address any other risk, including but not limited to liquidityrisk, market value risk or price volatility of rated securities. The rating is not a recommendation to buy, sell or hold any securities, insurance policies, contracts or any other financialobligations, nor does it address the suitability of any particular financial obligation for a specific purpose or purchaser.
In arriving at a rating decision, A.M. Best relies on third-party audited financial data and/or other information provided to it. While this information is believed to be reliable, A.M. Best does notindependently verify the accuracy or reliability of the information. Any and all ratings, opinions and information contained herein are provided "as is," without any express or implied warranty.
Visit http://www.ambest.com/ratings/notice.asp for additional information or http://www.ambest.com/terms.html for details on the Terms of Use.
Copyright © 2017 A.M. Best Company, Inc. and/or its affiliates. All rights reserved.
No part of this report may be reproduced, distributed, or stored in a database or retrieval system, or transmitted in any form or by any means without the prior written permission of the A.M.Best Company. While the data in this report was obtained from sources believed to be reliable, its accuracy is not guaranteed.
006508 - Guardian Life Insurance Company of America
Page 33 of 33 Print Date: October 23, 2017