00012_am.ppt 1 An Assessment of the Accutane (Isotretinoin) Pregnancy Prevention Program Allen A....
108
1 00012_am.ppt An Assessment of the An Assessment of the Accutane (Isotretinoin) Accutane (Isotretinoin) Pregnancy Prevention Program Pregnancy Prevention Program Allen A. Mitchell, M.D. Carla Van Bennekom, R.N., M.P.H. Carol Louik, Sc.D. Slone Epidemiology Unit Boston University School of Public Health
-
Upload
michael-hensley -
Category
Documents
-
view
217 -
download
0
Transcript of 00012_am.ppt 1 An Assessment of the Accutane (Isotretinoin) Pregnancy Prevention Program Allen A....

100012_am.ppt
An Assessment of theAn Assessment of theAccutane (Isotretinoin)Accutane (Isotretinoin)
Pregnancy Prevention ProgramPregnancy Prevention Program
Allen A. Mitchell, M.D.
Carla Van Bennekom, R.N., M.P.H.
Carol Louik, Sc.D.
Slone Epidemiology Unit
Boston University School of Public Health

200012_am.ppt
Pregnancy Prevention Program (PPP):Pregnancy Prevention Program (PPP):
– Introduced in fall, 1988
– Multi-component program
– Aimed at female patients and their physicians
– Unprecedented and novel approach

300012_am.ppt
Does the PPP work?Does the PPP work?
400012_am.ppt
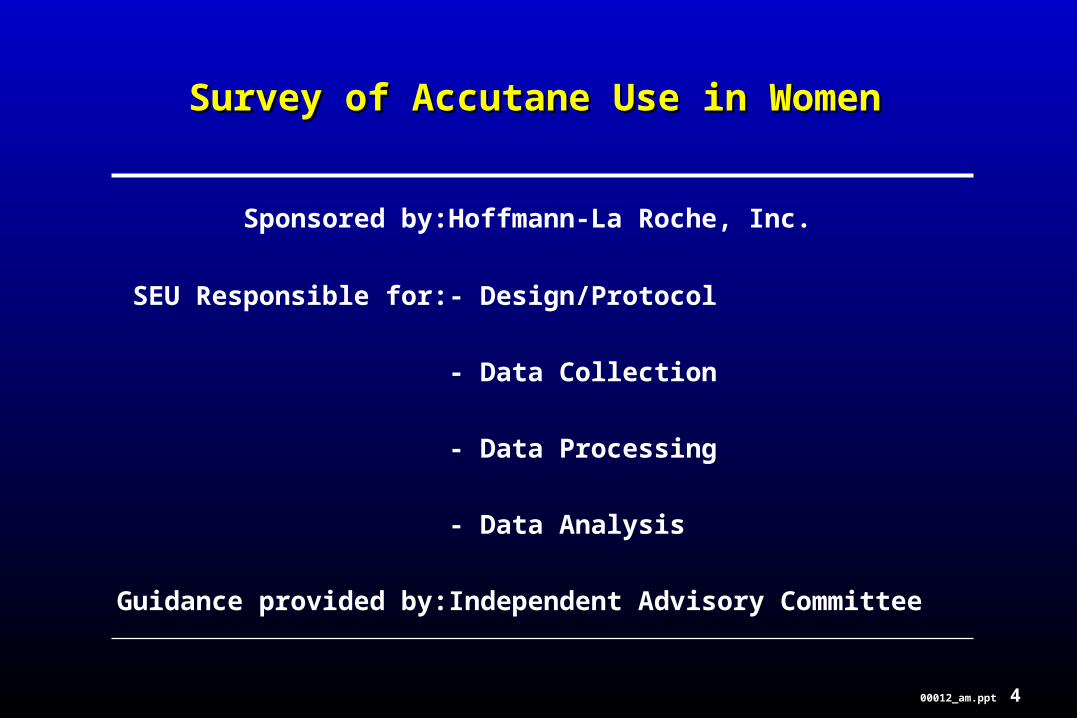
Survey of Accutane Use in WomenSurvey of Accutane Use in Women
Sponsored by: Hoffmann-La Roche, Inc.
SEU Responsible for: - Design/Protocol
- Data Collection
- Data Processing
- Data Analysis
Guidance provided by: Independent Advisory Committee

500012_am.ppt
Slone Epidemiology UnitSlone Epidemiology UnitAccutane Survey Advisory CommitteeAccutane Survey Advisory Committee
1988 - 20001988 - 2000
Paul D. Stolley, M.D., Chair*University of Maryland School of MedicineBaltimore, MD
Edward L. Decker, Pharm.D.New England Medical CenterBoston, MA
Karen McKoy, M.D.Lahey ClinicBurlington, MA
Observers:
Charlotte Catz, M.D., NICHD
John Melski, M.D.Marshfield ClinicMarshfield, WI
Peter Pochi, M.D.Boston University School of MedicineBoston, MA
Robert S. Stern, M.D.Harvard Medical SchoolBoston, MA
José F. Corderó, M.D., CDC
*Dr. Stolley resigned as Committee Chair on July 19, 2000 because he has joined the FDA as a Senior Consultant.

600012_am.ppt
ObjectivesObjectives
To assess compliance with the Pregnancy Prevention Program
• Awareness of the teratogenic risk
• Patient and physician behaviors
• Pregnancy rate
• Pregnancy outcome
• Risk factors for pregnancy

700012_am.ppt
LimitationsLimitations
• No pilot testing
• No pre/post comparison
• What is “success”?
• Survey itself is an intervention
• Voluntary enrollment/? representativeness

800012_am.ppt
Accutane SurveyAccutane Survey
Design

900012_am.ppt
Accutane SurveyAccutane Survey
TIME PERIOD OF INTERESTTIME PERIOD OF INTEREST
(Duration of Follow-up)(Duration of Follow-up)
Accutane Treatment Potential Pregnancy (2 Trimesters)
0 1 2 3 4 5 6 7 8 9 10 11MONTHS

1000012_am.ppt
To Encourage EnrollmentTo Encourage Enrollment
• Multiple/different opportunities
• Keep it simple
• Provide payment
1100012_am.ppt
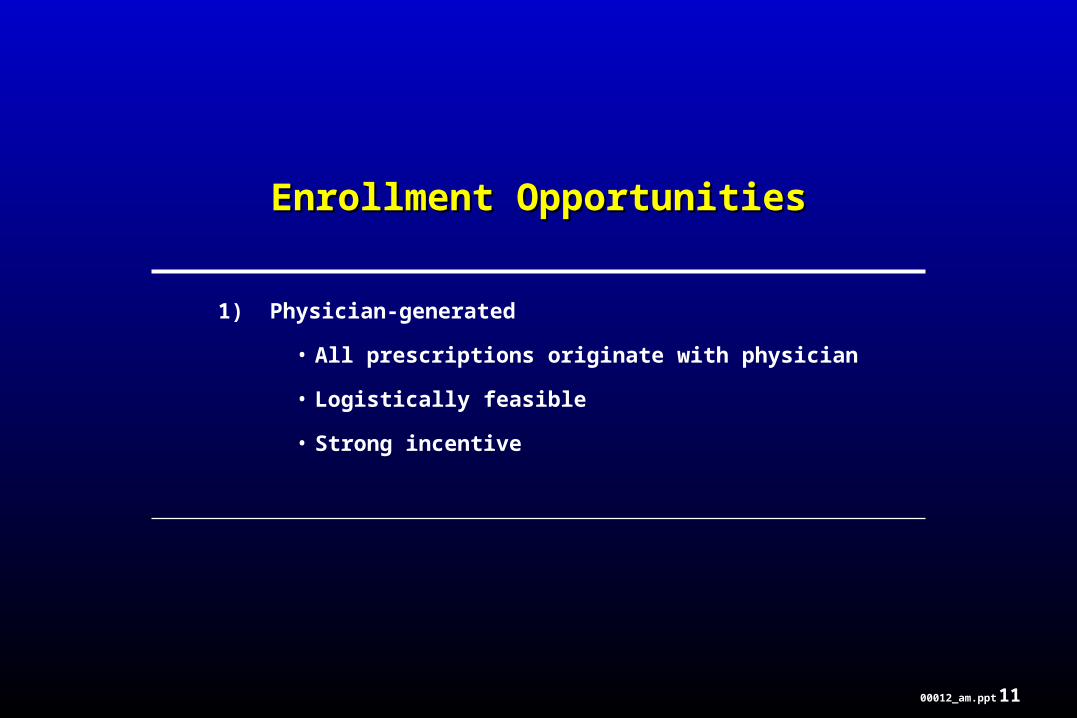
Enrollment OpportunitiesEnrollment Opportunities
1) Physician-generated
• All prescriptions originate with physician
• Logistically feasible
• Strong incentive

1200012_am.ppt
Enrollment OpportunitiesEnrollment Opportunities
2) Toll-free telephone call
• Simple
• Quick
• Familiar

1300012_am.ppt
Enrollment OpportunitiesEnrollment Opportunities
3) Package-generated
• Unique
• Direct to patient
• Bypasses physician
• May preferentially target women who
– were not encouraged by their physician
– may be relatively noncompliant
– are attracted by payment
1400012_am.ppt
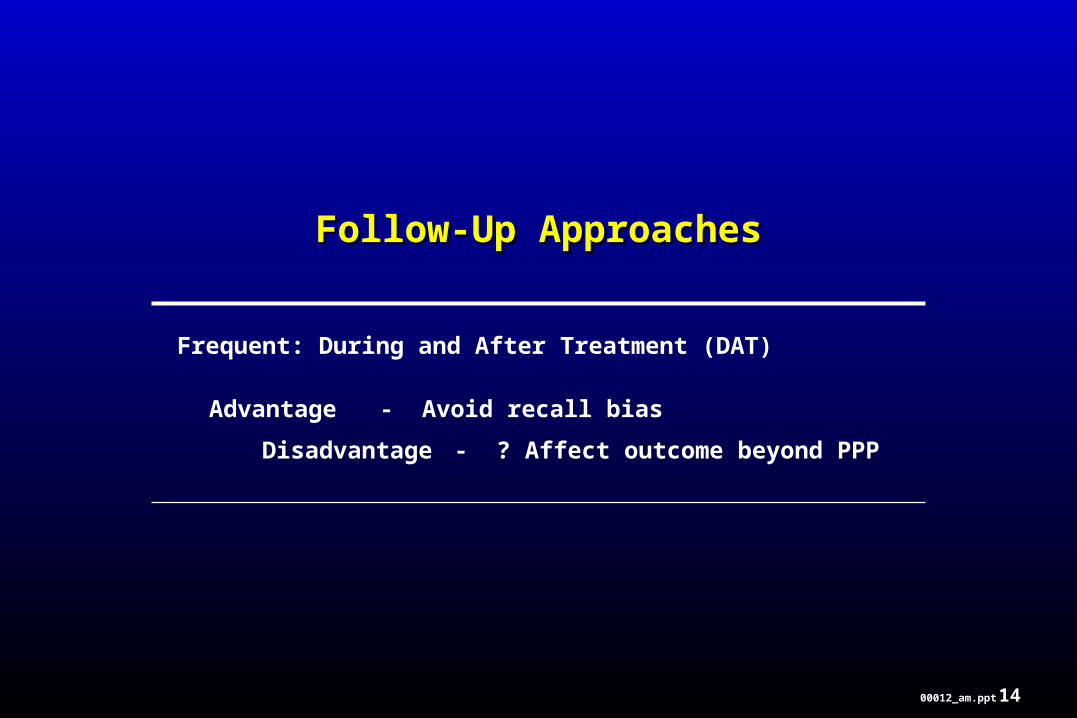
Follow-Up ApproachesFollow-Up Approaches
Frequent: During and After Treatment (DAT)
Advantage - Avoid recall bias
Disadvantage - ? Affect outcome beyond PPP

1500012_am.ppt
Follow-Up ApproachesFollow-Up Approaches
Infrequent: After Treatment only (AT)
Advantage - Avoids intervention beyond PPP
Disadvantage - Potential recall bias
1600012_am.ppt

1700012_am.ppt
Information Obtained at Follow-UpInformation Obtained at Follow-Up
DAT AT
Patient characteristics
Education + -
Doctor specialty + -
Pregnancy risk + -
Patient knowledge
Risk of birth defects + +
Avoid pregnancy + -
Compliance
Pregnancy testing + +
Contraception + +
Wait for next menstrual period + -
Pregnancy occurrence + +

1800012_am.ppt
Accutane SurveyAccutane Survey
Results
1900012_am.ppt
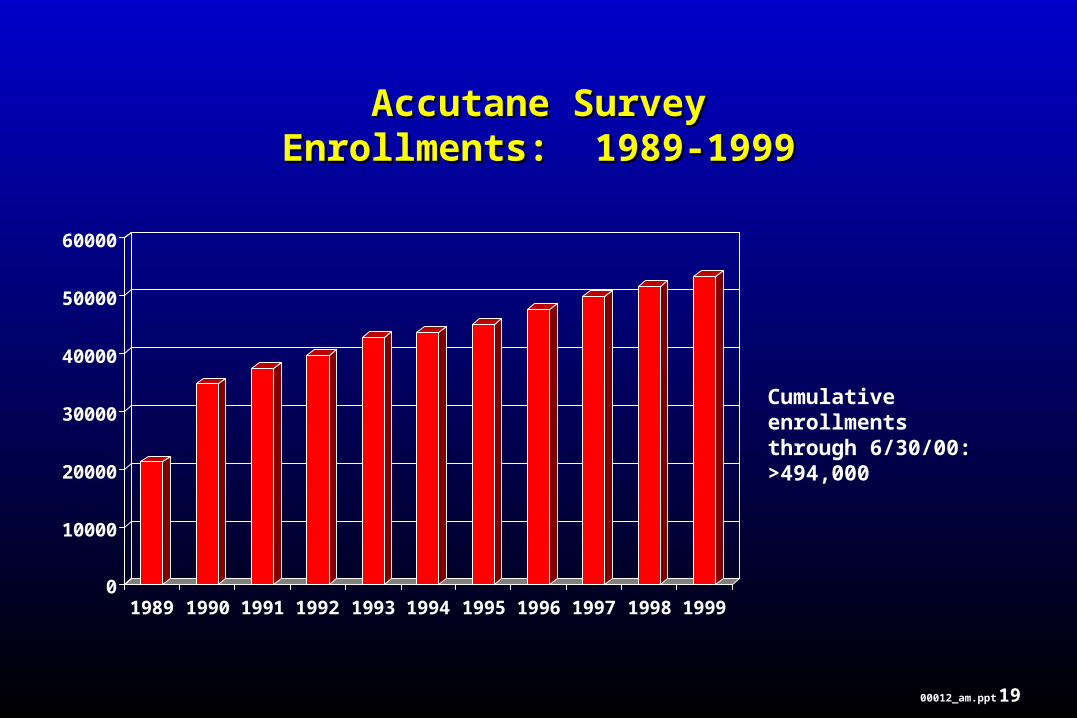
Accutane SurveyAccutane SurveyEnrollments: 1989-1999Enrollments: 1989-1999
0
10000
20000
30000
40000
50000
60000
1989 1990 1991 1992 1993 1994 1995 1996 1997 1998 1999
Cumulative enrollmentsthrough 6/30/00: >494,000

2000012_am.ppt
Method of EnrollmentMethod of Enrollment
21%
76%
3%
Doctor-generated
Package-generated
Toll-free phone no.

2100012_am.ppt
Follow-Up RatesFollow-Up Rates
During and After Treatment (“DAT”)
Number to date (6/00): 61,659
1/89 - 12/94 (telephone) 32,301
Completed Follow-Up: Tx start 98%
Tx middle 98%
6 mos.p Tx 93%

2200012_am.ppt
Follow-Up RatesFollow-Up Rates
During and After Treatment (“DAT”)
1/95 - 6/00 (mail) 29,358
Completed Follow-Up: Tx start 98%
Tx middle 98%
6 mos.p Tx 97%

2300012_am.ppt
Follow-Up RatesFollow-Up Rates
After Treatment (“AT”)
Number to date (6/00): 433,256
Completed Follow-Up: 6 mos.p Tx 80-86%

2400012_am.ppt
Accutane SurveyAccutane Survey
Results:
Demographics
2500012_am.ppt
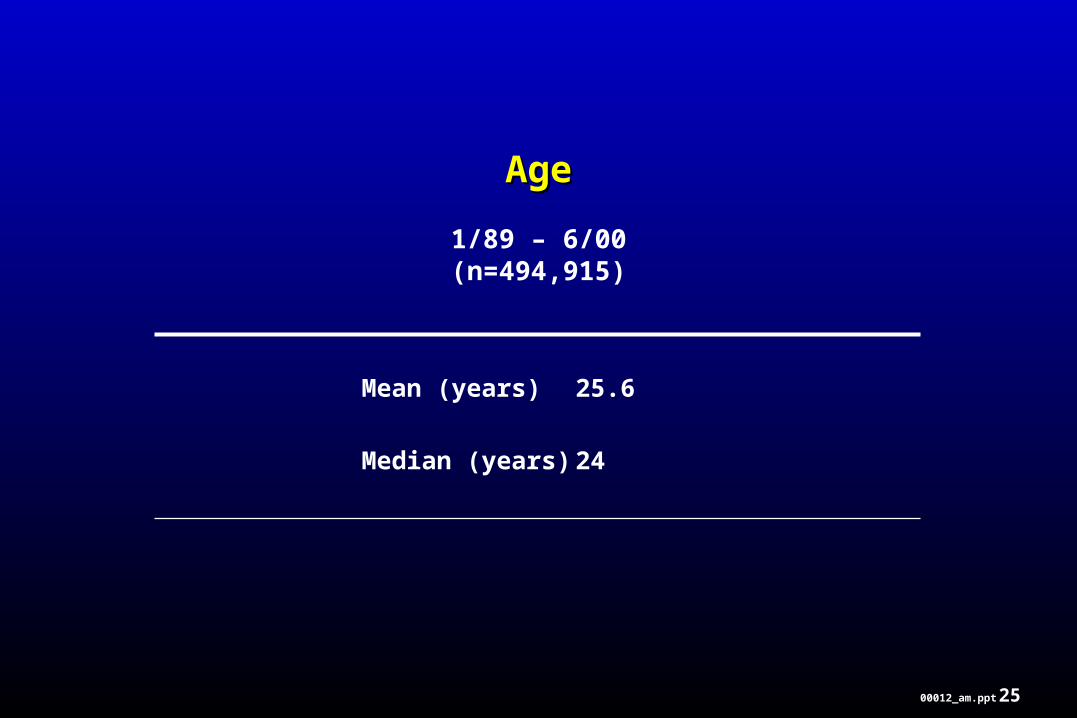
AgeAge
1/89 – 6/00(n=494,915)
Mean (years) 25.6
Median (years) 24
2600012_am.ppt
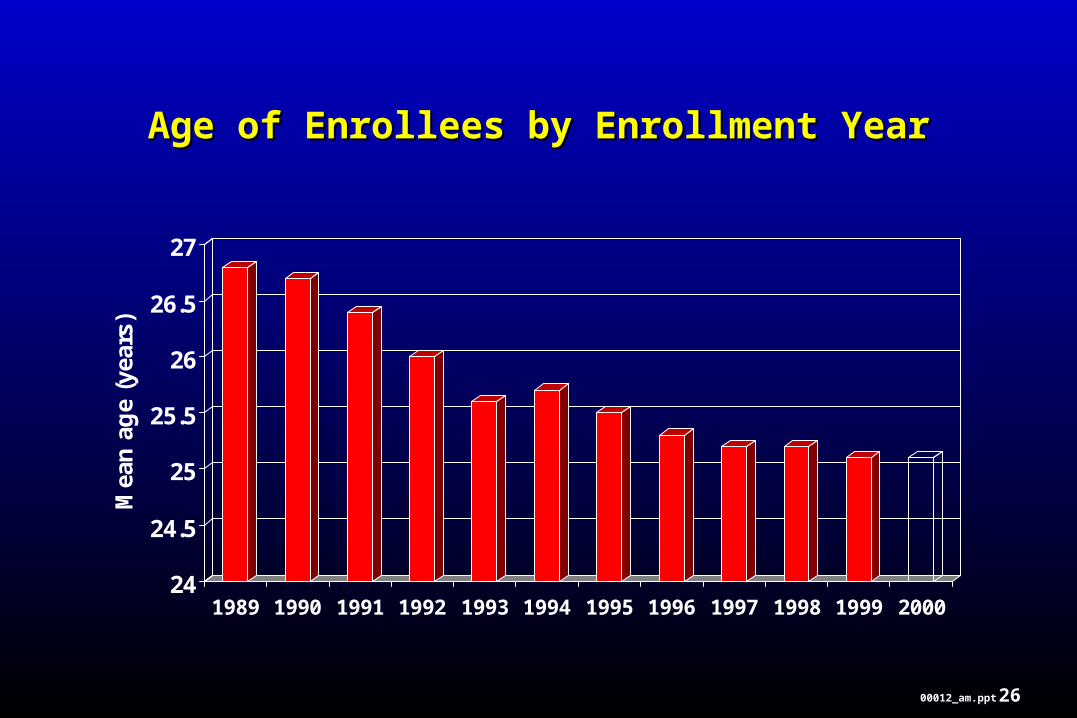
Age of Enrollees by Enrollment YearAge of Enrollees by Enrollment Year
24
24.5
25
25.5
26
26.5
27
Mea
n a
ge
(yea
rs)
1989 1990 1991 1992 1993 1994 1995 1996 1997 1998 1999 2000

2700012_am.ppt
Highest Level of EducationHighest Level of Education
0
5
10
15
20
25
30
35
%
<12 years High schoolgraduate
Some college ortechnical school
Collegegraduate
2800012_am.ppt
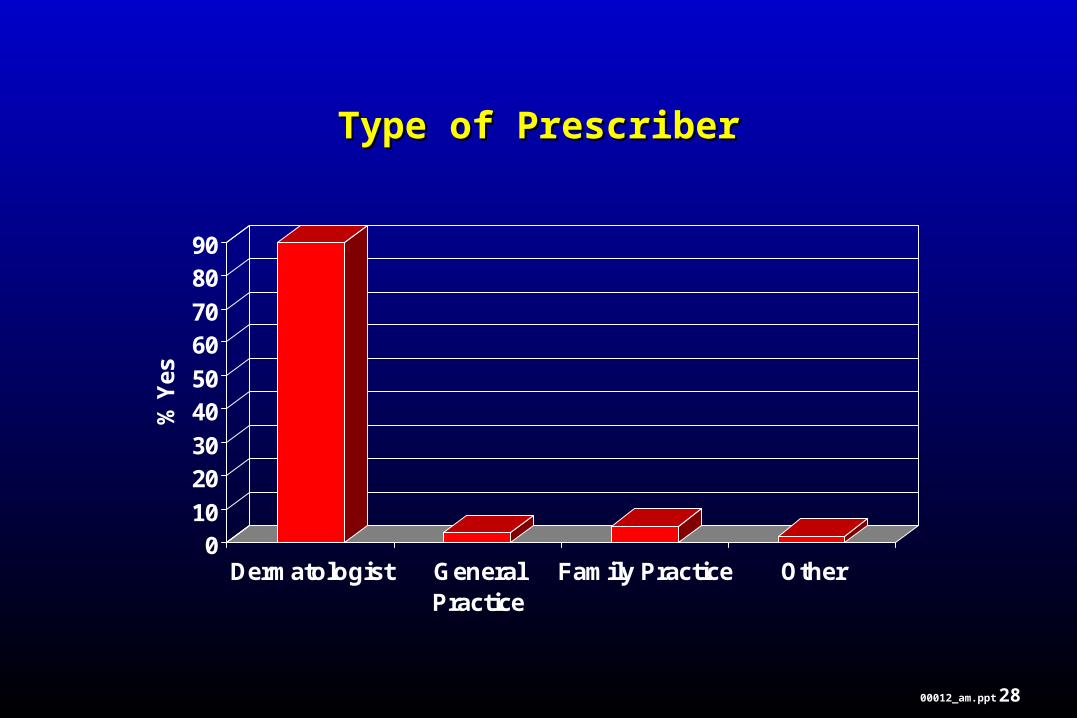
Type of PrescriberType of Prescriber
010
2030
4050
6070
8090
% Y
es
Dermatologist GeneralPractice
Family Practice Other

2900012_am.ppt
Past Treatment for AcnePast Treatment for Acne
0102030405060708090
100
% Y
es
Any antibiotics Oral vitamin A Retin-A BenzoylPeroxide
3000012_am.ppt
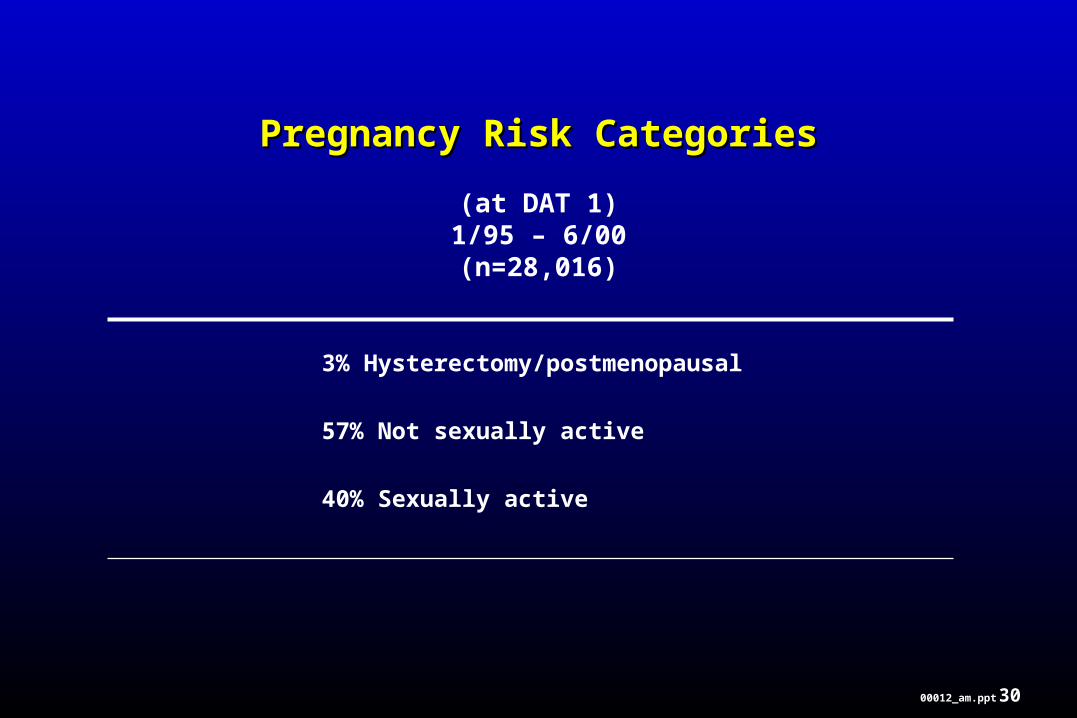
Pregnancy Risk CategoriesPregnancy Risk Categories
(at DAT 1)1/95 – 6/00(n=28,016)
3% Hysterectomy/postmenopausal
57% Not sexually active
40% Sexually active
3100012_am.ppt
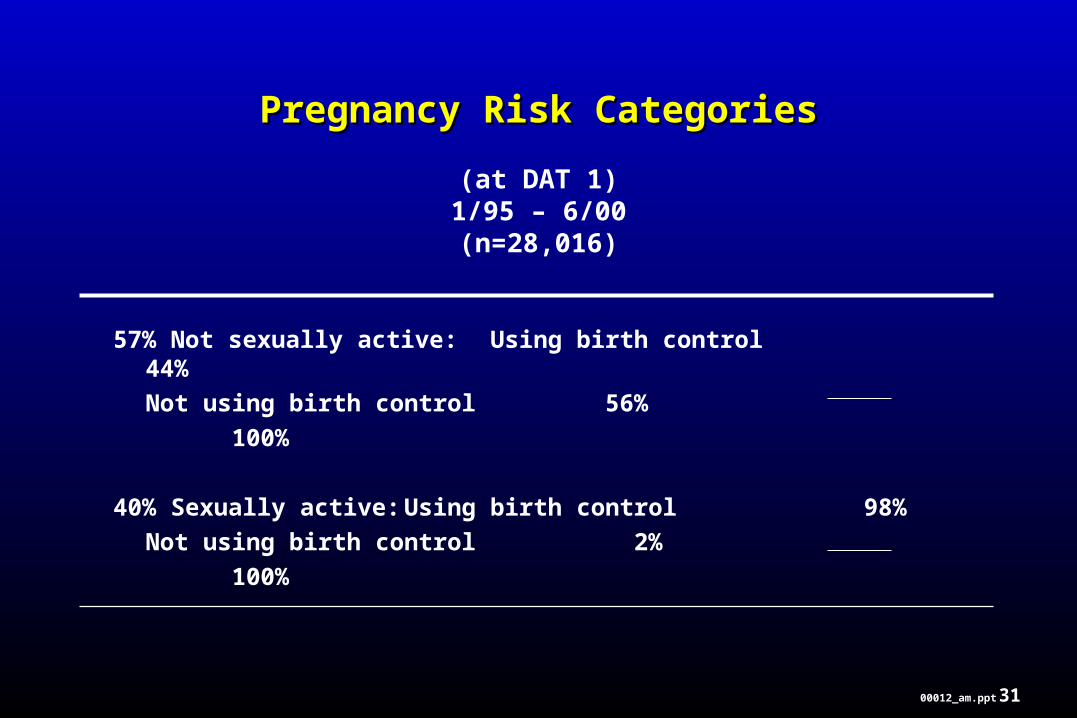
Pregnancy Risk CategoriesPregnancy Risk Categories
(at DAT 1)1/95 – 6/00(n=28,016)
57% Not sexually active: Using birth control 44%
Not using birth control 56%
100%
40% Sexually active: Using birth control 98%
Not using birth control 2%
100%

3200012_am.ppt
Accutane SurveyAccutane Survey
Results:
Women’s Knowledge

3300012_am.ppt
Receipt of PPP InformationReceipt of PPP Information
1/95 – 6/00(n=28,386)
Patient brochure 92%
True/false test 42%
Birth Control brochure 53%
3400012_am.ppt
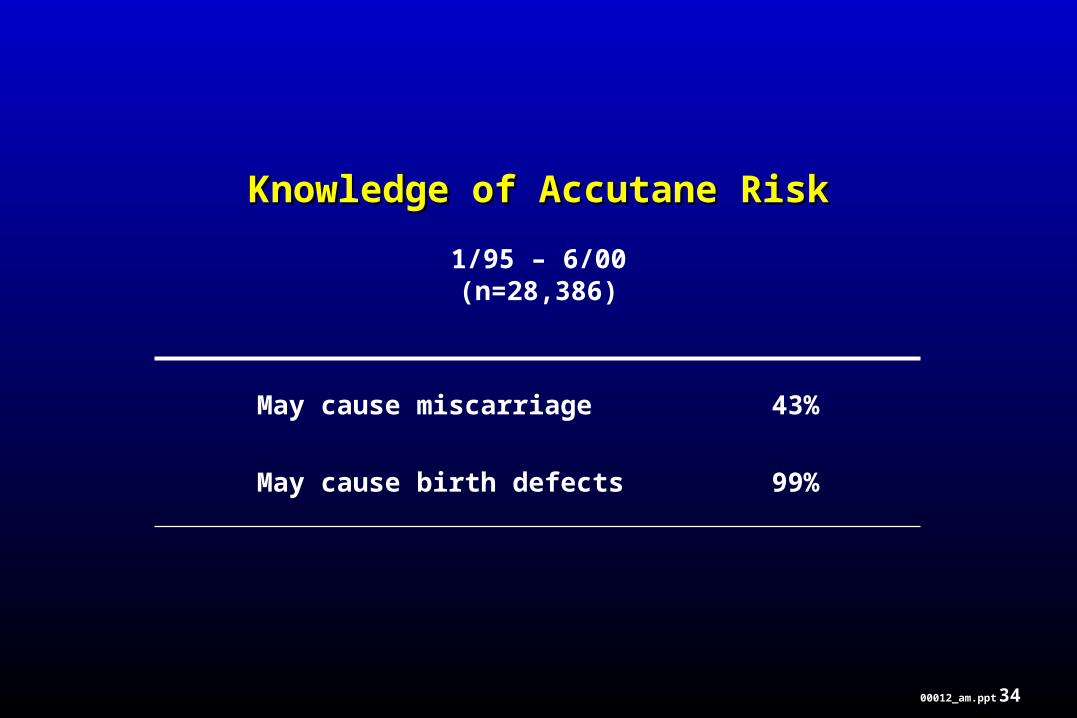
Knowledge of Accutane RiskKnowledge of Accutane Risk
1/95 – 6/00(n=28,386)
May cause miscarriage 43%
May cause birth defects 99%
3500012_am.ppt
Accutane SurveyAccutane Survey
Results:
Compliance

3600012_am.ppt
Compliance with PPP – ICompliance with PPP – I
1/95 – 6/00(n=28,386)
Told to avoid pregnancy 99%
Signed consent form77%
Postpone Accutane until pregnancy test 67%
Postpone Accutane until next menstrual period 57%

3700012_am.ppt
Compliance with Selected Measures of the PPPCompliance with Selected Measures of the PPP
0
10
20
30
40
50
60
70
80
90
100
% Y
es
1995 1996 1997 1998 1999 2000
Told to avoid pregnancy
Signed consent form
Postponed Accutane untilresults of pregnancy test known
Postponed Accutane until nextmentrual period
n=5,108 n=5,157 n=5,206 n=5,047 n=5,283 n=2,585
3800012_am.ppt
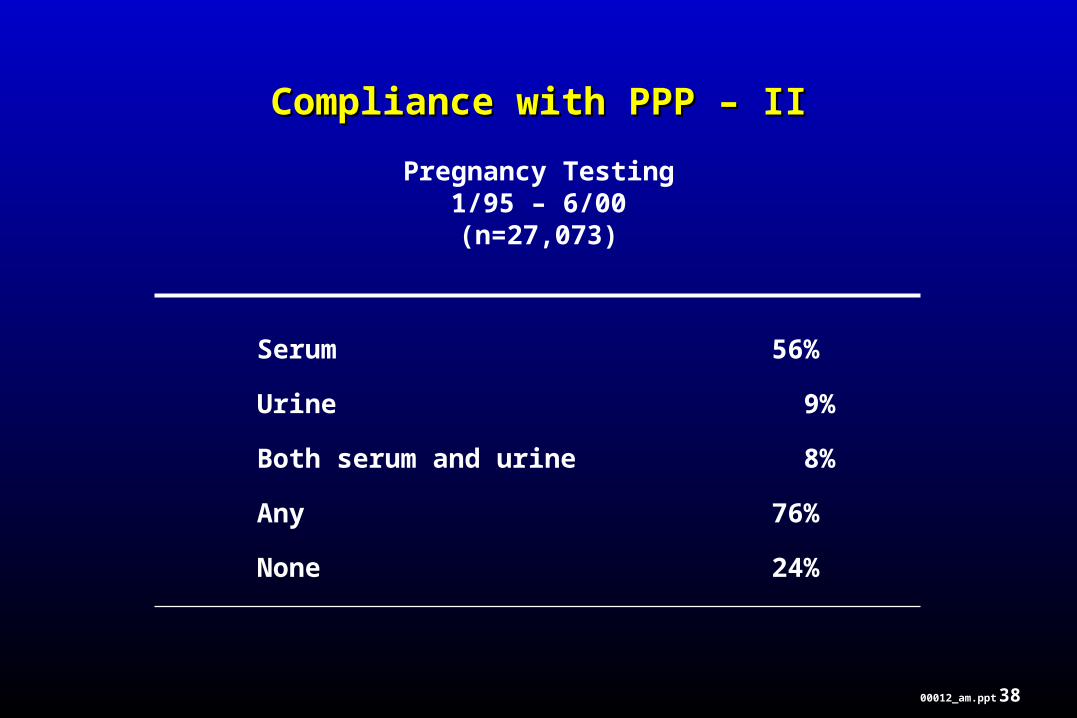
Compliance with PPP – IICompliance with PPP – II
Pregnancy Testing1/95 – 6/00(n=27,073)
Serum 56%
Urine 9%
Both serum and urine 8%
Any 76%
None 24%

3900012_am.ppt
Pregnancy Testing Before Starting Accutane by Pregnancy Testing Before Starting Accutane by Enrollment YearEnrollment Year
0
10
20
30
40
50
60
70
80
%
1995 1996 1997 1998 1999 2000
Any pregnancy test
No pregnancy test
n=5,108 n=5,157 n=5,206 n=5,047 n=5,283 n=2,585
4000012_am.ppt
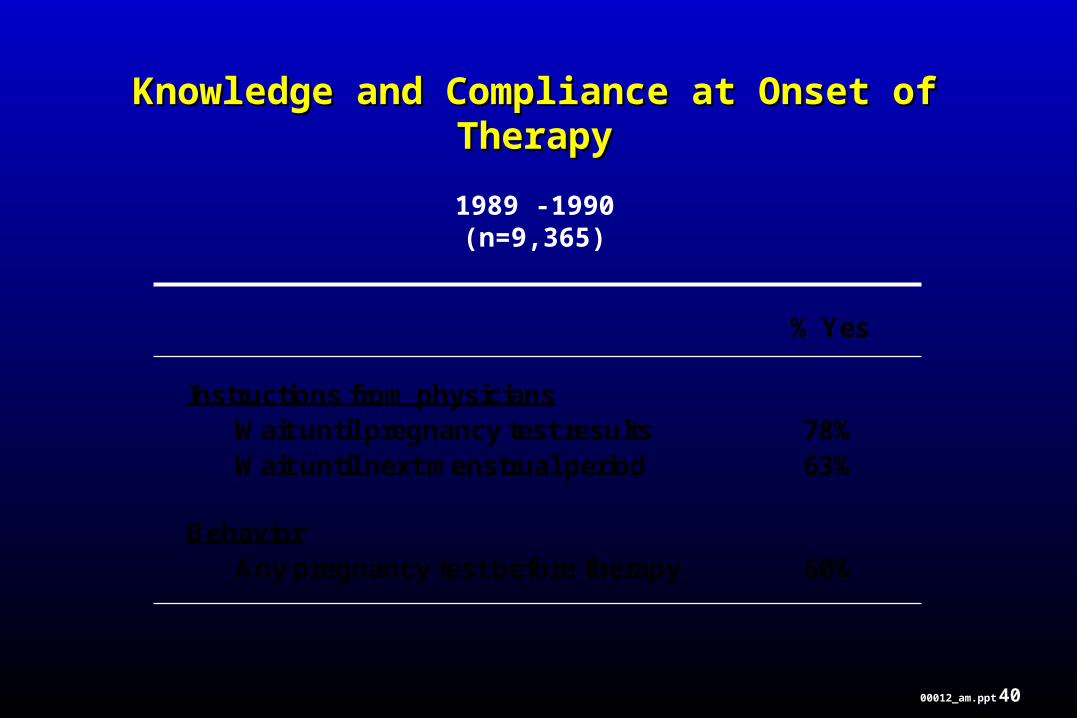
Knowledge and Compliance at Onset of TherapyKnowledge and Compliance at Onset of Therapy
1989 -1990(n=9,365)
% Yes Instructions from physicians Wait until pregnancy test results 78% Wait until next menstrual period 63% Behavior Any pregnancy test before therapy 60%

4100012_am.ppt
Original Medication PackageOriginal Medication Package

4200012_am.ppt
Revised Medication PackageRevised Medication Package
4300012_am.ppt
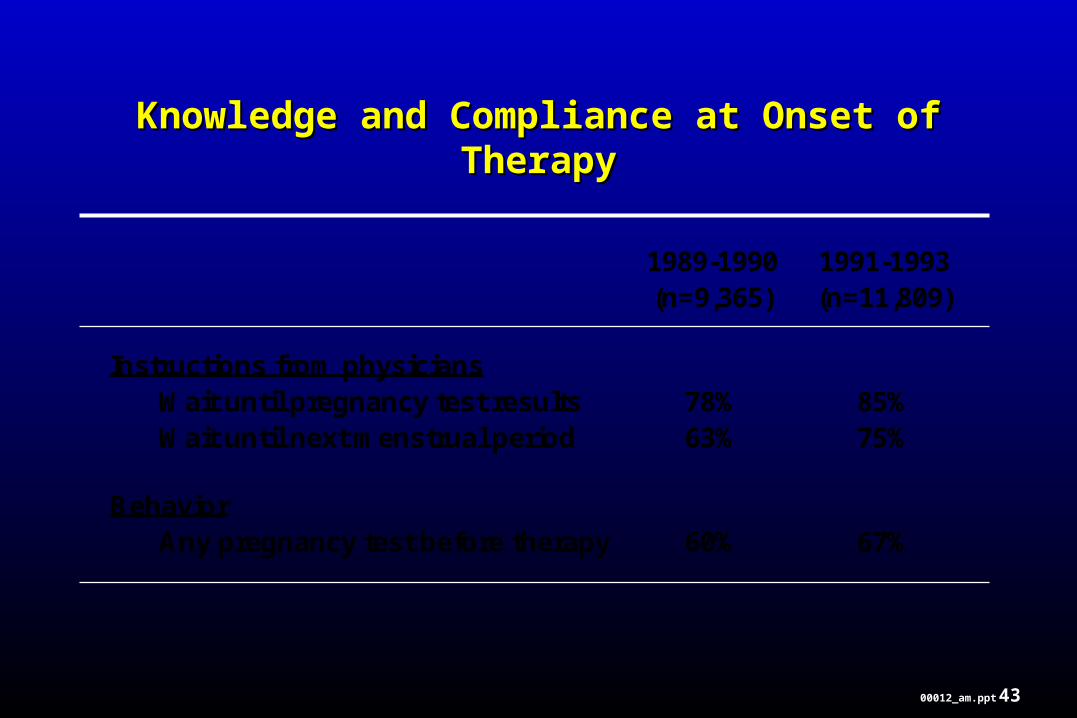
Knowledge and Compliance at Onset of TherapyKnowledge and Compliance at Onset of Therapy
1989-1990 1991-1993 (n=9,365) (n=11,809) Instructions from physicians Wait until pregnancy test results 78% 85% Wait until next menstrual period 63% 75% Behavior Any pregnancy test before therapy 60% 67%

4400012_am.ppt
Compliance with PPP - IIICompliance with PPP - III
Contraceptive Status, By Age

4500012_am.ppt
Contraceptive StatusContraceptive StatusNoncontraceptors by Age GroupNoncontraceptors by Age Group
0
10
20
30
40
50
60
70
80
%
<15years
15-24years
25-34years
35-44years
45+years
Sexually active
Not sexually active
4600012_am.ppt
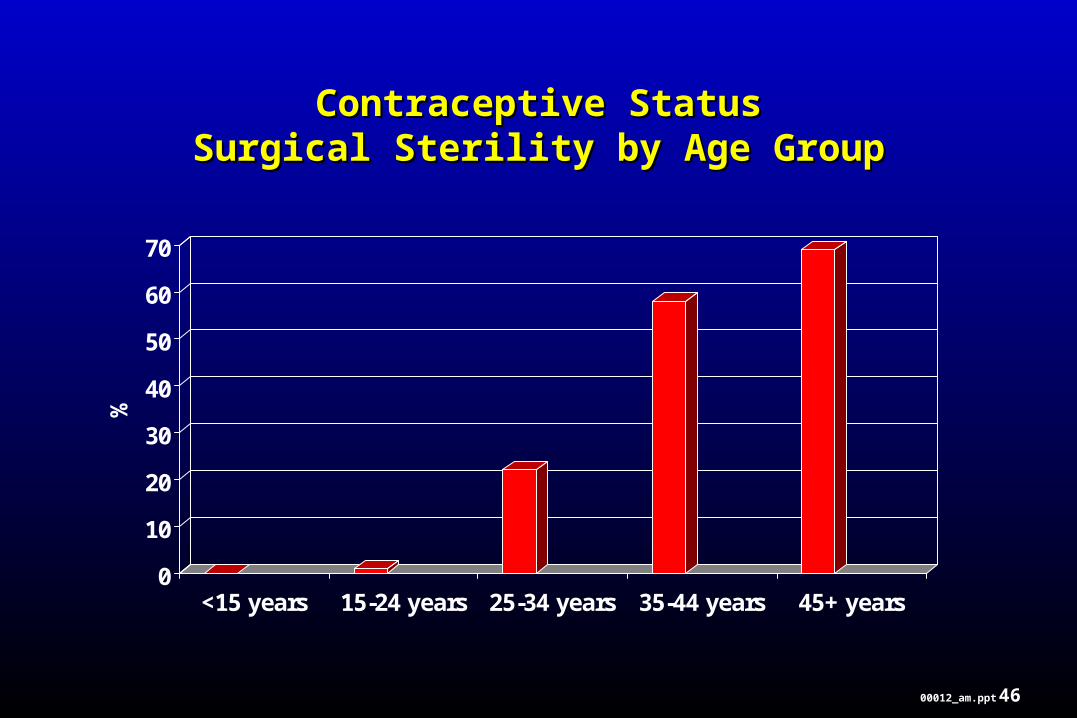
Contraceptive StatusContraceptive StatusSurgical Sterility by Age GroupSurgical Sterility by Age Group
0
10
20
30
40
50
60
70
%
<15 years 15-24 years 25-34 years 35-44 years 45+ years
4700012_am.ppt
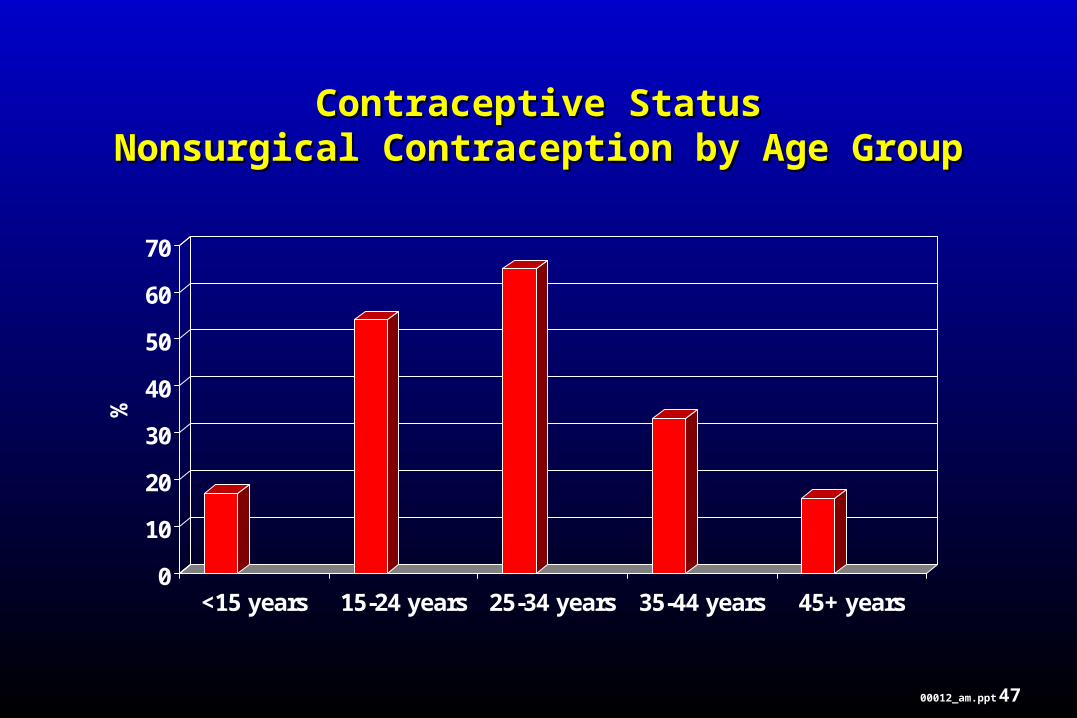
Contraceptive StatusContraceptive StatusNonsurgical Contraception by Age GroupNonsurgical Contraception by Age Group
0
10
20
30
40
50
60
70
%
<15 years 15-24 years 25-34 years 35-44 years 45+ years
4800012_am.ppt
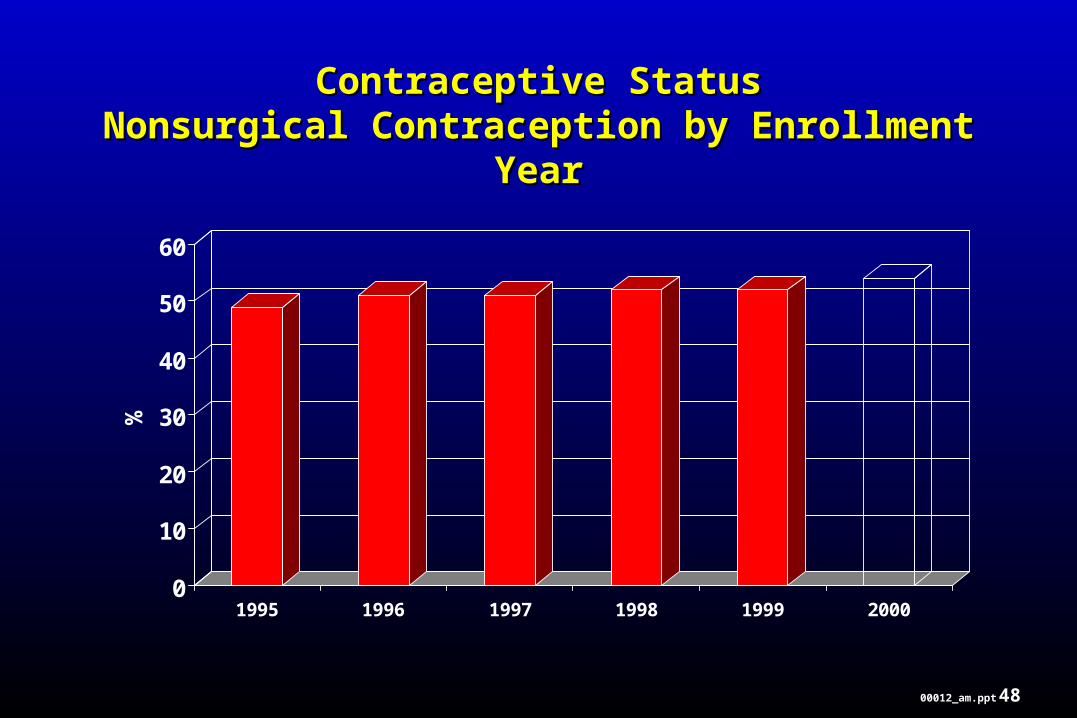
Contraceptive StatusContraceptive StatusNonsurgical Contraception by Enrollment YearNonsurgical Contraception by Enrollment Year
0
10
20
30
40
50
60
%
1995 1996 1997 1998 1999 2000
4900012_am.ppt
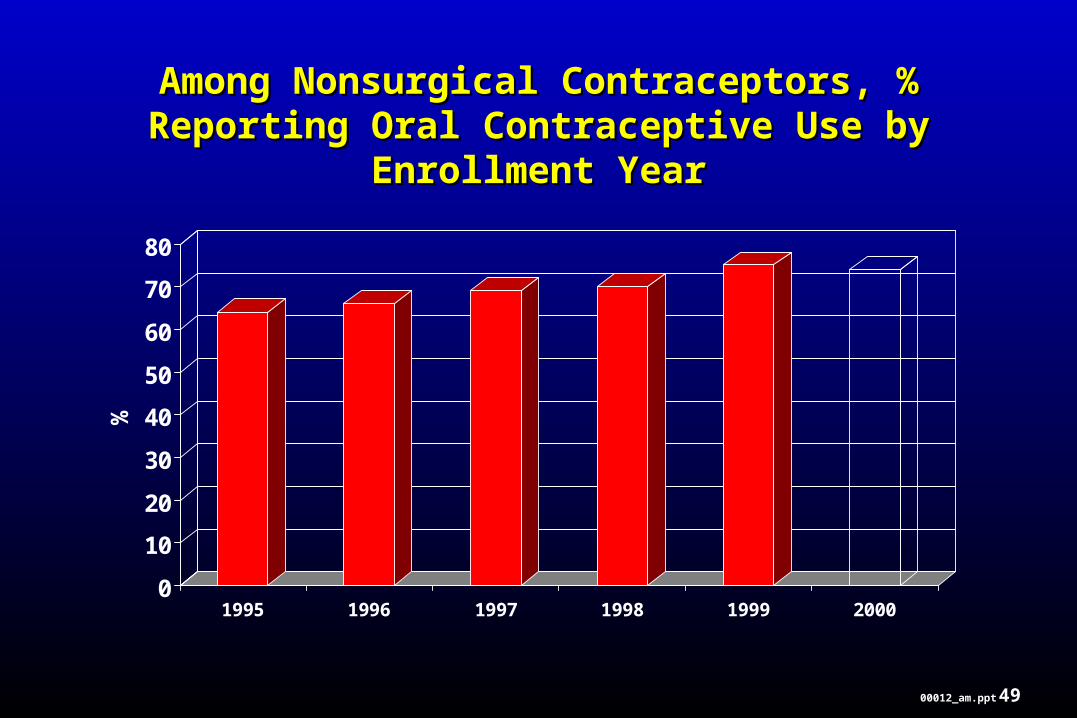
Among Nonsurgical Contraceptors, % Reporting Among Nonsurgical Contraceptors, % Reporting Oral Contraceptive Use by Enrollment YearOral Contraceptive Use by Enrollment Year
0
10
20
30
40
50
60
70
80
%
1995 1996 1997 1998 1999 2000

5000012_am.ppt
Among ContraceptorsAmong Contraceptors% Reporting Use of 2+ Methods by Age Group% Reporting Use of 2+ Methods by Age Group
0
5
10
15
20
25
30
35
40
45
%
<15 years 15-24 years 25-34 years 35-44 years 45+ years

5100012_am.ppt
Among ContraceptorsAmong Contraceptors% Reporting Use of 2+ Methods by Enrollment Year% Reporting Use of 2+ Methods by Enrollment Year
5
10
15
20
25
30
35
40
%
1995 1996 1997 1998 1999 2000
5200012_am.ppt
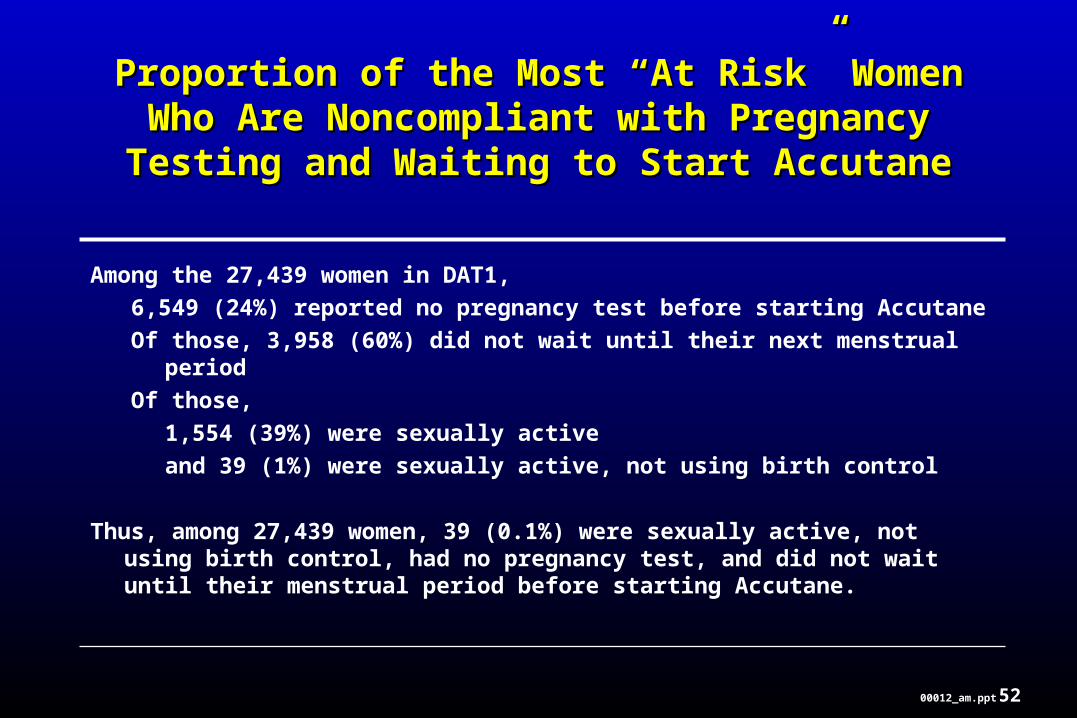
Among the 27,439 women in DAT1,
6,549 (24%) reported no pregnancy test before starting Accutane
Of those, 3,958 (60%) did not wait until their next menstrual period
Of those,
1,554 (39%) were sexually active
and 39 (1%) were sexually active, not using birth control
Thus, among 27,439 women, 39 (0.1%) were sexually active, not using birth control, had no pregnancy test, and did not wait until their menstrual period before starting Accutane.
Proportion of the Most “At Risk” Women Who Are Proportion of the Most “At Risk” Women Who Are Noncompliant with Pregnancy Testing and Noncompliant with Pregnancy Testing and
Waiting to Start AccutaneWaiting to Start Accutane

5300012_am.ppt
Accutane SurveyAccutane Survey
Results:
Pregnancies

5400012_am.ppt
Pregnancies During Accutane TreatmentPregnancies During Accutane Treatment
1989 – 1999 Cohorts
Number of women completing follow-up 347,857
Number of pregnancies reported 1,019

5500012_am.ppt
Number of Pregnancies ReportedNumber of Pregnancies Reportedby Enrollment Yearby Enrollment Year
0
20
40
60
80
100
120
Nu
mb
er o
f P
reg
nan
cies
1989 1990 1991 1992 1993 1994 1995 1996 1997 1998 1999

5600012_am.ppt
Accutane SurveyAccutane Survey
Characteristics of Pregnancies(n=1,019)
Pregnant at start of treatment 10%
No contraceptive use 23%
Contraceptive failure 66%
5700012_am.ppt
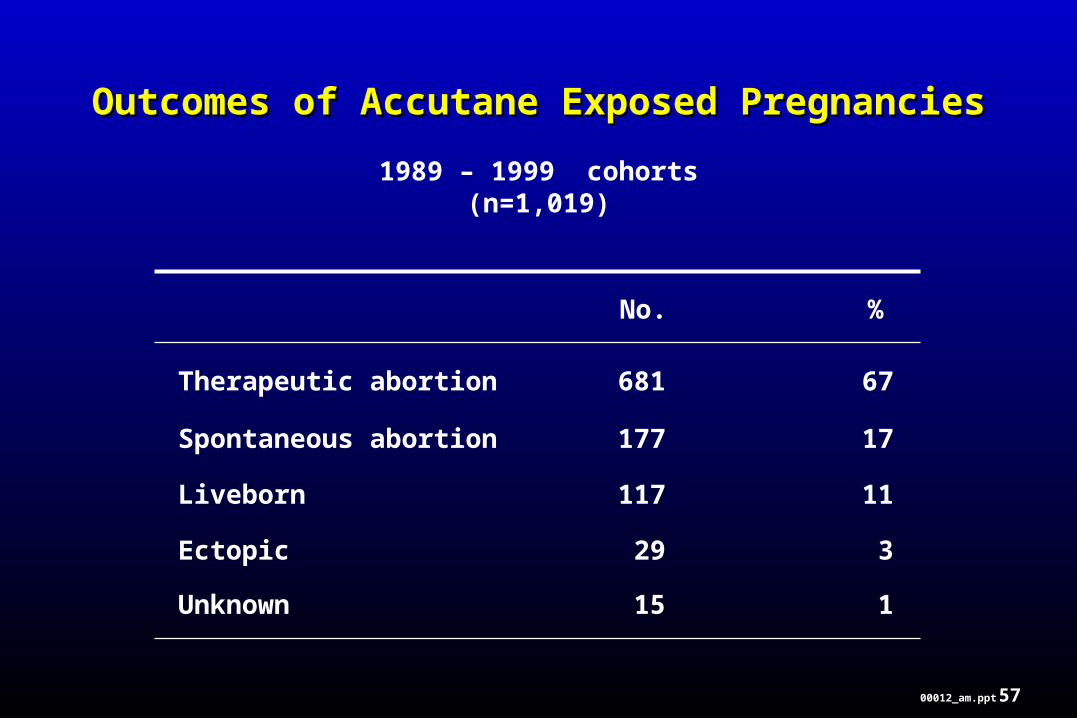
Outcomes of Accutane Exposed PregnanciesOutcomes of Accutane Exposed Pregnancies
1989 – 1999 cohorts(n=1,019)
No. %
Therapeutic abortion 681 67
Spontaneous abortion 177 17
Liveborn 117 11
Ectopic 29 3
Unknown 15 1

5800012_am.ppt
Pregnancy Rate During Accutane TreatmentPregnancy Rate During Accutane Treatment
1989 – 1999 Cohorts(Duration of Use <1 Year)
Number of women completing follow-up 339,994
Number of pregnancies reported 992
Rate per 1000 Accutane courses 2.8
Rate per 1000 person years 7.4
5900012_am.ppt
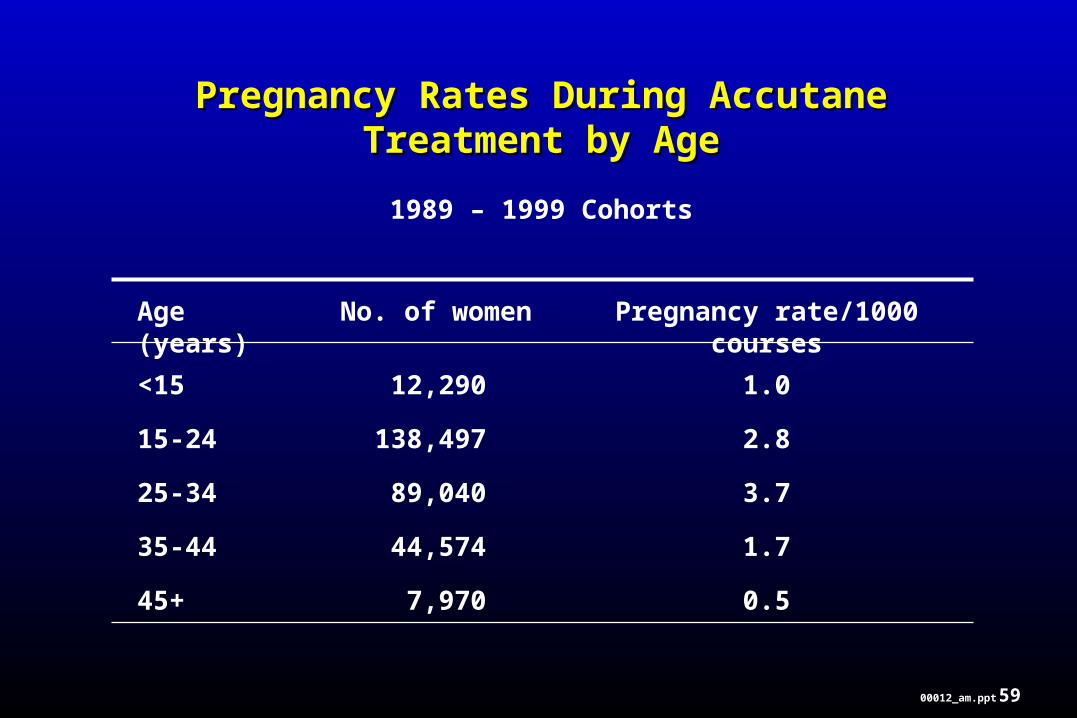
Pregnancy Rates During Accutane Treatment Pregnancy Rates During Accutane Treatment by Ageby Age
1989 – 1999 Cohorts
Age (years) No. of women Pregnancy rate/1000 courses
<15 12,290 1.0
15-24 138,497 2.8
25-34 89,040 3.7
35-44 44,574 1.7
45+ 7,970 0.5
6000012_am.ppt
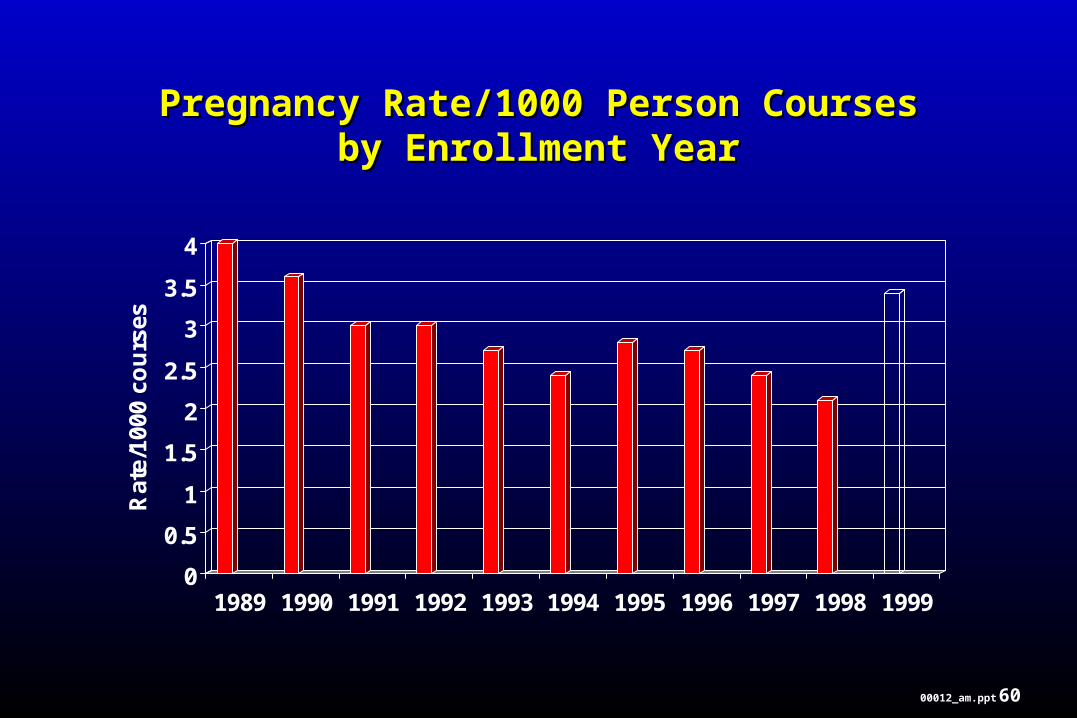
Pregnancy Rate/1000 Person CoursesPregnancy Rate/1000 Person Coursesby Enrollment Yearby Enrollment Year
0
0.5
1
1.5
2
2.5
3
3.5
4
Rat
e/10
00 c
ou
rses
1989 1990 1991 1992 1993 1994 1995 1996 1997 1998 1999

6100012_am.ppt
Pregnancy Rate During Accutane Treatment Pregnancy Rate During Accutane Treatment by Contraceptive Methodby Contraceptive Method
1989 – 1999 Cohorts
Method No. of Women Pregnancy rate/1000 courses
None 113,247 1.7
Oral contraceptive 97,895 2.5
Tubal ligation 23,194 0.5
Condom 17,475 10.6
Vasectomy 15,965 0.3
Other 12,318 3.1
Unknown 4,622 2.5
Diaphragm 4,519 5.9
IUD 2,212 3.6
Rhythm 855 15.2

6200012_am.ppt
Accutane SurveyAccutane Survey
Validity

6300012_am.ppt
Accutane SurveyAccutane Survey
Validity
• Follow-up rates are high
6400012_am.ppt
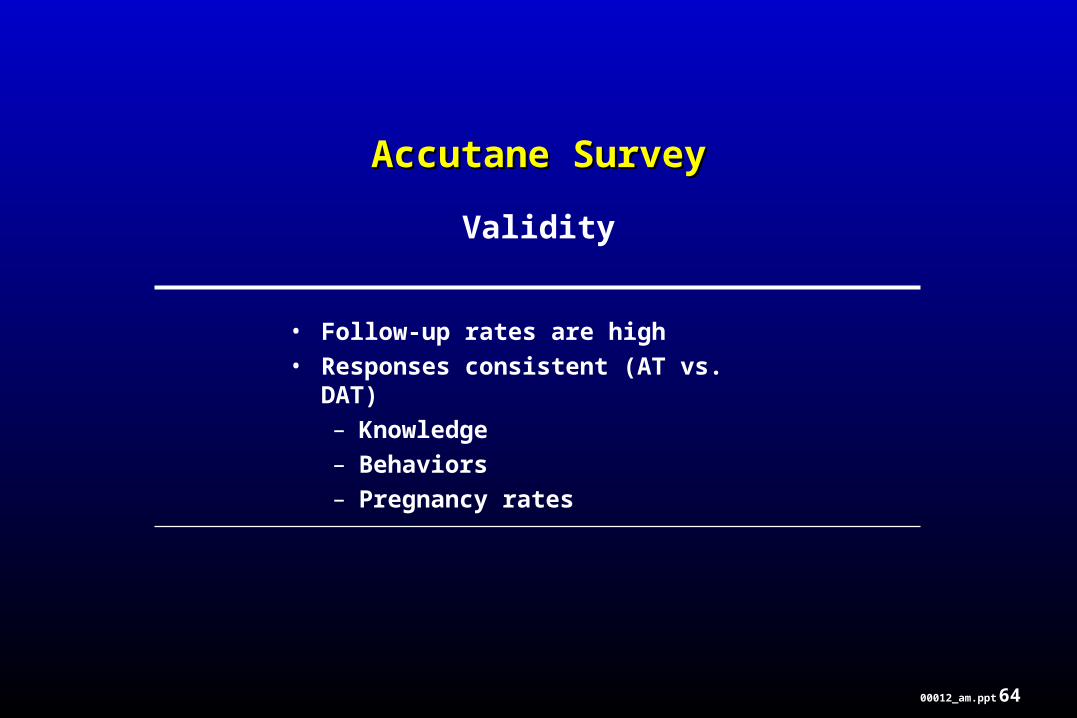
Accutane SurveyAccutane Survey
Validity
• Follow-up rates are high• Responses consistent (AT vs. DAT)
– Knowledge– Behaviors– Pregnancy rates
6500012_am.ppt
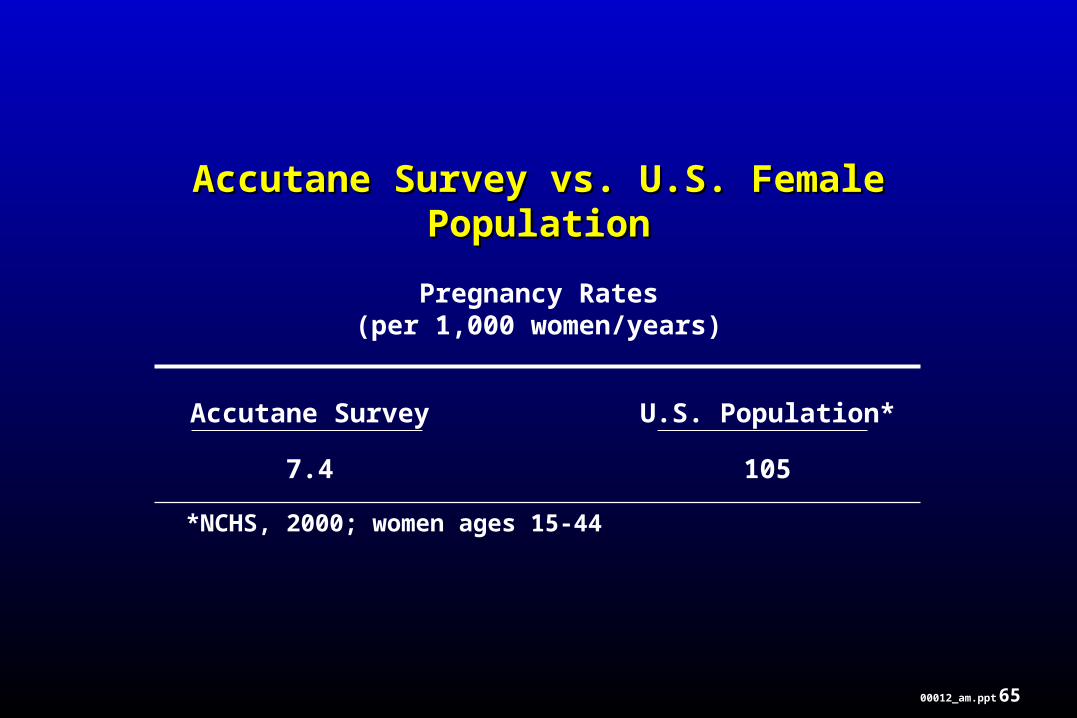
Accutane Survey vs. U.S. Female PopulationAccutane Survey vs. U.S. Female Population
Pregnancy Rates(per 1,000 women/years)
Accutane Survey U.S. Population*
7.4 105
*NCHS, 2000; women ages 15-44

6600012_am.ppt
Accutane Survey vs. U.S. Female PopulationAccutane Survey vs. U.S. Female Population
Proportion Sexually Activeand
Not Using Contraception(n=26,074)
Accutane
Survey
U.S.
Population* Age: 15-24
25-34
35-44
<1
1
1
7
5
5
*National Survey of Family Growth, NCHS, 1995.

6700012_am.ppt
Accutane Survey vs. U.S. Female PopulationAccutane Survey vs. U.S. Female Population
Among Contraceptors:Proportions using birth control pill
Accutane
Survey %
U.S. Population*
% Age: 15-24 73 49
25-34 53 33
35-44 20 8
*National Survey of Family Growth, NCHS (1995 Data).

6800012_am.ppt
Major Factors Associated withMajor Factors Associated withSuccessful Contraception*Successful Contraception*
– Age (coital frequency, fecundity)
– Education
– Duration of method use
– Motivation
*Trussell J and Kost K: Studies in Family Planning 1987;18:237-183

6900012_am.ppt
% of Pregnancies by Contraceptive Method% of Pregnancies by Contraceptive Method
27%
25%
33%
2%13%
No method
Condom
Oral contraceptive
Unknown method
Other
7000012_am.ppt
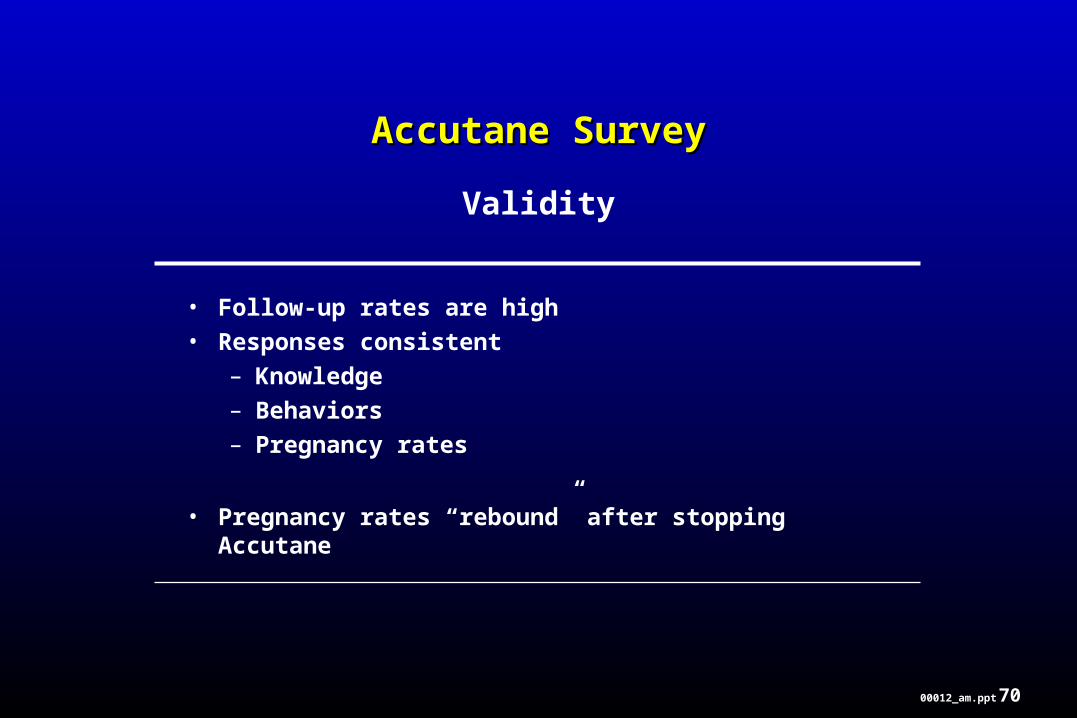
Accutane SurveyAccutane Survey
Validity
• Follow-up rates are high• Responses consistent
– Knowledge– Behaviors– Pregnancy rates
• Pregnancy rates “rebound” after stopping Accutane

7100012_am.ppt
Pregnancy Rates and Outcomes During and After Pregnancy Rates and Outcomes During and After Therapy with Isotretinoin in 122,582 Women,Therapy with Isotretinoin in 122,582 Women,
1989-19931989-1993

7200012_am.ppt
Accutane SurveyAccutane Survey
Representativeness

7300012_am.ppt
1) What proportion of eligible women enroll in the Survey?
2) Do women in the Survey represent the larger population of Accutane users?
Accutane SurveyAccutane Survey
Representativeness

7400012_am.ppt
Roche Consumer SurveyRoche Consumer Survey
Female Accutane Users1990 – 1991
(n=400)
Proportion reporting enrollment in survey:
239/400; 60%

7500012_am.ppt
Consumer SurveyConsumer Survey
Accutane Survey
Enrolled Not enrolled
Age (mean) 29 31
Education (median) 14 14
Dermatologist prescribed 91% 88%
Sexually active 64% 54%
- Using contraception (96%) (92%)

7600012_am.ppt
Consumer SurveyConsumer Survey
Contraceptive Methods(among 205 contraceptors; in %)
Accutane Survey
Enrolled Not enrolled
Birth control pill 40 16
Condom 10 12
Other barrier methods 9 8
Surgical sterilization 44 65

7700012_am.ppt
United Health CareUnited Health Care
Population: 1.2 million women ages 12-59
1/90 – 6/96
5,095 women ages 12-59, who filled Accutane prescription between 1/90 and 6/96

7800012_am.ppt
United Health CareUnited Health Care
Population: 1.2 million women ages 12-59
1/90 – 6/96
5,095 women ages 12-59, who filled Accutane prescription between 1/90 and 6/96
Proportion enrolled in Accutane Survey
Definite: 38.4%
Possible: 7.5%
Total: 45.9%
7900012_am.ppt
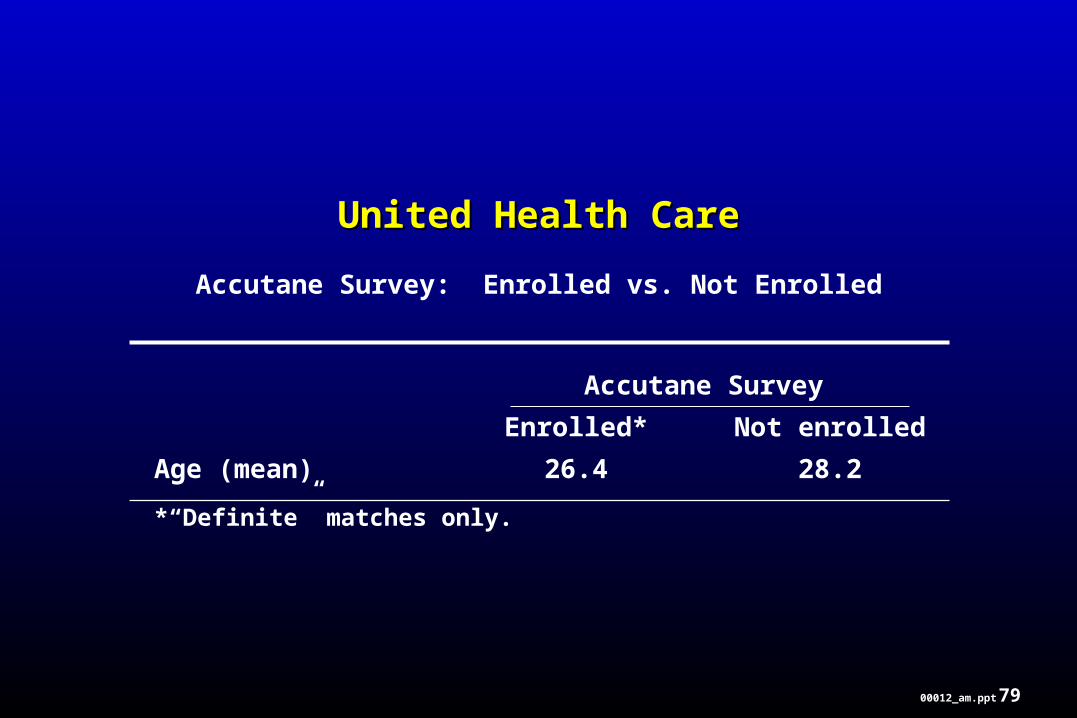
United Health CareUnited Health Care
Accutane Survey: Enrolled vs. Not Enrolled
Accutane Survey
Enrolled* Not enrolled
Age (mean) 26.4 28.2
*“Definite” matches only.
8000012_am.ppt
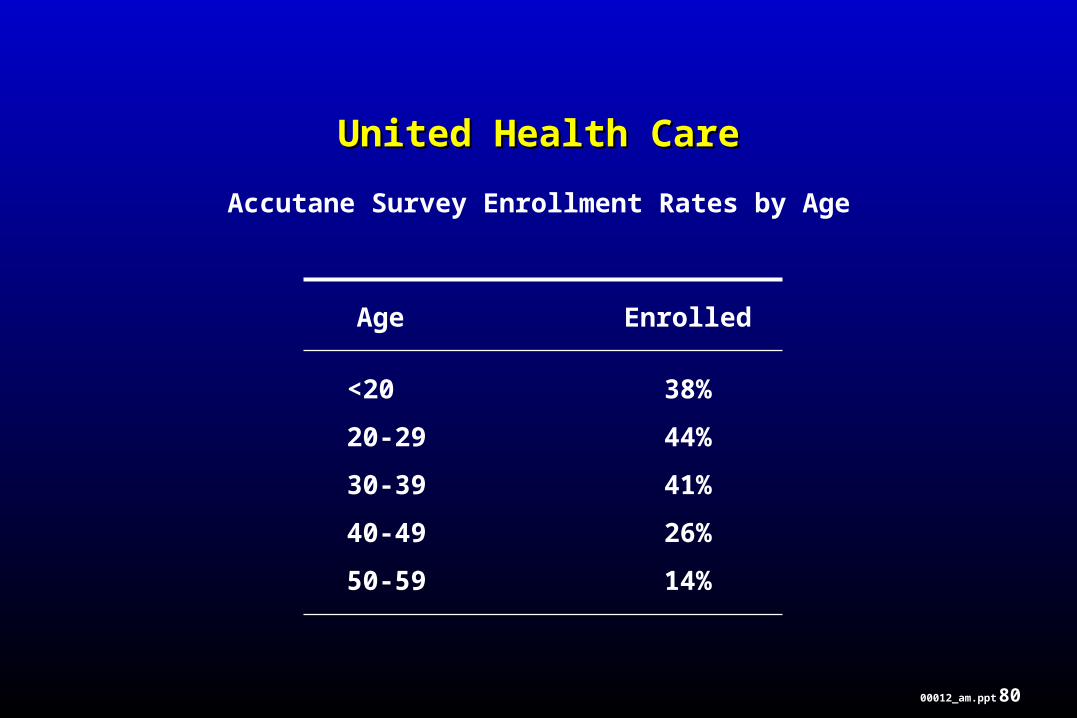
United Health CareUnited Health Care
Accutane Survey Enrollment Rates by Age
Age Enrolled
<20 38%
20-29 44%
30-39 41%
40-49 26%
50-59 14%

8100012_am.ppt
SEU Accutane SurveySEU Accutane Survey
Is there selection bias favoring women at low risk?
8200012_am.ppt
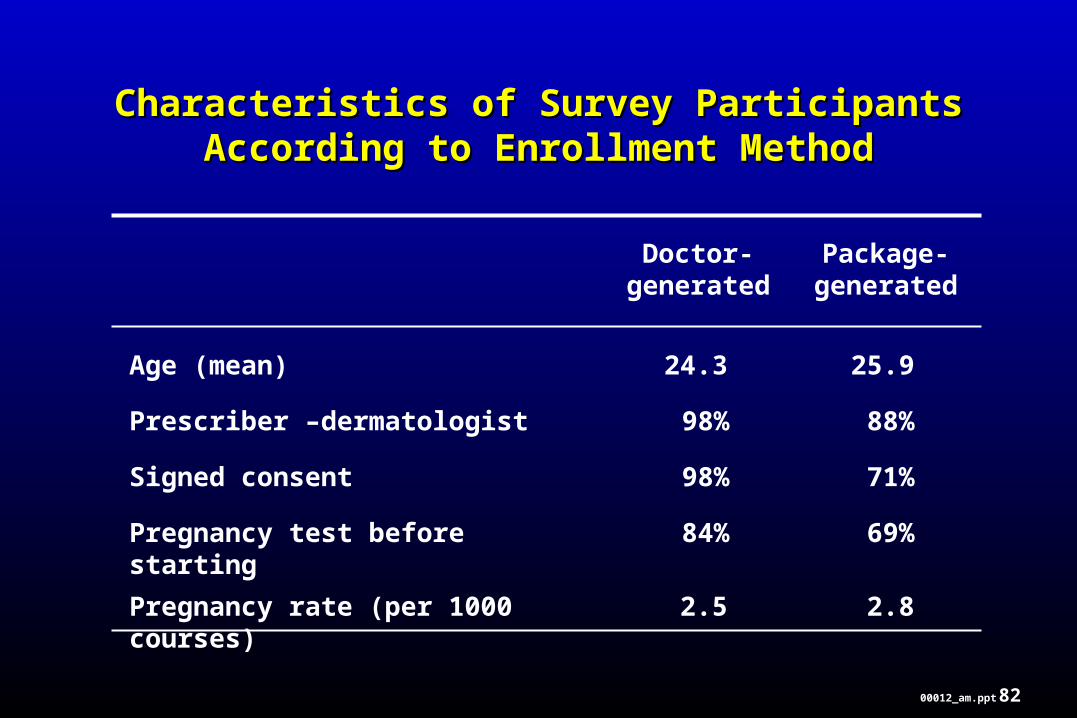
Characteristics of Survey ParticipantsCharacteristics of Survey ParticipantsAccording to Enrollment MethodAccording to Enrollment Method
Doctor-generated
Package-generated
Age (mean) 24.3 25.9
Prescriber –dermatologist 98% 88%
Signed consent 98% 71%
Pregnancy test before starting 84% 69%
Pregnancy rate (per 1000 courses) 2.5 2.8

8300012_am.ppt
Among women who enrolled via the Medication Package, only 13% reported that they did so because of their doctor’s encouragement.

8400012_am.ppt
Doctor Encouraged to Enroll in SurveyDoctor Encouraged to Enroll in Surveyby Age Groupby Age Group
0
10
20
30
40
50
60
% Y
es
<15 years 15-24 years 25-34 years 35-44 years 45+ years
8500012_am.ppt
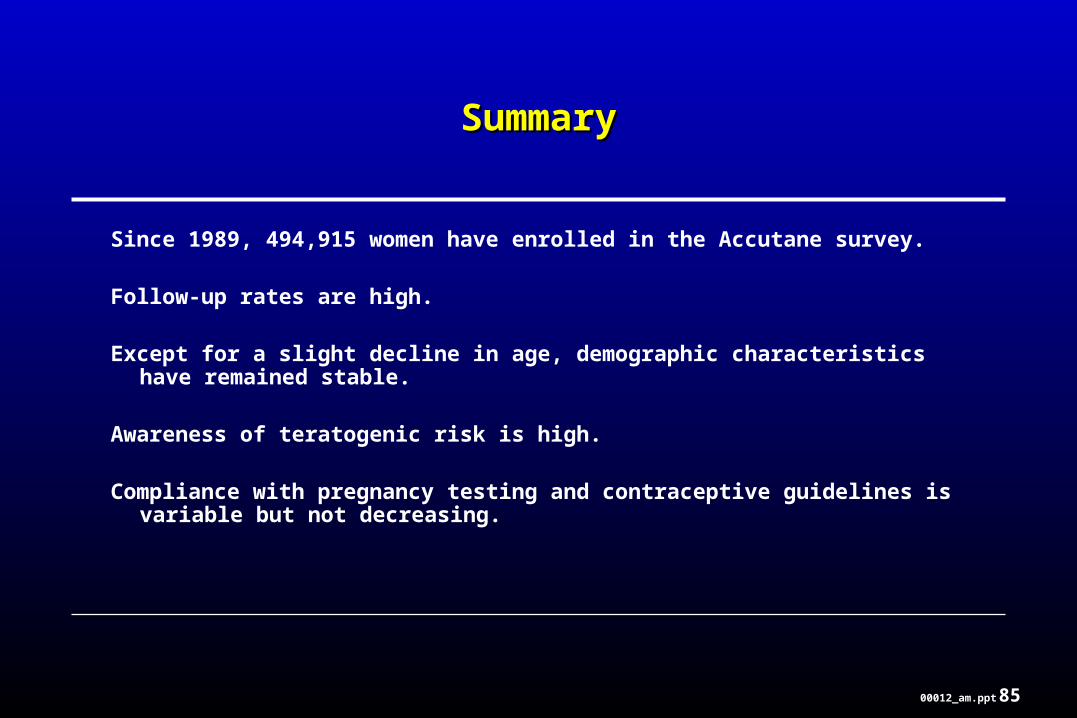
SummarySummary
Since 1989, 494,915 women have enrolled in the Accutane survey.
Follow-up rates are high.
Except for a slight decline in age, demographic characteristics have remained stable.
Awareness of teratogenic risk is high.
Compliance with pregnancy testing and contraceptive guidelines is variable but not decreasing.
8600012_am.ppt
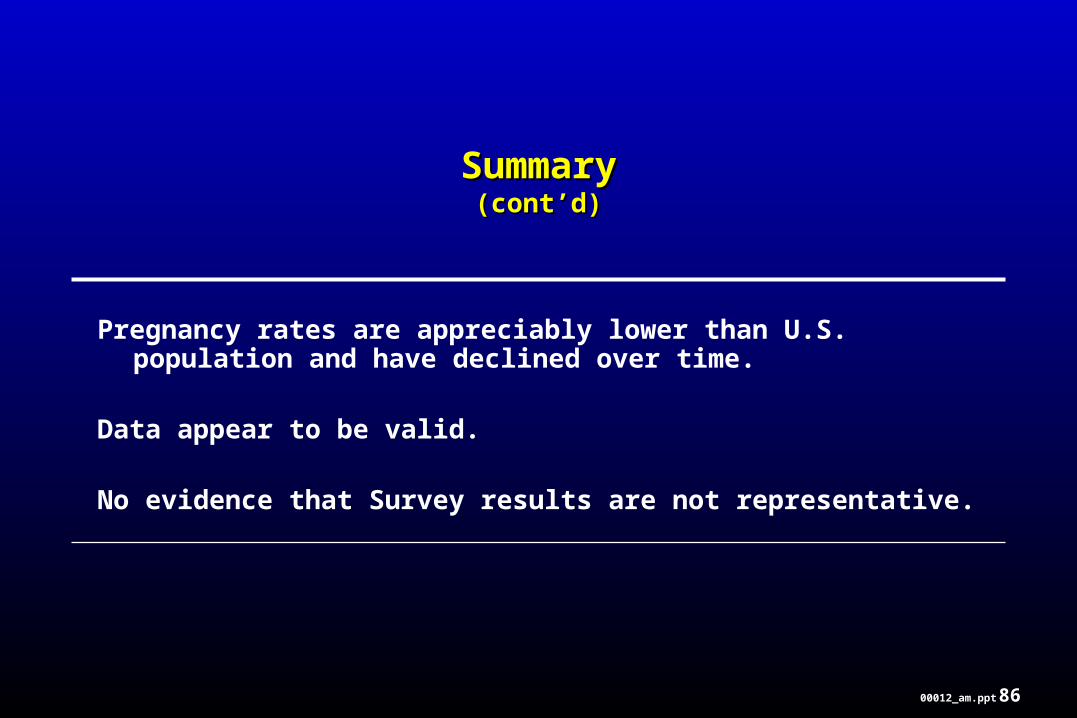
SummarySummary(cont’d)(cont’d)
Pregnancy rates are appreciably lower than U.S. population and have declined over time.
Data appear to be valid.
No evidence that Survey results are not representative.

8700012_am.ppt
Future DirectionsFuture Directions
Increase enrollments– Increase payment at enrollment– Add payment upon completion– Modify doctor-patient enrollment procedures
Enroll women on multiple courses
Increase power and value of DAT follow-up5000/yr 25,000/yr

8800012_am.ppt
Future DirectionsFuture Directions(cont’d)(cont’d)
Modify Survey questions– Oral contraceptive type– Refine pregnancy risk questions
Initiate regular feedback to prescribers to encourage them to value the Survey and enroll patients.

8900012_am.ppt

9000012_am.ppt
Method of Enrollment by Enrollment YearMethod of Enrollment by Enrollment Year
0102030405060708090
%
Doctor-generated
Package-generated
Toll-free phone no.
9100012_am.ppt
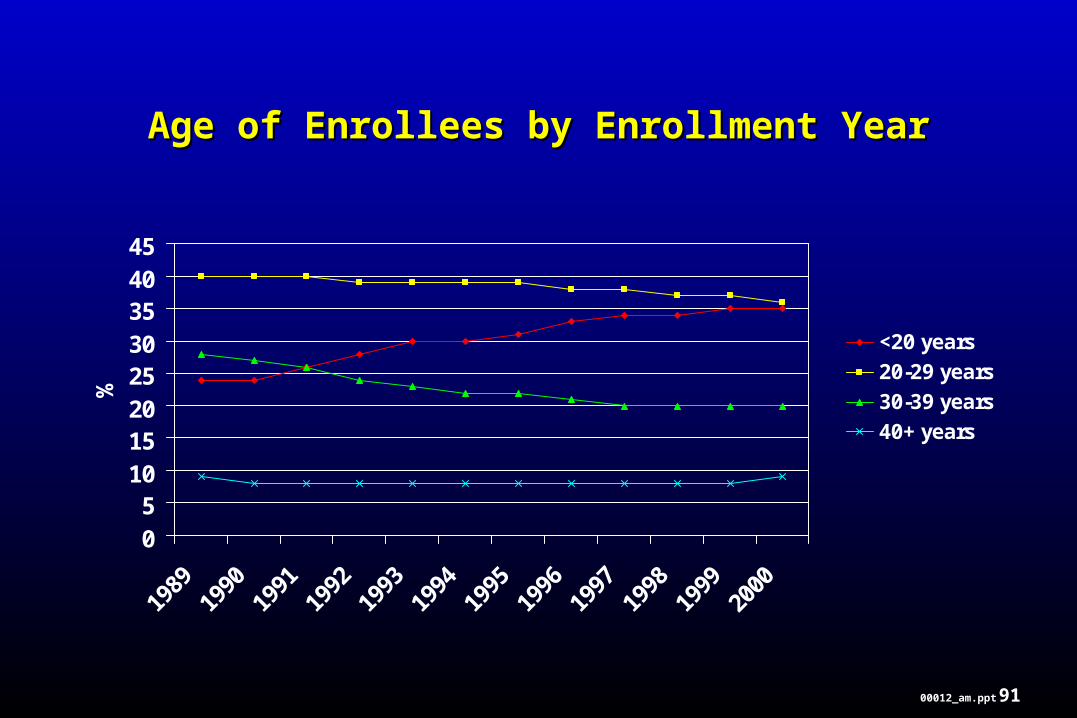
Age of Enrollees by Enrollment YearAge of Enrollees by Enrollment Year
05
1015202530354045
%
<20 years
20-29 years
30-39 years
40+ years

9200012_am.ppt
Region of Residence by Enrollment YearRegion of Residence by Enrollment Year
0
5
10
15
20
25
%
New EnglandMid AtlanticSouth AtlanticEast South CentralWest South CentralMountainPacificWest North CentralEast North CentralOther

9300012_am.ppt
Highest Level of Education by Enrollment YearHighest Level of Education by Enrollment Year
0
5
10
15
20
25
30
35
40
1995 1996 1997 1998 1999 2000
%
<12 years
High school graduate
Some college ortechnical school
College graduate+
n=5,108 n=5,157 n=5,206 n=5,047 n=5,283 n=2,585
9400012_am.ppt
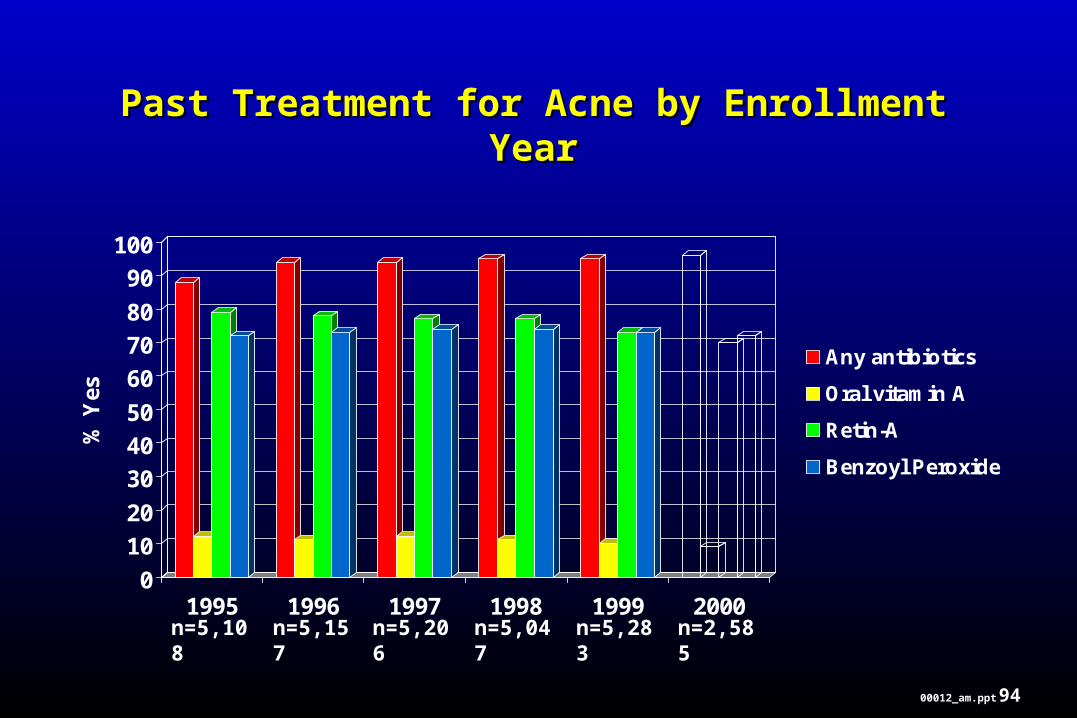
Past Treatment for Acne by Enrollment YearPast Treatment for Acne by Enrollment Year
0
10
20
30
40
50
60
70
80
90
100
% Y
es
1995 1996 1997 1998 1999 2000
Any antibiotics
Oral vitamin A
Retin-A
Benzoyl Peroxide
n=5,108 n=5,157 n=5,206 n=5,047 n=5,283 n=2,585

9500012_am.ppt
Pregnancy Risk Category by Enrollment YearPregnancy Risk Category by Enrollment Year
0
5
10
15
20
25
30
35
40
% Y
es
1995 1996 1997 1998 1999 2000
Hysterectomy orpostmenopausal
Not sexually active,using birth control
Not sexually active, notusing birth control
Sexually active, usingbirth control
Sexually active, notusing birth control
n=5,023 n=5,087 n=5,144 n=4,987 n=5,220 n=2,555

9600012_am.ppt
Oral Contraceptive Users by Sexual Activity StatusOral Contraceptive Users by Sexual Activity StatusAge 15-24 yearsAge 15-24 years
0
5
10
15
20
25
30
1995 1996 1997 1998 1999 2000
%
Sexually activeNot sexually active

9700012_am.ppt
Doctor Encouraged to Enroll in SurveyDoctor Encouraged to Enroll in Surveyby Enrollment Methodby Enrollment Method
010
20304050
60708090
% Y
es
Doctor-generated Medicationpackage-genrated
Toll-free telephonenumber
9800012_am.ppt
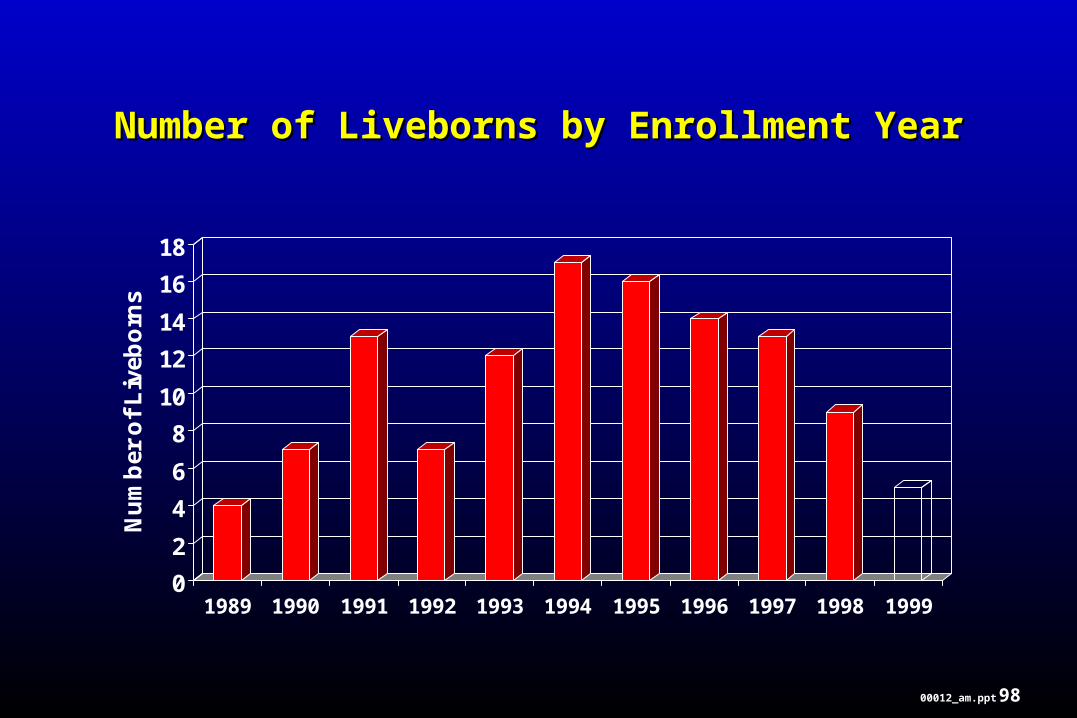
Number of Liveborns by Enrollment YearNumber of Liveborns by Enrollment Year
0
2
4
6
8
10
12
14
16
18
Nu
mb
er o
f L
iveb
orn
s
1989 1990 1991 1992 1993 1994 1995 1996 1997 1998 1999
9900012_am.ppt
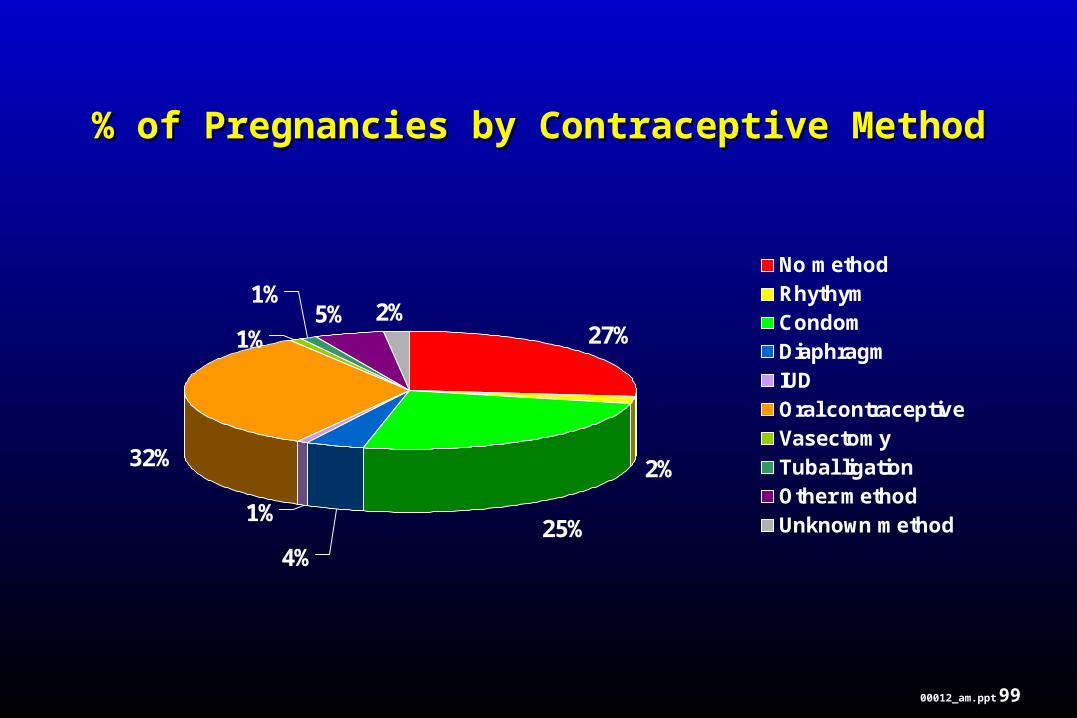
% of Pregnancies by Contraceptive Method% of Pregnancies by Contraceptive Method
27%
2%
25%4%
1%
32%
1%
1%5% 2%
No methodRhythymCondomDiaphragmIUDOral contraceptiveVasectomyTubal ligationOther methodUnknown method
10000012_am.ppt
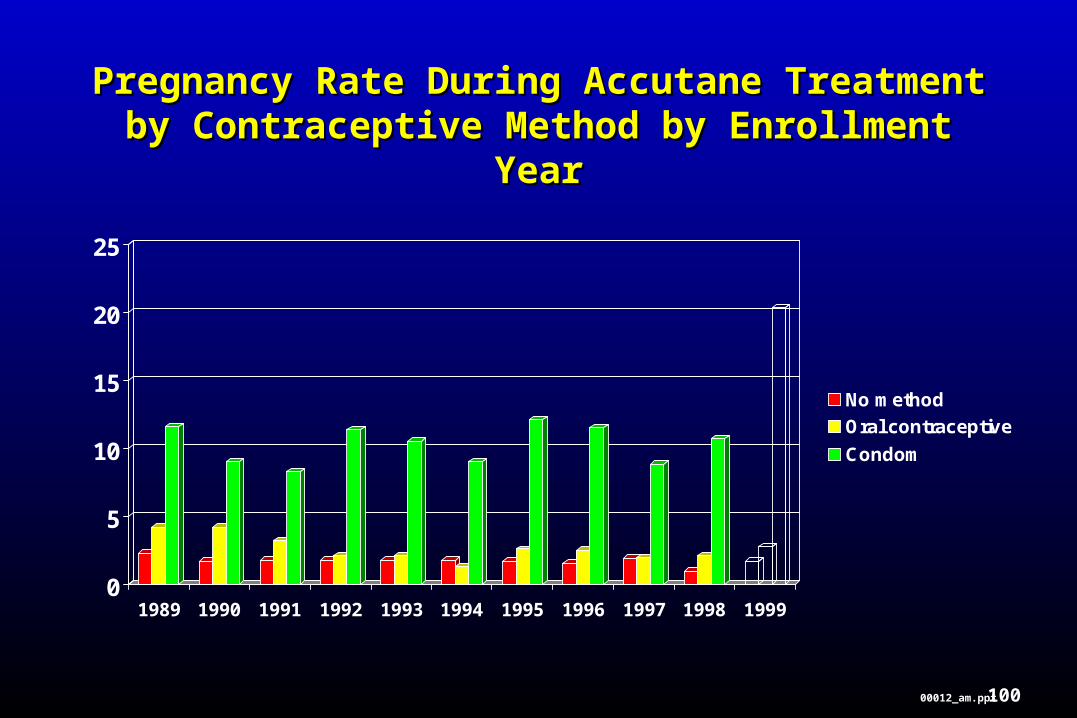
Pregnancy Rate During Accutane Treatment by Pregnancy Rate During Accutane Treatment by Contraceptive Method by Enrollment YearContraceptive Method by Enrollment Year
0
5
10
15
20
25
1989 1990 1991 1992 1993 1994 1995 1996 1997 1998 1999
No method
Oral contraceptive
Condom
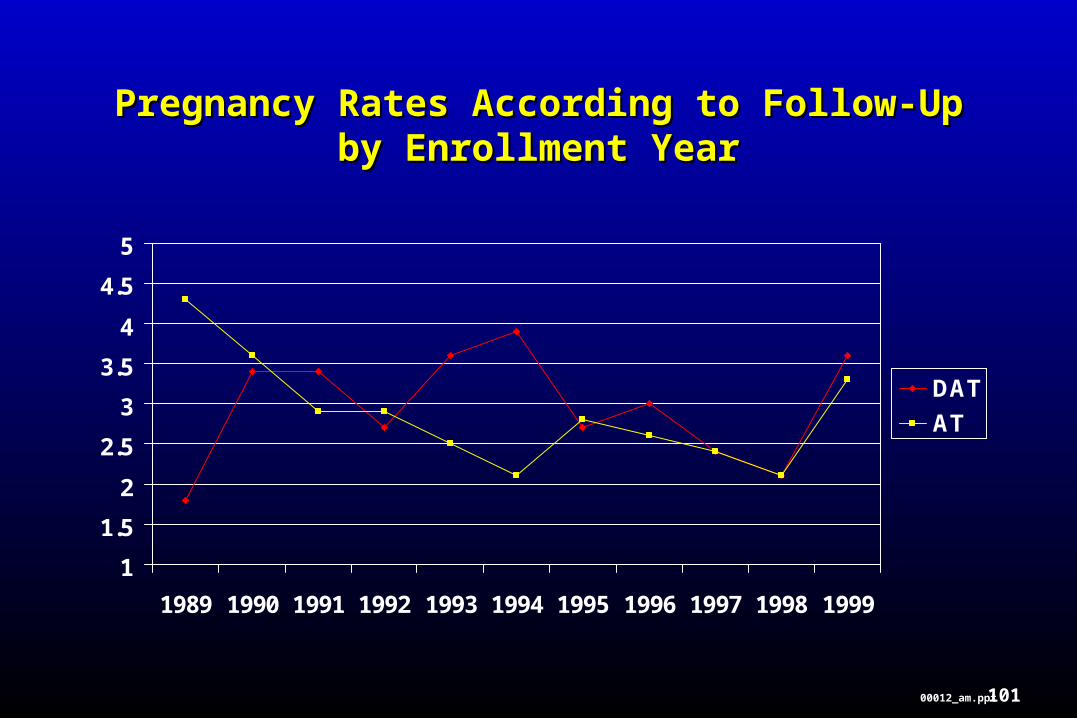
10100012_am.ppt
Pregnancy Rates According to Follow-UpPregnancy Rates According to Follow-Upby Enrollment Yearby Enrollment Year
1
1.5
2
2.5
3
3.5
4
4.5
5
1989 1990 1991 1992 1993 1994 1995 1996 1997 1998 1999
DAT
AT

10200012_am.ppt
Contraceptive Failure RatesContraceptive Failure Rates
Typical Use* Perfect Use* Accutane Survey†
Method (%) (%) (%)
Diaphragm 18 6 1.5
Condom (male) 12 3 2.8
IUD 0.1-2.0 0.1-1.5 0.9
Oral contraceptive pill
0.1-0.5 0.6
Female sterilization 0.4 0.4 0.1
Male sterilization 0.15 0.10 0.08*Percent pregnant in first year of use; Hatcher RA et al.: Contraceptive Technology, 17th Edition, 1994, p113.
†Rate per 100 woman-years.

10300012_am.ppt
Compliance According to PregnancyCompliance According to PregnancyRisk CategoryRisk Category
(DAT1, 1995 – 2000)
Hyst.
Not sexually active, using birth control
Not sexually active, not using
birth control
Sexually active, using birth
control
Sexually active, not using birth
control Unk.
N 943 6,970 8,821 10,811 195 276
% % % % % %
Told to avoid pregnancy 95 99 99 99 99 99
Signed consent 51 81 78 76 69 79
Had pregnancy test N/A 82 70 76 70 64
Waited for test after starting N/A 74 58 70 63 53
Waited for next month after starting N/A 63 48 60 53 47
10400012_am.ppt
Does the more intensive DAT follow-up Does the more intensive DAT follow-up itselfitself result in enhanced compliance?result in enhanced compliance?
10500012_am.ppt
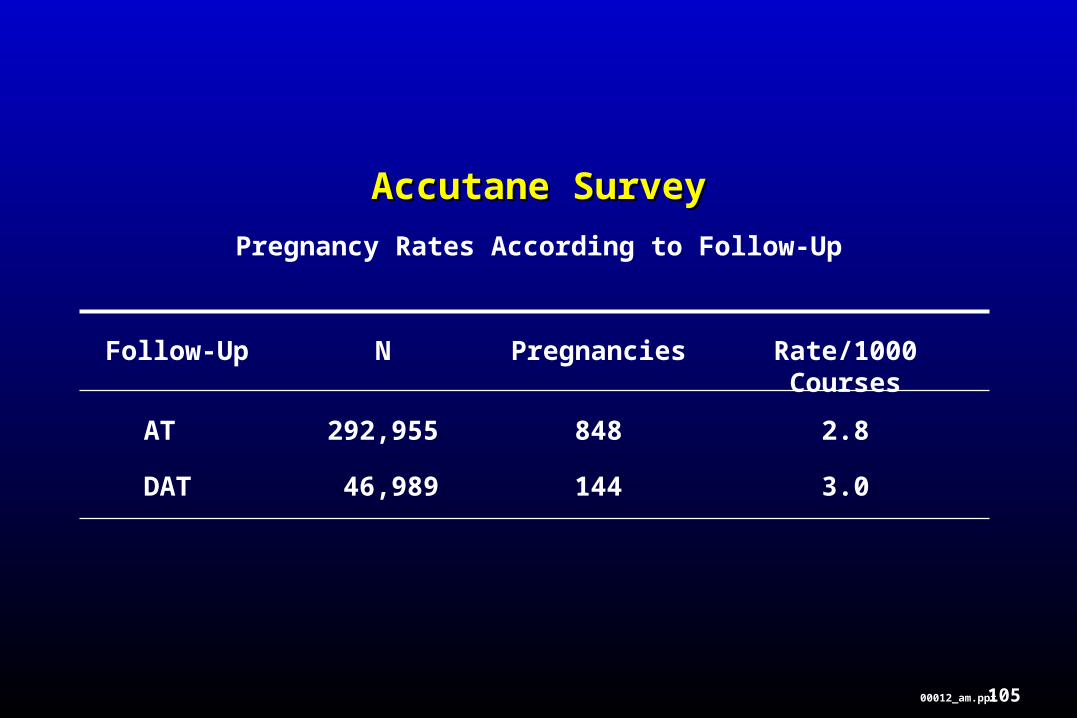
Accutane SurveyAccutane Survey
Pregnancy Rates According to Follow-Up
Follow-Up N Pregnancies Rate/1000 Courses
AT 292,955 848 2.8
DAT 46,989 144 3.0

10600012_am.ppt
Pregnancy Rate in 30 Days Following AccutanePregnancy Rate in 30 Days Following Accutaneby Enrollment Yearby Enrollment Year
(n=338/338,959; Rate=1.0/1000 enrollees)
0
0.2
0.4
0.6
0.8
1
1.2
1.4
1.6
1989 1990 1991 1992 1993 1994 1995 1996 1997 1998 1999
%

10700012_am.ppt
Pregnancy Rate During TreatmentPregnancy Rate During TreatmentAmong Women on Accutane for 1-2 YearsAmong Women on Accutane for 1-2 Years
N=27/7,862, or 27/9,641 person-years of treatment
Rate=2.8/1000 person-years of treatment

10800012_am.ppt
United Health CareUnited Health Care
Accutane Survey Enrollment Rates by Age
0
5
10
15
20
25
30
35
40
45
<20 years 20-29 years 30-39 years 40-49 years 50-59 years