000 Distance All
26
Results | 33 5. Results 5.1 Analysis of socio-economic status, land and resource use pattern of households in Similipal forest 5.1.1 Demographic and socio-economic profile of the villages There were total of 1418 households in the 30 study villages. The total population size was 8212 of which 3827 (53%) were men and 2161 (47%) women. The average family size varied between 3.1-11.2 persons per household with the lowest in village Nawana and highest in village Benipur (Table 4). The sex ratio (females/thousand males) ranged between 189-1214, with the lowest in village Bhudabalanga and highest in Langighasara (Table 4). This difference can be attributed to lack of employment, which has led to migration of the men to other areas in search of jobs. The landholdings of the 30 villages were 545.9 ha. Occupation wise, majority of the house- hold were cultivators with the highest number of cultivators in Gurguria and lowest in Yamunagard (Table 4). Makabadi had the highest land under the cultivation with 28.4 ha and Balarampur comes next with 26.3 ha (Table 4). Among the crop being cultivated, paddy was the major crop in this area and ot her corps was vegetables and spices. Out of the total household of the villages, 143 (10%) households were selected for detailed study from 2007 to 2008. The average h ousehold size ranged from 3 to 22 (Table 4). 5.1.2 Age and gender of the respondents The survey was carried out by dividing the respondents into three age categories: young 20- 39, middle aged 40-59 and elderly 60+. A total of 143 people were surveyed. Out of 143 respondents of the survey, 91 were male and 52 were female. Most of the respondents were between 20-40 yrs (Table 5). The ol dest respondent was aged 86.
-
Upload
ecohimalaya -
Category
Documents
-
view
220 -
download
0
Transcript of 000 Distance All
8/13/2019 000 Distance All
http://slidepdf.com/reader/full/000-distance-all 1/26
R e s u l t s | 33
5. Results
5.1 Analysis of socio-economic status, land and resource use pattern of households in
Similipal forest
5.1.1 Demographic and socio-economic profile of the villages
There were total of 1418 households in the 30 study villages. The total population size was
8212 of which 3827 (53%) were men and 2161 (47%) women. The average family size varied
between 3.1-11.2 persons per household with the lowest in village Nawana and highest in
village Benipur (Table 4). The sex ratio (females/thousand males) ranged between 189-1214,
with the lowest in village Bhudabalanga and highest in Langighasara (Table 4). This
difference can be attributed to lack of employment, which has led to migration of the men to
other areas in search of jobs.
The landholdings of the 30 villages were 545.9 ha. Occupation wise, majority of the house-
hold were cultivators with the highest number of cultivators in Gurguria and lowest in
Yamunagard (Table 4). Makabadi had the highest land under the cultivation with 28.4 ha and
Balarampur comes next with 26.3 ha (Table 4). Among the crop being cultivated, paddy was
the major crop in this area and other corps was vegetables and spices.
Out of the total household of the villages, 143 (10%) households were selected for detailed
study from 2007 to 2008. The average household size ranged from 3 to 22 (Table 4).
5.1.2 Age and gender of the respondents
The survey was carried out by dividing the respondents into three age categories: young 20-
39, middle aged 40-59 and elderly 60+. A total of 143 people were surveyed. Out of 143
respondents of the survey, 91 were male and 52 were female. Most of the respondents were
between 20-40 yrs (Table 5). The oldest respondent was aged 86.

8/13/2019 000 Distance All
http://slidepdf.com/reader/full/000-distance-all 2/26
R e s u l t s | 34
Table 4: Demographic and occupational characteristics of study villages.
Villages Location
(Buffer/
Core/
Periphery)
Total
house-
holds
Total
population
Average
family
size
Male Female Sex ratio
(females
per
thousandmales)
Culti-
vators
Culti-
vated
area
(hectare)
Asanbani Buffer 34 156 4.6 88 68 773 87 9.3 Astakumar Buffer 50 551 11 277 274 989 154 18.6
Badega Buffer 18 188 10.4 91 97 1066 54 21.9
Bakua Core 41 259 6.3 122 137 1123 36 6.9
Balarampur Buffer 65 226 3.5 118 108 915 66 26.3
Bareipani Buffer 113 570 5 403 167 414 100 24.3
Barignbada Buffer 45 229 5.1 119 110 924 70 20.7
Barsia Buffer 72 380 5.3 200 180 900 87 22.7
Benipur Buffer 10 226 22.6 118 108 915 78 26.3
Bhudabalanga Buffer 30 113 3.8 95 18 189 78 23.9
Gadasahi Buffer 14 133 9.5 65 68 1046 45 13.8
Gadsimilipal Buffer 55 290 5.3 164 126 768 85 10.9
Gurguria Buffer 128 540 4.2 270 270 1000 211 15.4
Jenabil Core 25 260 10.4 135 125 926 42 25.9
Kabataghai Core 55 298 5.4 153 145 948 36 20.3
Kandibil Buffer 85 446 5.2 225 221 982 54 12.2
Kasira Buffer 51 245 4.8 123 122 992 64 21.9
Kolha Buffer 47 324 6.9 169 155 917 49 23.9
Koljhari Buffer 26 270 10.4 143 127 888 45 12.6
Kudaghuta Buffer 26 190 7.3 99 91 919 65 13.8
Kukurbuka Buffer 55 371 6.7 203 168 828 122 17.8
Kumari Buffer 57 523 9.2 247 276 1117 64 25.1
Kusumi Buffer 62 280 4.5 145 135 931 56 15.4
Langighasara Buffer 22 93 4.2 42 51 1214 48 10.9
Makabadi Buffer 45 225 5 113 112 991 49 28.4
Nawana Buffer 57 175 3.1 95 80 842 68 24.3
Nigirda Buffer 15 60 4 32 28 875 36 16.2
Saruda Buffer 40 188 4.7 103 85 825 72 8.9
Uski Buffer 57 216 3.8 131 85 649 110 16.6
Yamunagard Core 18 187 10.4 97 90 928 30 10.9
Total 1418 8212 5.8 4385 3827 873 2161 545.9
(Source: Data collected from the V. A. O. office, panchayats and primary health centers of the
respective villages).
8/13/2019 000 Distance All
http://slidepdf.com/reader/full/000-distance-all 3/26
R e s u l t s | 35
Table 5: The gender and age classes of respondents.
Gender Age
20-39 40-59 60
Male 54 23 14
Female 32 12 8
Total 86 35 22
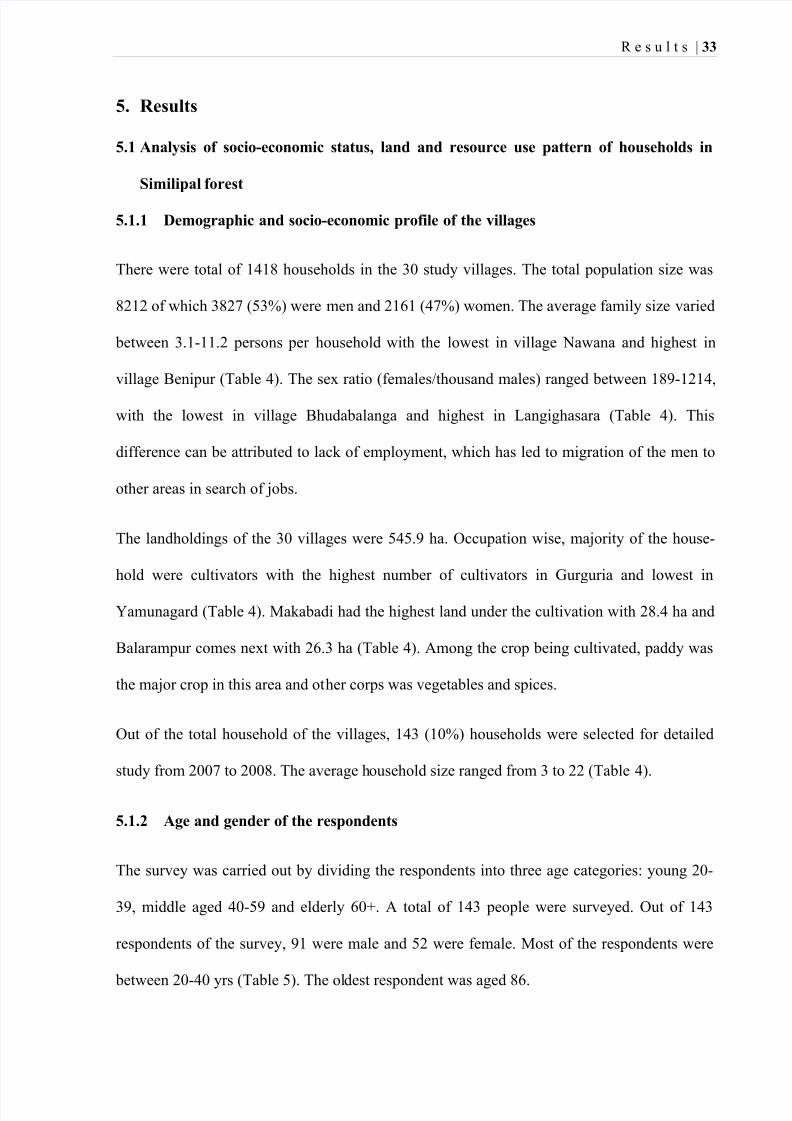
5.1.3 Educational levels of local communities
Out of 143 respondents surveyed, 38% of those interviewed were literate and 62% were
illiterate, because the road network and the educational facilities were very poor in these
areas. Among the literate, 26% were men and 12% were women. Fig. 7 shows the level of
education of respondents interviewed in Similipal. In all the literate respondents 22% were at
primary school level, 17% were at high school level and 6% were at higher secondary level.
None of those interviewed had attended University (Fig. 7). There were more women than
men that were illiterate.
Figure 7: Educational status of the respondents (Source: Data collected from the V. A. O. office,
panchayats).

8/13/2019 000 Distance All
http://slidepdf.com/reader/full/000-distance-all 4/26
R e s u l t s | 36
5.1.4 Occupation and income
Most of the households (59%) were involved in agriculture. About 42 (29%) households
worked as small holdings cultivators, wage labor and collected NTFPs from the forest
because they have less land holdings which do not support them off season. During summer
and off season they collect NTFPs from the forests, and do labor work, 4% were self-
employed in small businesses and government jobs and 8% were land less people who were
wage labor in the urban centers or in nearby cities (Table 6, Fig. 8).
Figure 8: Occupational status of the respondents.
5.1.5 Income classes
The household economy in the rural society depends on the income derived from different
sources. Table 6 describes the income of respondents from various sources, including
cultivation, NTFPs, daily wages etc. The majorities of the respondents (81%) were from the
low-income classes and earned less than one lakh per year, and 48% earned less than Rs.
50,000- per year (Table 6). Fewer (19%) earned more than one lakh per annum (Table 6). The
majority of those earning less than Rs. 50,000- per year were households engaged in
cultivation, NTFPs collection, daily wage labor and a combination of these (Table 6).

8/13/2019 000 Distance All
http://slidepdf.com/reader/full/000-distance-all 5/26
R e s u l t s | 37
Table 6: Annual income of the respondents of the studied households.
Occupation Annual income Total
<50,000 50,000-
100,000
100,000 +
Agricultural cultivator 17 46 21 84 (58)
NTFPs collector 12 0 0 12 (8)
Agriculture and NTFPs collectors 12 1 0 13 (9)
Daily wages 11 0 0 11 (8)
Daily wages and NTFPs collectors 4 0 0 4(3)
Agriculture and wages 13 0 0 13 (9)
Agriculture and Forest Department 0 0 4 4 (3)
Agriculture and Business 0 0 1 1
Service 0 0 1 1
Total 69 (48%) 47 (33%) 27 (19%) 143
5.1.6 Livestock population and its impacts
A majority of 1295 among the 1418 households in the region owned livestock. Since the
households are mostly agriculturists, livestock are a source of farm labor, capital asset and a
source of meat and milk. The local households owned cattle, buffalo, sheep and goat. In the
villages of Saruda and Nigirda 100% of household owns livestock while the village Gurguria
fewer households (51%) own livestock (Table 7). The 1418 households owned a total of
10,522 livestock, out of which 51% were cattle, 26% buffalo and 21% goat. A household
owned an average of 9.27 livestock (Table 7, Source: Data collected from the V. A. O. office,
panchayats). The average number of animals/household varied between 2.8-47.6 with the
lowest in village Saruda and highest in village Benipur (Table 7).
Use of forest biomass
Fodder and fuel-wood are the two most heavily exploited forest products in India (Davidar et
al., 2010). We observed that fuel-wood is harvested on a daily basis. In all the 143 household
of the surveyed study villages, 100% of the families collected fuel-wood either as the chief
source of fuel for cooking and heating in winter or for selling in nearby market. Annually a

8/13/2019 000 Distance All
http://slidepdf.com/reader/full/000-distance-all 6/26
R e s u l t s | 38
total of 59, 9330 kg of wood or about 600 tons yr -1
, was extracted from the forest by the 143
households, of which 21, 2430 kg (35%) of fuel-wood was used for household needs, and
31,7280 kg (53%) of fuel-wood was sold (Table 8).
Table 7: Ownership of livestock among the households surveyed in the 30 villages.
Village Total
households
surveyed
Livestock
ownership
(%)
Cow Goat Buffalo Sheep Total
livestock
population
Average
number of
animals/
household
Asanbani 34 30 (88) 145 0 109 0 254 7.5
Astakumar 50 49 (98) 256 27 181 36 500 10.0
Badega 18 12 (67) 159 0 134 0 293 16.3
Bakua 41 37 (90) 83 76 0 0 159 3.9
Balarampur 65 55 (85) 234 0 193 0 427 6.6
Bareipani 113 104 (92) 308 30 306 0 644 5.7
Barignbada 45 32 (71) 112 123 0 0 235 5.2
Barsia 72 67 (93) 286 19 212 0 517 7.2
Benipur 10 6 (60) 260 216 0 0 476 47.6
Bhudabalanga 30 27 (90) 145 0 152 0 297 9.9
Gadasahi 14 12 (86) 78 77 0 0 155 11.1
Gadsimilipal 55 50 (91) 349 30 220 82 681 12.4
Gurguria 128 65 (51) 246 208 16 33 503 3.9
Jenabil 25 22 (88) 152 169 0 0 321 12.8
kabataghai 55 50 (91) 223 292 3 2 520 9.5
Kandibil 85 60 (71) 228 190 24 32 474 5.6
Kasira 51 44 (86) 204 185 39 0 428 8.4
Kolha 47 35 (74) 144 25 122 50 341 7.3
Koljhari 26 23 (88) 75 0 75 0 150 5.8
Kudaghuta 26 14 (54) 195 0 171 0 366 14.1
Kukurbuka 55 49 (89) 200 19 155 0 374 6.8
Kumari 57 54 (95) 170 248 0 0 418 7.3
Kusumi 62 45 (73) 179 135 0 0 314 5.1
Langighasara 22 15 (68) 70 32 2 2 106 4.8
Makabadi 45 34 (76) 167 11 142 0 320 7.1
Nawana 57 49 (86) 228 15 210 0 453 7.9
Nigirda 15 15 (100) 85 0 71 0 156 10.4
Saruda 40 40 (100) 66 0 46 0 112 2.8
Uski 57 45 (79) 212 0 161 0 373 6.5
Yamunagard 18 15 (83) 78 77 0 0 155 8.6
Total 1418 5337 2204 2744 237 10522 9.27
(Source: Data collected from the V. A. O. office, panchayats)
8/13/2019 000 Distance All
http://slidepdf.com/reader/full/000-distance-all 7/26
R e s u l t s | 39
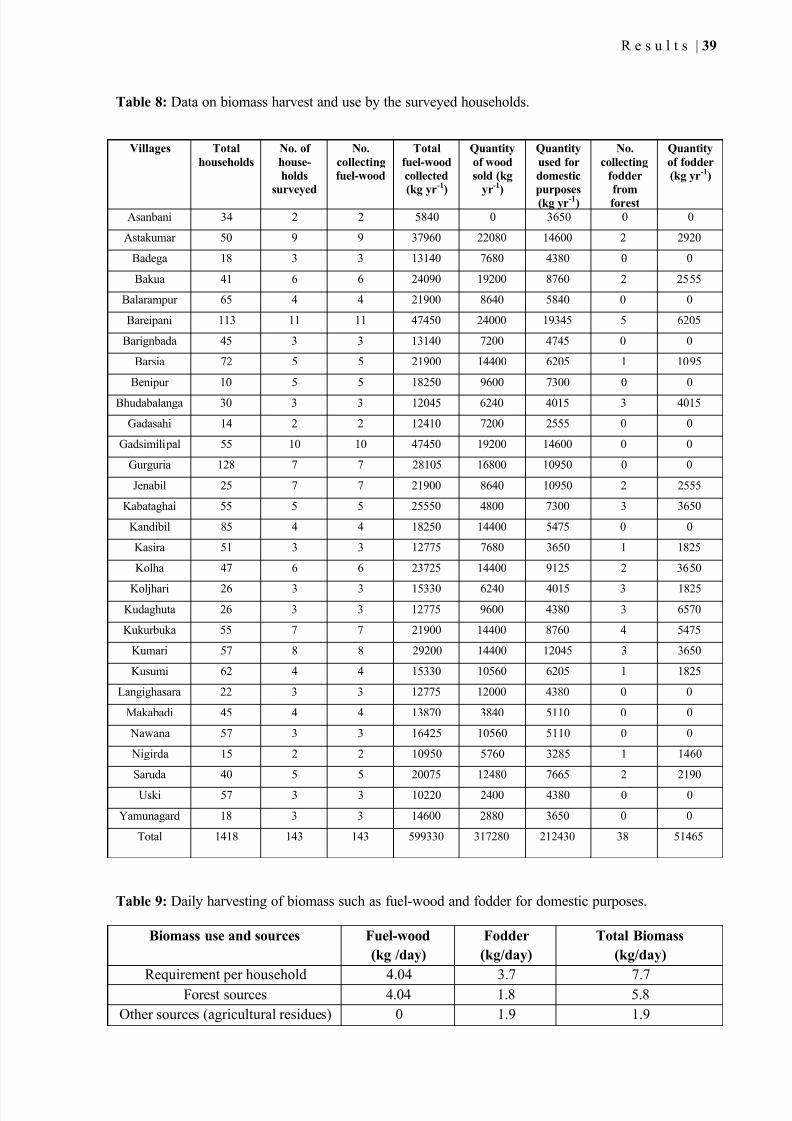
Table 8: Data on biomass harvest and use by the surveyed households.
Villages Total
households
No. of
house-
holds
surveyed
No.
collecting
fuel-wood
Total
fuel-wood
collected
(kg yr-1
)
Quantity
of wood
sold (kg
yr-1
)
Quantity
used for
domestic
purposes
(kg yr-1)
No.
collecting
fodder
from
forest
Quantity
of fodder
(kg yr-1
)
Asanbani 34 2 2 5840 0 3650 0 0
Astakumar 50 9 9 37960 22080 14600 2 2920
Badega 18 3 3 13140 7680 4380 0 0
Bakua 41 6 6 24090 19200 8760 2 2555
Balarampur 65 4 4 21900 8640 5840 0 0
Bareipani 113 11 11 47450 24000 19345 5 6205
Barignbada 45 3 3 13140 7200 4745 0 0
Barsia 72 5 5 21900 14400 6205 1 1095
Benipur 10 5 5 18250 9600 7300 0 0
Bhudabalanga 30 3 3 12045 6240 4015 3 4015
Gadasahi 14 2 2 12410 7200 2555 0 0
Gadsimilipal 55 10 10 47450 19200 14600 0 0
Gurguria 128 7 7 28105 16800 10950 0 0
Jenabil 25 7 7 21900 8640 10950 2 2555
Kabataghai 55 5 5 25550 4800 7300 3 3650
Kandibil 85 4 4 18250 14400 5475 0 0
Kasira 51 3 3 12775 7680 3650 1 1825
Kolha 47 6 6 23725 14400 9125 2 3650
Koljhari 26 3 3 15330 6240 4015 3 1825
Kudaghuta 26 3 3 12775 9600 4380 3 6570
Kukurbuka 55 7 7 21900 14400 8760 4 5475
Kumari 57 8 8 29200 14400 12045 3 3650
Kusumi 62 4 4 15330 10560 6205 1 1825
Langighasara 22 3 3 12775 12000 4380 0 0
Makabadi 45 4 4 13870 3840 5110 0 0
Nawana 57 3 3 16425 10560 5110 0 0
Nigirda 15 2 2 10950 5760 3285 1 1460
Saruda 40 5 5 20075 12480 7665 2 2190
Uski 57 3 3 10220 2400 4380 0 0
Yamunagard 18 3 3 14600 2880 3650 0 0
Total 1418 143 143 599330 317280 212430 38 51465
Table 9: Daily harvesting of biomass such as fuel-wood and fodder for domestic purposes.
Biomass use and sources Fuel-wood
(kg /day)
Fodder
(kg/day)
Total Biomass
(kg/day)
Requirement per household 4.04 3.7 7.7
Forest sources 4.04 1.8 5.8
Other sources (agricultural residues) 0 1.9 1.9

8/13/2019 000 Distance All
http://slidepdf.com/reader/full/000-distance-all 8/26
R e s u l t s | 40
The average harvesting of fuel-wood per household use was 1456 kg, whereas 2341 kg was
collected for sale, indicating that about 1.6 times more fuel-wood was collected if for sale
than for household sustenance.
Since most of the households own livestock, 105 households graze their animals in Similipal
forests and 38 collected fodder from the forest to feed their livestock. A total of 51,465 kg of
fodder (or about 50 tons yr -1
) was extracted by 38 households from the forest in a year (Table
8). Fodder is also obtained from the other sources such as agricultural residues (Table 9). Our
survey indicates that each household uses almost 4 kg of fuel-wood a day for cooking and
other purpose and 3.7 kg of fodder for livestock feeding. The total biomass requirement of a
household is almost 7.7 kg, of which about 5.8 kg comes from forest (Table 9).
Using a logistic regression, I tested whether those that sold fuel-wood were more likely to
have lower income levels, be older, be illiterate and be less likely to own land. The result of
the logistic regression on the variables associated with the likelihood of selling fuel-wood is
significant overall (Table 10).
Table 10: The logistic regression between likelihood of selling fuel-wood to annual income, age,
education (male), hectares of land owned, total livestock owned, location in core or buffer.
Predictor variables Coefficient Std. Error Coeff./SE P Value
Constant 2.4026 0.86332 2.78 0.0054
Annual income -1.50E-05 7.79E-06 -1.92 0.0545
Age -0.0346 0.01483 -2.33 0.0196
Education male 0.00695 0.43585 0.02 0.9873
Land owned (hectare ) 0.38121 0.22857 1.67 0.0953
Total livestock -0.0305 0.03754 -0.81 0.4165
Location (core-buffer) -0.44264 0.5207 -0.85 0.3953
Distance to forest 0.01258 0.2218 0.06 0.9548
The only two variables that were significantly but negatively associated with the likelihood of
selling fuel-wood were income and age. This indicates that poorer and younger people were

8/13/2019 000 Distance All
http://slidepdf.com/reader/full/000-distance-all 9/26
R e s u l t s | 41
more likely to be wood sellers (Table 10). Variables such as male illiteracy (education male),
livestock owned, location in the core zone or buffer zone and distance to forest were not
associated with likelihood of selling wood (Table 10).
5.1.7 Resource collection
As mentioned in the earlier section, all the surveyed households collected resources from the
Similipal Tiger Reserve. Collection of fuel-wood from forests requires at least 2 to 4 hours of
work per day in the study areas. The villagers travel 0.5-3 km in the forest every day to
collect fuel-wood and fodder from the forest. Of the total households surveyed, all the
household collected wood for their own use and 82 household of the 143 collected fuel-wood
to sell in the market (Table 11). Our survey indicates that the households, who collected fuel-
wood for sale, collected about 1.6 times more wood than those that collected for their own
household use.
5.1.7.1 Harvesting pressure as a function of distance from the forest boundary
There was no significant correlation between village size and distance to forest boundary
indicating that village size was independent from access to the forest (r = 0.06, ns). There was
a no relationship between distance from the forest boundary and the number of households
collecting fuel-wood (r = 0.02, p = 0.08). There was no relationship between fodder
collection and distance to forest boundary (r = 0.13, ns). The proportion of fuel-wood
collectors was significantly negatively correlated with the village population size (r = 0.24, p
= 0.003) but fodder collectors were significantly positively correlated with village population
size (r = 0.31, p = 0.001). This finding suggests that as the village size increases, fuel-wood
collection decreases as a source of livelihood whereas the opposite is the case with fodder
collection, which increases with village size.

8/13/2019 000 Distance All
http://slidepdf.com/reader/full/000-distance-all 10/26
R e s u l t s | 42
Table 11: Proportion of resource harvesters in each village.
Village Totalhousehold
surveyed
Totalpopulation
Distance toforest
boundary
(km)
Forest fuel-wood collectors
for domestic use
(%)
Fuel-wood
sellers
(%)
Foddercollectors
(%)
Asanbani 2 7 2.5 2 (6) 0 0
Astakumar 9 63 0.3 9 (18) 4 (8) 2 (4)
Baghdega 3 17 0.3 3 (17) 1 (6) 0
Bakua 6 28 1 6 (15) 4 (10) 2 (5)
Balarampur 4 27 0.5 4 (6) 2 (3) 0
Bareipani 11 52 0.5 11(8) 7 (6) 5 (4)
Barignbada 3 17 1.5 3 (7) 2 (4) 0
Barsia 5 29 0.6 5 (7) 2 (3) 1 (1)
Benipur 5 32 2.8 5 (50) 2 (20) 0
Bhudabalanga 3 21 1.7 3 (10) 2 (7) 3 (10)
Gadasahi 2 22 2.5 2 (14) 2 (14) 0
Gadsimilipal 10 88 2 10 (18) 5 (9) 0
Gurguria 7 33 0.5 7 (5) 3 (2) 2 (2)
Jenabil 7 39 0.1 7 (28) 3 (12) 3 (12)
Kabataghai 29 29 0.75 5 (9) 4(7) 0
Kandibil 4 23 1.5 4 (5) 4 (5) 0
Kasira 3 18 0.5 3 (6) 3 (6) 1 (2)
Kolha 6 34 1.8 6(13) 2 (4) 3 (6)
Koljhari 3 20 1.2 3 (12) 1 (4) 2 (8)Kudaghuta 3 20 1.5 3 (12) 3 (12) 3 (12)
Kukurbuka 7 32 2.8 7 (13) 5 (9) 4 (7)
Kumari 8 34 1.3 8 (14) 5 (9) 3 (5)
Kusumi 4 23 1.2 4 (6) 4 (6) 1 (2)
Langighasara 3 12 1 3 (14) 3 (14) 0
Makabadi 4 21 1.8 4 (9) 1 (2) 0
Nawana 3 16 2.8 3 (5) 3 (5) 0
Nigirda 2 8 3 2 (13) 1 (7) 1 (7)
Saruda 5 35 0.2 5 (13) 5 (13) 2 (5)
Uski 3 17 0.5 3 (5) 1 (2) 0
Yamunagard 3 12 0.5 3 (17) 1 (6) 0
5.1.8 Economy of fuel-wood
All the surveyed household 143 collected wood for their own use and for sale. Of these 51
collected wood for their own use, and the total quantity collected was approximately 1500 kg
per week, 92 collected almost 9400 kg for sale and their own use per week. The households
that collected wood for sale collected 1.6 times quantity of those that collected only for their

8/13/2019 000 Distance All
http://slidepdf.com/reader/full/000-distance-all 11/26
R e s u l t s | 43
own use. The market value of the wood was Rs. 2 per kg and the market value of a head load
which approximately weighing 50-60 kg work out to be Rs.100-120, whereas it is sold by the
collectors for Rs. 50-60 (Table 12).
Table 12: Estimates of biomass collected from the forest and sold in market over a year.
Forest
product
collected
Total
harvesting
households
Total
biomass
collected
per day
(mean
±SD)
Economic
value at
market
value of Rs.
2 per kg
per day
Quantity
used for
domestic
purposes
(kg) per
day
Quantity
sold (kg)
per week
Economic
value at
sale value
(Rs 2 per
kg)
Fuel-wood 143 4.04±0.8 3284 582 6610 13220
Fodder 38 3.7 ± 1 0 0 0 0
8/13/2019 000 Distance All
http://slidepdf.com/reader/full/000-distance-all 12/26
R e s u l t s | 44
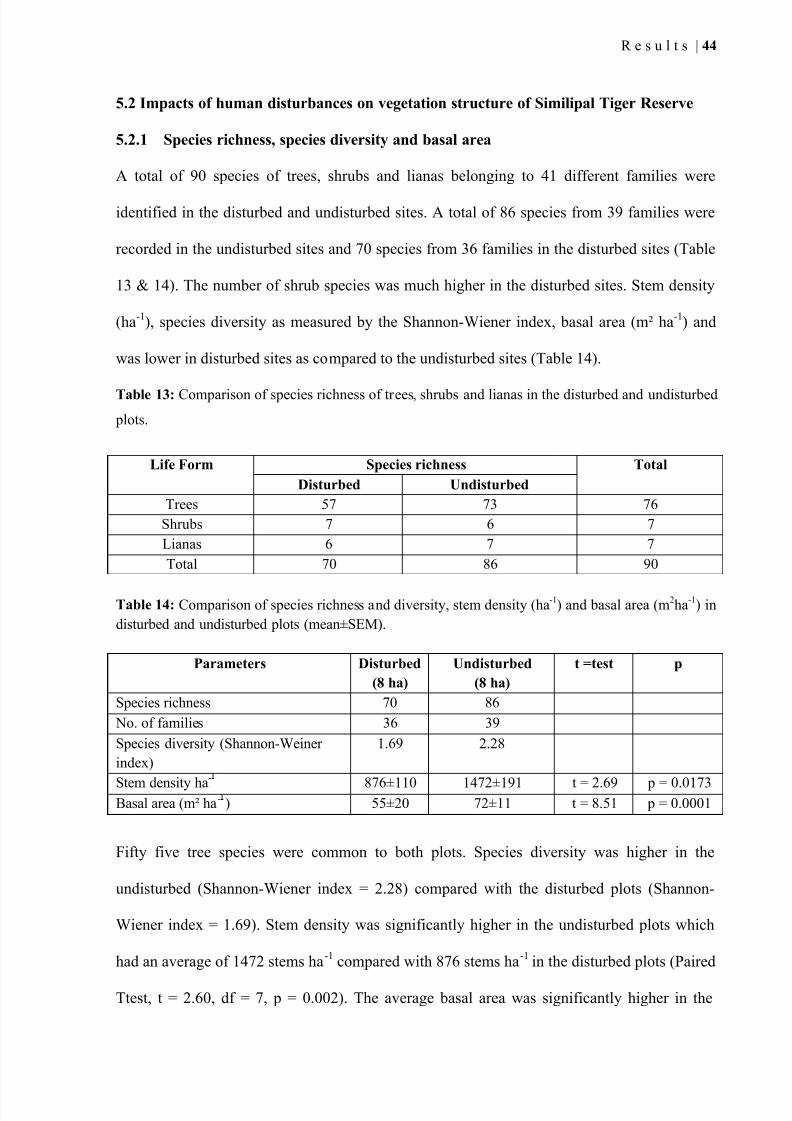
5.2 Impacts of human disturbances on vegetation structure of Similipal Tiger Reserve
5.2.1 Species richness, species diversity and basal area
A total of 90 species of trees, shrubs and lianas belonging to 41 different families were
identified in the disturbed and undisturbed sites. A total of 86 species from 39 families were
recorded in the undisturbed sites and 70 species from 36 families in the disturbed sites (Table
13 & 14). The number of shrub species was much higher in the disturbed sites. Stem density
(ha-1), species diversity as measured by the Shannon-Wiener index, basal area (m² ha-1) and
was lower in disturbed sites as compared to the undisturbed sites (Table 14).
Table 13: Comparison of species richness of trees, shrubs and lianas in the disturbed and undisturbed
plots.
Life Form Species richness Total
Disturbed Undisturbed
Trees 57 73 76
Shrubs 7 6 7
Lianas 6 7 7
Total 70 86 90
Table 14: Comparison of species richness and diversity, stem density (ha-1
) and basal area (m2ha
-1) in
disturbed and undisturbed plots (mean±SEM).
Parameters Disturbed
(8 ha)
Undisturbed
(8 ha)
t =test p
Species richness 70 86
No. of families 36 39
Species diversity (Shannon-Weiner
index)
1.69 2.28
Stem density ha-
876±110 1472±191 t = 2.69 p = 0.0173Basal area (m² ha- ) 55±20 72±11 t = 8.51 p = 0.0001
Fifty five tree species were common to both plots. Species diversity was higher in the
undisturbed (Shannon-Wiener index = 2.28) compared with the disturbed plots (Shannon-
Wiener index = 1.69). Stem density was significantly higher in the undisturbed plots which
had an average of 1472 stems ha-1
compared with 876 stems ha-1
in the disturbed plots (Paired
Ttest, t = 2.60, df = 7, p = 0.002). The average basal area was significantly higher in the

8/13/2019 000 Distance All
http://slidepdf.com/reader/full/000-distance-all 13/26
R e s u l t s | 45
undisturbed plots 71 m² ha-1
compared with 55 m² ha-1
in the disturbed plots (Paired T test =
8.29, df = 7, p < 0.0001) (Table 14). Twenty species recorded in undisturbed sites were not
recorded in the disturbed sites but 4 species recorded in the disturbed sites were absent in
undisturbed sites (Appendix 1).
The stem densities of different species varied among sites and in every site Shorea robusta
was dominant. Stem densities (Mann Whitney U test = 5.33, p = 0.02), and basal area (Mann
Whitney U test = 5.39, p = 0.02) were significantly higher in the core zone compared with the
buffer zone. Tree density and basal area in the disturbed sites was lower than in the
undisturbed sites (Table 15). This finding suggests that degradation is higher near the villages
where human impact is greater.
Table 15: Comparison of human impact in disturbed (D) and undisturbed (UD) plots in the eight sites.
Site Species richness Stem density ha-
Basal area (m ha-
)
D UD D UD D UD
Gurguria 18 23 635 778 20.25 33.52
Nawana 18 27 609 1300 22.76 47.14
Makabadi 16 22 652 760 25.99 45.7
Balarampr 17 25 528 1296 20.61 47.94
Bakua 22 36 1133 2048 48.62 81.59
Yamunagard 22 37 1116 2165 99.43 112.66
Kabataghi 20 28 955 1528 56.78 83.52
Jenabil 27 37 1380 1901 108.47 123.34
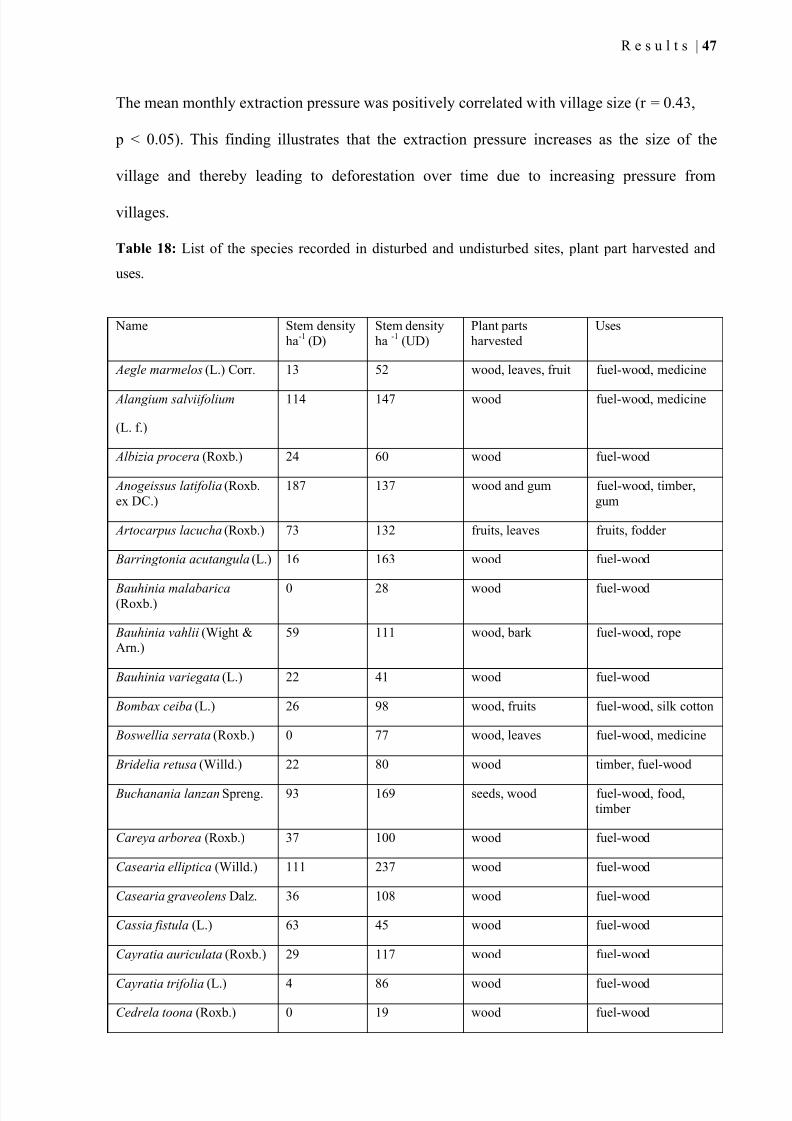
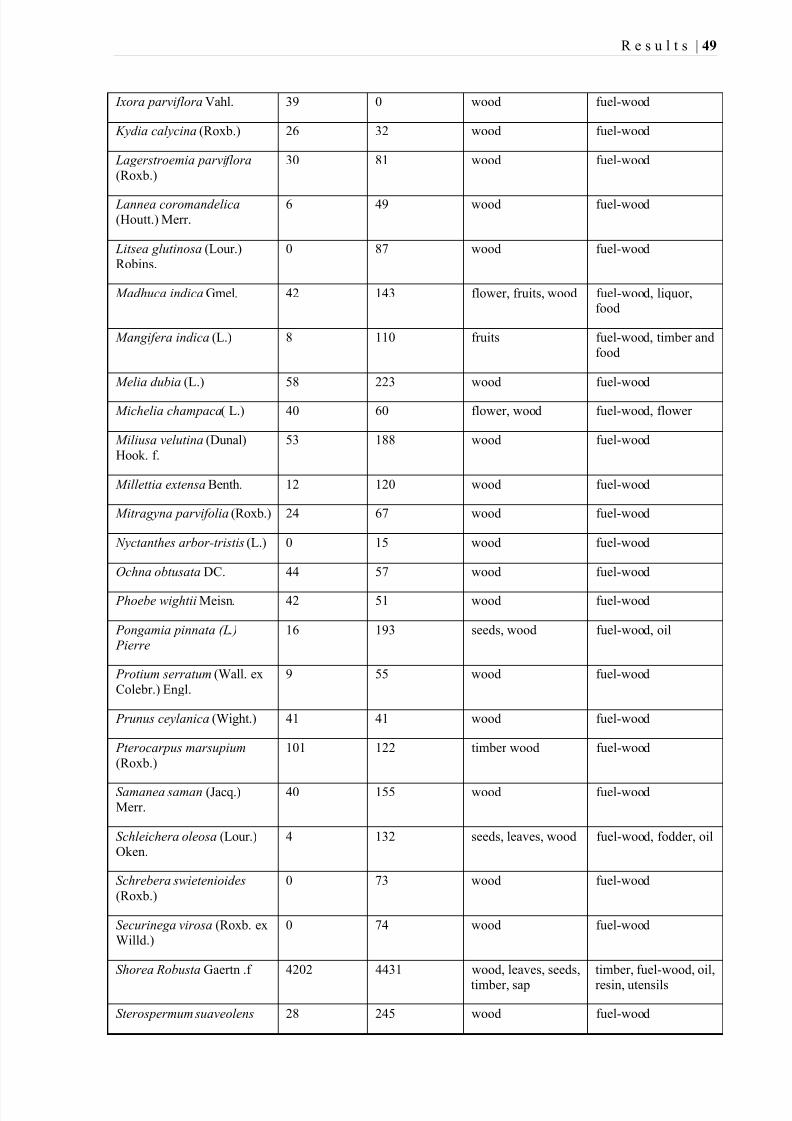
5.2.2 Uses of plant parts for different purposes
Out of 90 species recorded in study regions, 87 species were used for fuel-wood (Table 16).
Other products extracted were for food, base for country alcohol, resins, tendu leaves and
others. Some species like Shorea robusta, Madhuca indica, Bauhinia vahli yielded more than
one product: fuel-wood, resins, leaves, chew stick, rope and oil. Madhuca indica fruits were
used for making country liquor (Table 18).

8/13/2019 000 Distance All
http://slidepdf.com/reader/full/000-distance-all 14/26
R e s u l t s | 46
5.2.3 Extraction pressure of biomass
The mean monthly extraction pressure was 6%, and ranged from 1% in Jenabil to 11% in
Gurguria (Table 17). This shows that on average 6% of all trees had new cuttings every month
and most of the cases the whole plant was removed. The buffer zone villages like Gurguria,
Makabadi, Nawana and Balarampur had higher levels of extraction pressure than core areas
villages. There was significant difference in the mean monthly extraction pressure between
the core zone and buffer zone villages (Wilcoxon signed rank test: p < 0.02). The village size
was negatively correlated with stem densities of each plot (r = – 0.23, p < 0.05) indicating that
plots closer to larger villages have lower stem densities. This suggests that there is increasing
pressure on forests with increasing village size.
Table 16: Number of species harvested for different purposes by the local people.
Plant parts used Number of species Uses
Wood 87 Fuel-wood and implements
Fruit 10 Food
Seed 6 Oil and medicine
Leaves 3 Plates, fodder, mat, local beedi
Bark 3 Rope and medicine
Flower 4 food and medicine
Stem 4 chew stick and rope
Table 17: The mean monthly extraction pressure and total population of villages.
Village N Core/Buffer Stem density
(ha-1
)
Mean extraction pressure
(%)
Gurguria 547 Buffer 635 11.06 Nawana 216 Buffer 609 9.88
Makabadi 225 Buffer 652 10.4
Balarampur 226 Buffer 528 9.56
Bakua 259 Core 1133 1.99
Yamunagard 192 Core 1116 1.77
Kabatagai 187 Core 955 2.01
Jenabil 260 Core 1380 1.29
8/13/2019 000 Distance All
http://slidepdf.com/reader/full/000-distance-all 15/26
R e s u l t s | 47
The mean monthly extraction pressure was positively correlated with village size (r = 0.43,
p < 0.05). This finding illustrates that the extraction pressure increases as the size of the
village and thereby leading to deforestation over time due to increasing pressure from
villages.
Table 18: List of the species recorded in disturbed and undisturbed sites, plant part harvested and
uses.
Name Stem densityha
-1(D)
Stem densityha
-1 (UD)
Plant partsharvested
Uses
Aegle marmelos (L.) Corr . 13 52 wood, leaves, fruit fuel-wood, medicine
Alangium salviifolium
(L. f.)
114 147 wood fuel-wood, medicine
Albizia procera (Roxb.) 24 60 wood fuel-wood
Anogeissus latifolia (Roxb.
ex DC.)
187 137 wood and gum fuel-wood, timber,
gum
Artocarpus lacucha (Roxb.) 73 132 fruits, leaves fruits, fodder
Barringtonia acutangula (L.) 16 163 wood fuel-wood
Bauhinia malabarica(Roxb.)
0 28 wood fuel-wood
Bauhinia vahlii (Wight &Arn.)
59 111 wood, bark fuel-wood, rope
Bauhinia variegata (L.) 22 41 wood fuel-wood
Bombax ceiba (L.) 26 98 wood, fruits fuel-wood, silk cotton
Boswellia serrata (Roxb.) 0 77 wood, leaves fuel-wood, medicine
Bridelia retusa (Willd.) 22 80 wood timber, fuel-wood
Buchanania lanzan Spreng. 93 169 seeds, wood fuel-wood, food,timber
Careya arborea (Roxb.) 37 100 wood fuel-wood
Casearia elliptica (Willd.) 111 237 wood fuel-wood
Casearia graveolens Dalz. 36 108 wood fuel-wood
Cassia fistula (L.) 63 45 wood fuel-wood
Cayratia auriculata (Roxb.) 29 117 wood fuel-wood
Cayratia trifolia (L.) 4 86 wood fuel-wood
Cedrela toona (Roxb.) 0 19 wood fuel-wood

8/13/2019 000 Distance All
http://slidepdf.com/reader/full/000-distance-all 16/26
R e s u l t s | 48
Cleistanthus collinus (Roxb.) 27 81 wood fuel-wood
Cochlospermum religiosum(L.) Alston
0 36 wood fuel-wood
Crateva religiosa G. Forst. 0 59 wood fuel-wood
Croton roxburghii Balak. 42 102 wood fuel-wood
Dalbergia latifolia (Roxb.) 0 91 wood timber, fuel-wood
Dalbergia sisoo (Roxb.) 0 45 wood timber, Fuel-wood
Dillenia pentagyna (Roxb.) 211 181 seeds, wood fuel-wood, oil
Dioscorea spp. (L.) 0 13 tuber food
Diospyros malabarica(Desr.) Kostel.
0 12 wood fuel-wood
Diospyros melanoxylon(Roxb.)
14 28 leaves, fruits fuel-wood, tenduleaves, food
Diospyros montana (Roxb.) 21 0 wood fuel-wood
Phyllanthus emblica (L) 19 16 fruit medicine
Entada rheedii Spreng. 94 60 wood fuel-wood
Erythrina suberosa (Roxb.) 38 0 wood fuel-wood
Euonymus glaber (Roxb.) 11 53 wood fuel-wood
Ficus benghalensis (L.) 0 2 wood fuel-wood
Ficus hispida L. f. 3 81 wood fuel-wood
Ficus religiosa (L.) 1 15 wood fuel-wood
Gardenia gummifera L. f. 0 32 wood fuel-wood
Garuga pinnata (Roxb.) 5 32 wood fuel-wood
Glochidion lanceolarium(Roxb.)
49 125 wood fuel-wood
Glycosmis pentaphylla
(Retz.)
48 130 wood fuel-wood
Gmelina arborea (Roxb.) 0 48 wood fuel-wood, timber
Gnetum ula Brongn. 2 0 wood fuel-wood
Haldina cordifolia (Roxb.) 9 41 wood fuel-wood
Homalium nepalens Benth. 48 83 wood fuel-wood
Hymenodictyon excelsum
(Roxb.)
0 25 wood fuel-wood
Hyptianther asticta Willd. 23 29 wood fuel-wood
Indigofera cassioides DC. 16 5 wood, flowers fuel-wood
8/13/2019 000 Distance All
http://slidepdf.com/reader/full/000-distance-all 17/26
R e s u l t s | 49
Ixora parviflora Vahl. 39 0 wood fuel-wood
Kydia calycina (Roxb.) 26 32 wood fuel-wood
Lagerstroemia parviflora
(Roxb.)
30 81 wood fuel-wood
Lannea coromandelica(Houtt.) Merr.
6 49 wood fuel-wood
Litsea glutinosa (Lour.)Robins.
0 87 wood fuel-wood
Madhuca indica Gmel. 42 143 flower, fruits, wood fuel-wood, liquor,food
Mangifera indica (L.) 8 110 fruits fuel-wood, timber andfood
Melia dubia (L.) 58 223 wood fuel-wood
Michelia champaca( L.) 40 60 flower, wood fuel-wood, flower
Miliusa velutina (Dunal)
Hook. f.
53 188 wood fuel-wood
Millettia extensa Benth. 12 120 wood fuel-wood
Mitragyna parvifolia (Roxb.) 24 67 wood fuel-wood
Nyctanthes arbor-tristis (L.) 0 15 wood fuel-wood
Ochna obtusata DC. 44 57 wood fuel-wood
Phoebe wightii Meisn. 42 51 wood fuel-wood
Pongamia pinnata (L.) Pierre
16 193 seeds, wood fuel-wood, oil
Protium serratum (Wall. ex
Colebr.) Engl.
9 55 wood fuel-wood
Prunus ceylanica (Wight.) 41 41 wood fuel-wood
Pterocarpus marsupium
(Roxb.)
101 122 timber wood fuel-wood
Samanea saman (Jacq.)Merr.
40 155 wood fuel-wood
Schleichera oleosa (Lour.)Oken.
4 132 seeds, leaves, wood fuel-wood, fodder, oil
Schrebera swietenioides
(Roxb.)
0 73 wood fuel-wood
Securinega virosa (Roxb. exWilld.)
0 74 wood fuel-wood
Shorea Robusta Gaertn .f 4202 4431 wood, leaves, seeds,
timber, sap
timber, fuel-wood, oil,
resin, utensils
Sterospermum suaveolens 28 245 wood fuel-wood

8/13/2019 000 Distance All
http://slidepdf.com/reader/full/000-distance-all 18/26
R e s u l t s | 50
(Roxb.)
Suregada angustifolia.(Baill.)
28 126 wood fuel-wood
Symplocos cochinchinensis
(Lour.)
0 65 wood fuel-wood
Syzygium cerasoides (Roxb.) 8 37 fruits, wood fuel-wood, food,
timber
Syzygium cumini (L.) Skeels 114 120 fruits, leaves fuel-wood, food,fodder
Terminalia arjuna (L.) 107 278 fruits fuel-wood
Terminalia bellirica (L.) 45 128 fruits fuel-wood
Terminalia chebula (L.) 55 36 fruits fuel-wood
Terminalia tomentosa(Roxb.)
107 236 wood fuel-wood, timber
Toona ciliata Roem. 0 29 wood fuel-wood
Trewia nudiflora (L.) 6 129 wood fuel-wood
Vitex leucoxylon (L.) 12 169 wood fuel-wood
Wendlandia exerta (Roxb.) 42 19 wood fuel-wood
Wendlandia tinctoria(Roxb.)
0 37 wood fuel-wood
Xylia xylocarpa (Roxb.) 5 82 wood fuel-wood
Ziziphus rugosa Lam. 2 28 wood fuel-wood
Zizyphus zujuba Lam. 2 21 fruit fuel-wood, food
8/13/2019 000 Distance All
http://slidepdf.com/reader/full/000-distance-all 19/26
R e s u l t s | 51
5.3 Attitude of local people towards conservation of wild life in Similipal Tiger Reserve
The previous chapters provided information on the socio-economic activities of the
households and their dependence on the forests for fuel-wood and fodder, and their impact on
the forest. Therefore, it is essential to empower local people to manage natural resources,
however, without information on the relationship between the protected area and local
communities, designing a management plan would be difficult.
5.3.1 Socio-economic profile
In the survey of attitudes towards Similipal Tiger Reserve, there were 116 younger people, 79
middle aged and 22 elder people in the database, the majority of whom (79%) were primarily
agriculturists (Table 19). Daily wage workers were relatively fewer (12%). Very few of the
respondents were employed by the Forest Department (Table 19). All the respondents were
residents and their ancestors had resided in the villages for generations. A total of 146 of the
respondents were men and 71 were women. The majority (190) was from buffer zone
villages, and 27 were from the core zone.
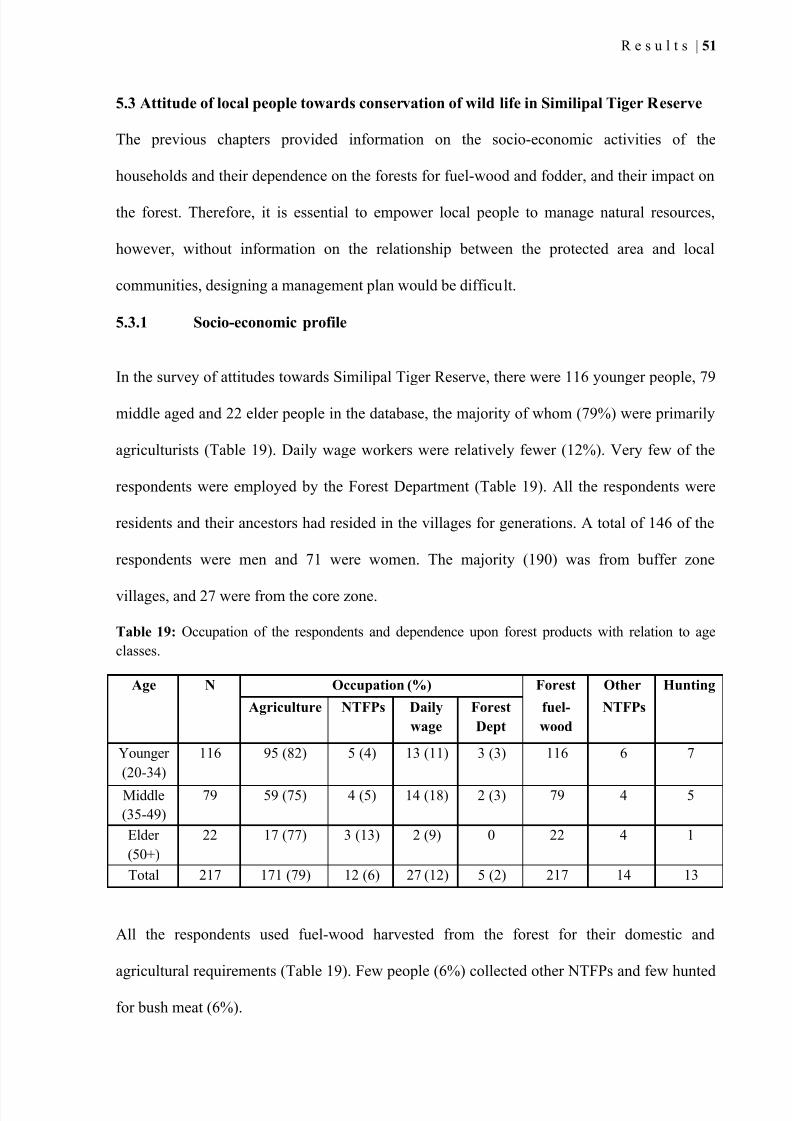
Table 19: Occupation of the respondents and dependence upon forest products with relation to age
classes.
Age N Occupation (%) Forest Other Hunting
Agriculture NTFPs Daily
wage
Forest
Dept
fuel-
wood
NTFPs
Younger
(20-34)
116 95 (82) 5 (4) 13 (11) 3 (3) 116 6 7
Middle
(35-49)
79 59 (75) 4 (5) 14 (18) 2 (3) 79 4 5
Elder
(50+)
22 17 (77) 3 (13) 2 (9) 0 22 4 1
Total 217 171 (79) 12 (6) 27 (12) 5 (2) 217 14 13
All the respondents used fuel-wood harvested from the forest for their domestic and
agricultural requirements (Table 19). Few people (6%) collected other NTFPs and few hunted
for bush meat (6%).

8/13/2019 000 Distance All
http://slidepdf.com/reader/full/000-distance-all 20/26
R e s u l t s | 52
A little over half (53%) the respondents supported protection of nature because it was a
common heritage of the people (Table 20). The rest opposed the protected area: among those
that opposed the protected area, the majority (42%) opposed it, because, it was imposed on
them. Very few (4%) thought it was a waste of money which could be better spent on helping
the poor (Table 20). There was no significant difference among the age classes in terms of
support or lack of support of the protected area and conservation (2 = 0.40, df = 2, ns).
Table 20: Local support for conservation among the respondents.
Age N Support (%) No support (%)
Common
heritage
Money better
used for poverty
alleviation
Conservation
imposed
Younger (20-34) 116 64 (55) 4 (4) 48 (41)
Middle (35-49) 79 40 (51) 4 (5) 35 (44)
Elder (50+) 22 12 (55) 1 (5) 9 (41)
Total 217 116 (53) 9 (4) 92 (42)
Conservation measures imposed a cost on the local communities because they lose access to
forest resources upon which they depend for household requirements. Therefore, they were
asked whether they were willing to bear the cost in terms of loss of resources. The support of
the respondents for conservation was contingent upon limited (28%) or no costs (80%) (Table
21). Very few (5%) were agreeable to bearing a cost. There was no significant difference in
the willingness to accept costs for conservation between the different age categories (2 =
4.52, df = 2, ns), different occupation/economic activities (2 = 0.17, df = 2, ns), and between
respondents in the core and buffer zones (Fisher’s exact test = 0.442, ns).
About 64% of the respondents preferred the PA to be managed by local communities, and
only 9% were in favour of management by the Forest Department. About 28% did not want
the protected area at all (Table 21). There was no significant difference between young and
middle aged people with regard to opinion management of PA’s (2 = 0.08, df = 1, ns). The
elderly people were completely against management by the Forest Department.

8/13/2019 000 Distance All
http://slidepdf.com/reader/full/000-distance-all 21/26
R e s u l t s | 53
Table 21: Local opinion about conservation cost to be borne by local communities and the
management of the protected area.
Age N Conservation cost Management
(%)At no cost Little cost Cost
acceptable
FD Local
Community
No PA
Younger (20-34) 116 95 (82) 15 (13) 6 (5) 11 (9) 82 (45) 23 (20)
Middle (35-49) 79 64 (81) 12 (10) 3 (4) 8 (10) 52 (66) 19 (24)
Elder (50+) 22 14 (64) 6 (5) 2 (9) 0 4 (18) 18 (84)
Total 217 173 (80) 33 (28) 11 (5) 19 (9) 138 (64) 60 (28)
Women were less in favour of the Similipal PA (49%) than men (36%) although this was not
significant (2 = 2.40, df = 1, ns). Among those that favoured the PA, the large majority
wanted it to be a community managed than by the Forest Department, although a higher
proportion of men supported management of the PA by the Forest Department (Table 22).
Overall there were no significant differences between men and women for support/opposition
to PA.
Table 22: Gender and support for the protected area and its management.
Gender N Favour PA (%) Opposed to PA
(%)Local community
decision
Forest Department
decision
Male 147 21 (36) 17 (28) 21 (36)
Female 70 39 (49) 2 (2) 39 (49)
5.3.2 Perceptions of species decline
People who supported conservation as a common heritage of the country were more likely to
perceive a decline of the tiger (Wilcoxon Signed Rank Test = 2.911, p = 0.004), less likely to
perceive the decline of the elephant (Wilcoxon Signed Rank Test = -2.11, p = 0.035), and more
likely to see the disappearance of trees (Wilcoxon Signed Rank Test = 5.98, p < 0.0001). This
suggests that conservation attitudes and perception of decline supported the hypotheses in two
cases but not in the case of elephants.

8/13/2019 000 Distance All
http://slidepdf.com/reader/full/000-distance-all 22/26
R e s u l t s | 54
Local people of all age classes perceived that both the tiger and the Asian elephant had
declined over time (Table 23, Fig. 9-10). In all 90% of the respondents agreed that the tiger
and the elephant had disappeared (Table 24-25). The recollections of tiger sightings per
annum were significantly higher 20 and 10 years ago than at present, with only 20% not
having seen any tiger 20 years ago, whereas presently 92% had not sighted a tiger presently
(2 = 128.8, df = 2, p < 0.0001, Table 24, Fig.9).
Table 23: Mean annual tiger and elephant sightings as recollected by respondents .
0
10
20
30
40
50
60
70
80
90
100
20 years 10 years now
% o
f r e s p o n d e n t s
Past to present sightings
% annual tiger sightings
0
1 to 4
5+
Figure 9: Recollections of annual tiger sightings over the years. Blue= no sightings, red=1-4 tigers per
year and green= over 5 tigers per year.
The distribution of tiger sightings differed significantly between 20 years and present
(Kolgomorov Smirnov = 0.95, p < 0.0001), but did not differ significantly between 10 years
and present (Kolgomorov Smirnov = 0.52, ns), indicating that the decline had taken place
Tiger
sightings
Annual sightings
(Mean ± SD)
Elephant
sightings
Annual sightings
(Mean ± SD)
20 years ago 0.38 ± 0.9 20 years ago 1.8± 3
10 years ago 0.22 ± 0.8 10 years ago 0.8 ± 1
Now 0.1 ± 0.4 Now 0.4 ± 0.8
8/13/2019 000 Distance All
http://slidepdf.com/reader/full/000-distance-all 23/26
R e s u l t s | 55
over 10 years ago. Comparison of 0 and 1-4 categories of tiger sightings over different time
periods using 2 test (2 = 128.8, df = 2, p < 0.0001).
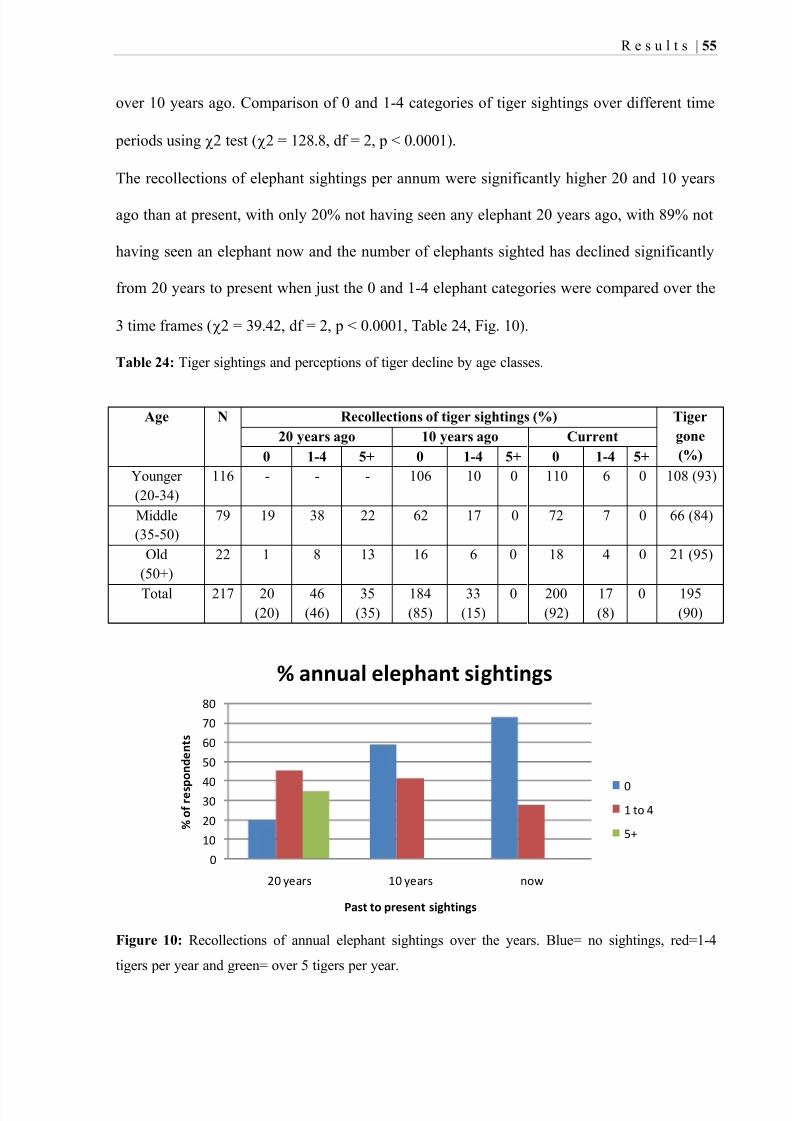
The recollections of elephant sightings per annum were significantly higher 20 and 10 years
ago than at present, with only 20% not having seen any elephant 20 years ago, with 89% not
having seen an elephant now and the number of elephants sighted has declined significantly
from 20 years to present when just the 0 and 1-4 elephant categories were compared over the
3 time frames (2 = 39.42, df = 2, p < 0.0001, Table 24, Fig. 10).
Table 24: Tiger sightings and perceptions of tiger decline by age classes.
Age N Recollections of tiger sightings (%) Tiger
gone
(%)
20 years ago 10 years ago Current
0 1-4 5+ 0 1-4 5+ 0 1-4 5+
Younger
(20-34)
116 - - - 106 10 0 110 6 0 108 (93)
Middle
(35-50)
79 19 38 22 62 17 0 72 7 0 66 (84)
Old
(50+)
22 1 8 13 16 6 0 18 4 0 21 (95)
Total 217 20
(20)
46
(46)
35
(35)
184
(85)
33
(15)
0 200
(92)
17
(8)
0 195
(90)
0
10
20
3040
50
60
70
80
20 years 10 years now
% o
f r e s p o n d e n t s
Past to present sightings
% annual elephant sightings
0
1 to 4
5+
Figure 10: Recollections of annual elephant sightings over the years. Blue= no sightings, red=1-4
tigers per year and green= over 5 tigers per year.

8/13/2019 000 Distance All
http://slidepdf.com/reader/full/000-distance-all 24/26
R e s u l t s | 56
The distribution of elephant sightings differed significantly between 20 years and present
(Kolgomorov Smirnov = 0.94, p < 0.0001), and between 10 years and present (Kolgomorov
Smirnov = 0.71, ns), suggesting that elephant decline has been going on since 20 years.
Table 25: Annual sightings of elephants as remembered by the local respondents.
Age N Recollections of elephant sightings (%) Elephant
gone
(%)
20 years ago 10 years ago Current
0 1-4 5+ 0 1-4 5+ 0 1-4 5+
Younger
(20-34)
116 - - - 99 17 0 101 15 0 108 (93)
Middle
(35-50)
79 19 38 22 17 62 0 75 4 0 66 (84)
Old
(50+)
22 1 8 13 11 11 0 18 4 0 21 (95)
Total 20
(20)
46
(46)
35
(35)
127
(59)
90
(41)
0 194
(89)
23
(11)
0 195
(90)
Twenty years ago there were significant differences in the mean numbers of tigers sighted in
the core zone as compared with the buffer zone with the numbers in the core zone being
higher (Table 26), whereas presently core zone sightings had declined to levels in the buffer
zone (Table 26).
Table 26: Mean annual tiger and elephant sightings 20 years and at present in the core and buffer
zones
Species/time frame Mean annual sightings
Core
(N=27)
Buffer
(N=190)
T test df p
Tiger 20 years ago 1.407± 1.5 0.237±0.699 -6.79 215 <0.0001
Tiger Now 0.85±0.36 0.78±0.41 -0.81 215 ns
Elephant 20 years ago 2.82± 3.35 1.62±2.68 -2.11 215 0.04
Elephant Now 0 0.05±0.21
The mean annual sightings of elephants were significantly higher in the core zone as
compared with the buffer zone 20 years ago; however, the respondents had not sighted any
elephants currently in the core zone and the sightings had declined in the buffer zone (Table
26).

8/13/2019 000 Distance All
http://slidepdf.com/reader/full/000-distance-all 25/26
R e s u l t s | 57
5.3.3 Hunting
The middle aged and older local respondents who were former or current hunters also
recollected that hunting was relatively easy 20 years ago, and fewer agreed that it was easy 10
years ago and no one agreed that hunting was currently easy. This indicates a decline in the
prey base (Table 27).
Table 27: Number of hunters of different age classes over a 20 year period .
Age N Currently
Hunters
Easy Hunting
20 years ago 10 years ago now
Younger (20-34) 116 7 - 1 0
Middle (35-50) 79 5 18 4 0Old (50+) 22 1 10 4 0
5.3.4 Disappearance of the forest
The disappearance of trees appears to be more recent as per the recollections of the local
people. All the elderly people and a high proportion of the middle aged people recollected that
there were more trees and larger trees 20 years ago. The opinions of the different age classes
significantly differed (2 = 85.49, df = 2, p < 0.0001, Table 28). About 95% of the younger
respondents considered that there were more trees now, whereas only 32% and 2% of the
middle aged and elderly respectively considered there were more trees now (Table 28). When
comparing younger and middle aged people, the opinion of the middle aged significantly
differed from that of the young (2 = 72.6, df = 2, p < 0.0001).
Tree size appears to have declined more rapidly than numbers (2 = 7.49, df = 2, p = 0.02)
according to local perceptions, since all the elderly respondents agreed that trees were more
abundant and larger 20 years ago, whereas 89% and 76 % of the middle aged agreed to the
same statement. Similarly all elderly respondents agreed that trees were more abundant and
larger 10 years ago, whereas 94% and 71% of the middle aged agreed to the same statement.

8/13/2019 000 Distance All
http://slidepdf.com/reader/full/000-distance-all 26/26
R e s u l t s | 58
The views of the young differed probably because they were still too young to recollect the
loss of trees (Table 28).
Table 28: The perceptions of tree abundance and size over different time periods amongdifferent age classes.
Age N Tree abundance and size (%)
20 years ago 10 years ago Now
More
trees
Bigger
trees
More
trees
Bigger
trees
More
trees
Bigger
trees
Younger
(20-34)
116 19 (16) 6 (5) 65(56) 108 (93) 110 (95) 50 (43)
Middle
(35-50)
79 60 (76) 70 (89) 74 (94) 56 (71) 25 (32) 0
Old
(50+)
22 22 (100) 22 (100) 22 (100) 8 (36) 2 (9) 0
There were significant differences between perceptions of higher tree abundance in the core
zone as compared with the buffer zone 20 years ago and at present (Table 29), however, the
perceptions of larger trees during the same time frame, did not significantly differ (Table 29).
Table 29: Comparison of perceptions of greater tree abundance and size between core and buffer zone
20 years ago and at present.
Category Core
(N=27)
Buffer
(N=189)
T test df P
Tree abundance
20 years ago 0.481±0.51 1.418±2.66 1.82 201 0.07
Now 0.48±0.89 0.05±0.24 -5.53 215 <0.0001
Tree size
20 years ago 0.56±0.51 0.44±0.50 -1.16 215 ns
Now 0.22±42 0.23±42 0.05 215 ns


![arXiv:1411.1094v2 [astro-ph.CO] 7 Feb 2015 · Mon. Not. R. Astron. Soc. 000, 000{000 (0000) Printed 10 February 2015 (MN LATEX style le v2.2) Calibrating the cosmic distance scale](https://static.fdocuments.in/doc/165x107/60377082d7de4e1d9205b6f3/arxiv14111094v2-astro-phco-7-feb-2015-mon-not-r-astron-soc-000-000000.jpg)